HOUSEHOLD LIFE CYCLE AND SINGLE FAMILY DWELLING EXPANSION: CASE STUDY IN AN INNER SUBURBAN MUNICIPALITY, BURNABY, BRITISH COLUMBIA Kl MBERLY ANNE ALEXIS B. A. (Honors) Trinity Western University, 1987 THESIS SUBMITTED IN PARTIAL FULFILLMENT OF THE REQUIREMENTS FOR THE DEGREE OF MASTER OF ARTS in the ,Faculty .-- Geography O Kimberly Anne Alexis 1991 SIMON FRASER UNIVERSITY AUGUST 1991 All rights reserved. This work may not be reproduced in whole or in part, by photocopy or other means, without permission of the author.
Transcript
HOUSEHOLD LIFE CYCLE AND SINGLE FAMILY DWELLING EXPANSION:
CASE STUDY IN AN INNER SUBURBAN MUNICIPALITY,
BURNABY, BRITISH COLUMBIA
Kl MBERLY ANNE ALEXIS
B. A. (Honors) Trinity Western University, 1987
THESIS SUBMITTED IN PARTIAL FULFILLMENT OF
THE REQUIREMENTS FOR THE DEGREE OF
MASTER OF ARTS
in the ,Faculty .--
Geography
O Kimberly Anne Alexis 1991
SIMON FRASER UNIVERSITY
AUGUST 1991
All rights reserved. This work may not be reproduced in whole or in part, by photocopy
or other means, without permission of the author.
APPROVAL
Name:
Degree:
Title of Thesis:
Kimberly Anne Alexis
Master of Arts
Household Life Cycle and Single Family Dwelling Expansion: Case Study in an Inner Suburban Municipality, Burnaby, British Columbia
Examining Committee:
Chair: A. MacPherson, Professor Emeritus
L.$. $benden Associate Professor Senior Supervisor
- R.B. ~ o r s f a p Assistant Professor
V. Strong-Boag Director Centre For Research In Women's Studies
and Gender Relations University of British Columbia
Date Approved:
PARTIAL COPYRIGHT LICENSE
I hereby grant t o Simon Fraser U n i v e r s i t y the r i g h t t o lend
my thes i s , p r o j e c t o r extended essay ( the t i t l e o f which i s shown below)
t o users o f the Simon Fraser U n i v e r s i t y L ib ra ry , and t o make p a r t i a l o r
s i n g l e copies on ly f o r such users o r i n response t o a request from the
l i b r a r y o f any o ther u n i v e r s i t y , o r o ther educational i n s t i t u t i o n , on
i t s own beha l f o r f o r one o f i t s users. I f u r t h e r agree t h a t permission
f o r m u l t i p l e copying o f t h i s work f o r scho la r l y purposes may be granted
by me o r the Dean o f Graduate Studies. I t i s understood t h a t copying
o r p u b l i c a t i o n o f t h i s work f o r f i n a n c i a l gain s h a l l no t be al lowed
wi thout my w r i t t e n permission.
T i t l e o f Thesis/Project/Extended Essay
Household Life Cycle and Single Family Dwelling
Expansion: Case Study in an Inner Suburban Municipality,
Burnabv. British Columbia
Author: I
(s ignature)
Kimberly Anne Alexis
(name)
August 9, 1991
(date)
ABSTRACT
This study enquires into the relationship between changes in
the household life cycle stages and additions of enclosed, heated,
living space in the detached, single family dwelling. Adding living
space to dwellings represents one option among three, the others
being a move to a different house in a different location, or inaction.
Constraining factors include cost, municipal regulations and
location, while pressures to expand living space are experienced
differently at different points in the household life cycle.
The approach taken is jointly morphological and behavioral.
Physical expansions were analyzed, based on data collected for 232
houses, representing a 20% random sample of all housing additions
in Burnaby between 1980 and 1985. Households were sent a
questionnaire, and the behavioral analysis and life cycle
categorizations were based on information from 105 returns. Life
cycle stages were analyzed in two basic groups, those households
with children and those without. Supplementary information came
from in-depth interviews of a small selection of cases.
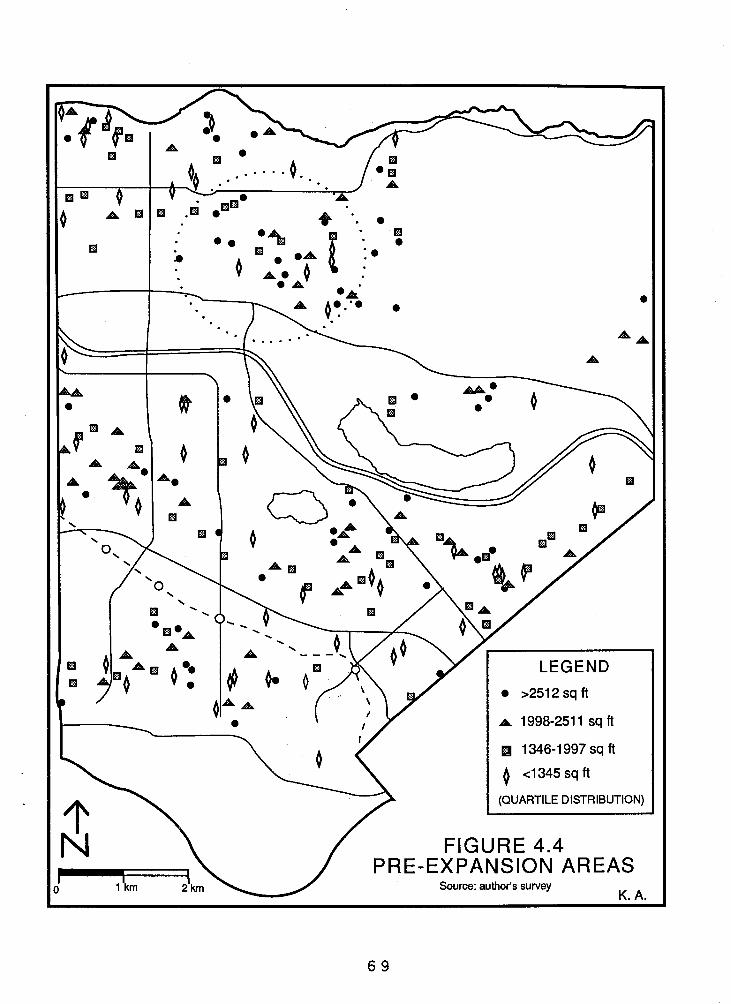
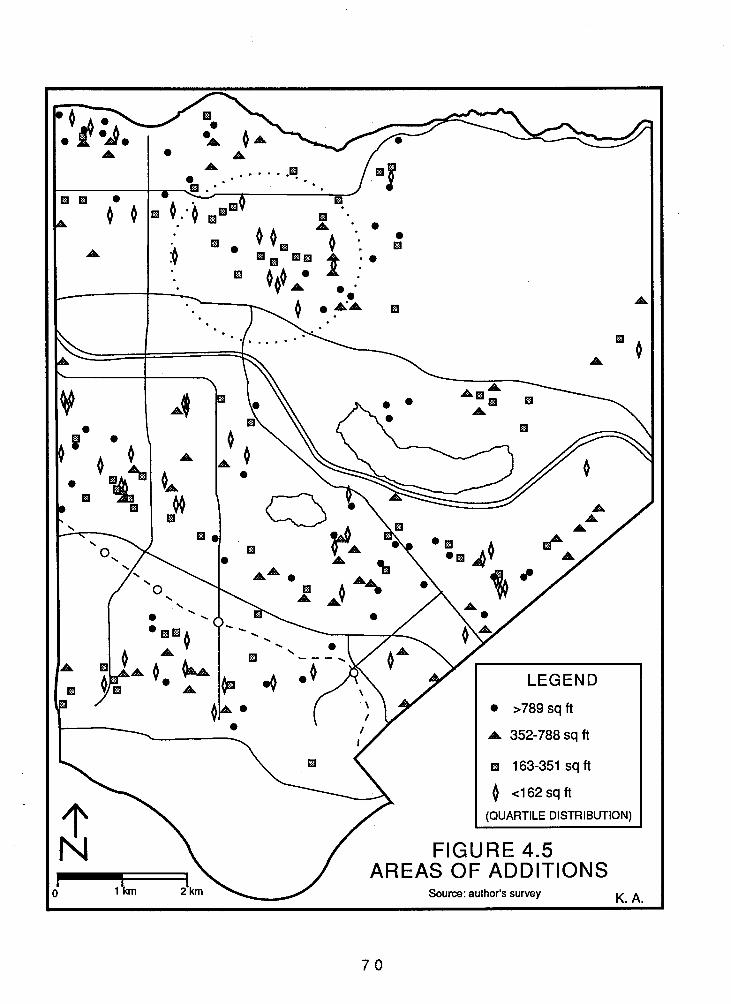
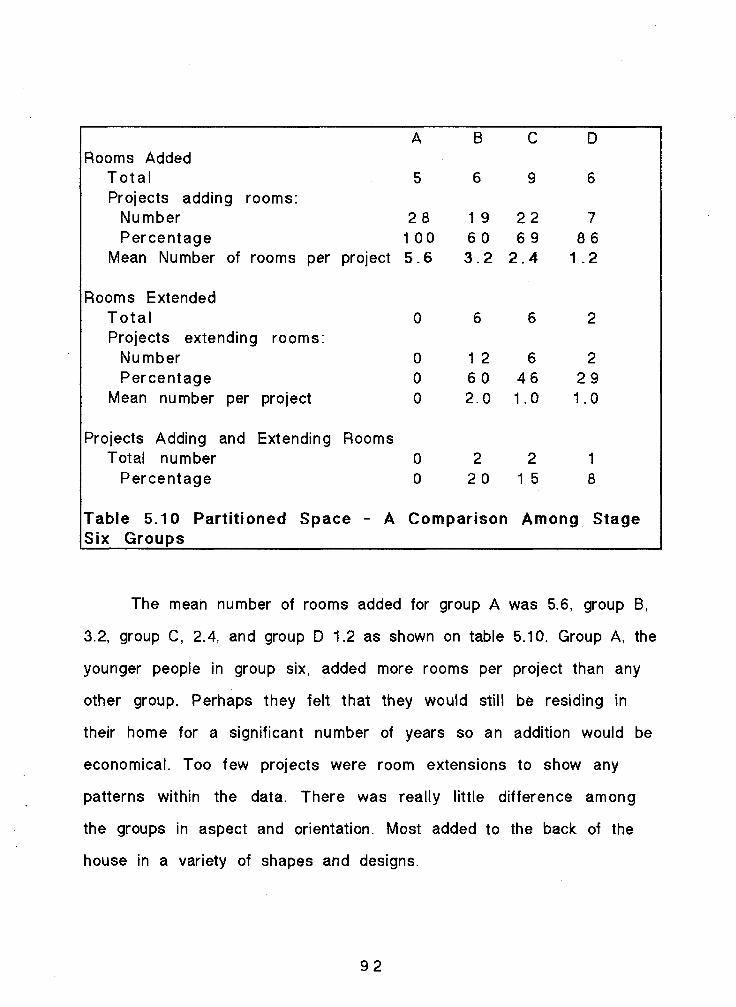
The results showed that, for aggregate space, the mean pre-
expansion size of sampled dwellings was just over 2000 square feet
while the mean addition area was 550 square feet. Households with
children lived in bigger pre-expansion houses and made larger
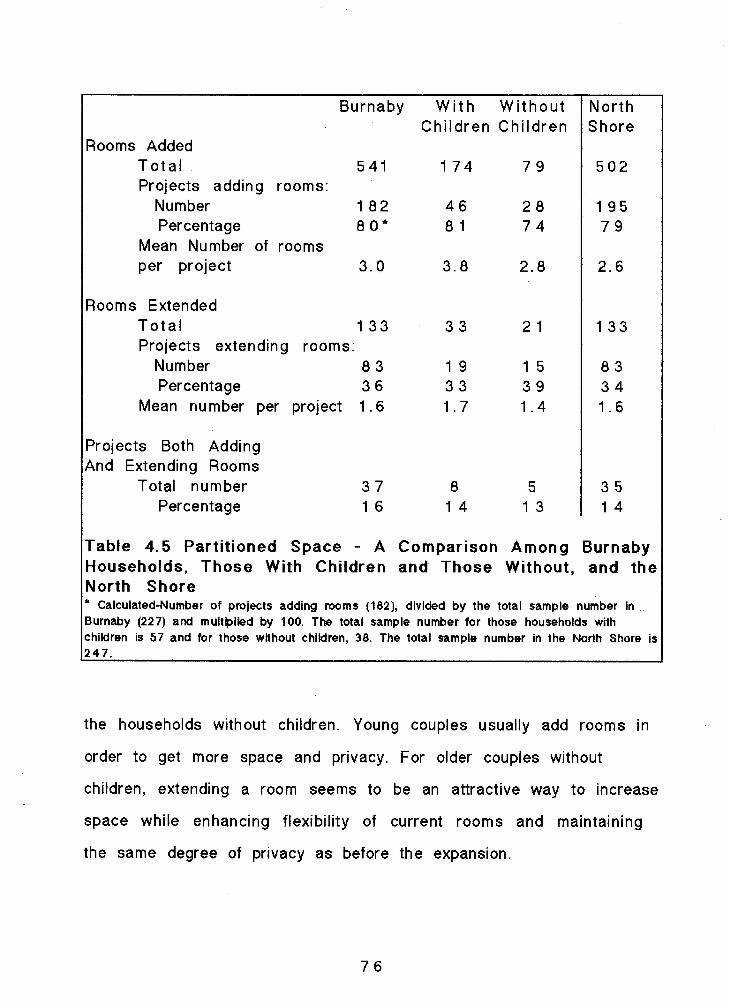
additions than did households without children. As for partitioned
space, households with children added or extended more rooms per
project than did households without. Most expansions were built to
provide bedrooms, family rooms and bathrooms. Variations among
households included those without children living in their houses ten
years longer, on average, befare beginning the addition than
households with children. While motives for this building activity
are complex, subregional patterns of construction tend to emerge
within the municipality. The study shows that patterns of dwelling
modification are clearly related to life cycle stages of households,
at both individual and general levels of analysis. Additions to houses
already built constitute a substantial proportion of all new living
space created in the area during the period of study.
ACKNOWLEDGEMENTS
This thesis was made possible through the financial support of
the Okanagan Indian Band and moral support of the office staff.
My sincere thanks go to Len Evenden, my senior supervisor, for
all his patience, guidance and support over the many months to
complete this thesis. Special thanks also to Bob Morsfall for his
support and comments on this endeavor.
Thanks to all my office mates and good friends who were there
to hear the complaints and successes and who always had a helpful
suggestion and listening ear (or growling stomach.)
Last, but not least, special thanks to my family, John, my
husband for lots of encouragement over the last three years, Orion
and Seth, who only know what it's like to have a mommy in school
(but put up with me anyway), and to my mom and dad for long hours
of childcare and moral support. Without all of these people this
project would not have been possible.
TABLE OF CONTENTS
APPROVAL
ABSTRACT
ACKNOWLEDGEMENTS
TABLE OF CONTENTS
LlST OF TABLES
LlST OF FIGURES
CHAPTERS 1 INTRODUCTION
I. DEFINITIONS
2 LITERATURE REVIEW
I. THE FORM OF A CITY A. Ground Plan B. Land Use Framework C. The Residential Built Environment
II. DECISION MAKING MODEL A. MobilitytMigration
B. In Situ Adjustment - Addition to the Dwelling Ill. SUMMARY
3 GEOGRAPHIC DEVELOPMENT OF BURNABY 1. 1858 - 1900 THE PIONEERING YEARS 11. 1901 - 1920 GROWTH AND STABILIZATION Il l . 1921 - 1945 DIVERSIFICATION IV. 1946 - 1990 SUBURBANIZATION
A. Population
B. Development Planning and Zoning
PAGE
i i
i i i
v
v i
i x
x i
1
3
7
7
8
8
1 0
1 4
1 4
2 1
2 8
3 0
3 3
3 6
3 8
3 9
4 0
4 4
TABLE OF CONTENTS CONTINUED PAGE
MORPHOLOGICAL CHARACTERISTICS OF EXPANSIONS I. METHODS
A. Building Permits B. Questionnaire C. North Shore D. Rationale Behind Variables
II. RESULTS A. House and Expansion Site B. Aggregate Space C. Partitioned Space D. Functional Space
5 BEHAVIORAL CHARACTERISTICS OF HOUSEHOLDS 8 1 I. A CLOSER LOOK AT STAGE SIX 9 0
6 CASE STUDIES I. CASE STUDY #1
II. CASE STUDY #2 Ill. CASE STUDY #3 IV. CASE STUDY #4
7 CONCLUSION 1 1 1
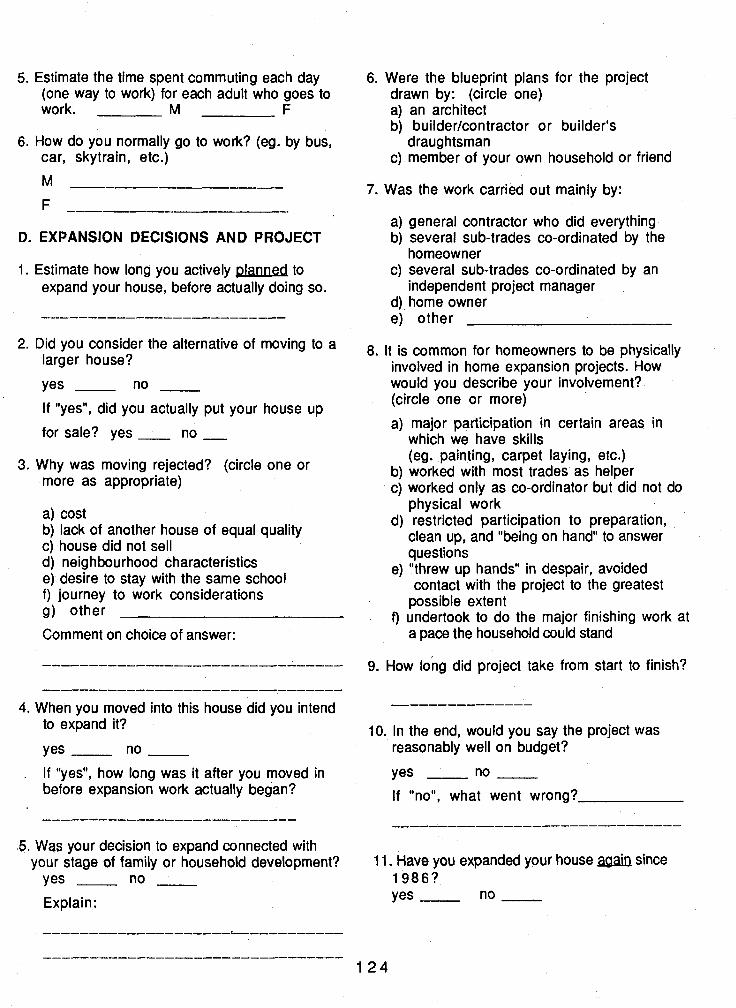
APPENDICES A. SURVEY FORMS AND CORRESPONDENCE
1. house characteristics recording form 2. coding sheet 3. letters 4. questionnaire
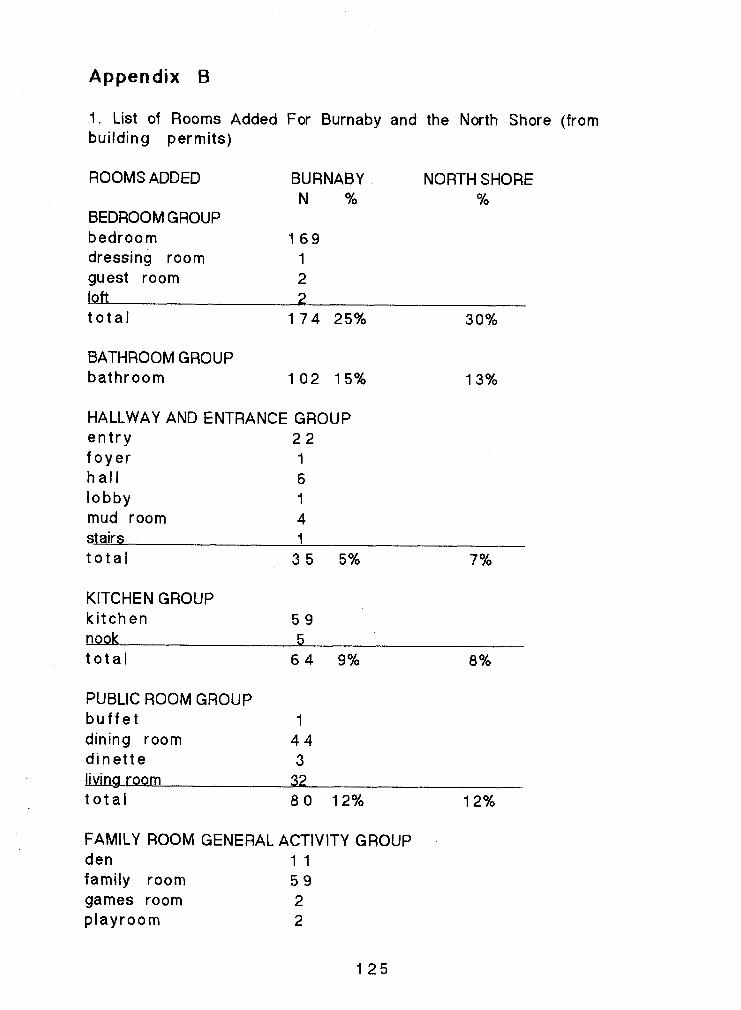
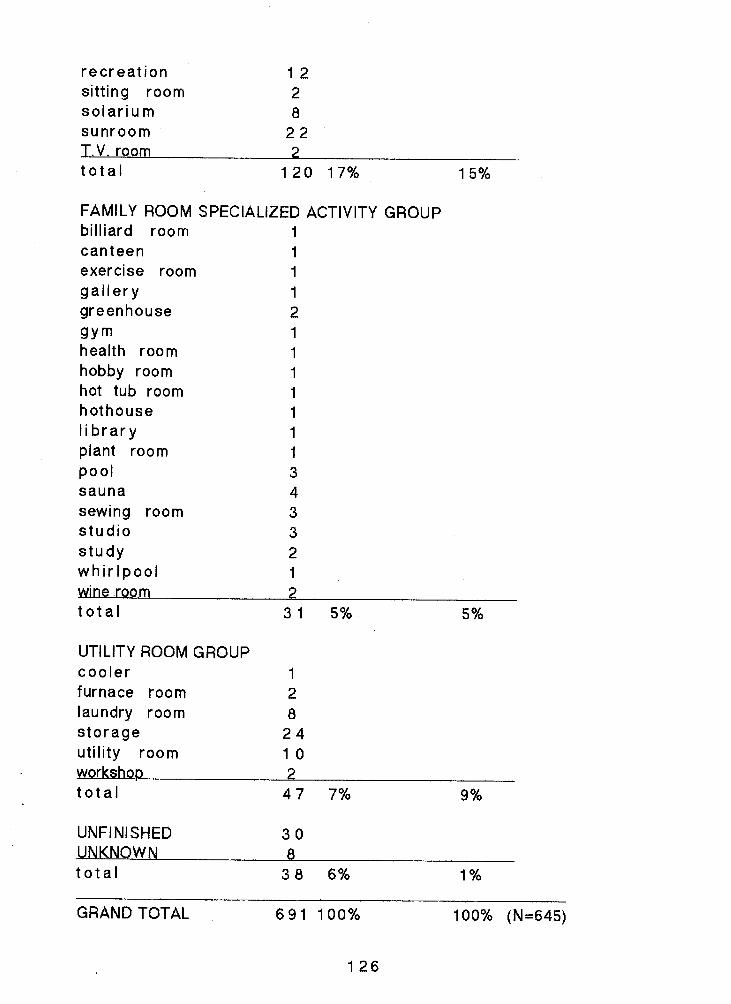
B. SUMMARY DATA 1. List of rooms added and extended (from building
permits) 2. List of the use of basement rooms (A4)
v i i
TABLE OF CONTENTS CONTINUED PAGE
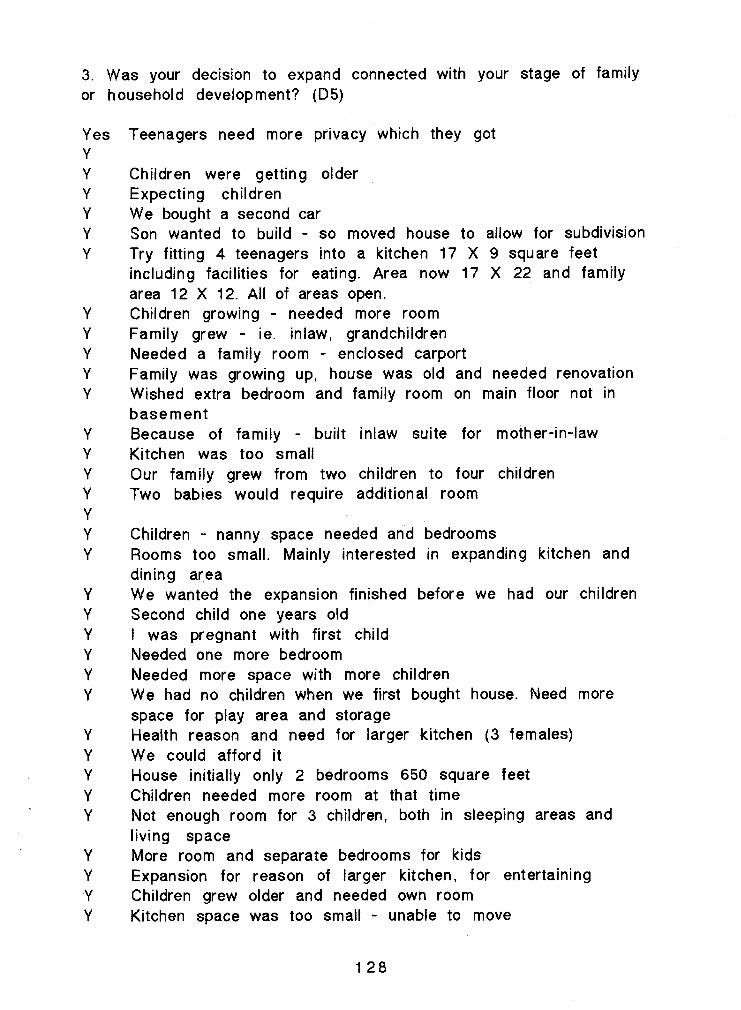
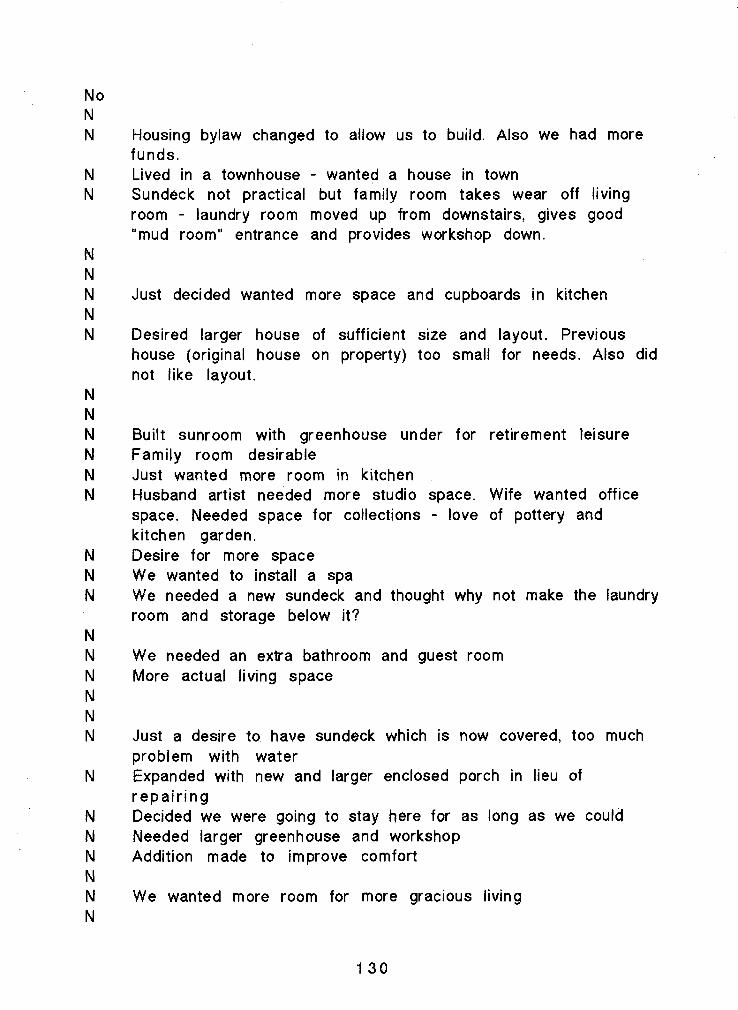
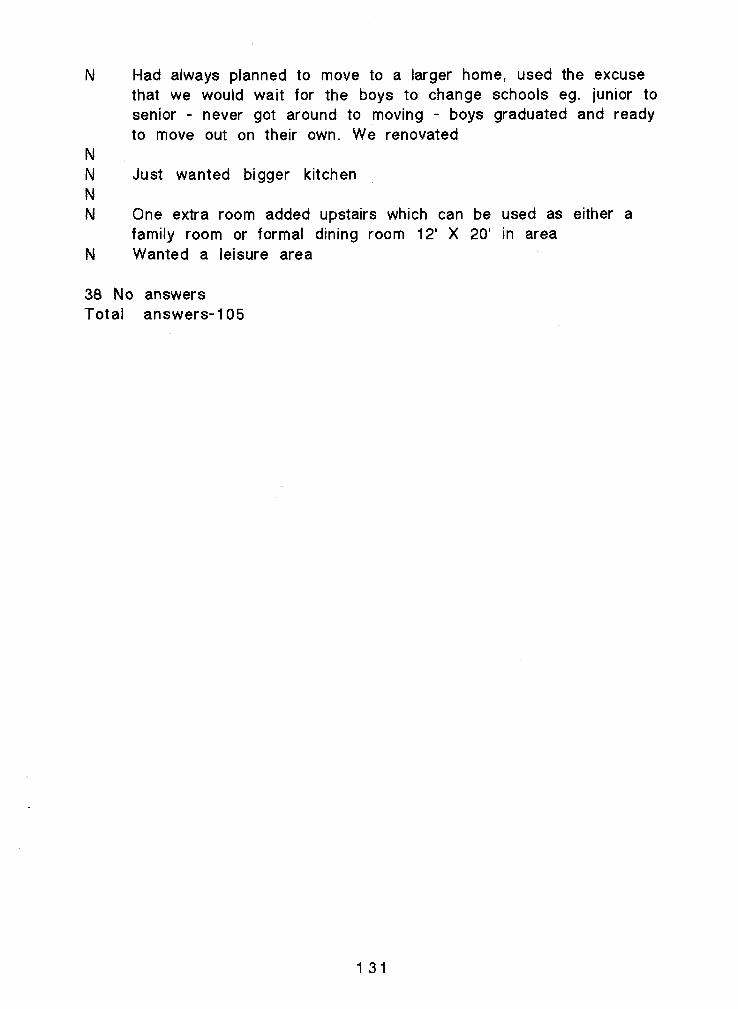
3. Expansion connected to stage in family or
household development (D5). 1 2 8
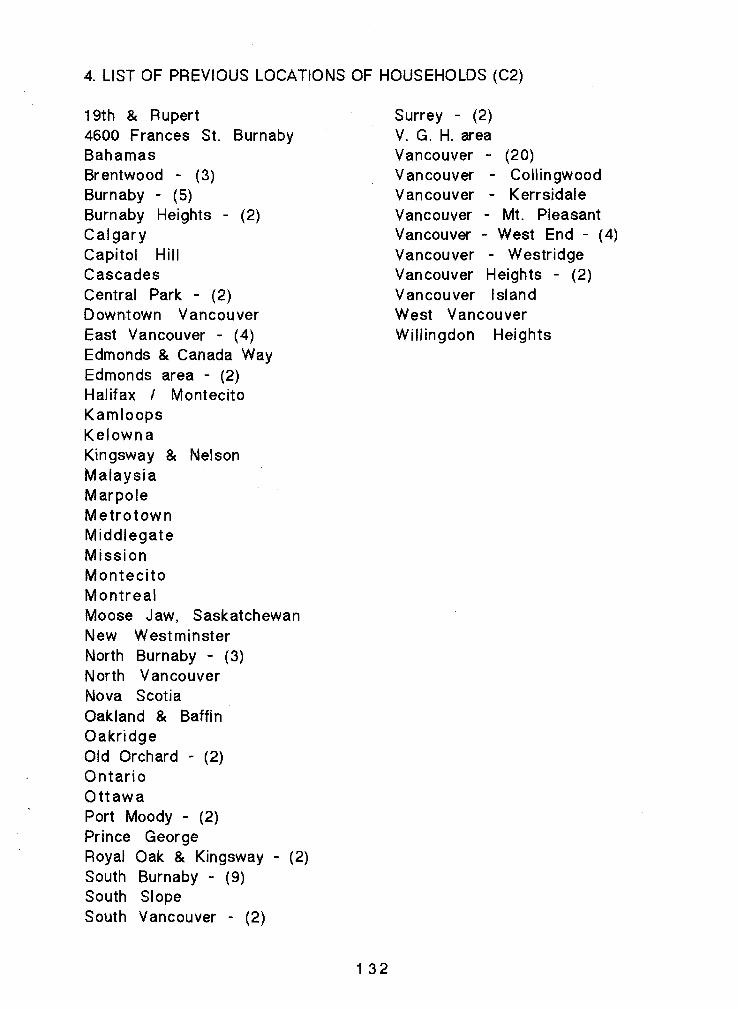
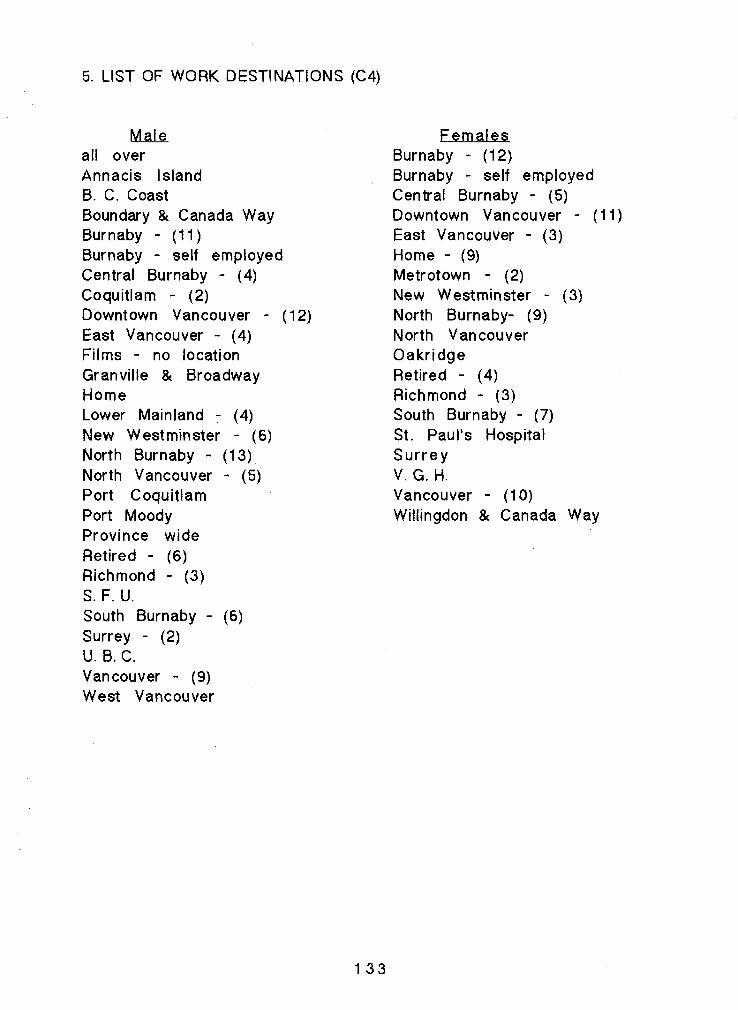
4. List of previous locations of households (C2) 1 3 2 5. List of Work Destinations (C4) 1 3 3
C. CENSUS TRACTS 1 3 4
BIBLIOGRAPHY 1 3 8
v i i i
LIST OF TABLES
Population and Household Characteristics of Burnaby
Population, households and .dwellings, 1 986
Zoning By-laws for Various Residential Zoning Categories
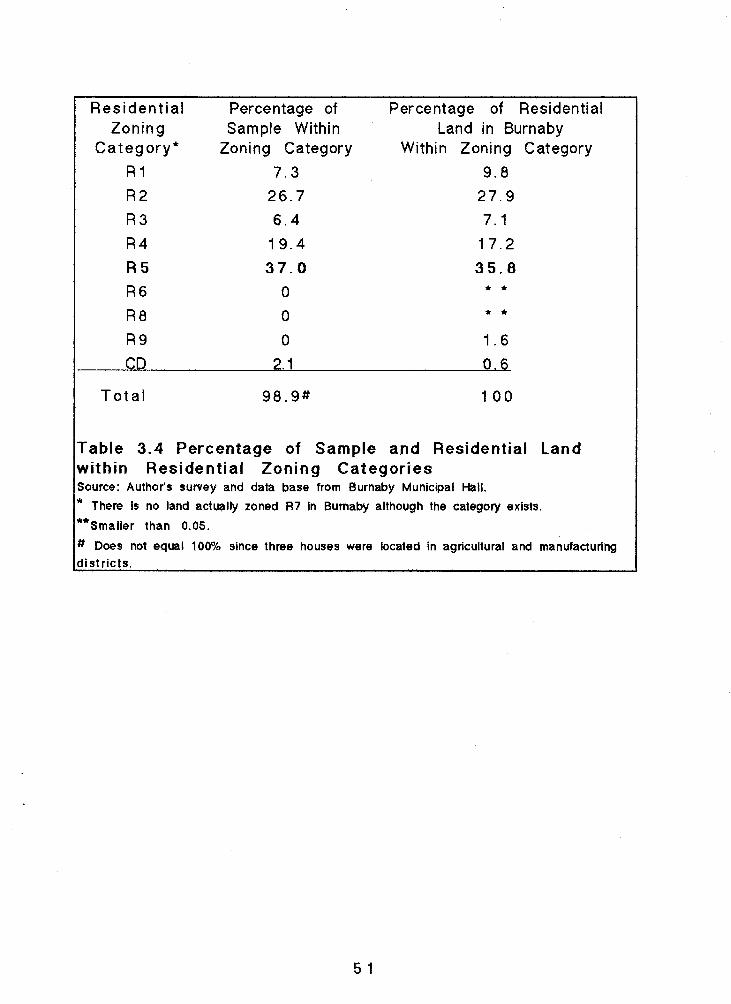
Percentage of Sample and Residential Land within Residential Zoning Categories
The Number of Addition Permits and Total Permits Issued
Life Cycle Stages (after Duvall) With the Percent Within Each Stage
Orientation - A Comparison Among Burnaby Households, Those With Children and Those Without, and the North Shore
Aggregate Space - A Comparison Among Burnaby Households, Those With Children and Those Without, and the North Shore
Partitioned Space - A Comparison Among Burnaby Households, Those With Children and Those Without, and the North Shore
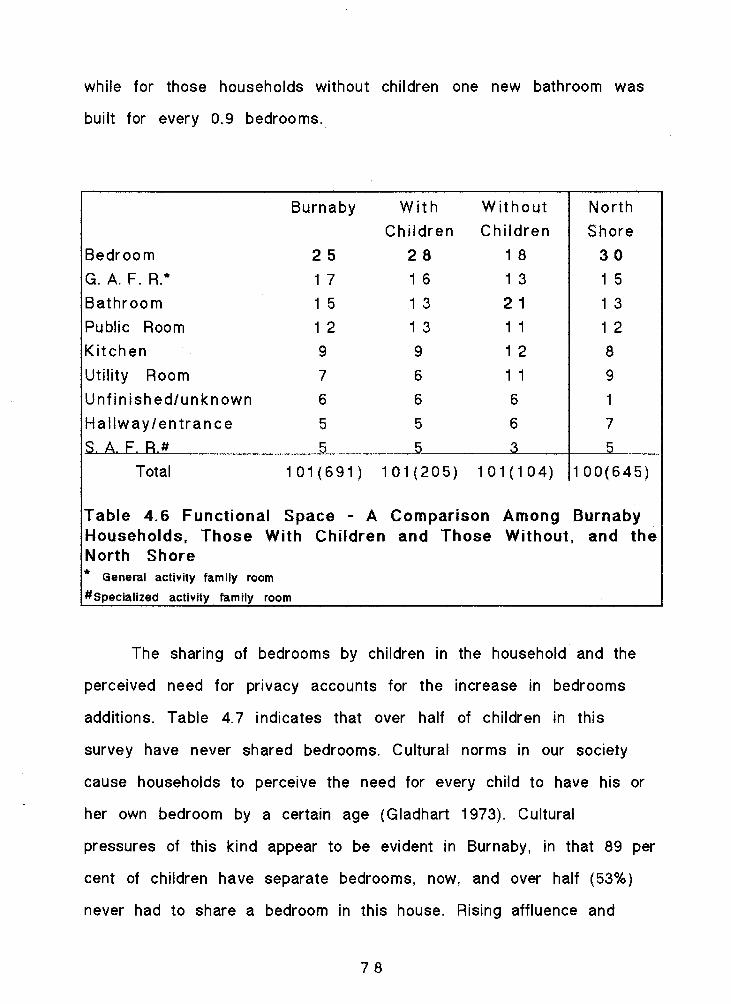
Functional Space - A Comparison Among Burnaby Households, Those With Children and Those Without, and the North Shore
Sharing Bedrooms - A Comparison Among Burnaby Households, Those With Children and Those Without, and the North Shore
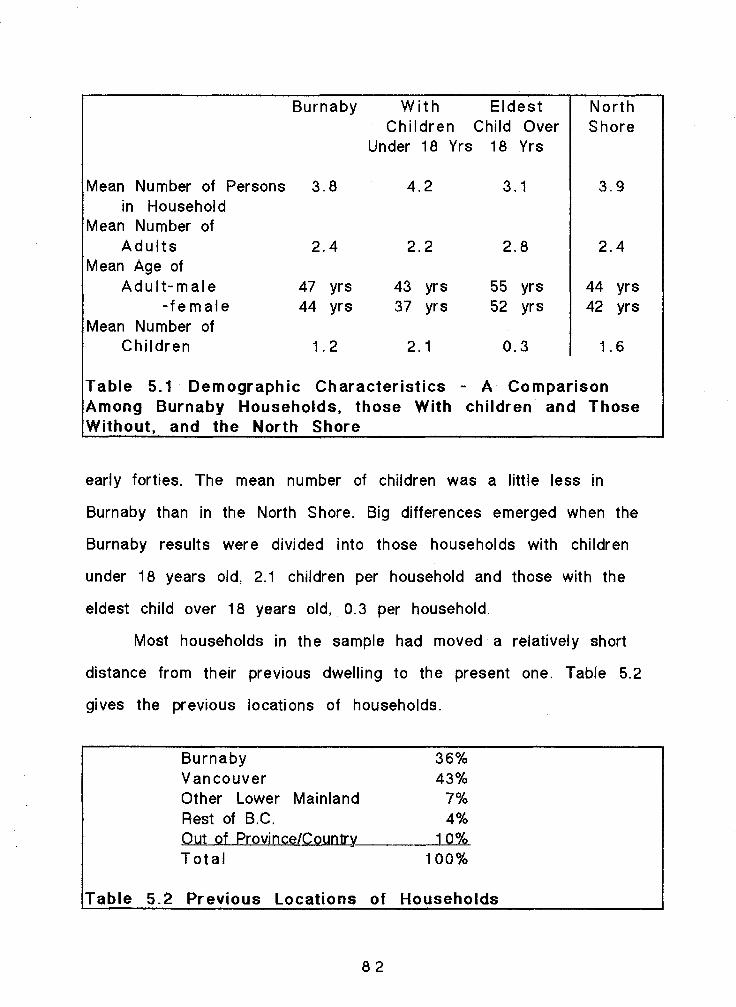
Demographic Characteristics - A Comparison Among Burnaby Households, Those With Children and Those Without, and the North Shore
PAGE
4 0
4 3
4 8
5 1
5 3
5 7
6 3
6 5
7 6
7 8
7 9
8 2
Previous Locations of Households
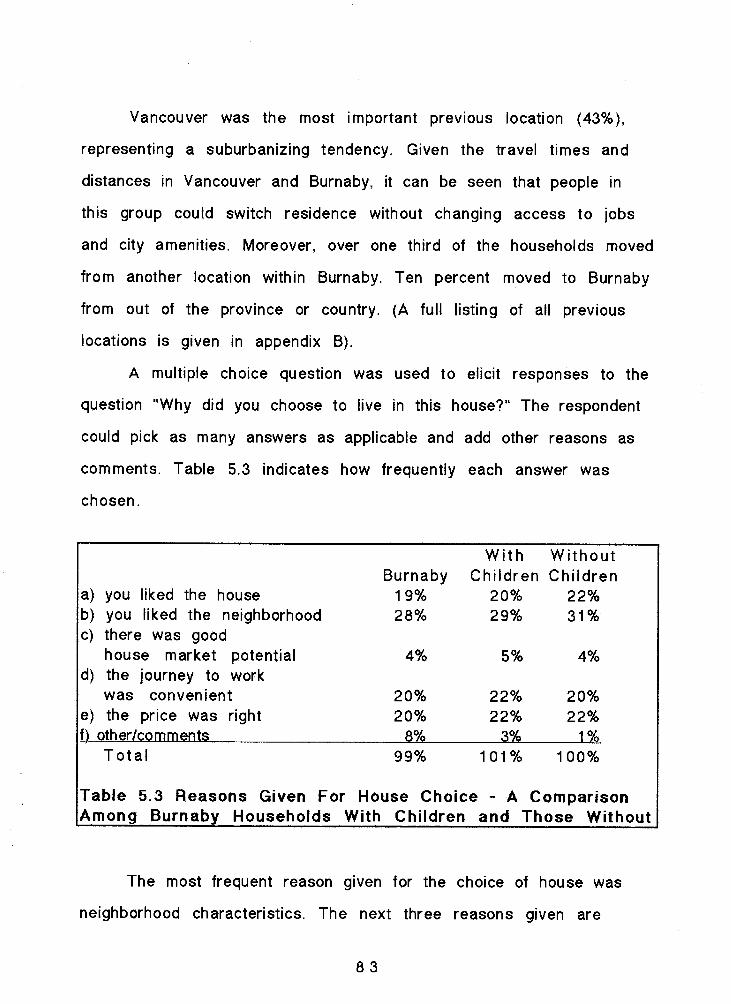
Reasons Given For House Choice - A Comparison Among Burnaby Households With Children and Those Without
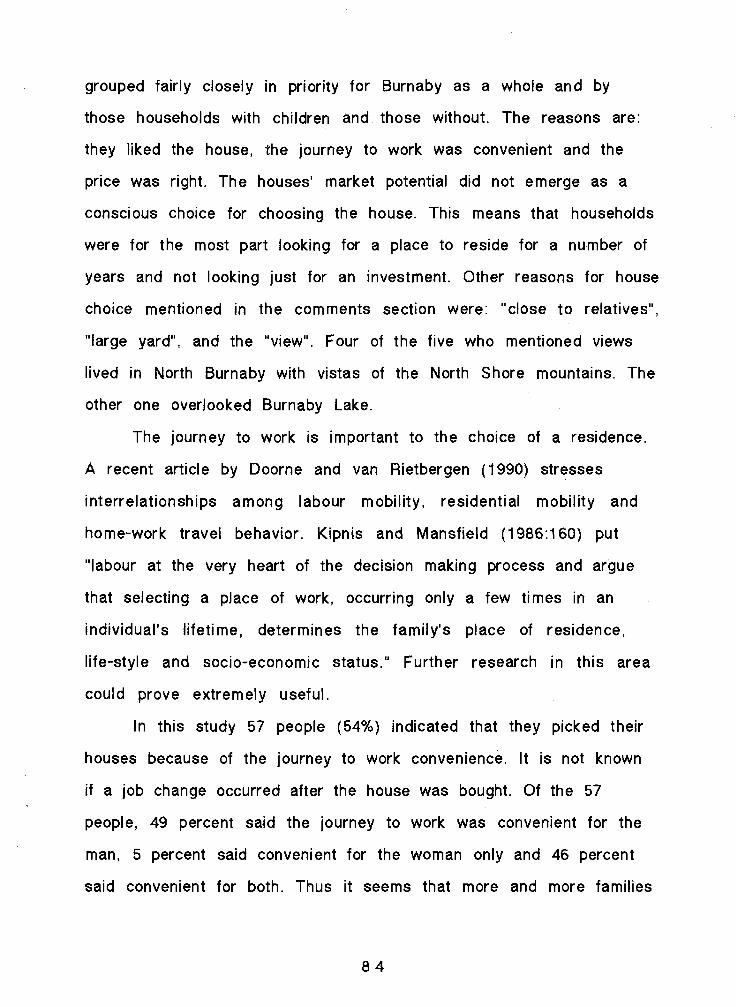
Work Destinations - A Comparison Among Burnaby Households With Children and Those Without, for Males And Females
Addition Ti metable for Expansion Projects - A Comparison Among Burnaby Households, Those With Children and Those Without, and the North Shore
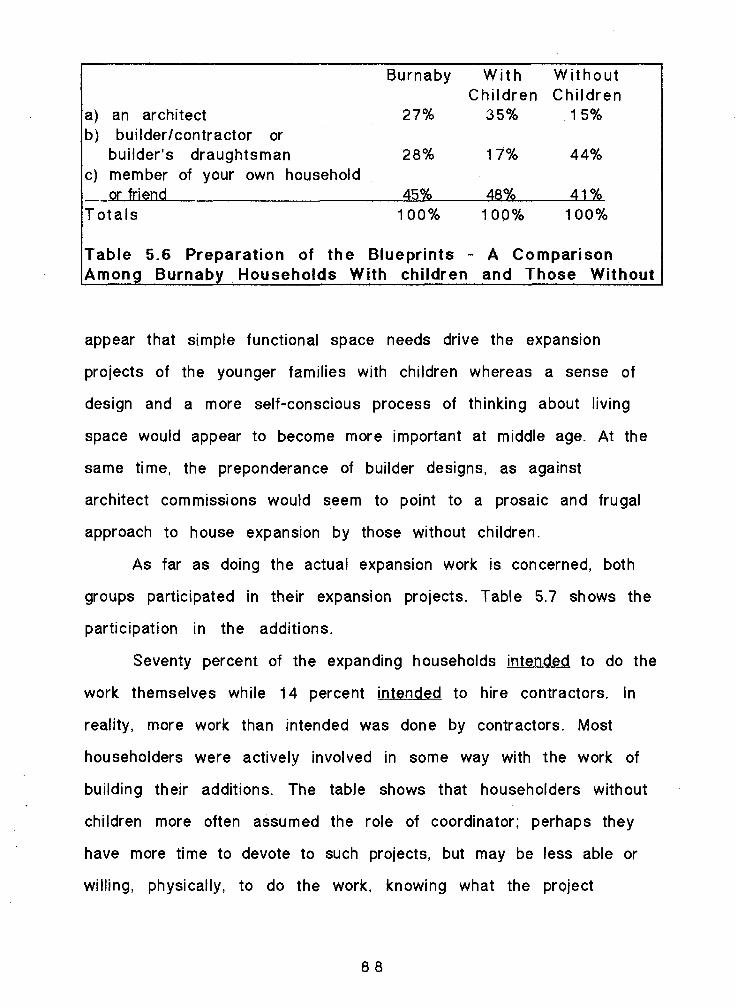
Preparation of Blueprints - A Comparison Among Burnaby Households With Children and Those Without
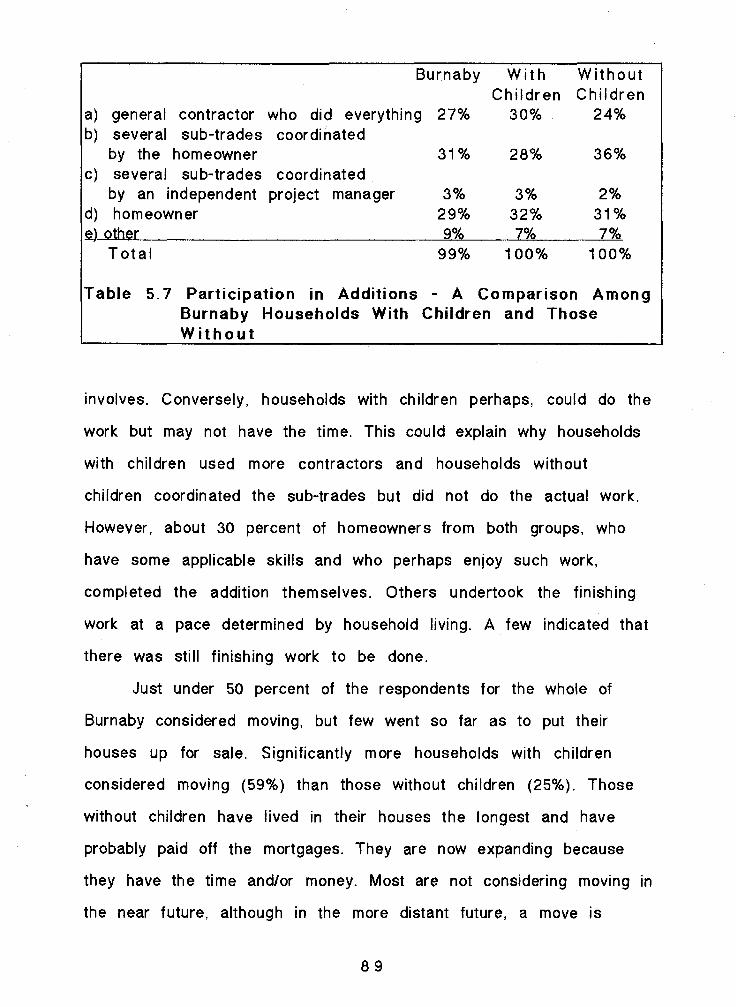
Participation in Additions - A Comparison Among Burnaby Households With Children and Those Without
Number of Households in Reclassified Stage Six
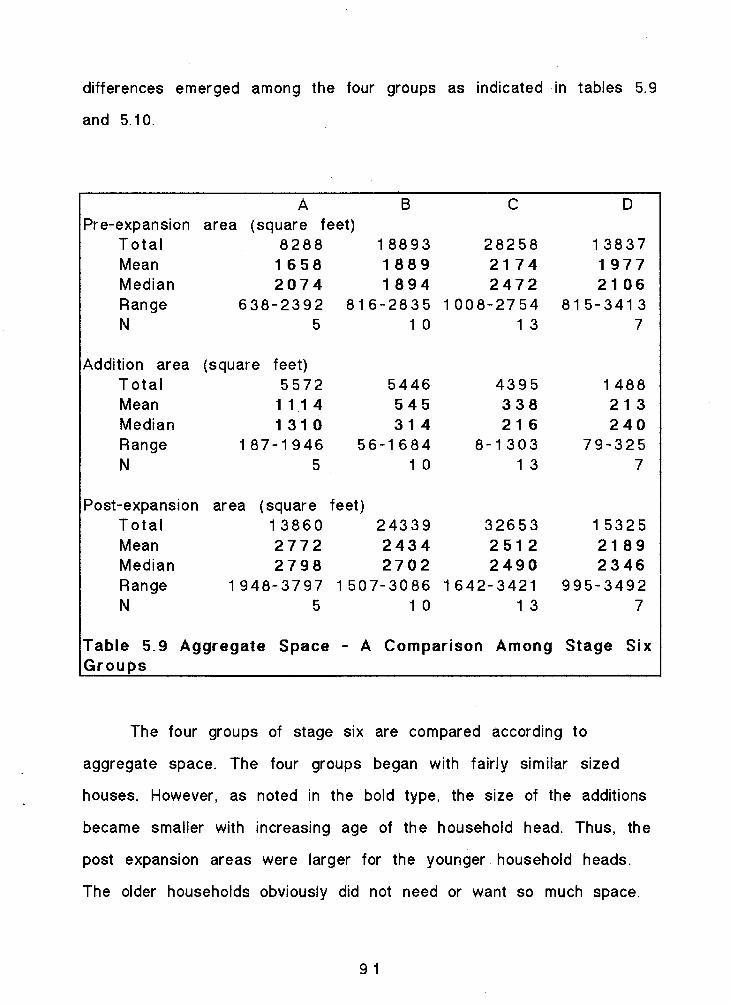
Aggregate Space - A Comparison Among Stage Six Groups
Partitioned Space - A Comparison Among Stage Six Groups
Functional Space - A Comparison Among Stage Six Groups
~xpansion Decisions - A Comparison Among Stage Six Groups
Summary of Population, Movers and Dwelling Characteristics for Census Tracts in Burnaby, for 1986 Census Year
Summary of Census Family Characteristics and Number of Children for Census Tracts in Burnaby, for 1986 Census Year
/
PAGE
8 2
8 3
8 5
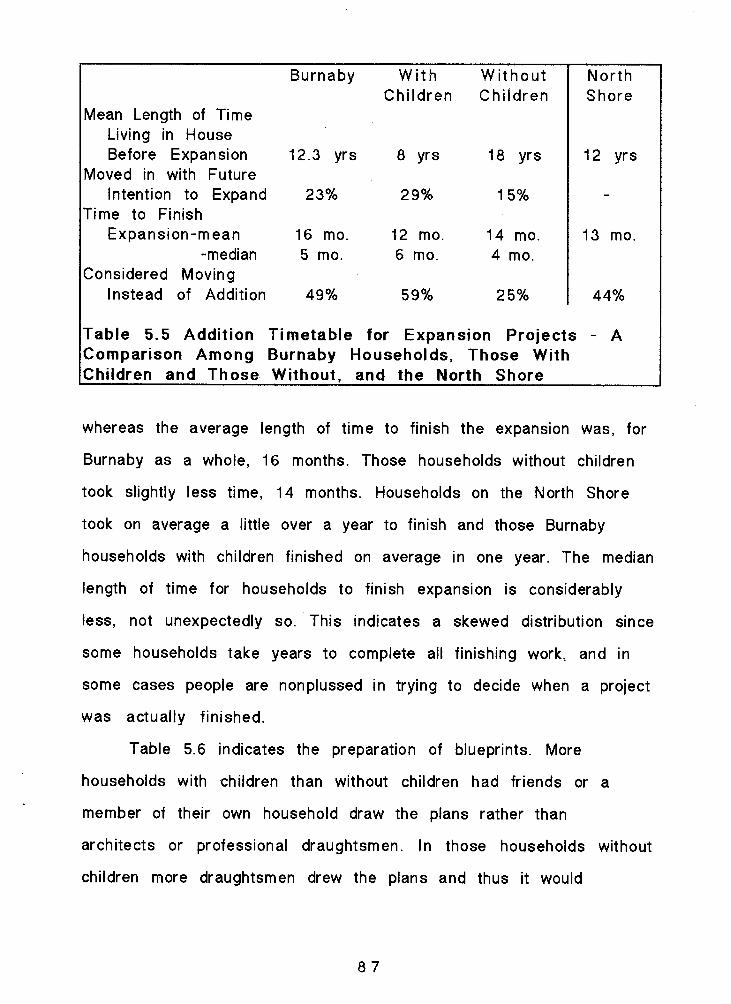
8 7
8 8
8 9
9 0
9 1
9 2
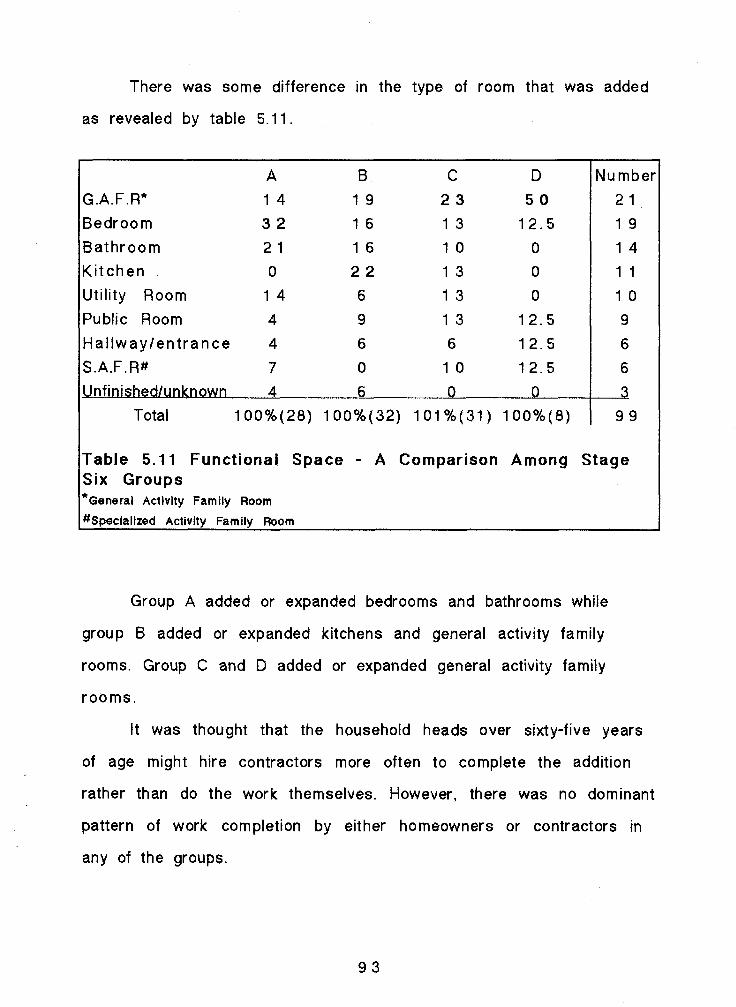
9 3
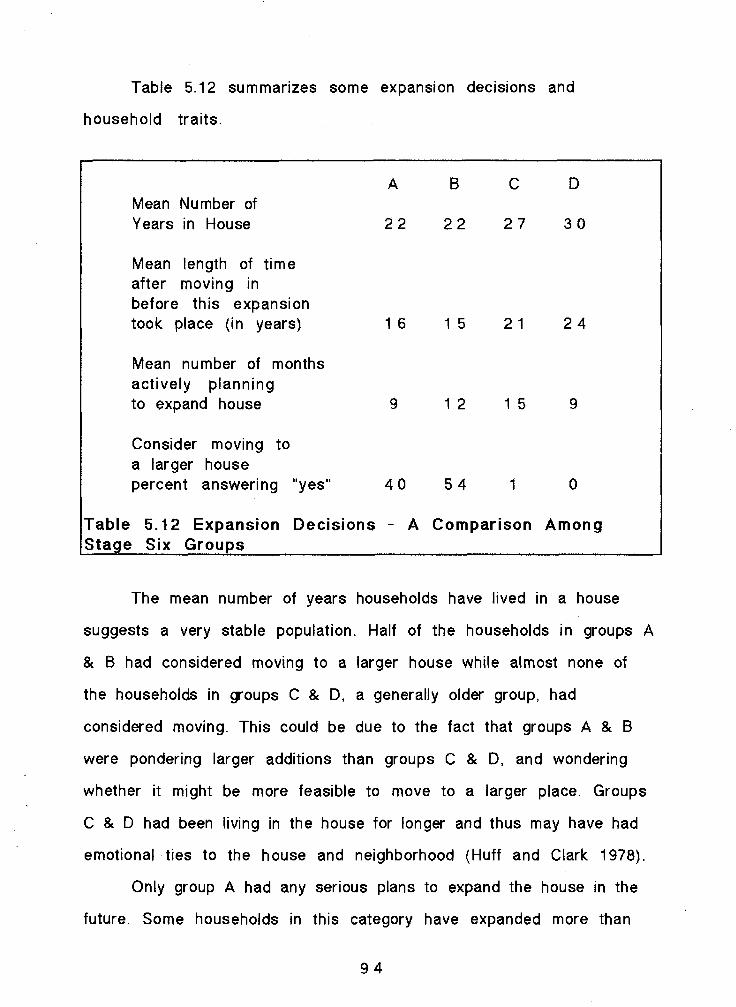
9 4
LIST OF FIGURES
House and Lot Plan: Basic Form
Brown and Moore Model (1971) of the Residential Location Decision Process showing the Connection made in this Study to Evenden's Model
Evenden Model of the Process of Dwelling Expansion
Location of Study Area: Burnaby, B. C.
Burnaby showing Major Roads, Surrounding Municipalities and Neighborhoods
Population Growth of Burnaby, 1892-1986
Burnaby: Socio-demographic Characteristics by Census Tract
Land Use and Zoning, 1920s
Residential Zoning Map, 1 980
Distribution of Sample and Households which Returned Questionnaire
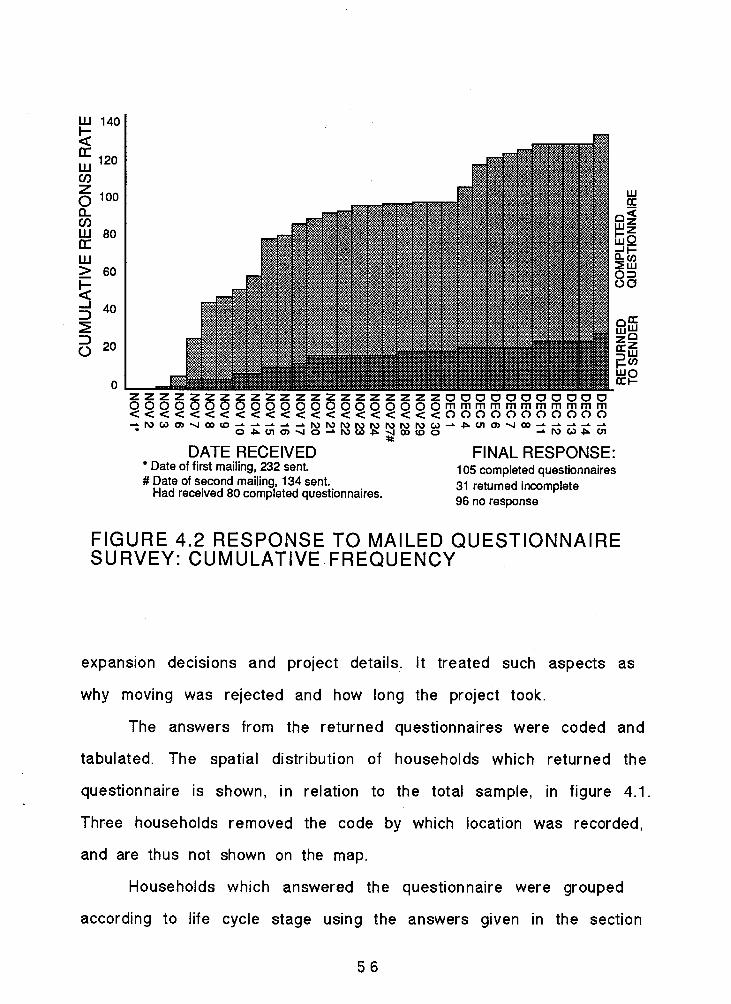
Response to Mailed Questionnaire Survey : cumulative frequency
Aspect - A Comparison Between Burnaby and the North Shore
Pre-expansion Areas
Areas of Additions
Ratios of Areas of Additions to Pre-expansion Areas
Large Ratios
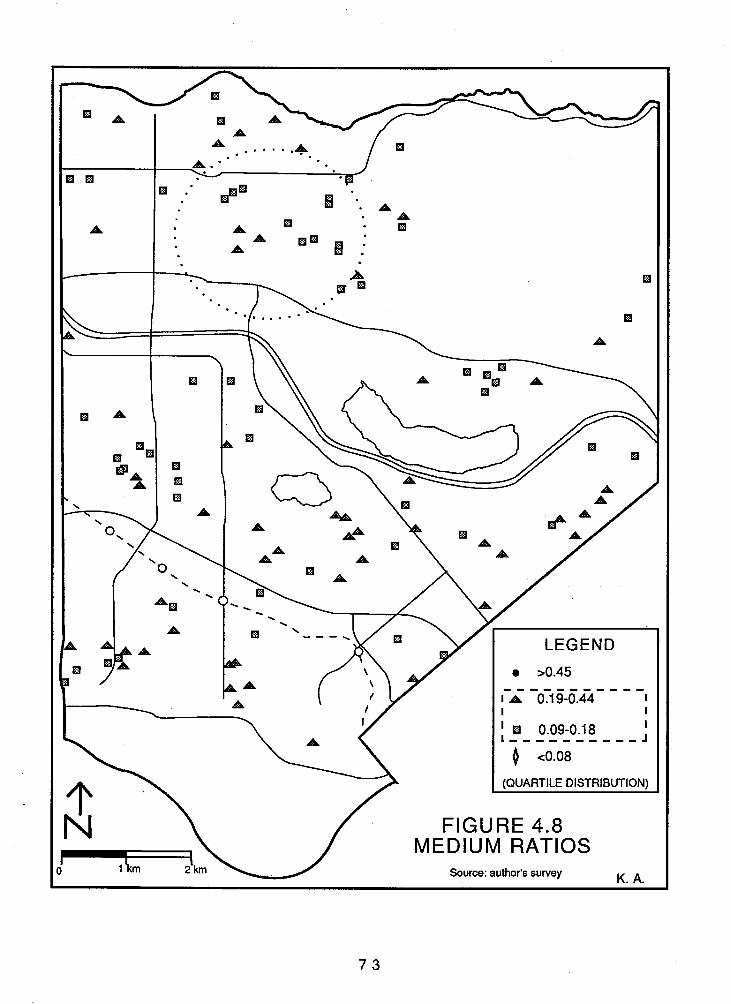
Medium Ratios
PAGE
4
LIST OF FIGURES CONTINUED PAGE
4.9 Small Ratios 7 4
6.1 Plan View and East Elevation of House in Case Study #I 9 7
6.2 Plan View and West Elevation of House in Case Study #2 1 0 1
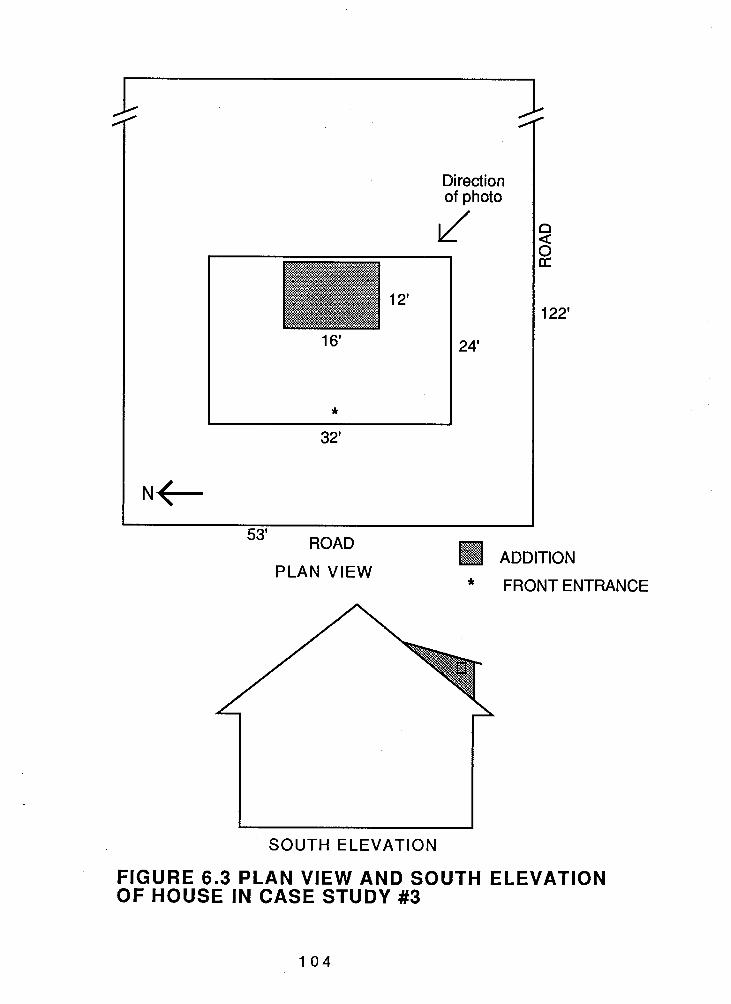
6.3 Plan View and South Elevation of House in Case Study #3 1 04
6.4 Plan View and North Elevation of House in Case Study #4 107
6.5 Photo of House in Case Study #I 109
6.6 Photo of House in Case Study #2 109
6.7 Photo of House in Case Study #3 110
6.8 Photo of House in Case Study #4 110
A. Numbered Census Tracts 137
Chapter 1
in t roduct ion
Despite recent trends in the diversification of residential
building, single family dwellings remain preponderant in North
America. In recent decades the average size of such dwellings has
increased and the quality of construction has improved. The majority
of Canadians are homeowners and it is with homeowner behavior in
relation to changes in dwelling space that we are concerned in this
thesis.
The rate of Canadian homeownership has increased from 57
percent in 1941 to 63 percent in 1986, and 57 percent of households
live in units built since 1960. Average household size has, over the
same 45 years, decreased from 4.5 persons to 2.7. These
simultaneously occurring but opposed trends are an indication of the
improved standards of living enjoyed during the second half of the
century.
General trends such as these mask numerous processes which,
at the level of the household, are resolved in a decision-making
process juxtaposing and relating perceived housing needs with a
dwelling structure and its location. As the life cycle of the
household proceeds, its housing needs change to the point that larger
premises are often felt to be needed. This often precipitates an
enlargement of existing premises or a move to a bigger dwelling. As
the cycle of housing needs continues to retirement, the household
often downsizes and in time, may change location again (Prior 1986).
Although dwellings are physically susceptible to subdivision
for multiple occupancy, the single family dwelling cannot by
definition proceed to such a stage of development - a point that
holds even though the special case of units designated "in-law
suites" are permitted in some 0 . C. municipalities. Further, once a
house has been expanded, it would rarely be reduced in size. Thus,
the continued activity by successive households in expanding
dwellings to suit their perceived needs results in an ever-enlarging
basic house throughout the area (Evenden 1988). It is this expansion
phase of dwelling development, along with the stage of household
development, that defines the focus of this study within the larger
contexts of residential landscape formation and socio-demographic
dynamics.
To get additional space, householders have two choices. They
can move to a new residence which has the characteristics they
seek. However, a move will not immediateiy result in the physical
changes to dwellings, old or new, although it might change the
household's social position in the community by virtue of a new
location. This mobility option is the one most studied in the
literature. Their second choice is to improve the existing premises
by adding to the buildingls) of their property, and this in turn will
result in physical change to the house but will have no locational
implication. This option of staying and building is little studied. Yet
these are related choices in the overall processes of urban
development, and thus a contribution of the present work is to
highlight the dynamics, and to present findings from a case study, of
this dynamic process of residential transformation.
Research in the tradition of gender analysis might lead to
expectations of spatial zoning of dwelling interiors according to
gender characteristics. In the present study, however, decisions
regarding expansions were jointly made by husband and wife
couples, even when space such as kitchens, dens or workshops were
being considered. Thus the emphasis here has been to focus on the
expansion project as a matter of household decision-making, and
questions referring to gender related spatial development left to
research beyond the present study.
The purpose of this thesis is three-fold: first, to examine and
summarize the characteristics of additions made to single family
dwellings standing alone on their own properties in the municipality
of Burnaby between 1980 and 1985; second, to enquire into the
characteristics of the households that made the additions with a
view to determining the reasons for their efforts to expand their
dwellings, and; third, to examine the relationship between the type
of addition and housing needs, and life cycle stages of the household.
I. DEFINITIONS
Definitions here follow those developed by Evenden, 1982,
1988. Additions and expansions refer to attachments to existing
dwellings of enclosures of heated space. Thus, because they do not
add heated space, additions of carports, garages, sundecks and
patios are not included within the calculations, even though they
might have formed parts of expansion projects. Similarly,
renovation of existing space is not included in the calculations if
it did not add new space. The terms, addition and expansion, are used
interchangeably. Extension refers specifically to an expansion of an
existing room.
There is considerable variability in house shape and size, but
the vast majority in of Burnaby dwellings are constrained within a
building envelope, defined by municipal regulations, relating lot size
and position to house form.
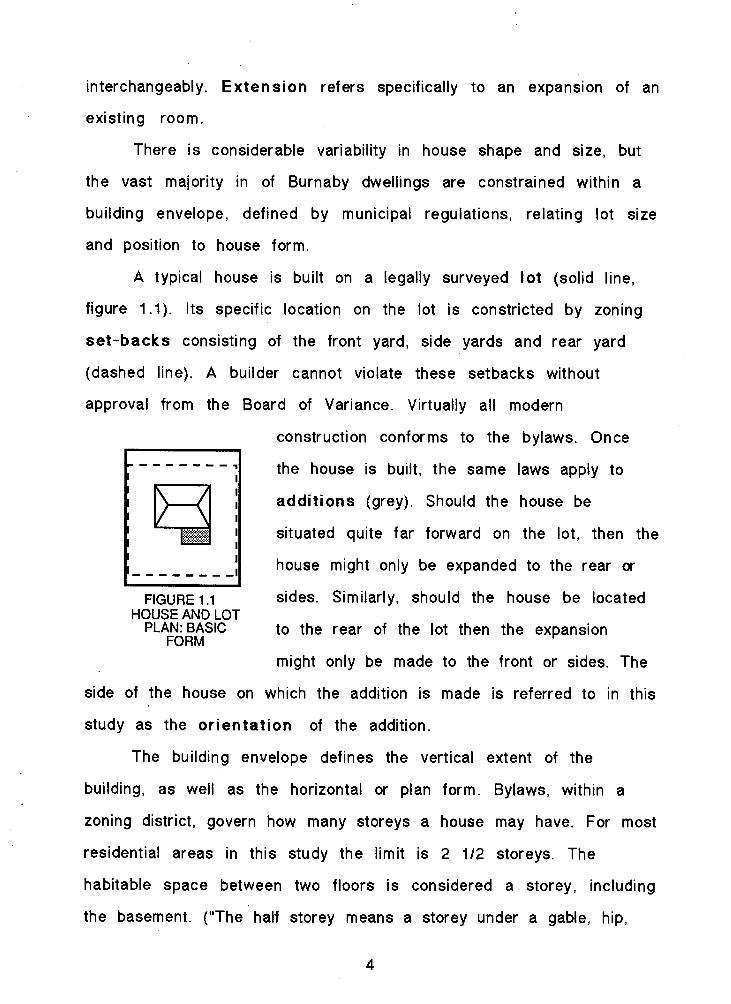
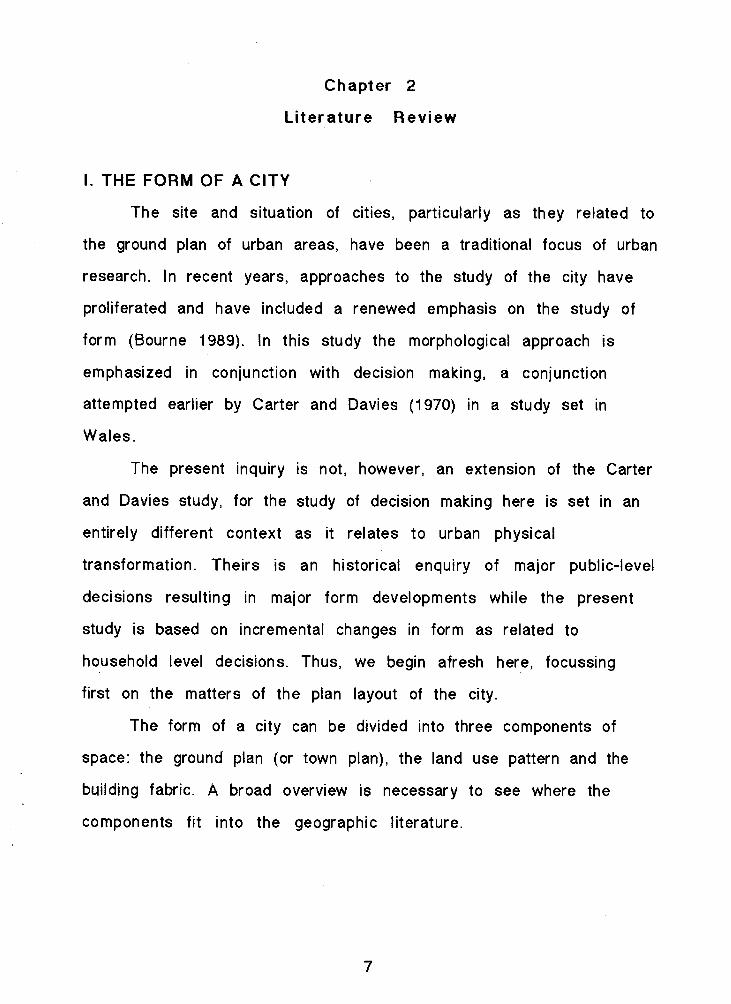
A typical house is built on a legally surveyed lot (solid line,
figure 1 . I ) . Its specific location on the lot is constricted by zoning
set-backs consisting of the front yard, side yards and rear yard
(dashed line). A builder cannot violate these setbacks without
approval from the Board of Variance. Virtually all modern
construction conforms to the bylaws. Once
- - - - - - - - pq the house is built, the same laws apply to
additions (grey). Should the house be
......... .......,. $&$$$ .......,.......... situated quite far forward on the lot, then the
I 1 - - - - - - - -I house might only be expanded to the rear or
FIGURE 1.1 sides. Similarly, should the house be located HOUSE AND LOT
PLAN: BASIC to the rear of the lot then the expansion FORM
might only be made to the front or sides. The
side of the house on which the addition is made is referred to in this
study as the orientation of the addition.
The building envelope defines the vertical extent of the
building, as well as the horizontal or plan form. Bylaws, within a
zoning district, govern how many storeys a house may have. For most
residential areas in this study the limit is 2 1/2 storeys. The
habitable space between two floors is considered a storey, including
the basement. ("The half storey means a storey under a gable, hip,
gambrel or shed roof having a gross floor area not more than fifty
percent of the gross floor area of the storey immediately below ..."
Burnaby Zoning Bylaw 1965: 19). Thus, depending on the original
configuration and height of the dwelling, there may be the option
within the building envelope to add a basement or storey to the
house.
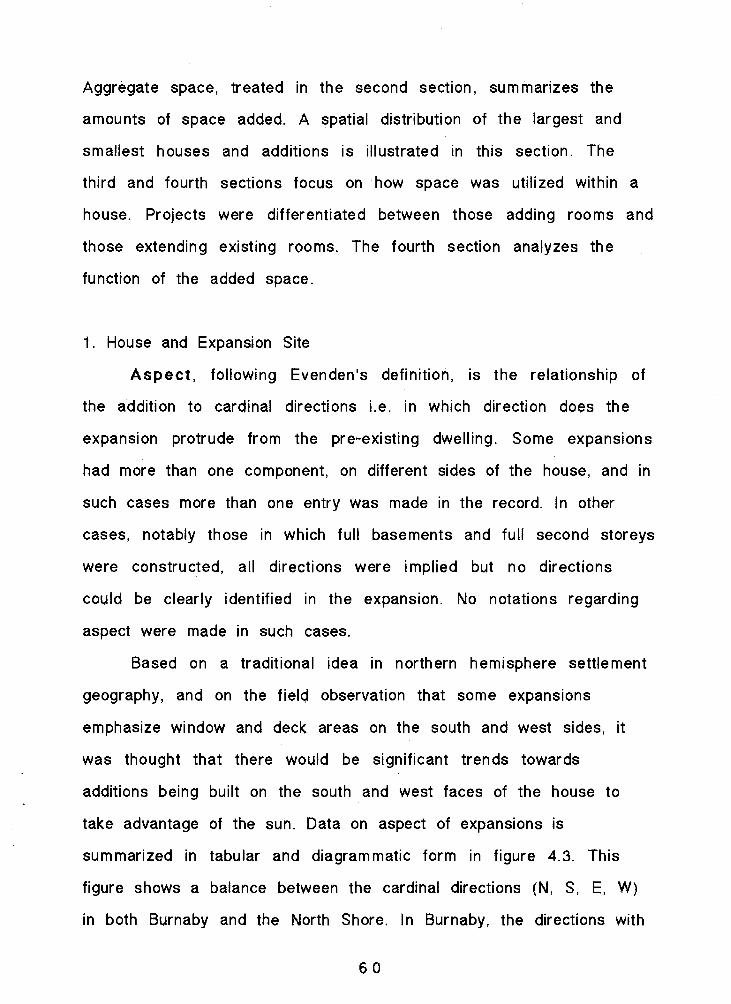
Another component of the expansion is defined here as the
aspect. This refers to the directions in which additions protrude.
Expansions might protrude in any direction, and are recorded here in
terms of points of the compass. Moreover, households also consider
window and door placement with respect to views and accessibility
to roads and lanes. These constraining variables set boundaries for
the forms of expansion. Finally, each addition has a specific use, or
function, which may determine the type of expansion built.
There are two types of households in this study so far as life
cycle is concerned. The most frequently occurring type is a family
with elementary school children and the other is a middle age
household with grown children. In different stages of the life cycle
the household has a tendency to add different types and sizes of
additions. Specific characteristics are identified and discussed
within the following chapters.
Even though there are economic implications for the household
which makes an addition through the purchase of building materials
and use of paid or unpaid labour, dollar figures are impossible to
measure with any accuracy because municipal figures are unreliable
and people typically are unaware of total costs. Therefore the basic
unit is better analyzed in the spatial term of area enclosed because
of its exact measure, consisting of value and availability at an
individual household level. This is the unit of analysis in the
morphological tradition.
The thesis is organized as follows. This chapter gave a brief
introduction to the thesis. The second chapter summarizes a
literature review on relevant studies in the field. The third chapter
outlines the geographic development of Burnaby and provides some
statistics about the municipality from the 1986 census. The fourth
chapter analyzes the data on the expansions from the building
permits. The characteristics of expanding households, gathered from
the questionnaires, is the topic of chapter five. Chapter six gives
some specific examples of houses and households through case
studies. Chapter seven summarizes and concludes the thesis.
Chapter 2
Literature Review
I. THE FORM OF A CITY
The site and situation of cities, particularly as they related to
the ground plan of urban areas, have been a traditional focus of urban
research. In recent years, approaches to the study of the city have
proliferated and have included a renewed emphasis on the study of
form (Bourne 1989). In this study the morphological approach is
emphasized in conjunction with decision making, a conjunction
attempted earlier by Carter and Davies (1970) in a study set in
Wales.
The present inquiry is not, however, an extension of the Carter
and Davies study, for the study of decision making here is set in an
entirely different context as it relates to urban physical
transformation. Theirs is an historical enquiry of major public-level
decisions resulting in major form developments while the present
study is based on incremental changes in form as related to
household level decisions. Thus, we begin afresh here, focussing
first on the matters of the plan layout of the city.
The form of a city can be divided into three components of
space: the ground plan (or town plan), the land use pattern and the
building fabric. A broad overview is necessary to see where the
components fit into the geographic literature.
A. Ground Plan
The ground plan refers to the layout of streets and block
composition. Studies have used ground plans to investigate the
morphology of towns, even medieval towns (M. R. G. Conzen 1960,
1968, Carter 1975). Since each period of time leaves distinctive
marks in the landscape these may be analyzed for insights into the
urban form. The ground plan has traditionally been recognized as the
most resistant to change as compared with land use patterns and the
building fabric. However, large scale developments, based on the
developer's ability to assemble large units of land and to
concentrate capital, and based also on a modern planning approach
which accommodates large scale developments, changes our
understanding of the traditional notion of urban form as being
divided into ground plan, land use patterns and the building fabric,
advanced by Conzen in 1949. This is not a serious issue here for,
although some of the houses sampled in this study may have been
built as parts of large scale developments, my unit of analysis is the
individual dwelling.
8. Land Use Framework
Land uses have perhaps been the most widely studied of the
three urban landscape components identified here. It is this aspect
which most directly connects the morphological and functional
approaches to urban analysis. Authors who have studied land use
patterns have proceeded by dividing the city into distinct
subregions, typically including the uses to which building and urban
spaces are put and as related to land values, population density and
accessibility. It is conventional to cite as the classic starting
points of the work the development of the concentric ring, sector
and multiple nuclei models of the city. Burgess (1925) proposed the
simple successive rings of various land uses out from the Central
Business District (CBD). Hoyt (1939) introduced the concept of
transportation corridors as a means of drawing people to live in
certain areas radiating as sectors out from the center. The modern
city became increasingly complex and spread out. It no longer looked
to the CBD for all its major transactions and overall focus. Harris &
Ullman (1945) proposed the multiple nuclei model of the city to take
into account the expansion of the metropolitan area, in which the
CBD changed its character. In a series of studies, Vance and others
have extended these three models to portray the new modern
conurbation. They accounted for the enormous size and diversity of
the modern city by employing a concept of 'urban realms' to describe
the vast conglomeration of cities and suburbs such as the San
Francisco Bay Area, the region in which the concept was developed.
These four morphological models described different ways of
characterizing the city.
Numerous studies have been put forward as to the pattern
urban growth takes, many being closely related to, or applications of
the theories referred to above (Hoover and Vernon 1959, Andrews
1971, Smith and McCann 1981). Each study isolated what happened in
particular areas of the city with a view to predicting the course of
urban development. For example, Smith & McCann (1981) found that
Andrews' cycle of development better described Edmonton's
development than the Hoover and Vernon model since it was more
flexible and few neighborhoods in Edmonton showed features of
decline (the last stage in the Hoover and Vernon model). Instead,
relative location and accessibility were more likely to explain
redevelopment than land use succession theory.
C. The Residential Built Environment
The last component of physical form was the building fabric.
Within geography it had two fundamental dimensions, one focussed
on the building types (Adams 1987, Gottman 1966) and the other,
different architectural styles. Both building type and period need
combined attention, preferably interweaving subjective elements as
well (Goss 1988). Fusch and Ford (1983) described the architectural
framework:
The urban landscape i s an architectural container that constrains and directs spatial decisions, imparts personality to a place, and plays a major role in the creation of positive and negative images of places that can affect the future character of the urban landscape ...[ I t is] ... concerned with space and place - two dimensional patterns and three dimensional landscapes (p. 324).
The element of these three dimensional landscapes with which I am
most concerned in this study is the ordinary housing of single family
dwelling districts. The neighborhoods contain different socio-
economic groups which impose patterns on the landscapes to be
studied.
Gentrification is perhaps the most well known phenomenon of
the "back to the city" movement. As a process, it occurs when
upwardly mobile, young, childless, (and as reported in the American
literature, usually white) professionals move to older areas in the
city and begin to repair and renovate the houses. As the look of the
area improves and capital is returned to the older sections of the
city, land values begin to rise. This has the effect of displacing the
incumbent population which can afford neither to redevelop nor to
pay the increased taxes which follow improvements. Thus they are
often 'forced' to sell and move to other low income areas perhaps
becoming renters rather than owners. This has happened to a certain
extent in Canada and Ley (1986) has documented this for Vancouver.
Other Canadian cities such as Toronto, Montreal and Halifax, showed
similar processes (N. Smith 1982, Millward and Davis 1986, Filion
1987).
In an attempt to make systematic upgrading processes,
Millward (1988) has proposed a classification of residential
upgrading. He has devised six categories according to the change in
social status and the amount of renovation activity: full
gentrification, partial gentrification, incumbent upgrading, social
upgrading, stability, and downgrading. In the context of the present
study, incumbent upgrading is the category of most i~terest .
Incumbent upgrading occurs when the resident population begins
voluntarily to upgrade their dwellings. Incentive to do this might
come from new government programs, community solidarity or
nearby zoning changes. However, incumbent upgrading only includes
renovation activity and not addition of new space. Thus, it is not the
same as expansion processes.
lncumbent upgrading is likely to take place in areas suitable
for renovation, (that is, the houses are large and well built) but
relatively unattractive to gentrifiers (public housing projects
nearby, poor accessibility to downtown, ethnic neighborhoods and
mixed land uses). lncumbent upgrading does not involve the problems
of displacement and social disruption caused by gentrification.
Often, as shown in this thesis, households prefer to stay in their
present neighborhood, at considerable cost, and upgrade and expand
their present house.
Invisible upgrading is similar to incumbent upgrading except
the renovations are carried out only in the interior of homes. Thus
they are 'invisible' since they are out of sight of the conventional
outdoor landscape. Bunting (1 987) and Bunting and Phipps (1 988)
have reported on this form of upgrading in smaller Canadian cities
(Kitchener and Saskatoon). Although Bunting stated that upgrading is
invisible, she was more correctly referring to modest investment,
since renovation activity was divided into two categories in the
study, interior and exterior. In her study, additionlextension was a
class of exterior renovation activity reported to have occurred in
four of the 65 households. In all these cases, the households used
their own unpaid labour instead of contractors to do the job.
Furthermore, the interiors of homes have been the deciding
factor in the case of whether to demolish the structure, such as the
Chinatown case (Hellyer 1969) and the means of classifying the
population. For example, the decoration and furnishings present
within a sample of Greater Vancouver homes were used to determine
(along with other information) the mainstream urban lifestyles (Gill
1981).
Stable neighborhoods have been studied in conjunction with
declining neighborhoods to analyze the differences between the two
and to try to find out why one is declining comparatively,
(downgrading). Reasons may stem from zoning practices (Moore
1982, Goldberg and Horwood 1980), redlining (banks refusing to lend
money to people in certain areas of the city) and racial steering
(real estate agents directing potential home buyers to certain parts
of the city depending on their nationality). Decline in the city center
seems to be more prevalent in the United States than in Canada
perhaps since racial tensions are more severe, and the studies cited
here are based mainly on American experience.
McConkey (1985) looked at the repair behavior of owner
occupants to see whether it was related to the housing upkeep of
neighboring owners, "the Jones effect". Clustering of repair behavior
was due to the clustering of ethnic groups and same vintage housing,
as well as to a combination of wanting to keep up the neighborhood
and keep up with the neighbors. Four study areas in Philadelphia,
Pennsylvania showed different degrees of influence. Area C, the
most like Burnaby, (a white retirement area) did exhibit clustering
of repair activity. In contrast to Area C, residents of Area A, an
ethnic area (Hispanic), were not sensitive to how much their
neighbors spent on repairs, only to whether they made any repairs at
all. In Areas B and D, there was no evidence of clustering of repair
ac t i v i t y .
Gentrification, incumbent upgrading and invisible upgrading
define what is happening in the renovation field. However, within
the context of this study, renovation does not fully explain the
distinct processes of addition and extension of the dwelling.
These processes will be elaborated in the next section within the
context of the decision making model.
I I . DECIS1ON MAKING MODEL
It is not enough to study the landscape; one must also
understand decisions people make to live in certain dwellings. A
number of factors such as costs, journey to work, neighborhood
characteristics and family composition determine whether a
household is satisfied with a house. If the household is not satisfied
it has three options. It may sell the house and move to another with
the characteristics it seeks. I t may also make additions and
renovate its current house, or it may do nothing. The last is not an
option that will resolve discontent with the dwelling, but it may be
the only course open. The next section gives the background of the
literature on household mobility. This is followed by a section
reviewing the more modest literature on households making
additions to their homes. Households that do nothing except cope
with the stress by changing their aspirations is a topic located in
other, probably social psychological f ieids of enquiry.
A. MobilityIMigration
One way a household makes changes when dissatisfied with its
dwelling is by moving. Mobility can be tied to job transfers, income
changes, family breakups and neighborhood livability. In many cases
these characteristics cause friction and the household relieves
tension by moving to a different place.
A landmark study by Rossi (1955) analyzed the reasons why
people moved. He found that the principal reasons people change
residences are associated with their housing needs at different
stages in the life cycle. This held true across low income and high
income areas and households.
Various authors since Rossi have tried to capture the dilemma
people face when thinking about moving or expanding their existing
residences. Brown and Moore (1971) related their ideas to Wolpert's
study on the decision to migrate, a study in which the author
developed a framework for the study of migration in urban areas.
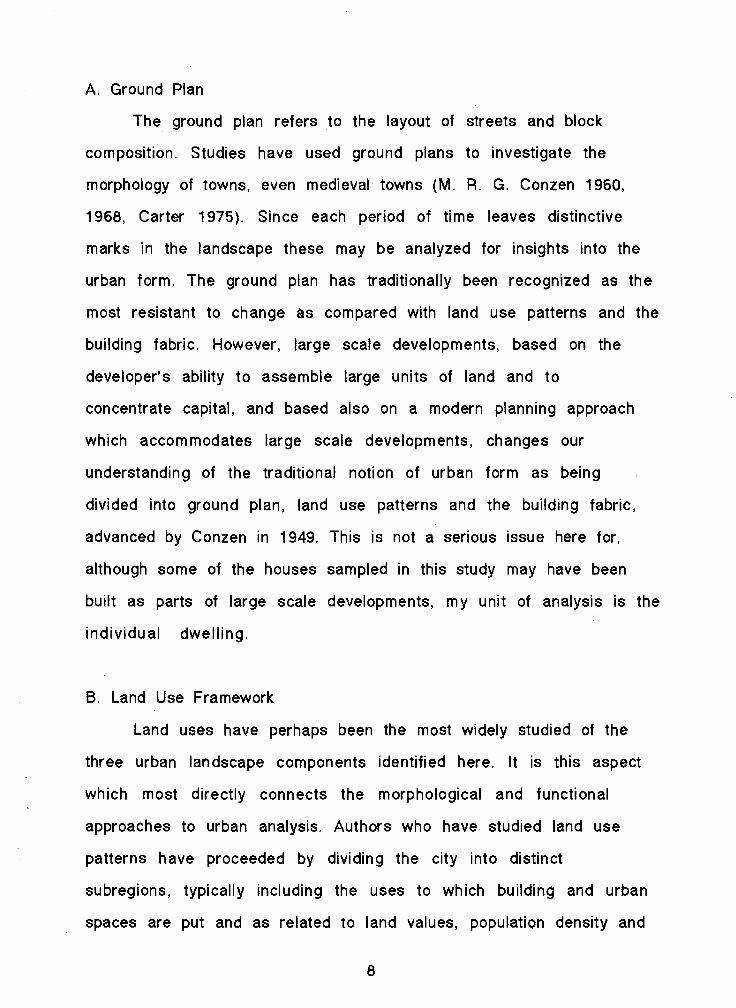
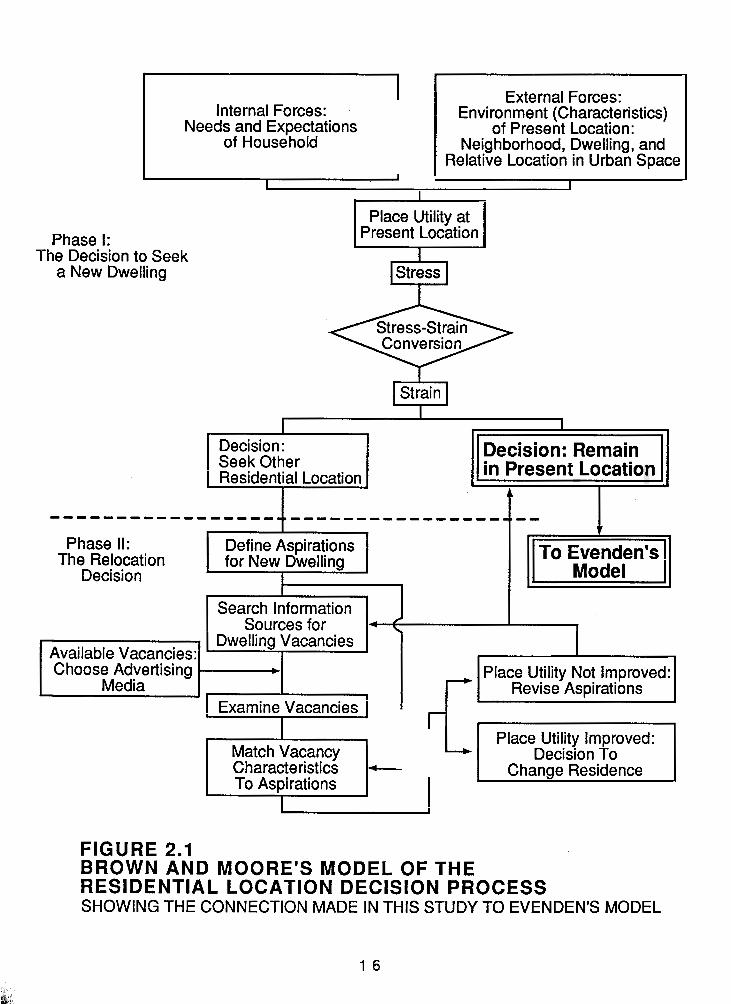
Brown and Moore in turn, developed a model of the residential
decision making process (figure 2.1), in which internal and external
forces can create stress or strain on a household. The household
enters phase one when it decides to seek a new dwelling to relieve
the strain. It may seek a new dwelling or remain in its present
location and adjust its needs and aspirations. If it decides to seek a
new dwelling, the household is faced with the relocation decision,
phase two. If it can not resolve the main variables of finding a house
at the right location at the right price, it will have to remain in its
present location and engage in "in situ adjustment". To the
household, this may mean an addition of heated space to the
dwelling, a rearrangement of existing space through remodelling or
simply an adjustment of needs and aspirations. Which solution a
household chooses depends on household characteristics and the
Internal Forces: Needs and Expectations
of Household
Phase I: The Decision to Seek
a New Dwelling
External Forces: Environment (Characteristics)
of Present Location: Neighborhood, Dwelling, and
Relative Location in Urban Space I
I I
Place Utility at Present Location
Stress c' Decision : Seek Other
I
11 Decision: Remain I 11 in Present Location I
Phase II: Define Aspirations The Relocation for New Dwelling
Decision I I 11 Model I
Sources for
Choose Advertising
Examine Vacancies
Match Vacancy Characteristics - To As~irations 1
Place Utility Not Improved: I Revise Aspirations I L Place Utility Improved:
b Decision To Chanae Residence
FIGURE 2.1 BROWN AND MOORE'S MODEL OF THE RESIDENTIAL LOCATION DECISION PROCESS SHOWING THE CONNECTION MADE IN THIS STUDY TO EVENDEN'S MODEL
severity of the stress. The model is truncated at this point as far as
'stayers and builders' are concerned. However, it was taken up as a
starting point for another model developed by Evenden and explained
later in this chapter.
Boyce (1971) exemplified work on residential mobility by
looking at movement of households within .Seattle, identifying both
push and pull factors which influence households to move. He
stressed that five major items would have to be considered
simultaneously to build a satisfactory model of residential mobility:
1. location of area, 2. site characteristics of residence, 3. status of
housing-rental versus ownership, 4. class and value of housing, and
5. the characteristics of the residents such as income, size of
family, monetary and marital status. Boyce found that, within
Seattle, there was no clear-cut movement of the population between
the central city and the suburbs. Instead there was a kind of
"musical chairs" within the area with major growth of suburban
areas coming from other cities rather than from the central city.
Further, he found that upward mobility in housing was almost
always involved in any voluntary intra-city move.
Bell (1968) emphasized life style in migration decisions. He
suggested that those households moving to the suburbs have chosen
the goal of familism over careerism. Families in the suburbs largely
remained satisfied with their quiet suburban locations; however,
they may enlarge the living space. Goals in life may be altered as
children grow up or neighborhoods change and therefore the suburban
location might not be as suitable as it once was. Consumer
aspirations may precipitate a move to another location within the
city which better fits with the goals of upward housing mobility.
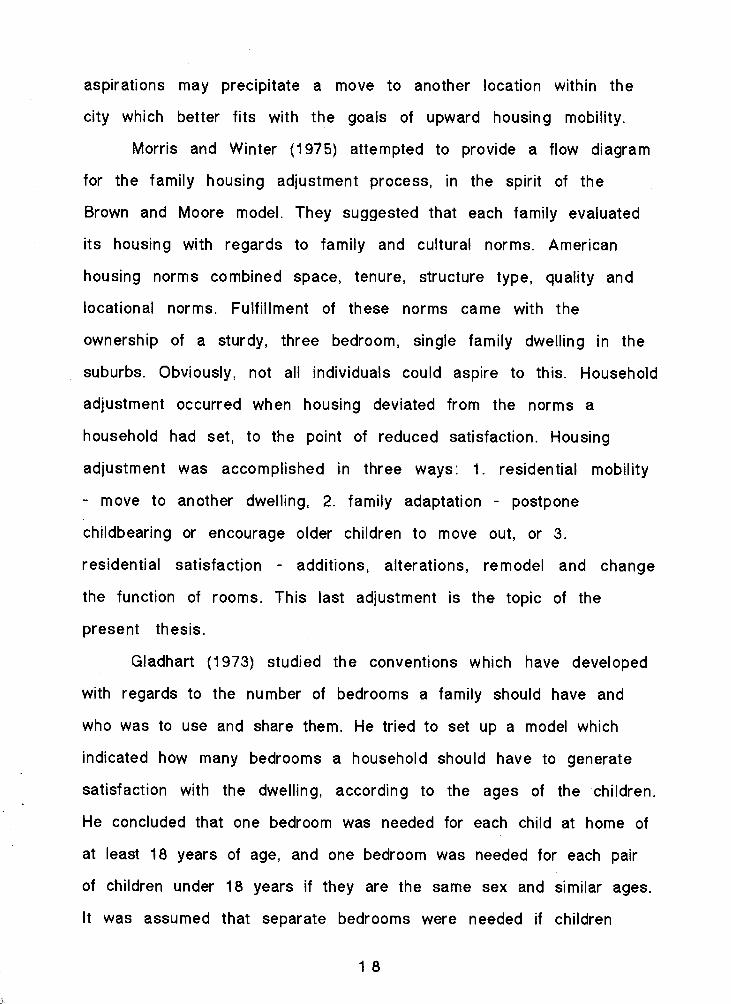
Morris and Winter (1975) attempted to provide a flow diagram
for the family housing adjustment process, in the spirit of the
Brown and Moore model. They suggested that each family evaluated
its housing with regards to family and cultural norms. American
housing norms combined space, tenure, structure type, quality and
locational norms. Fulfillment of these norms came with the
ownership of a sturdy, three bedroom, single family dwelling in the
suburbs. Obviously, not all individuals could aspire to this. Household
adjustment occurred when housing deviated from the norms a
household had set, to the point of reduced satisfaction. Housing
adjustment was accomplished in three ways: 1. residential mobility
- move to another dwelling, 2. family adaptation - postpone
childbearing or encourage older children to move out, or 3.
residential satisfaction - additions, alterations, remodel and change
the function of rooms. This last adjustment is the topic of the
present thesis.
Gladhart (1 973) studied the conventions which have developed
with regards to the number of bedrooms a family should have and
who was to use and share them. He tried to set up a model which
indicated how many bedrooms a household should have to generate
satisfaction with the dwelling, according to the ages of the children.
He concluded that one bedroom was needed for each child at home of
at least 18 years of age, and one bedroom was needed for each pair
of children under 18 years if they are the same sex and similar ages.
It was assumed that separate bedrooms were needed if children
were not of the same sex and of similar ages. He also calculated the
number of bedrooms within the house against the number of rooms
and the ages of the members of the household to come up with a
'flexible housing score'. He made three behavioral judgments with
regards to flexible housing: 1. families with children required more
flexible space than did families without children, 2. the greater the
disparity between the age categories of the oldest and youngest
child, the more complex would be the family role patterns and
family behavior patterns; consequently, the greater would be the
family's demand for flexible and overlapping use of its housing
space, 3. babies and teenagers were more demanding of their housing
in a variety of ways than were children of other age categories.
However, some families, he concluded, became chronic movers since
they seemed unable to resolve their housing needs from move to
move.
Galster (1987) reviewed a household's satisfaction with the
dwelling according to aspirations the household established and
perceived needs of the family and how they responded to gaps
between such aspirations or needs and reality. Galster stated that
"...housing aspirations are undoubtedly influenced by a person's prior
residential experiences, perceived status, sense of personal efficacy
and potential for upward mobility. Needs ... are a function of family
size and demographic composition and life-cycle stage." (p. 546)
Using variables which attempted to measure a household's
satisfaction, such as rooms per person and bathrooms per person,
Galster found that satisfaction with the dwelling was not a linear
relation but a curvilinear one, with increases in the amount of a
particular item consumed leading to progressively smaller
increments in the householder's sensed well-being. These
relationships varied by homeowner type as young families, for
example, ceased gaining satisfaction when the rooms per person
exceeded 2.4. Galster contributed to the literature of mobility
versus addition by analyzing how satisfaction with the dwelling
influenced homeowner's decisions.
Michelson (1977) took the view that instead of reacting to
apparently unforeseen housing stresses, households could act with
reference to their long-term housing ambitions. Households might
move even if they had a high degree of housing satisfaction. They
might move to fulfill the dream of owning an 'architecturally'
designed house, for example, or to a larger place in anticipation of
having children. Others may move with the intentions of expanding.
Thus Michelson's study allows for the aspirations of the households.
As social patterns change, for example with more women in
the paid work force, the findings of these studies will become
increasingly dated. But there is still apparently a broad agreement
on basic processes and further work on the mobility aspect of the
model is reviewed by Bourne (1981). He stated that "the principal
means through which changes in the demand for housing are
satisfied, especially in the short term is by residential mobility"
(p. 1 33). Bourne gave four possible reasons for changing residences:
1. life cycle change, 2. income and employment change, 3. housing
attributes, and 4. neighborhood and accessibility needs. One could
argue that alteration and expansion of the dwelling could
accommodate some of these reasons just as easily as mobility, as
other expansion studies have shown (Evenden 1982, Seek 1983, and
Jackson 1985) and this thesis attempts to discover.
B. In Situ Adjustment- Addition to the Dwelling
In the present study on Burnaby, and in Evenden's earlier work
on Vancouver's North Shore, it was found that a large portion of the
households which redevelop their houses have considered but
rejected the moving option. it could be that what was observed was
the 'cumulative inertia' described by Huff and Clark (1978). This was
the familiarity and attachment to the house which made it harder to
move the longer a household had lived in a house. However, the
annoying aspects of the dwelling become progressively less
tolerable as well, until they eventually dominate. At this point
addition andlor renovation of the dwelling occurs, since for this
group moving has been rejected as an option.
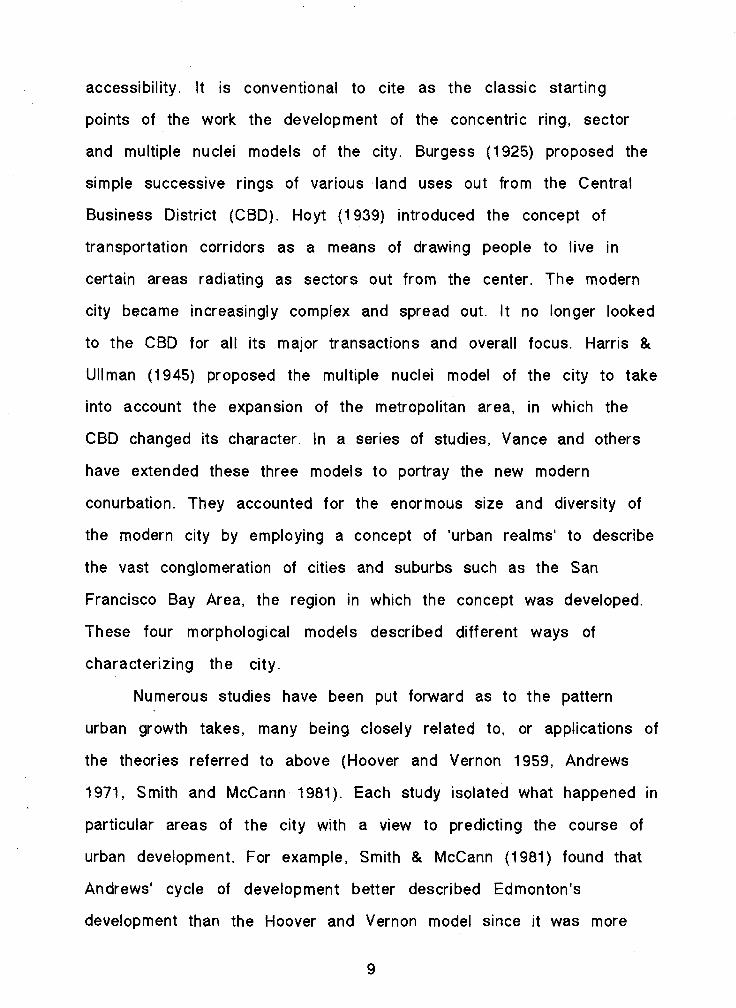
Evenden devised a model which expanded on the Brown and
Moore framework (figure 2.2). It emphasizes the expansion decision
instead of the mobility decision. He identifies three steps in the
action phase of dwelling expansion which follows the decision to
stay and build. The first step is the formulation of the idea. The
desired change is imagined, formulated and articulated. The second
step involves drawing the plans. For this a professional may be
commissioned or plans may be drawn by the householder, a family
member or friend. The third step occurres when permission is
obtained, contracts tendered and contracts let, not necessarily in
that order. In fact, contracts may not be tendered at all if the
householder plans to do the work himself. At this point the
DECISION PHASE
1
2
ACTION PHASE
1
PERCEPTION OF DESIRABILITY OF MORE DWELLING SPACE
I + Decision to Relocate
(emphasis on mobility, Brown and Moore model) (termination of 11 mobility model)
Inaction Expand dwelling
I Idea of desired change
imagined formulated articulated
I by professional
Plans drawn
t Renovation-
no expansion
+ by householder,
family member, friend
Permission obtained -Contracts tendered -Contracts let
1 Construction begins I by householder -1 1- by contractor
1 construction ends1
FIGURE 2.2 EVENDEN MODEL OF THE PROCESS OF DWELLING EXPANSION
householder moves from the private realm of household activity to
the public realm of scrutiny of his action and the payment of fees.
Finally, construction begins, although it may be some time before
construction ends, as finishing work tends to 'drag' in many
expansion projects.
Three further studies were of substantial interest for the
students of the expansion process in housing adjustment. The first
two were Australian studies by N. Seek (1983) and J. T. Jackson
(1985) carried out in Adelaide and Perth, respectively, and the third
was a study by L. Evenden (1982,1988) based the North Shore of
Vancouver, 8. C.
Seek (1983) undertook to explain how and why home
improvement decisions were made, in order to understand the
broader implications of home improving as a housing adjustment
process. Home improvements were defined as additions, alterations
and renovations. For his study, conducted in Adelaide in October
1978, he interviewed 200 homeowners who undertook improvements
to their dwellings, each valued at $2000 and over, in the twelve
months prior to the date of the interview. These homeowners were
compared with 677 households which moved during January 1976 and
March 1977, data which came from a survey earlier completed by
Kendig (1981) in Adelaide.
Seek used the family life cycle concept as developed by
Lansing and Kish (1957) to explain housing decisions. Lansing and
Kish's life cycle was divided into pre-family, young family, mature
family, older family, older couple and other. Seek found that pre-
families and young families usually had high incomes, wanted more
space and had commitment to housing (mortgage debt). These young
households had the choice of solving their housing needs through
moving or through improving (usually making additions), and often
bought a smaller ('starter') house with a view to improving and/or
selling it. Housing demands increased progressively, to peak at the
mature family stage when the income was generally the highest. At
this stage the household had been living in the house for an average
of eight years and, according to Seek, would usually try to make
improvements if possible and stay in the house. This corresponded to
the findings of the present study of Burnaby, where households with
children began making additions after living in their homes 8 years.
Older families and couples were in the contracting phases of the life
cycle when their needs for space may diminish. Changes to be made
to the dwelling were usually in the form of renovations and
alterations, especially to the kitchen and bathrooms. As retirement
approached, there was the anticipation of decline in income but
possibty an increase in equity by virtue of investment in renovation
and even expansion.
Regardless of stage in life cycle, Seek noted that there were
costs and benefits related to moving or improving. Costs involved
financial payments (mortgage transfer vs cost of lumber and
renovation supplies) and psychological adjustment (leaving the
house and neighborhood vs inconvenience and dust of construction).
Ultimately the household must weigh the costs versus the benefits
in monetary, stress and other terms, for both improving and moving.
Even though moving to, and improving a house might seem to
offer the worst of both worlds in terms of costs, nearly half of the
improvers in Seek's survey said they intended to make improvements
at the time of purchase. Seventy percent of improvements were
carried out in the first nine years. In conclusion, Seek stated that
households preferred to improve rather than move if there was a
choice. One of the implications was that to the extent that people
reject the moving option, older, used housing was not being passed
along since households were staying and making improvements. Thus
the 'filtering' process may be retarded.
Jackson (1980) described the relationships between moving
and what he called, extending (and Evenden refers to as expanding)
within the context of the model of intra-urban mobility proposed by
Brown and Moore (1971) and later modified by others (Morris and
Winter 1975 and Michelson 1977). Data were created by a survey of
movers and extenders conducted in 1979 in Perth, Australia. In his
survey there were 209 households that intended to sell (a 55%
response rate) and 368 intended expansions (a 72% response rate).
He excluded those moving because of domestic or mortgage
difficulties, job transfers and those moving from apartments.
Jackson's study dealt with three questions: I."Can potential
movers and extenders be differentiated in terms of their present
housing situations (internal and external forces as defined by Brown
and Moore)?"(p. 209); 2. "If.. .[potential movers and extenders can be
differentiated in terms of their present housing situations], are
these differences reflected in their current level of housing
satisfaction ('place utility" as defined by Brown and Moore)?" (p.
209-21 0); 3. "alternatively, were .. . extenders potential movers who
revised their housing aspirations as a result of a frustrated search
for other housing?" (p. 210).
In answer to the first question, seventeen variables
representing both external and internal forces, were condensed into
four significant findings: 1. the longer the household marriage, up to
25 years, the more likely it was that the house would be extended as
an alternative to moving; 2. the fewer rooms a dwelling had the more
likely it was to be extended; 3. the overseas born were more likely
to move than were native Australians; 4. movers tended to move
either in the first five years of marriage or after twenty-five years.
Jackson assumed that movers and extenders would have
different levels of satisfaction. His second question tested this
assumption. The answer to whether movers and extenders can be
differentiated in terms of housing satisfaction was that half of the
movers said they had suffered a recent decline in satisfaction while
only 12 percent of the extenders experienced a recent decline in
satisfact ion.
In light of the differences between movers and extenders
Jackson wondered whether extenders were frustrated movers. This
seemed not to be the case and life cycle, Jackson suggested, seemed
to be the key factor. Jackson indicated that there were at least four
distinct groups of people and possibly a fifth, described below.
The first group, movers who did not consider extending, were
usually a couple whose children had left and who were moving to a
smaller place. The second group, movers who considered extending,
were usually younger families with children under six years who
moved to a distant suburb. The third group, extenders who never
considered moving, were in the middle life cycle with children over
six years but living at home. They were well adjusted to, and like
their houses and neighborhoods. The fourth group, extenders who
considered moving, usually had a higher income and had a recent
decline in housing satisfaction and were born in a different country.
They found there was lack of suitable housing elsewhere and claimed
it was cheaper to extend. They usually undertook the construction
themselves.
A newly emerging fifth group were those who extended a newly
bought house. Jackson found that these were usually professional
people who purchased smaller houses located in high status suburbs.
They were willing to endure the inconvenience of both moving and
extending for potential capital gains and social status.
Jackson concluded that housing ambitions are largely
conditioned by life cycle. However, he suggested that movers' and
extenders' behavior is better viewed through longer term housing
ambitions. He agreed with Finighan (1979) that rising housing
expectations have paralleled the rising standard of living for most
Western Australians. This would appear to be true for Canadians as
we l l .
Evenden (1982, 1988) conducted his study with data
representing the North Shore of Greater Vancouver, an area
comprising three inner suburban municipalities: the City of North
Vancouver and the Districts of North Vancouver and West Vancouver.
His study comprised two major sections, a morphological part and a
behavioral part. The morphological section used a 10 percent random
sample (245 cases) of the building permits of house expansion
projects on the North Shore for the period of 1976 to 1980. He found
that the mean number of new rooms added was 2.7 per project, and
the mean number of existing rooms extended was 1.7 per project.
Most often people added bedrooms and family rooms. In terms of
spatial equivalents, he found that there was the equivalent of 636
average sized new houses built for the period 1976-1980 or 106
new houses per year representing one-fifth of all residential
construction activity by area.
The behavioral part of the study involved sending out a
questionnaire to 203 households, of which 48 percent returned the
questionnaire relating to life cycle stages, household tenure,
neighborhood characteristics and expansion decisions. Evenden found
that a large number of people who expand their houses had children
in elementary school (40%) and many had preschool children (21%)
and secondary school children (21%). Household size was an average
of 3.9 persons with the mean number of children being 1.5. The
length of household tenure before expansion was 12 years and the
time taken to plan and execute the expansion was about 31 months,
or about two and one-half years.
Ill. SUMMARY
This literature review began by looking at the form of a city,
the broad picture. The city may be divided into various components:
the ground plan, land use and building fabric. Numerous combinations
of these three components exist in the landscape and scientific
investigation of them reveals patterns and trends.
The other section of the literature review is a review of the
behavioral decision making model. There are three outcomes of the
model: mobilitylmigration, in-situ adjustment or no action. Many
studies have been done regarding mobility and these were reviewed
with reference to the current thesis. Works on additionlexpansion
projects are less numerous but are more specific to this thesis, and
were reviewed in greater detail.
Chapter 3
Geographic Development of Burnaby
Burnaby, British Columbia was chosen as the study area for
this thesis (figure 3.1). It is located within the Greater Vancouver
Regional District and surrounded by the City of Vancouver to the
west, the City of New Westminster to the southeast, the
municipality of Coquitlam to the east and the City of Port Moody to
the northeast. To the north is Burrard Inlet and to the south the
Fraser River. It is considered one of the inner suburbs of Vancouver
and will be compared to other inner suburbs on the North Shore. The
most prominent use of land in Burnaby is for residential buildings,
most of them being single family dwellings.
Incorporated in 1892, Burnaby was one of the earliest
municipalities to be incorporated in British Columbia. While
municipal status gave Burnaby an identity, the municipality suffered
from the lack of an internal spatial focus, a problem which persists
to the present day. The problem has two principal features, namely,
a fragmented physical geography so far as settlement possibilities
are concerned, and an orientation of activity towards the nodes of
Vancouver and New Westminster.
Overall, the physical landscape of Burnaby is one of hills,
ridges and valleys. The northern half of the municipality is
dominated by the Hastings ridge, an east-west ridge rising steeply
from Burrard Inlet. Burnaby Mountain, the highest point in the
municipality, is located in the northeast section. South of the
Hastings ridge, the Central Valley traverses the municipality,
accommodating Deer Lake and Burnaby Lake, as well as Still Creek
and the Brunette River. This wide shallow valley has been the major
transportation corridor, the site of railways and two provincial
highways. South of the Central Valley, the land rises up to the
Kingsway ridge, which traverses the south-central portion of the
municipality. The final topographic feature is the Big Bend, a low
lying alluvial area along the Fraser River.
The various topographic zones of the municipality relate in a
general way to the pattern of development in the community. The
ridges and their slopes are associated with higher density
residential and commercial development, while the low lying areas,
with their poorer foundation and drainage conditions, are largely
associated with industrial, agricultural and recreational uses.
Moreover, they were developed later in the municipality's history
(Official Community Plan, 1987).
For the first 50 years of its existence, Burnaby was dominated
by its location between the expanding urban centers of Vancouver
and New Westminster. As a transportation corridor between
Vancouver and New Westminster and later as a rural agricultural
area supplying the nearby markets, it has had the reputation of being
a place to pass through, further contributing to the problem of
identity. But it has gradually forged an identity through uniting and
linking its early growth areas, adjacent to New Westminster, along
the B. C. Electric Railway and Kingsway alignments, and along East
Hastings Street in the north. In the 1950s and 60s an intentional
focus was developed at the interchange of Highway 401 and Sperling
Avenue with the establishment of the city hall in that location,
away from the earlier location of Edmonds and Kingsway. The
municipal hall now anchors the institutional center of Burnaby,
surrounded by the art gallery, James Cowan theatre, Heritage
Village, Burnaby Central High School, the courts and R. C. M. P,,
sports complex, a business complex and, more prosaically, the
regional bus depot.
A brief overview will sketch development through four periods.
These may be characterized as the pioneering years (1 858-1 goo),
The early developments of Burnaby have been intimately bound
to the events and development of the two adjacent cities,
Vancouver and New Westminster. When the first pioneers arrived in
the Lower Mainland and the survey crew from England, the Royal
Engineers, set about laying out the streets of New westminster in
1860, Burnaby was still a dense forested witderness. Early accounts
of the area point to the abundant wildlife and teeming streams.
Green (1947:144) states that "beautiful Burnaby owes much of
its loveliness to the attractive Burnaby Lake, the largest lake within
its borders. It was so named in early midsummer of 1859, and so
attractive was it that a pleasure path was cut to its shores from the
embryo city of New Westminster, through the almost impenetrable
jungle of forest undergrowth beneath towering trees from the little
clearing beside the Fraser." Within two months of arrival at New
Westminster, in May 1859, Colonel Moody, of the Royal Engineers,
decided to reside at the lake. Thus the character of south Burnaby
was established early as a place developed out of but away from
New Westminster.
A slow trickle of pioneers came to Burnaby during the Klondike
Gold Rush of the 1860s and sporadic development occurred along
with the extension of the Canadian Pacific Railway (CPR) line from
the original terminus of Port Moody to Vancouver in 1887, through
the area of north Burnaby. South Burnaby developed around the
interurban single track line, built in a NW-SE alignment, along the
Kingsway ridge between New Westminster and Vancouver. After the
inaugural run of the train in October of 1891, land along the route
was subdivided and sold.
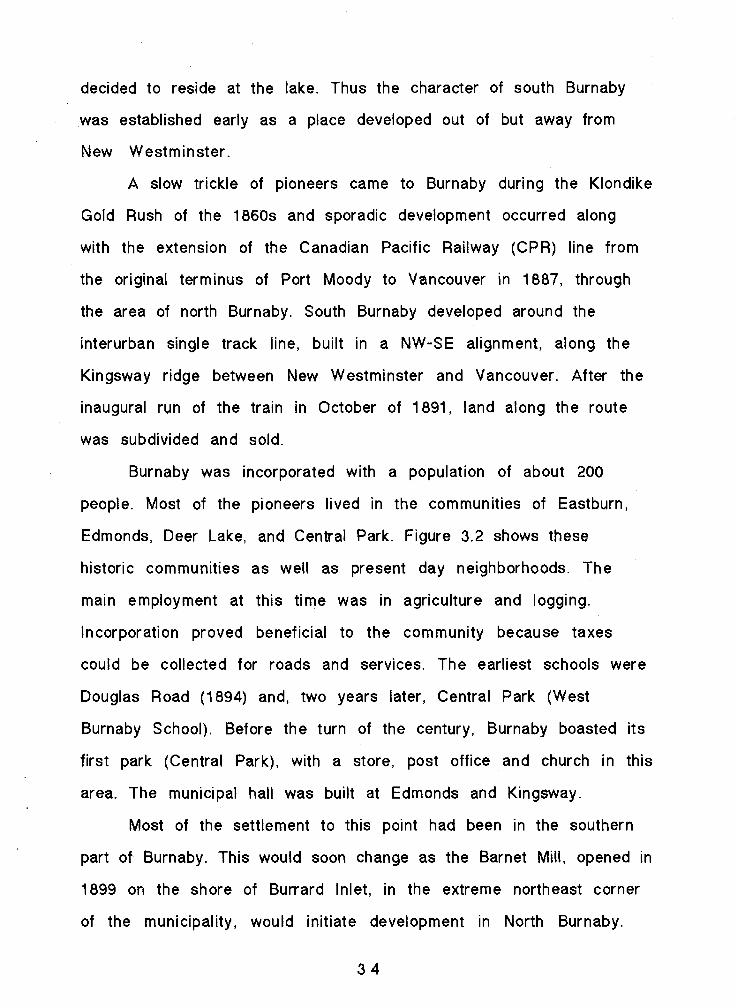
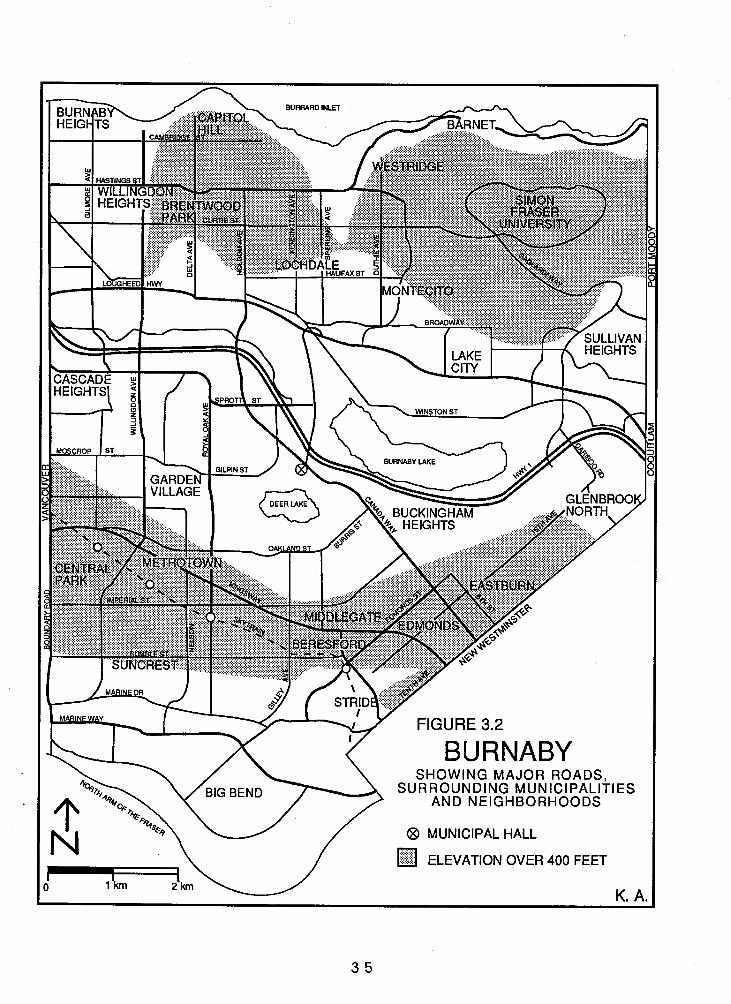
Burnaby was incorporated with a population of about 200
people. Most of the pioneers lived in the communities of Eastburn,
Edmonds, Deer Lake, and Central Park. Figure 3.2 shows these
historic communities as well as present day neighborhoods. The
main employment at this time was in agriculture and logging.
Incorporation proved beneficial to the community because taxes
could be collected for roads and services. The earliest schools were
Douglas Road (1894) and, two years later, Central Park (West
Burnaby School). Before the turn of the century, Burnaby boasted its
first park (Central Park), with a store, post office and church in this
area. The municipal hall was built at Edmonds and Kingsway.
Most of the settlement to this point had been in the southern
part of Burnaby. This would soon change as the Barnet Mill, opened in
1899 on the shore of Burrard Inlet, in the extreme northeast corner
of the municipality, would initiate development in North Burnaby.
11. 1901-1920 GROWTH AND STABILIZATION
By 1900, Burnaby, with a population of approximately 400,
depended mostly on agriculture. Many people owned small to
medium-sized market gardens and the produce was taken by tram or
wagon to Vancouver and New Westminster. Both settlement and
industry were enhanced by the construction of the Great Northern
Railway through central Burnaby in 1904 (just north of Burnaby
Lake).
Real estate developers soon realized the potential of Burnaby
lands located near the boundaries of both Vancouver and New
Westminster. In 1909 developers began to subdivide large tracts of
land. With the completion of the Hastings Tram line (to Holdom) new
subdivisions such as Vancouver Heights (now referred to as Burnaby
Heights) and Capitol Hill sprang up. The municipality experienced
dramatic population increases about this time. In 1908 the
population was about 800. By 1910 this figure had more than
quadrupled to 3500 people. Two years later Burnaby's population was
15,000 (Sone 1987). Figure 3.3 shows the growth of the
municipality's population from 1892 to 1986.
The municipal government continued to spend money on road
building, sidewalks, water works, sewers and even a new municipal
hall. Six more schools were built to keep pace with development
despite a mild recession from 191 2 to 1914.
Growth in the municipality ended abruptly in 191 4 with the
outbreak of war. About 1,200 of Burnaby's men went overseas to
represent this nation. Ninety did not return (Sone 1987) and the
years immediately after the war were difficult as residents coped
1890 1910 1930 1950 1970 1990
YEARS
FIGURE 3.3 POPULATION GROWTH OF BURNABY
1892-1 986
with war losses and financial hardship.
111. 1921-1945 DIVERSIFICATION
Returning soldiers and migrants were attracted to Burnaby by
cheap land and reasonable taxes, so that by 1921 the population had
climbed back up to 13,000. After the war, agriculture became more
diversified. As well as growing vegetables for the nearby urban
markets, farmers engaged in dairy production, chicken and hog
raising and flower growing. Industry also diversified. Logging
became less important as local logs ran out. New industries such as
oil refining began to locate in Burnaby (on the north shore).
Commerciaj shopping districts developed along Kingsway and
Hastings Street.
Development in Burnaby during the 1920s was clustered in the
south and north, areas separated by Burnaby Lake and associated
swamps. North-south routes that were in existence at this time
were North Road (built well before 1903), Boundary Road from
Kingsway to Curtis (before 1903), Douglas Road (before 1903),
Sperling Road (1 905), Royal Oak (1 904-1 91 3), and Cariboo (1 91 2)
although they were all in poor condition. Upgrading of these north-
south routes proceeded during the 1920s and by demand from the
new residents (Burnaby Archives and Council Minute Books). But i t
took years to establish easy road communications between north and
south.
Following the 1929 stock market crash, Burnaby, as well as
the rest of the world, was caught up in the Great Depression. In
December of 1932, the municipality defaulted on its interest on
bonds, and a commissioner was appointed by the provincial
government to govern the municipality (Green 1947). The population
by this time was 24,000.
Arrangements were made to pay interest to bond holders and,
by 1940, the municipality was out of debt. During World War II a
measure of prosperity returned. As the war ended, the 35,000
residents of Burnaby found themselves with housing shortages and
labour turmoil. Restructuring of the economy occurred as taxes,
diverted to military ventures in the previous five years, were
invested in the local infrastructure.
IV. 1946-1 990 SUBURBANIZATION
The suburbanization of Burnaby started in its modern form, and
at a rapid pace, after World War II. Many new households formed,
others moved in, and all these families were looking for places to
live. One subdivision created during this time was Willingdon
Heights. Financed by Central Mortgage and Housing Corporation, and
built by Whitsell Construction and subcontractors, it contained 550
homes with streets, sewers, sidewalks and a church (Green 1947).
Other housing developments settled the west slopes of Burnaby
Mountain (Westridge) and the new subdivisions of Suncrest and
Cascade Heights were established. In 1940 the South Burnaby High
School was built and five years later the North Burnaby High School
was completed. By 1952 Burnaby boasted a fire department, 100 bed
hospital, tax bdsed garbage collection and bus service. The
population stood at 61,000.
A number of apartment buildings were built during the 1950s
and 1960s, and Burnaby became increasingly urban in addition to
suburban. The trend to apartment construction has increased and,
within core areas of Burnaby, accounted for approximately 70
percent of its dwelling unit increase between 1961 and 1981
(Official Community Plan 1987).
A. Population
During the 1970s and 1980s, the growth rate of the
municipality slowed down. Table 3.1 shows the population data for
Burnaby for the last twenty-five years.
Census Population* Average Annual Average Number Increase In Number Year Growth Rate Household of Dwelling of Dwelling Units
for the period (%) Size* UnitsA for the period (%f
Table 3.1 Population and Household Characteristics of Burnaby * last census year shown In row Source: Statistics Canada
Between 1981 and 1986 the annual growth rate for the
municipality had risen measurably to 1.27 from 0.75, to give Burnaby
a population of 1 45,161. Although the average annual growth rate
has increased recently, the average household size has declined,
from 3.6 persons in 1961 to 2.5 persons in 1986. Dwelling units
were also being built at a declining rate. During the period from
1971 to 1976, the number of dwelling units increased by nineteen
percent, while from 1976 to 1981 they increased by 14 percent and
from 1981 to 1986 by only 11 percent. In 1961, 95 percent of the
28,200 housing units in Burnaby were single or two family units
(26,790). In 1981, 59 percent of the 52,615 housing units in Burnaby
were single of two family units (31,043). However, apartment units
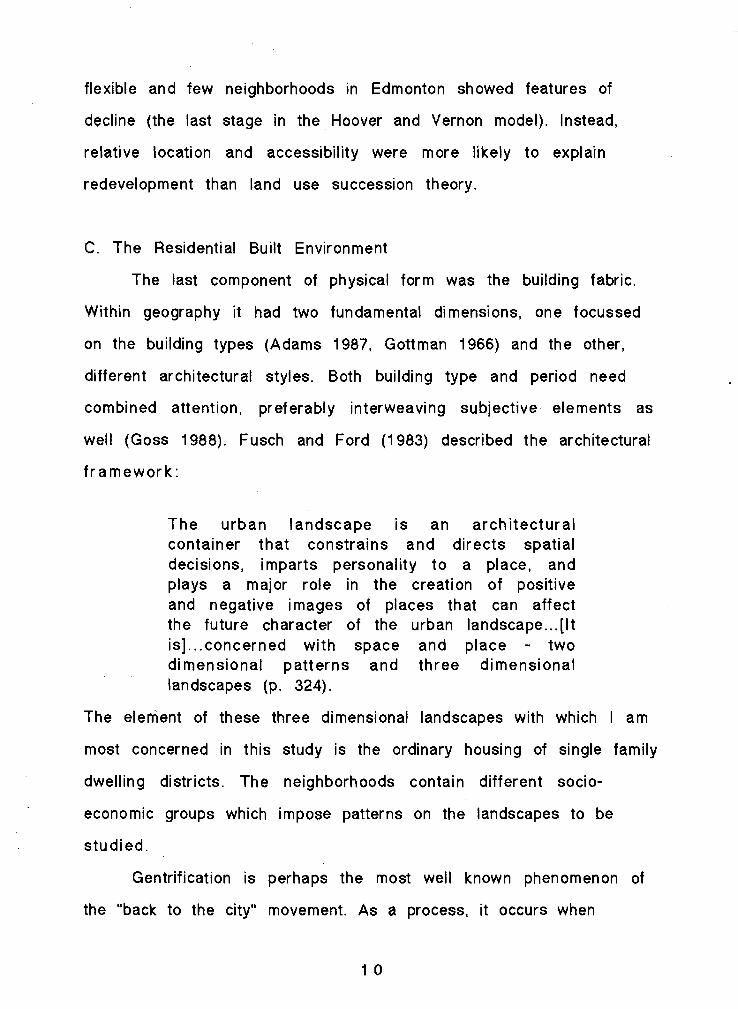
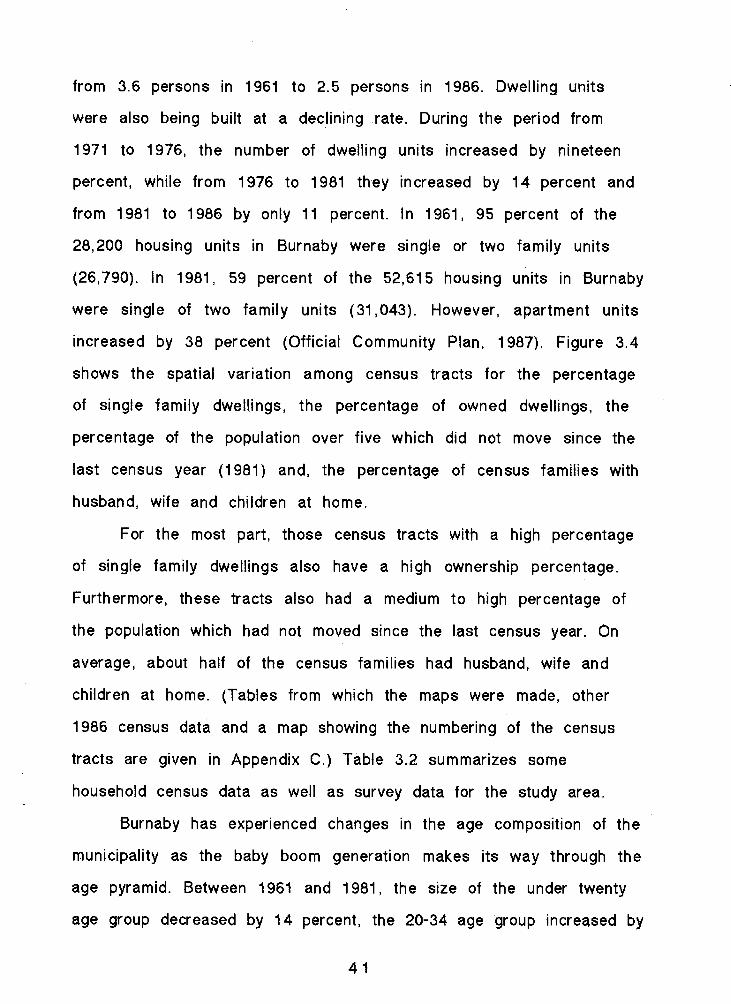
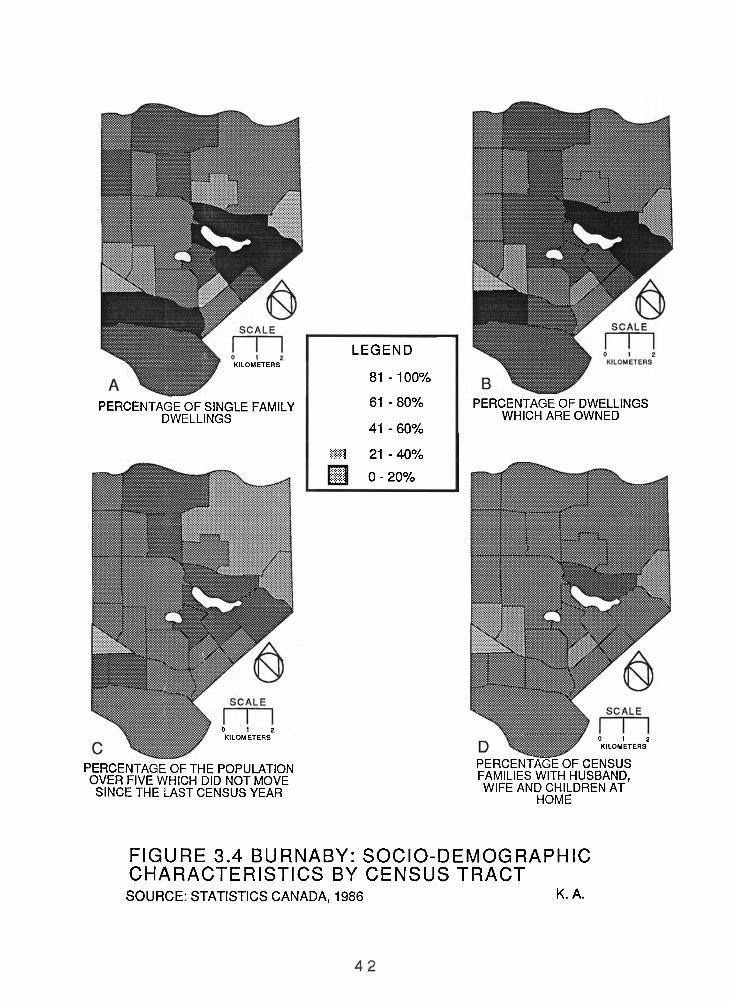
increased by 38 percent (Official Community Plan, 1987). Figure 3.4
shows the spatial variation among census tracts for the percentage
of single family dwellings, the percentage of owned dwellings, the
percentage of the population over five which did not move since the
last census year (1981) and, the percentage of census families with
husband, wife and children at home.
For the most part, those census tracts with a high percentage
of single family dwellings also have a high ownership percentage.
Furthermore, these tracts also had a medium to high percentage of
the population which had not moved since the last census year. On
average, about half of the census families had husband, wife and
children at home. (Tables from which the maps were made, other
1986 census data and a map showing the numbering of the census
tracts are given in Appendix C.) Table 3.2 summarizes some
household census data as well as survey data for the study area.
Burnaby has experienced changes in the age composition of the
municipality as the baby boom generation makes its way through the
age pyramid. Between 1961 and 1981, the size of the under twenty
age group decreased by 14 percent, the 20-34 age group increased by
PERCENTAGE OF SINGLE FAMILY DWELLINGS
0 1 2 KILOMETERS
KILOMETERS
PERCENTAGE OF THE POPULATION OVER FIVE WHICH DID NOT MOVE SINCE THE LAST CENSUS YEAR
LEGEND
81-100%
61-80%
41-60%
........... 21 - 40%
..... 0 -20%
PERCENTAGE OF DWELLINGS WHICH ARE OWNED
0 1 2 KILOMETERS
PERCENTAGE OF CENSUS FAMILIES WITH HUSBAND, WIFE AND CHILDREN AT
HOME
FIGURE 3.4 BURNABY: SOCIO-DEMOGRAPHIC CHARACTERISTICS BY CENSUS TRACT SOURCE: STATISTICS CANADA, 1986 K. A.
A. Census Data
Population Population
% change 1981-1986 Population in
private households Mean number of
personslhousehold Mean number of
personsffami ly Mean number of
children at home
Occupied private dwellings (a)
Occupied single detached dwellings (b)
(b)l(a)XIOO
B. Survey Data Mean number of
personslhousehold Mean number of
adultslhousehold Mean number of
childrenlhousehold Children by age
(as a percent of total) 0-5 years 6-12 years 13-1 8 years
Mean ages of adults M
Table 3.2 Populations, households and dwellings, 1986 Sources: A. Censu3 of Canada, 1986
B. Burnaby - Author's survey 1980-1985
105 percent, the 35-64 age group increased by 41 percent and the
over 65 age group increased by 93 percent. The decrease in the
number of children has led to declining school enrollments and, since
1976, Burnaby has closed eight schools. Moreover there are fewer
children and fewer households containing children. In 1971, 40
percent of all households had no children present but by 1981, this
proportion had risen to 62 percent (Official Community Plan, 1987).
Burnaby's labour force rose from 52,745 in 1971 to 72,660 in
1981. However, Burnaby's total share of the regional employed
labour force declined slightly (1 1.98 to 11.24). There was an
increase in jobs in Burnaby for this same period. Burnaby gained
from a net increase in inter-municipal journey to work movements
- since approximately 6,600 more people came from other parts of the
region to work in Burnaby than people left Burnaby to work outside
the municipality.
The central position of the municipality, in relation to the
Greater Vancouver Regional District should become more important
as time goes on. Since a lot of traffic must pass through Burnaby to
get to downtown Vancouver, from outlying areas, the 'commute' will
become increasingly time consuming and many workers and
businesses will begin to locate elsewhere. Burnaby with its central
location on the Burrard Peninsula will be one of the business
relocation destinations.
6. Development planning and zoning
According to the Official Community Plan, "Burnaby, in
recognition of its physiography and historical development, has
elected to organize its residential areas around four general
geographic sectors, each of which has a town center: Northwest-
Brentwood, Northeast- Lougheed, Southwest- Metrotown, and
Southeast- Edmonds." Metrotown is also the Regional Town Center
for the municipality. Residents have expressed the opinion that the
low density residential areas are one of Burn aby's greatest
strengths and should be protected. Accordingly the maintenance of
the suburban low density single family dwelling and two family
dwelling districts has become an important structuring component
in Burnaby's land use and zoning framework.
The issue of zoning has become significantly more complex
within Burnaby over the years. Early zoning data show some
beginnings towards separation of land uses: residential, industrial
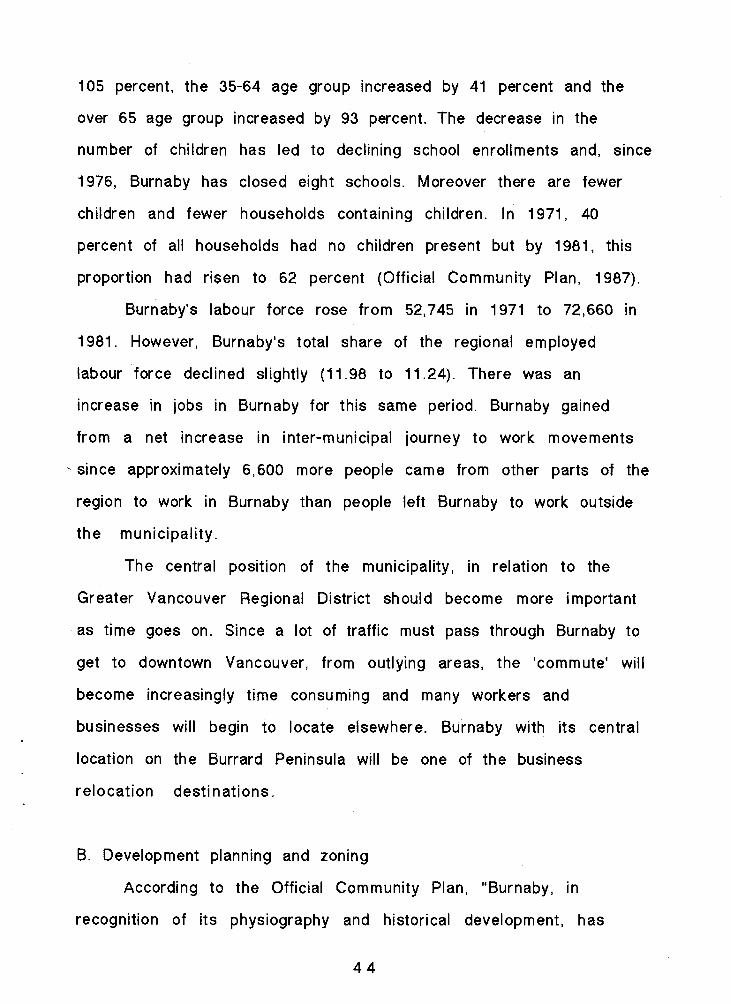
and commercial. A composite map constructed by the author from
archival documents shows the general pattern of land use and zoning
in effect within Burnaby in the 1920s (figure 3.5). But the first
official zoning by-law was not passed until in 1965. By that time
the issues of land use organization had become complex, as shown by
the development of 27 zoning categories. As the municipality has
continued to devetop, the issues have become even more complex and
there are in 1988 some 42 different categories (Burnaby Zoning
Bylaw 1965, amended to Jan 1988). The need to simplify the
regulations is illustrated by a new zoning category, passed in 1972,
called the Comprehensive Development Zone (CD). This allows
combinations of existing zoning categories.
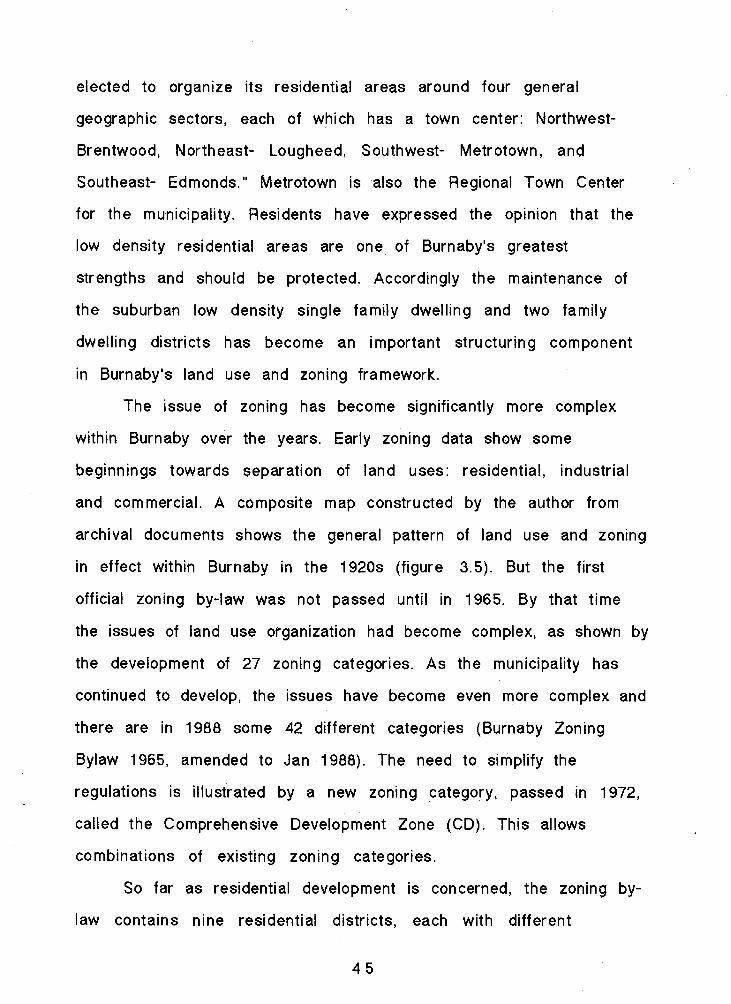
So far as residential development is concerned, the zoning by-
law contains nine residential districts, each with different
LAND U! COMPILED B\ FROM BURNE
regulations which apply to such things as setbacks and lot areas.
However, of the nine zoning categories, only residential districts
one through five and nine (R1-R5, R9) apply solely to single family
dwellings. The others (R6-R8) are for non single family dwellings
such as mobile home parks and group homes. Table 3.3 gives some of
the relevant by-laws for the single family residential zoning
categories. From the table one can see that required setbacks and lot
areas generally get smaller with increasing category number.
However, certain regulations are the same for all categories, such
as maximum height of the building and development density. The
differences between residential zones R2 and R4, and R3 and R5 are
the uses permitted. These institutional regulations provide the
constraints within which dwelling expansions must be contained.
Residential District 9 however, represents a significant
departure from past single family districts. It was devised by the
planning department and approved by council in 1980. It allows the
construction of 2 112 storey houses provided that each lot has an
area of less than 4000 square feet and a width of not less than 40
feet. The lot coverage may still not exceed 40 percent, that is, have
a floor area ratio of 0.60, or 2852 square feet of gross floor area.
There were no houses in the R9 zoning category drawn in the sample
for this study, probably because there would be no space on the lots
to make additions. Most houses built on lots zoned R9 are as big as
the development density by-law allows-2852 square feet. To get a
feel for the average sizes of houses within the sample, 2852 square
feet is considerably smaller than 12 percent of the pre-expansion
houses and 32 percent of the post-expansion houses. Such a small lot
(7212 sq ft) (61 ft)
(6028 sq ft) (49 ft) I
R 3
Development aenslrv' 590 m2 (6350 sq ft) of gross floor area
440 m2 (4736 sq ft) of gross floor area
370 m2 (3982 sq ft) of gross noorzrrea 440 m2 (4736 sq ft) of gross floor area
370 m2 (3982 sq ft) of gross floor area
265 m2 (2852 sq ft) of gross floor area
560 m2 (6028 sq ft)
R 9
Front yarGwa&
9 m (30 ft)
15 m (49 ft)
7.5 m (25 ft)
372 m2 (4000 sq ft)
6 m (20 ft)
12.2 m 140 ft)
Side - 2.4 m (8 ft) 4.5 m comr bt
1.5 m (4 ft) 3.5 m comer lot
1.5 m (4 ft) 3 m corner lot
1.5 m (4 ft) 3.5 m corner lot
1.5 m
(4 ft) 3 m corner lot
1.2 m (4 ft) 1.8 m carner lot
Rear Yard Setback
9 m (30 ft)
9 m (30 ft)
7.5 m (25 ft)
7.5 m (25 ft)
7.5 m (25 ft)
Table 3.3 Zoning Bylaws for Various Residential Zaning Categories V o t coverage may not exceed 40% for all residential categories. This translates into different floor area maxima, because lot sizes vary. Source: Burnaby Zoning Bylaw 1965.
would limit households from making additions to their houses.
Consequently, there may be a trend towards fewer additions as lot
sizes get smaller. In contrast, there were 12 post-expansion houses
in the sample for this study which were bigger than 3982 square
feet (the maximum size limit for R3 and R5). Most were located
within the size limit of the R 4 zone which allows houses up to 4736
square feet. The trend seems to be towards larger houses on smaller
lots, a trend supported by the activity of expanding already existing
dwell ings.
The houses sampled in this study were located primarily in
residential zoning categories one through five (RI-R5), with a few
within the Comprehensive Development Zone (CD). Figure 3.6 shows
the location of these zoning districts. From this map and by
referring to table 3.4 one can see that over 60 per cent of the houses
sampled were built on lots zoned R5 and R2 which contained 63
percent of the residential land area. These two zoning categories are
shown in the darker shades on figure 3.6. There is less land zoned R1
and R3, only 17 percent, which contained 14 percent of the houses
sampled. Since there is less land in these two categories, they are
shown in lighter shades in figure 3.6. The close correspondence of
sample areas and areas by zoning category spatially confirms the
even spread of the sample across residential areas (table 3.4).
There are many factors which affect a household living in
Burnaby. The forces which shape this community come from past
decisions made as well as from the physical landscape. Burnaby will
continue to develop residential, commercial and industrial land uses
through infill and redevelopment of existing uses. Each change will
affect the way the households view their municipality, community,
neighborhood and dwelling. The decision of a household to move or
stay, and perhaps to build, gives some indication of the feelings
within the population of how spatially to adjust their developing
circumstances. Exactly what households do with their houses, should
they elect to stay rather than move, is the topic of the next chapter.
R5 ZONING
R2 ZONING
R4 ZONING
R1 ZONING
R3 ZONING
COMPREHENSIVE DEVELOPMENT (CD) ZONE
Non-residential zoning
*See in conjunction with FIGURE 3.6 RESIDENTIAL ZONING MAP, 1980 table4.3 Source: Burnaby Zoning Bylaw and author's survey 11 A
Residential Percentage of Percentage of Residential Zoning Sample Within Land in Burnaby
Category* Zoning Category Within Zoning Category
R 1 7 .3 9.8
R2 26 .7 27 .9
R 3 6 . 4 7.1
R 4 1 9 . 4 17 .2
R 5 3 7 . 0 3 5 . 8
R6 0 * *
R8 0 * *
R9 0 1.6
cn 3.1 0.6
To ta l 98 .9# 1 0 0
Table 3.4 Percentage of Sample and Residential Land within Residential Zoning Categories Source: Author's survey and data base from Burnaby Municipal Hall.
* There is no land actually zoned R7 in Burnaby although the category exists. ** Smaller than 0.05.
# Does not equal 100% since three houses were located in agricultural and manufacturing dist rict,s.
Chapter 4
The Morphological Characteristics of Expansions
I. METHODS
The methods used in obtaining information for this study may
be divided into two types. Information was obtained from building
permits and from questionnaires. Results are divided according to
life cycle stages and, where applicable, compared to a precedent
study conducted on the North Shore.
A. Building Permits
This section describes the physical characteristics of house
expansion. Data for this analysis were obtained from public files
maintained by the Burnaby Building Department. A "basic list" of
1,226 permits were numbered in sequence, and a 20 per cent random
sample was drawn, for a total sample size of 245.
The total number of permits, (including renovations, new
buildings and demolitions), the permits issued for additions only,
and the percentage of building permits that were additions for each
year, is given in table 4.1. The relationship of addition permits to
general permits issued shows that they follow the same basic
pattern. Thus additions to existing dwellings may be seen to have
been especially important during the early part of the study period
and indeed, they maintained their importance throughout.
The information for each house was recorded (see appendix A
for sample forms) and was later transferred to a master
spreadsheet document. Permits contain the name and address of the
Year Total Number Total Number Percentage of Addition of Permits of Addition Permits within Each Year's
Issued* Permits Total Building Permits
Table 4.1 The Number of Addition Permits and Total Permi ts * Permits for renovations, additions, new buildings and demolitions Source: Summary files at the Burnaby Municipal Hall
permit holder, the legal description of the property, the dimensions
of the addition, (usually in feet, although six additions in 1986 used
meters), the intended use of rooms and the estimated cost of the
addition. In order to obtain a permit, the builder or owner must
submit a drawing of the expansion project and have it pass
inspection. These drawings are essential for extracting information
on the pre-expansion areas of houses and the areas of additions.
However, the qhality of the drawings varies significantly, since the
permit holder is not required to provide professionally prepared
blueprints. Some expansion projects, usually the smaller ones,
include only rough drawings of the space to be added; not the rest of
the house.
Other contextual information such as lot zoning, lot size, and
age of house were recorded to round out the complete record of each
addition project insofar as it could be determined from the records.
A sketch of the house with the expansion project highlighted was
included on the back of each individual study record sheet for
identification and descriptive purposes. In some cases, however,
building data were incomplete and blueprints were missing. Thus the
final sample included only the 232 building permits which contained
complete records of the house. Figure 4.1 shows the distribution of
the sample for completed building permits. The sample is spread
evenly throughout all residential areas of Burnaby, as indicated in
table 3.4.
2. Questionnaire
A questionnaire was devised based on Evenden's North Shore
study and other sources (example in appendix A). The questionnaire
package contained a self-addressed, stamped envelope.
Questionnaires were mailed to all sample households (232) on
November 1,1989. On November 27,1989 a further 134 reminder
letters, including another copy of the questionnaire, were sent to
those households which had not yet responded. Figure 4.2 shows the
pattern of responses. Over the two mailings, a total of 105 useable
questionnaires was returned, for a response rate of 45 per cent.
The questionnaire was divided into four major sections. The
first dealt with house characteristics and details about the
expansion project. Secondly, it contained questions about family and
household characteristics, such as the number of people in the house
and their ages. The third section dealt with household tenure and
journey to work. The fourth section contained questions about
e . * s 8 @ ? . .
0 0 (8
8 8
.
LEGEND
. ONE SAMPLE HOUSE
COMPLETED QUESTIONNAIRE (N=lO5)
FIGURE 4.1 DlSTRlBUTlON OF SAMPLE AND HOUSEHOLD:
-CH RETURNED QUESTIONNAIRE Source: Building permits and author's survey K. P
< N O ~ V a W - A " - N N N N N N N N O A P V I Q ) V o D A A - L - - O P V I Q ) - J O A N O P V C O W O - N W P V I
#
DATE RECEIVED FINAL RESPONSE: Date of first mailing, 232 sent. 105 completed questionnaires
# Date of second mailing, 134 sent. Had received 80 completed questionnaires.
31 returned incomplete 96 no response
FIGURE 4.2 RESPONSE TO MAILED QUESTIONNAIRE SURVEY: CUMULATIVE FREQUENCY
expansion decisions and project details. It treated such aspects as
why moving was rejected and how long the project took.
The answers from the returned questionnaires were coded and
tabulated. The spatial distribution of households which returned the
questionnaire is shown, in relation to the total sample, in figure 4.1.
Three households removed the code by which location was recorded,
and are thus not shown on the map.
Households which answered the questionnaire were grouped
according to life cycle stage using the answers given in the section
on the decade of adults' birth and the years of children's birth.
Stages in the family life cycle used here were suggested by Duvall
(1967), and have been applied to housing expansion studies in
Australia (MCLeod and Ellis 1982), and Vancouver (Evenden
1982,1988). Duvall's classification is used because it emphasizes
stages of child development, and it is thought that the spatial needs
of the family are closely tied to the maturation stage of the oldest
child. This is based on the argument that the space needs for the
oldest child 'set the stage' fbr younger siblings, in that the parents
project the future needs of space for younger siblings from the
experience of providing for the needs of the oldest child. Table 4.2
lists the stages and their description as well as the number of
households in each stage from this study.
Stage Descript ion Percent in Each Stage:
Burnaby Data
1. single, age of head less than 35 years, no children. 0 2. couple, age of head less than 35 years, no children. 7 3. couple, age of eldest child less than 6 years. 1 5 4. couple, age of eldest child between 6 and 12 years. 2 0 5. couple, age of eldest child between 13 and 17 years. 1 8 6. couple, age of head 35 years or above, no children. 3 7 7. single, age of head 35 years or above, no children. 3 8. singkparent family. 0
1 OO%(95)
Table 4.2 Life-Cycle Stages (after Duvall) with the Percent within Each Stage
Only stages 2-7 were represented among the cases sampled.
The total number of respondents used in this section was 95; less
than the 105 questionnaires received, since respondents who did not
indicate the decade of adult's birth or the years of children's births
could not be classified into a life cycle stage.
The relationship between life cycle and the propensity to
expand dwellings may be examined at a general level by combining
stages 2-5 and 6-7 into two basic groups. Group one (stages 2-5)
has children under 18 years of age or is probably expecting to have
children soon; therefore this group will be referred to as the group
'with children'. Group two (stages 6 & 7) has the eldest child over 18
years of age, or adult children or no children. For the purposes of
this study those households will be referred to as having 'no
children'. By this scheme, fifty-seven households (60%) had children
and 38 households (40%) had no children.
C. North Shore
A study done by Evenden (1982, 1988) on the North Shore of
Vancouver is referred to in this chapter and the following chapter
for comparative purposes. That study involved the three inner
suburban municipalities of North Vancouver City, North Vancouver
District and West Vancouver District. Collectively they are similar
to Burnaby in population size, housing characteristics and inner
suburban status. The data were taken from the time period 1975-
1980, just ahead of the time frame for the present study, 1980-
1985.
D. Rationale Behind Variables
The variables used in the morphological part of the study focus
on the physical aspects of the house. Enquiry was made into aspect
and orientation of the addition, to focus on the relationship to
cardinal directions and sun factors. The actual space added was then
analyzed within frameworks; the amount of space added, aggregate
space, the partitioning of the space and the function of the space. It
was thought that each household would use the space differently,
although patterns may begin to emerge by grouping households into
life cycle stages.
In the behavioral part of the study, variables focussed on the
households. The number of persons in the house and their ages were
thought to have some bearing on the need to expand the house.
Previous household location and journey to work characteristics
were studied as these variables have an impact on moving or staying
decisions. Enquiry was made into the decisions leading up to the
expansion project as well as involvement along the way to provide
insight into the addition itself.
11. RESULTS
This section describes the morphological characteristics of
expansions. The first section is a discussion of house site
characteristics, referring specifically to the external directional
relationships of expansions with cardinal directions or house
orientation and position on the lot. Results show that additions are
poorly correlated with cardinal directions but strongly related to
zoning bylaws, pre-existing house shapes, lot shapes and sizes.
Aggregate space, treated in the second section, sum marizss the
amounts of space added. A spatial distribution of the largest and
smallest houses and additions is illustrated in this section. The
third and fourth sections focus on how space was utilized within a
house. Projects were differentiated between those adding rooms and
those extending existing rooms. The fourth section analyzes the
function of the added space.
1. House and Expansion Site
Aspect, following Evenden's definition, is the relationship of
the addition to cardinal directions i.e. in which direction does the
expansion protrude from the pre-existing dwelling. Some expansions
had more than one component, on different sides of the house, and in
such cases more than one entry was made in the record. In other
cases, notably those in which full basements and full second storeys
were constructed, all directions were implied but no directions
could be clearly identified in the expansion. No notations regarding
aspect were made in such cases.
Based on a traditional idea in northern hemisphere settlement
geography, and on the field observation that some expansions
emphasize window and deck areas on the south and west sides, it
was thought that there would be significant trends towards
additions being built on the south and west faces of the house to
take advantage of the sun. Data on aspect of expansions is
summarized in tabular and diagrammatic form in figure 4.3. This
figure shows a balance between the cardinal directions (N, S, E, W)
in both Burnaby and the North Shore. In Burnaby, the directions with
the most additions were to the north (25%) and to the south (23%).
East and west directions also seem to balance with both having 14
percent of additions. Since this did not reveal any relationship with
the sunny side of the house, it was thought that perhaps corners and
sides grouped together would show a relationship. Thus in part A of
figure 4.5 the totals for three adjacent values centered on cardinal
points are grouped together. For example, the total given under the
"north" column (75 additions) is actually made up of additions which
were built to the northwest, north and northeast (16+50+9=75). Of
the 252 additions, this "north group" made up 30 percent of the
additions. The percentages from the columns above do not add to the
columns in part A because overlap occurs between categories. That
is, the "east group" uses additions listed as northeast, east and
southeast. For section A, there seems to be a slight tendency for
additions to be built to the north of the house (30%) although the
south side is prominent (28%). Part B of figure 4.5 uses the same
procedure as part A except this time centering the values on
diagonal points. This reveals a very even balance between the
diagonal points. Part C shows the results of part A in diagrammatic
form. The width of the line is proportional to the percentage size.
There are at least two explanations for the balance of
directions. The first explanation relates to the aspect of original
house on the lot. The direction of building additions is constrained
by the siting of the house on the lot. Due to the street alignment of
many areas in Burnaby, most houses face N-S-E-W already (as
opposed to NW, NE, SW, or SE). Thus the simple additions to the side
or back of a house would continue this pattern. In this way aspect
Table 4.3 Orientation - A Comparison Among Burnaby Households, Those With Children and Those Without, and The North Shore * Percent in parentheses
Most additions were built to the rear of the houses. This was
followed by sides; the front was least common. Households without
children built onto the rear of the houses most often (71%) and
rarely to the front of the houses. On the North Shore, the orientation
of the additions was more evenly distributed among the front, back
and sides, although front was the most dominant (41%). Although the
trend is the same between the two areas, it is more pronounced in
Burnaby.
The data were examined to determine whether there was a
relationship between aspect and orientation and those uses which
require the sun (eg.-solariums, sunrooms, greenhouse, hothouse and
plantroom) to be discussed more fully below. There seems to be
some relationship since 62 percent of these additions were to the
south, west or southwest while only eighteen percent of these
additions were to the north, east or northeast. However, all north
additions were to the rear of the houses, pointing out the interplay
between aspect and orientation.
Site characteristics partially explain the reason for one side
of the house to appeal as an expansion point. Some people like the
look of the house from the front. In other cases it may be that the
rear of the lot contains the space for expansions. Aspect, orientation
and zoning influence the siting of the house and expansion decisions.
Future research will give more insight into people's feelings and
behavior towards their houses with respect to the sun, house
fa~ades and zoning setbacks.
B. Aggregate Space
Aggregate space is a measure of the total amount of floor
space added to the houses during expansion projects. Table 4.4
indicates the aggregate figure for Burnaby, first as a whole, then
divided into those households with children and those without
children and compared to the North Shore.
Burnaby" With Without Children Children
Pre-expansion area To ta l 455040 Mean 201 4 Median 1997 Range 465-5746 N 226
Addition area To ta l 124885 Mean 550 Median 339 Range 6-3008 PJ 227
Post-expansion area To ta l 579747 Mean 2565 Median 2422 Range 750-6074 N 226
North Shore
4521 09 1868 I833
Table 4.4 Aggregate Space - A Comparison Among Burnaby Housheolds, Those With Children and Those Without, and the North Shore * All figures given in square feet.
# The data from these two columns, 95 households, are those who fully completed the questionnaire, which included adult's ages and children's ages for life cycle categorization.
This table displays the pre-expansion areas, addition areas,
and post-expansion areas of houses in this sample. In most cases the
means are higher than the medians, indicating a tendency to a
skewed distribution to the right. That is, within the sample there
were some extremely large pre-expansion houses and additions to
increase the size of the mean as compared to the median. The range
of values given for Burnaby as a whole indicate that the pre-
expansion sizes of some houses is extreme, quite small to quite
large. The underlined figures in the table indicate that some of the
largest additions are bigger than the smallest houses. Some permits
were issued for very small projects, (6 sq. ft) such as a bay window.
By referring to the figures in bold, one can see that the means and
medians for pre-expansion areas, additions areas and post-expansion
areas were higher for those households with children than for those
without children. These results indicate that the two groups started
out with fairly similar sized houses, those households with children
added bigger additions and consequent1 y ended up with significantly
larger houses. The North Shore compares most closely to those
households without children, although all means and medians are
smaller than in the Burnaby data. Households on the North Shore, for
the most part, had smaller houses and added smaller additions.
Aggregate space is hard to envision when given as a sum total.
In terms of what it means to the housing stock in Burnaby, an
illustration might make this more clear. If all the householdsl in
Burnaby were making additions, how much space would be added to
each house? There were 26,845 occupied single detached dwellings
in Burnaby in 1986. If sample data were to be extrapolated, it would
be seen that about 624,425 square feet were added in total across
all projects over the study period. Thus, it can be seen that this
activity would add about 23 square feet to each house, or a space
measuring 4.8 feet by 4.8 feet. In comparison, the space added to
each house on the North Shore was 37 square feet, 6.1 feet square.
This seems to contradict statements made earlier that North Shore
had smaller houses and made smaller additions. However it does not,
since there were more expansion projects for the five year time
period, providing, collectively, more space.
Another illustration of the overall magnitude of expansions
would be to express additional space in terms of mean house
equivalents. If the extrapolated area of additions (624,425 sq ft) is
taken in terms of the mean pre-expansion size of houses (2014 sq
ft), then the number of house equivalents would be 310. Over the six
year study period this would represent the addition of just over 50
house equivalents annually to the housing stock. If the same
calculation is made on the basis of post-expansidn sizes of the
dwelling, then the number of house equivalents would be 243 or 41
per year. By comparison, the house equivalents for the North Shore
were considerably higher: 100 house equivalents per year for pre-
expansion size and 82 house equivalents per year for post-expansion
site. This shows the considerable magnitude of building of additions
that was going on in Burnaby during the period of 1980-1985 and the
North Shore, 1975 -1980.
Distributional characteristics of expansion activity, by size in
relation to pre-existing dwellings, may be analyzed with reference
to figures 4.4 to 4.9. Pre-expansion areas, addition areas and ratios
(of addition area to pre-expansion area) are spatially shown by
quartile distributions. Some clustering occurs. The dotted area on
figure 4.4 isolates an area with a predominance of large and fairly
large houses (over 1998 sq ft). However the same area in figure 4.5
exhibits small and fairly small additions (under 351 sq ft). Thus in
this area large houses have small additions.
All ratios are shown on figure 4.6. Figures 4.7 to 4.9 display
large (over 0.19), medium (0.09 to 0.44) and small (under 0.18)
ratios to better identify groupings within areas. Figure 4.7 indicates
a group of houses with large ratios (> 0.19) in the areas of Burnaby
Heights and Capitol Hill. (Refer to figure 3.1 for neighborhood
locations.) This indicates small to medium sized houses with large
additions. Other areas which have large ratios are around Canada
Way and South Burnaby.
Figure 4.8 shows those houses with medium ratios (0.09-0.44).
These are large houses with medium-sized additions, and medium-
sized houses with medium-sized additions. A large cluster is
located near the dotted line, north central area, the Garden Village
neighborhood and in southwestern Burnaby.
A final map (figure 4.9) shows the distribution of houses with
small ratios. These are large houses with small additions and
medium-sized houses with small additions. Clusters are seen around
Brentwood Park, Lochdale, Cascade Heights and Suncrest. Within the
dotted circle area, referred to above, small additions predominate.
The level on which the addition was made is another way in
which space can be analyzed. Most house expansions occur on the
main living level (53%). Basement level is next (37%) and upstairs
last (16%). There were houses with additions to more than one level,
and in the case of split level homes, this classification scheme was
difficult. On the North Shore the respective figures are 58%, 14%,
and 28%. More homeowners on the North Shore added more space
e
\
0 A
(
1
p e
-
1346-1 997 sq ft
1 d345sqf t
(QUARTILE DISTRIBUTION)
FIGURE 4.4 PRE-EXPANSION AREAS
Source: author's survey K. A.
TO PRE-EXPANSION AREAS Source: author's survey K. A.
(QUARTILE DISTRIBUTION)
LEGEND
(QUARTILE DISTRIBUTION)
upstairs and less in basements. The underlying reasons for level of
expansion decisions are more fully explored in chapter six.
C. Partitioned Space
Dwellings comprise not only aggregate space but also
partitioned space. Houses may tend to open plans or may be
internally characterized by rooms which can be closed off. The
utility trade-off would seem to be between flexibility and privacy.
Each household must design the space which best suits its needs and
desires.
The idea of expanding the house to create more space stands in
contrast to the idea of subdividing space. Yet the two are not
completely separate in the expansion project. The addition of a room
accomplishes a private space while an extension to an existing room
only adds to the existing space. Table 4.5 illustrates partitioned
space for Burnaby, as a whole, those Burnaby households with
children and those without children and the North Shore.
Partitioned space describes how rooms are arranged in the
expansion project and as related to preexisting spaces. Table 4.5
shows that households in Burnaby added slightly more rooms per
project than those households on the North Shore. However, they
extended the same number of rooms per project. Fewer households
with children added one room projects, and more added several
rooms, bringing the number of rooms added per project for this group
to 3.8, in contrast to 2.8 for households without children. Similarly,
the households with children extended more single rooms than did
Burnaby W i th Without Children Children
3ooms Added T o t a l 5 4 1 1 7 4 7 9 Projects adding rooms:
Number 1 8 2 4 6 2 8 Percentage 8 O* 8 1 7 4
Mean Number of rooms per project 3 .0 3.8 2 .8
3ooms Extended T o t a l 1 3 3 3 3 2 1 Projects extending rooms:
Number 8 3 1 9 1 5 Percentage 3 6 3 3 3 9
Mean number per project 1.6 1.7 1 . 4
'rojects Both Adding 4nd Extending Rooms
Total number 3 7 8 5 Percentage 1 6 1 4 1 3
North Shore
5 0 2
1 9 5 7 9
2 .6
1 3 3
8 3 3 4 1 .6
3 5 1 4
rable 4.5 Partitioned Space - A Comparison Among Burnaby iouseholds, Those With Children and Those Without, and the aorth Shore
Calculated-Number of projects adding rooms (182), divided by the total sample number in lurnaby (227) and multiplied by 100. The total sample number for those households with hildren is 57 and for those wkhout children, 38. The total sample number in the North Shore is ' 4 7 .
the households without children. Young couples usually add rooms in
order to get more space and privacy. For older couples without
children, extending a room seems to be an attractive way to increase
space while enhancing flexibility of current rooms and maintaining
the same degree of privacy as before the expansion.
D. Functional Space
Spaces are added for different uses. Some may be quite
flexible and change over time, such as when a bedroom is converted
to an office. Others, such as bathrooms and kitchens, generally
remain functionally stable, their special fixtures making any change
costly and impractical. The use of a room is reflected in its name.
Sometimes the name indicates that the household feels quite
ambiguous towards certain rooms in the house (Giuliani 1987). There
were 53 terms used by householders to describe rooms in this
sample (a full list is given in appendix C). This number was
classified according to the list of eight categories used in the North
Shore study (table 4.6).
Bedrooms, general activity family rooms, bathrooms and public
rooms together comprised almost 70 percent of all additions.
Additions of bedrooms were overwhelmingly the most popular both
in Burnaby in total, those households with children, and the North
Shore. Only those households without children built another room
more often than bedrooms or general activity family rooms.
Usually the master bedroom in the modern house has an
'ensuite bathroom' while the other bedrooms share a second
bathroom. Thus the construction of new bathrooms and the
remodelling of existing ones commonly accompanies the addition of
new bedrooms. For Burnaby, one new bathroom was built, or an
existing one expanded for the addition of every 1.7 bedrooms. This
figure was higher for the North Shore, at 2.3. For those households
with children, one new bathroom was built for every 2.2 bedrooms,
while for those households without children one new bathroom was
built for every 0.9 bedrooms.
Burnaby Wi th Without Children Children
Bedroom 2 5 2 8 1 8
G. A. F. R.* 1 7 1 6 1 3
Bathroom 1 5 1 3 2 1
Public Room 1 2 1 3 1 1
Kitchen 9 9 1 2
Utility Room 7 6 1 1
Unfinished/unknown 6 6 6
Hallway/entrance 5 5 6
S. A. F. R.# 5 5 3
Total 101 (691) 101 (205) 101 (1 04)
North
Shore
3 0
1 5
1 3
1 2
8
9
1
7
5
1 OO(645)
Table 4.6 Functional Space - A Comparison Among Burnaby Households, Those With Children and Those Without, and the North Shore * General activity family room
#specialized activity family room
The sharing of bedrooms by children in the household and the
perceived need for privacy accounts for the increase in bedrooms
additions. Table 4.7 indicates that over half of children in this
survey have never shared bedrooms. Cultural norms in our society
cause households to perceive the need for every child to have his or
her own bedroom by a certain age (Gladhart 1973). Cultural
pressures of this kind appear to be evident in Burnaby, in that 89 per
cent of children have separate bedrooms, now, and over half (53%)
never had to share a bedroom in this house. Rising affluence and
house standards and decreasing household size is making this
possible for more families.
Households Households Burnaby Wi th Without
Children Children Children
*Separate Bedrooms 89% 88% -
Children Never Shared Bedrooms 53% 53% 52%
Table 4.7 Sharing Bedrooms - A Comparison among Households, Those With children and Those Without, and The North Shore
North Shore
89%
57%
Burnaby
General activity family rooms such as dens, family rooms,
recreation rooms, and sun rooms comprised the next most popular
addition for Burnaby, those households with children, and the North
Shore. These are all-purpose common rooms and usually the
television is located in one of them. Public rooms, including the
living and dining rooms, refer to areas where guests would be
entertained. There were more dining rooms added and extended than
living rooms. While everyday family eating may be done in the
kitchen, there is an urge to create a space for formal dining, or as
one person called it "more gracious living".
As well as being enlarged, kitchens and bathrooms are usually
remodelled in order to renew appliances and fixtures. A number of
kitchen expansions contained the addition of eating areas, or nooks.
Storage space for varied and sophisticated pieces of kitchen
equipment is also at a premium, and expansion projects commonly
included more storage space for these items.
The remaining categories are less frequently represented. They
refer, for example to a new trend toward 'health rooms' or 'spas', or
office space in the home (sometimes to house the newly acquired
home computer), or 'indoor gardening'. Other public spaces such as
entrances and hallways may have been underbuilt in the first
construction, and are often expanded with other rooms in the house.
The first priority for the household seems to be enlarging the basic
and common rooms before adding specialized rooms.
This chapter outlined the physical characteristics of house
expansion. The addition was characterized in terms of its
positioning within the building envelope, the quantity of space
added, its partitioning and its use. The next chapter is a discussion
of the characteristics of the households which built the additions
and expansions.
Chapter 5
The Behavioral Characteristics of Households
This chapter considers the behavioral characteristics of the
households in relation to their decisions to expand their dwellings.
The information drawn from questionnaires refers to house
characteristics, family characteristics, household tenure, journey to
work and expansion decisions. Data from the questionnaire are
grouped together into lif e-cycle stages to compare households with
children and those without to determine whether these two groups
make different types of additions to their houses. A final part looks
in depth at the older folk without children (stage six in the life
cycle).
The age structure is fundamental to the examination of the life
cycle and table 5.1 gives some demographic characteristics of
sample households. The number of persons in a house is presumed to
have some bearing upon the need to expand the house. For those
households sampled, in Burnaby, the mean number of persons in a
house was 3.8. The different average household sizes is accentuated
in the middle two columns, with those households with children
having 4.2 persons and those households without children having on
average 3.1 persons.
The mean number of adults is 2.4 per household. However those
households with children had on average 2.2 adults while the other
had on average 2.8 adults, the figures being influenced by adult
children still living at home. The average age of adult was the mid-
forties white a decade ago on the North Shore they were in their
Burnaby Wi th Eldest Children Child Over
Under 18 Yrs 18 Yrs
Mean Number of Persons 3.8 4.2 3.1 in Household
Mean Number of Adu l ts 2 .4 2.2 2.8
Mean Age of Adul t -male 47 yrs 43 yrs 55 yrs
- female 44 yrs 37 yrs 52 yrs Mean Number of
Children 1 .2 2.1 0.3
North Shore
3.9
2.4
44 yrs 42 yrs
1.6
Table 5 .1 Demographic Characteristics - A Comparison Among Burnaby Households, those With children and Those Without, and the North Shore
early forties. The mean number of children was a little less in
Burnaby than in the North Shore. Big differences emerged when the
Burnaby results were divided into those households with children
under 18 years old, 2.1 children per household and those with the
eldest child over 18 years old, 0.3 per household.
Most households in the sample had moved a relatively short
distance from their previous dwelling to the present one. Table 5.2
gives the previous locations of households.
Burnaby 36% Vancouver 43% Other Lower Mainland 7% Rest of B.C. 4% Out of ProvincelCountry 1 0% Tota l 100%
Table 5.2 Previous Locations of Households
Vancouver was the most important previous location (43%),
representing a suburbanizing tendency. Given the travel times and
distances in Vancouver and Burnaby, it can be seen that people in
this group could switch residence without changing access to jobs
and city amenities. Moreover, over one third of the households moved
from another location within Burnaby. Ten percent moved to Burnaby
from out of the province or country. (A full listing of all previous
locations is given in appendix B).
A multiple choice question was used to elicit responses to the
question "Why did you choose to live in this house?" The respondent
could pick as many answers as applicable and add other reasons as
comments. Table 5.3 indicates how frequently each answer was
chosen.
a) you liked the house b) you liked the neighborhood c) there was good
house market potential d) the journey to work
was convenient e) the price was right f) other/comments
To ta l
W i th Without Burnaby Children Children
19% 20% 22% 28% 29% 31%
Table 5.3 Reasons Given For House Choice - A Comparison Among Burnaby Households With Children and Those Without
The most frequent reason given for the choice of house was
neighborhood characteristics. The next three reasons given are
8 3
grouped fairly closely in priority for Burnaby as a whole and by
those households with children and those without. The reasons are:
they liked the house, the journey to work was convenient and the
price was right. The houses' market potential did not emerge as a
conscious choice for choosing the house. This means that households
were for the most part looking for a place to reside for a number of
years and not looking just for an investment. Other reasons for house
choice mentioned in the comments section were: "close to relatives",
"large yard", and the "view". Four of the five who mentioned views
lived in North Burnaby with vistas of the North Shore mountains. The
other one overlooked Burnaby Lake.
The journey to work is important to the choice of a residence.
A recent article by Doorne and van Rietbergen (1990) stresses
interrelationships among labour mobility, residential mobility and
home-work travel behavior. Kipnis and Mansfield (1986:160) put
"labour at the very heart of the decision making process and argue
that selecting a place of work, occurring only a few times in an
individual's lifetime, determines the family's place of residence,
life-style and socio-economic status." Further research in this area
could prove extremely useful.
In this study 57 people (54%) indicated that they picked their
houses because of the journey to work convenience. It is not known
if a job change occurred after the house was bought. Of the 57
people, 49 percent said the journey to work was convenient for the
man, 5 percent said convenient for the woman only and 46 percent
said convenient for both. Thus it seems that more and more families
must weigh the destinations of both parents' work when choosing a
Table 5.4 Work Destinations - A Comparison Among Burnaby Households With Children and Those Without, for Males and - - emales
According to table 5.4, more women than men work in Burnaby,
although Burnaby is the most popular work destination for both
sexes. This generally would allow women to be closer to home and in
the case of those households with children, where this is important,
closer to schools. I t is not known how many women work part-time
as opposed to full-time. Significantly less of the population from
this sample works in Downtown Vancouver than was originally
thought. New Westminster was not a big employer for the people in
this group, even though New Westminster has been one of Burnaby's
key shaping urban forces. An important proportion of those
households without children is retired. (A full listing of all work
destinations is given in appendix 0).
Commuting time is another variable in the home-work journey.
There has been considerable work in recent years highlighting gender
and class differences in work journeys (Rutherford and Werkerle
1988, Villeneuve and Rose 1988). Hanson and Pratt (1988) also
suggest looking at commuting distance, especially when different
modes of travel are involved. For example, it could take 20 minutes
to walk and only 5 minutes to drive the same distance. However, in
this study, most people travelled by car (85% of males, 77% of
females). The time spent in commuting varied between the sexes.
Men average more time commuting, with a one way trip lasting 23
minutes. Women's average commuting time was three minutes
shorter. Although this sample population refers only to those
expanding houses, these findings on commuting times are consistent
with those reported in the studies cited.
Decisions associated with initiating and developing the
expansion project are the subject of the next part. Table 5.5 displays
the average addition timetable and some expansion decisions.
The average length of time a household had occupied a house
before this expansion was fairly similar for Burnaby as a whole and
the North Shore at 13.3 years and 12 years respectively. Twenty-
three percent of the sample, for Burnaby as a whole, intended to
expand their house. More households with children intended to expand
(29%) and did so after a shorter period of time (8 years). Conversely,
fewer households without children intended to expand their houses
(15%) and did so after a prolonged period of time (18 years). The
average length of time to plan the expansion was five to six weeks
Burnaby Wi th Without Children Children
Mean Length of Time Living in House Before Expansion 12.3 yrs 8 yrs 18 yrs
Moved in with Future Intention to Expand 23%
Time to Finish Expansion-mean 16 mo.
-median 5 mo. Considered Moving
Instead of Addition 49%
12 mo. 14 mo. 6 mo. 4 mo.
North Shore
12 yrs
-
13 mo.
44%
Table 5 .5 Addition Timetable for Expansion Projects - A Comparison Among Burnaby Households, Those With Children and Those Without, and the North Shore
whereas the average length of time to finish the expansion was, for
Burnaby as a whole, 16 months. Those households without children
took slightly less time, 14 months. Households on the North Shore
took on average a little over a year to finish and those Burnaby
households with children finished on average in one year. The median
length of time for households to finish expansion is considerably
less, not unexpected1 y so. This indicates a skewed distribution since
some households take years to complete all finishing work, and in
some cases people are nonplussed in trying to decide when a project
was actually finished.
Table 5.6 indicates the preparation of blueprints. More
households with children than without children had friends or a
member of their own household draw the plans rather than
architects or professional draughtsmen. In those households without
children more draughtsmen drew the plans and thus it would
Burnaby Wi th Without Children Children
a) an architect 27% 35% 15% b) builder/contractor or
builder's draughtsman 28% 17% 44% c) member of your own household
or friend 45% 48% 41 % Totals 100% 100% 100%
Table 5.6 Preparation of the Blueprints - A Comparison Among Burnaby Households With children and Those Without
appear that simple functional space needs drive the expansion
projects of the younger families with children whereas a sense of
design and a more self-conscious process of thinking about living
space would appear to become more important at middle age. At the
same time, the preponderance of builder designs, as against
architect commissions would seem to point to a prosaic and frugal
approach to house expansion by those without children.
As far as doing the actual expansion work is concerned, both
groups participated in their expansion projects. Table 5.7 shows the
participation in the additions.
Seventy percent of the expanding households intended to do the
work themselves while 14 percent intended to hire contractors. In
reality, more work than intended was done by contractors. Most
householders were actively involved in some way with the work of
building their additions. The table shows that householders without
children more often assumed the role of coordinator; perhaps they
have more time to devote to such projects, but may be less able or
willing, physically, to do the work, knowing what the project
Burnaby Wi th Children
a) general contractor who did everything 27% 30% b) several sub-trades coordinated
by the homeowner 31% 28% c) several sub-trades coordinated
by an independent project manager 3% 3% d) homeowner 29% 32% e) other 9% 7%
Tota l 99% 100%
Without Children
24%
Table 5.7 Participation in Additions - A Comparison Among Burnaby Households With Children and Those W i t h o u t
involves. Conversely, households with children perhaps, could do the
work but may not have the time. This could explain why households
with children used more contractors and households without
children coordinated the sub-trades but did not do the actual work.
However, about 30 percent of homeowners from both groups, who
have some applicable skills and who perhaps enjoy such work,
completed the addition themselves. Others undertook the finishing
work at a pace determined by household living. A few indicated that
there was still finishing work to be done.
Just under 50 percent of the respondents for the whole of
Burnaby considered moving, but few went so far as to put their
houses up for sale. Significantly more households with children
considered moving (59%) than those without children (25%). Those
without children have lived in their houses the longest and have
probably paid off the mortgages. They are now expanding because
they have the time and/or money. Most are not considering moving in
the near future, although in the more distant future, a move is
probably inevitable. Thus extra work now may reap capital gains
benefits later.
Most projects stayed within budgets. Those that did not
claimed inaccurate contractors' estimates or admitted that once the
work started they decided to do more than first planned - not an
uncommon development. Only six percent had expanded their houses
again since 1986.
I. A Closer Look at Stage Six
It was unexpected that so man9 households in the later life
cycle stage were making expansions to their houses. Previous
studies have shown that their housing space needs should be in the
contracting phase (Seek 1983, Prior 1986). In an effort to determine
whether the large percentage (37) of households in stage six made
the same decisions with regard to their expansion projects, the
stage is divided into four sub-groups, by decade, according to the
age of the head of the family. These were:
STAGE 6 Number A-couple, age of head 35-44 years, no children. 5 0-couple, age of head 45-54 years, no children. 1 0 C-couple, age of head 55-64 years, no children. 1 3 D-couple, age of head over 64 years, no children. - 7
3 5
rable 5.8 Number of Households in Reclassified Stage Six
Table 5.8 shows that two-thirds of the heads of households in
the sixth stage were between the ages of 45 and 64 (68%). The
sample size was fairly small but nonetheless some interesting
differences emerged among the four groups as indicated in tables 5.9
11. Date house built 12. Dimensions of lot .................... 13. Addition constructed by: (circle one) OWNER CONTRACTOR
D. SKETCH AND COMMENTS (on reverse)
CLASSlFlCATlON SHEET
Aspect
N NNW I NNE
SSW I SSE S
W
WSW
SW
Orientat ion E /'\ ESE
SE 1 f r o n t 2 left side 3 rear 4 right side
Building Complement (#I-8 from Evenden 1982, #9 added by author) storey-basement or upstairs
wing (2 or more rooms)-to create L shape or corner wing; three outside walls
room(s) attached-three outside walls
expansion of existing rooms-former outside wall removed
corners-inner corner fill-in, two outside walls; outer corner fill-in, two outside walls; outer corner wrap-around, four outer walls; outer corner wrap-around, five sides
enclosure of previously defined space-sundeck, patio, carport etc.
roof and side detail-addition of dormer, bay window, etc.
miscellaneous-connector to outbuilding
storey and rooms attached-to create vertical L-shape; usually encompasses complements 1 & 3, storey can be top or basement
October 27,1989
Dear SirlMadam ,
I am a graduate student researcher at Simon Fraser University and I am studying how houses in Burnaby are sometimes expanded by home owners.
A sample of houses which were expanded between 1980 and 1985 has been randomly selected. Your name came up in this selection
process.
The purpose of the inquiry is to try to find out how and why houses are changed and expanded in response to the changing needs of families, and it is in this connection that I am contacting you. The
enclosed questionnaire lists the information I am seeking, and I
would be very grateful if you could fill it in and return it in the
stamped, self addressed envelope provided, before
Wednesday. November 23.1989.
Please be assured that this information will be treated anonymously. (Please do not put your name on the form.) Further, it will be used
only in grouped forms such as averages and totals.
Thank you very much for your cooperation. If you have any questions or would like further information please contact me by telephone at 522-0672 (residence) or at the above address.
Yours sincerely,
Kim Alexis
October 22, 1989
Dear Sir/Madam,
The enclosed letter and questionnaire are being sent to you
by K im Alexis, a registered graduate student i n geography at
Simon Fraser Univers i ty .
As par t of her thesis studies, Mrs . Alexis has chosen to
study how (single fami ly ) houses are changed i n response to the
changing needs of households. Her questionnaire asks fo r certain
information which w i l l help to identi fy patterns of such act iv i ty .
The success of the project depends upon th is k ind of
information, and, as the thesis supervisor, I would be grateful i f
you could assist by responding to the questions. The information
w i l l be used only for the purpose stated here, and i n combination
w i t h other information f rom other respondents.
Thank you for your co-operation.
Yours s incerely,
L. J. Evenden Associate Professor Urban Studies i n Geography
November 27, 1989
Dear Sir/ Madam,
I sent to your home a questionnaire concerning your expansion
project. It deals with houses expanded during 1980-1 985 in Burnaby,
B.C.
If you are among the many people who promptly responded, I
sincerely thank you for your time and effort. If however you have not
yet completed the questionnaire please do so as soon as possible.
I have enclosed another copy, in case the last one was somehow
misplaced. It should only take, at maximum, 15 minutes to complete.
Please be assured that all responses will be considered only in
grouped format. Your answers and comments are important.
Thank you for taking the time to complete the questionnaire.
Yours sincerely,
Kim Alexis
STUDY OF SINGLE FAMILY HOUSE EXPANSION IN BURNABY
Department of Geography Simon Fraser University
Kim Alexis
A. HOUSE CHARACTERISTICS
1. Number of rooms in house:
2. Full basement: yes no - If "no", is there a partial basement? yes - no -
3. Proportion of basement finished: (circle one) c 114 1 I2 314
4. Uses of basement rooms: (list)
5. What form did your expansion take? (eg. extra bedroom on rear of house, upstairs added,etc.)
B. FAMILY AND HOUSEHOLD CHARACTERISTICS
Please answer section B according to size and age of household at the b a i n n i n a of jhe expansion proiect,
Number of persons in household:
Number of adults:
Number of pre-school children:
girls boys -
Number of elementary school children:
girls boys -
Number of secondary school children:
girls boys -
6, Children's years of birth:
----
7. Decade of adult's births: (eg. 1950's)
M - F
8. Do the children have separate
Yes - no - bedrooms?
9. Have they ever shared bedrooms while you lived in this house? Yes - no - If "yes", at what stage did they move into separate bedrooms?
C. HOUSEHOLD TENURE AND JOURNEY TO WORK
1. How long have you lived in this house?
2. Where did you move from? (If outside the present municipality, please indicate town, province, or country; if within the present municipality, please indicate neighborhood eg. Brentwood.)
3. Did you decide to live here mainly because: (circle one or more)
a) you liked the house b) you liked the neighbourhood c) there was good house market potential d) the journey to work was convenient e) the price was right f) other (specify)
If you chose (d) from the question above, was the journey to work more convenient for:(circle one)
a) male b) female c) both
4. Where does each adult work? (eg. downtown Vancouver, North Burnaby, New Westminster, etc.)
(continued on page 2)
5. Estimate the time spent commuting each day (one way to work) for each adult who goes to work. M F
6. How do you normally go to work? (eg. by bus, car, skytrain, etc.)
D. EXPANSION DECISIONS AND PROJECT
1. Estimate how long you actively Dlanned to expand your house, before actually doing so.
2. Did you consider the alternative of moving to a larger house?
yes - no - If "yes", did you actually put your house up
for sale? yes no -
3. Why was moving rejected? (circle one or more as appropriate)
a) cost b) lack of another house of equal quality c) house did not sell d) neighbourhood characteristics e) desire to stay with the same school f) journey to work considerations g) other
Comment on choice of answer:
4. When you moved into this house did you intend to expand it?
Yes - no - . If "yes", how long was it after you moved in
before expansion work actually began?
6. Were the blueprint plans for the project drawn by: (circle one) a) an architect b) builderlcontractor or builder's
draughtsman c) member of your own household or friend
7. Was the work carried out mainly by:
a) general contractor who did everything b) several sub-trades co-ordinated by the
homeowner c) several sub-trades co-ordinated by an
independent project manager d) home owner e) other
8. It is common for homeowners to be physically involved in home expansion projects. How would you describe your involvement? (circle one or more)
a) major participation in certain areas in which we have skills (eg. painting, carpet laying, etc.)
b) worked with most trades as helper c) worked only as co-ordinator but did not do
physical work d) restricted participation to preparation,
clean up, and "being on hand" to answer questions
e) "threw up hands" in despair, avoided contact with the project to the greatest
possible extent 9 undertook to do the major finishing work at
a pace the household could stand
9. How long did project take from start to finish?
10. In the end, would you say the project was reasonably well on budget?
yes - no - If "no", what went wrong?
5. Was your decision to expand connected with your stage of family or household development?
Yes - no - Explain:
11. Have you expanded your house agab since 1986? yes - no -
Appendix 8
1. List of Rooms Added For Burnaby and the North Shore (from building permits)
ROOMS ADDED BURNABY NORTH SHORE N % %
BEDROOM GROUP bedroom 1 6 9 dressing room 1 guest room 2 loft 2 t o t a l 1 7 4 25% 30%
BATHROOM GROUP bathroom 1 0 2 15% 13%
HALLWAY AND ENTRANCE GROUP en t r y 2 2 f oye r 1 h a l l 6 lobby 1 mud roam 4 stairs 1 t o t a l 3 5 5% 7%
KITCHEN GROUP k i tchen 5 9 nook 5 t o t a l 6 4 9% 8%
PUBLIC ROOM GROUP b u f f e t 1 dining room 4 4 d ine t te 3 llvlng room 32 t o t a l 8 0 12% 12%
FAMILY ROOM GENERAL ACTIVITY GROUP den 1 1 family room 5 9 games room 2 playroom 2
recreat ion 1 2 sitting room 2 so lar ium 8 sunroom 2 2 T.V. room 2 t o t a l 1 2 0 17% 15%
FAMl LY ROOM SPECIALIZED ACTIVITY GROUP billiard room 1 canteen 1 exercise room 1 ga l le ry 1 greenhouse 2 gym 1 health room 1 hobby room 1 hot tub room 1 hothouse 1 l i b r a r y 1 plant room I pool 3 sauna 4 sewing room 3 s tud io 3 s tudy 2 wh i r l poo l 1 wlne room 2 t o t a l 3 1 5% 5%
UTILITY ROOM GROUP cooler 1 furnace room 2 laundry room 8 storage 2 4 utility room 1 0 workshop 2 t o t a l 4 7 7% 9%
UNFl Nl SHED 3 0 UNKNOWN 8 t o t a l 3 8 6% 1 %
GRAND TOTAL 6 9 1 100% 100% (N=645)
2. LIST OF THE USE OF BASEMENT ROOMS (A4)
bathroom 2 8 bedroom 4 8 billiard room 1 cold cellar 2 computer room 4 den 4 en t ry 1 family room 1 4 f reezer 1 furnace room 4 games room 3 guest room 7 gym 2 hot water tank 2 ~n-law suite 1 k i tchen 7 laundry 5 5 l i b r a r y 2 living room 4 off~ce 6 pant ry 1 playroom 7 pool 1 recreation room 3 5 sauna 4 shop 1 storage 2 9 studio 1 study 1 suite 1 tack room I T. V. room 8 tool room 2 utility room 5 weight room 1 workshop 1 7
t o t a l 31 1
3. Was your decision to expand connected with your stage of family or household development? (D 5)
Yes Y Y Y Y Y Y
Y Y Y Y Y
Y Y Y Y Y Y Y
Y Y Y Y Y Y
Y Y Y Y Y
Y Y Y Y
Teenagers need more privacy which they got
Children were getting older Expecting children We bought a second car Son wanted to build - so moved house to allow for subdivision Try fitting 4 teenagers into a kitchen 17 X 9 square feet including facilities for eating. Area now 17 X 22 and family area 12 X 12. All of areas open. Children growing - needed more room Family grew - ie. inlaw, grandchildren Needed a family room - enclosed carport Family was growing up, house was old and needed renovation Wished extra bedroom and family room on main floor not in basement Because of family - built inlaw suite for mother-in-law Kitchen was too small Our family grew from two children to four children Two babies would require additional room
Children - nanny space needed and bedrooms Rooms too small. Mainly interested in expanding kitchen and dining area We wanted the expansion finished before we had our children Second child one years old I was pregnant with first child Needed one more bedroom Needed more space with more children We had no children when we first bought house. Need more space for play area and storage Health reason and need for larger kitchen (3 females) We could afford it House initially only 2 bedrooms 650 square feet Children needed more room at that time Not enough room for 3 children, both in sleeping areas and living space More room and separate bedrooms for kids Expansion for reason of larger kitchen, for entertaining Children grew older and needed own room Kitchen space was too small - unable to move
Parents sold their home - private living quarters built to accommodate them Children growing needed room Planning to have children Children required play space - we needed bedroom and bathroom for visiting inlaws (occurred frequently) Married in 1981 - house too small and inconvenient Household development - more spacious-previously narrow
Growing business. More children. Not enough space. Inadequate dining area for buffet and piano Age differential required separate rooms especially between high school and university Family size - 3 kids Young kids like schools and location Children need separate rooms and formal dining room required Room to breathe We decided that if our second child was a 2nd girl we probably wouldn't expand, but it was a boy so we knew eventually we would need a third bedroom. The house was too small for a family We have expanded this house 3 times. Once was so the children could have separate bedrooms and extra bathrooms. With one boy and one girl we needed 3 bedrooms Bedroom too small Wanted more room, house too small
Children and aging inlaws Close to school and work We needed more room for children Adult children left and made it possible to convert upstairs bedrooms into studio space
House too small More comfort in sunroom than sundeck, can also be used 12 months a year Felt a bigger kitchen would be easier when having a family House was too small Rooms too small and layout out of date, only 1 bathroom Wanted garage and additional family room
Yes answers
Housing bylaw changed to allow us to build. Also we had more funds. Lived in a townhouse - wanted a house in town Sundeck not practical but family room takes wear off living room - laundry room moved up from downstairs, gives good "mud room" entrance and provides workshop down.
Just decided wanted more space and cupboards in kitchen
Desired larger house of sufficient size and layout. Previous house (original house on property) too small for needs. Also did not like layout.
Built sunroom with greenhouse under for retirement leisure Family room desirable Just wanted more room in kitchen Husband artist needed more studio space. Wife wanted off ice space. Needed space for collections - love of pottery and kitchen garden. Desire for more space We wanted to install a spa We needed a new sundeck and thought why not make the laundry room and storage below it?
We needed an extra bathroom and guest room More actual living space
Just a desire to have sundeck which is now covered, too much problem with water Expanded with new and larger enclosed porch in lieu of repair ing Decided we were going to stay here for as long as we could Needed larger greenhouse and workshop Addition made to improve comfort
We wanted more room for more gracious living
N Had always planned to move to a larger home, used the excuse that we would wait for the boys to change schools eg. junior to senior - never got around to moving - boys graduated and ready to move out on their own. We renovated
N N Just wanted bigger kitchen N N One extra room added upstairs which can be used as either a
family room or formal dining room 12' X 20' in area N Wanted a leisure area
38 No answers Total answers-1 05
4. LIST OF PREVIOUS LOCATIONS OF HOUSEHOLDS (C2)
19th & Rupert 4600 Frances St. Burnaby Bahamas Brentwood - (3) Burnaby - (5) Burnaby Heights - (2) Calgary Capitol Hill Cascades Central Park - (2) Downtown Vancouver East Vancouver - (4) Edmonds & Canada Way Edmonds area - (2) Halifax / Montecito Kamloops Kelowna Kingsway & Nelson Malaysia Marpole Metrotown Middlegate Mission Montecito Montreal Moose Jaw, Saskatchewan New Westminster North Burnaby - (3) North Vancouver Nova Scotia Oakland & Baffin Oakridge Old Orchard - (2) Ontario Ot tawa Port Moody - (2) Prince George Royal Oak & Kingsway - (2) South Burnaby - (9) South Slope South Vancouver - (2)
Surrey - (2) V. G. H. area Vancouver - (20) Vancouver - Collingwood Vancouver - Kerrsidale Vancouver - Mt. Pleasant Vancouver - West End - (4) Vancouver - W estridge Vancouver Heights - (2) Vancouver Island West Vancouver Willingdon Heights
5. LIST OF WORK DESTINATIONS (C4)
Male all over Annacis Island B. C. Coast Boundary & Canada Way Burnaby - (11) Burnaby - self employed Central Burnaby - (4) Coquitlam - (2) Downtown Vancouver - (12) East Vancouver - (4) Films - no location Granville & Broadway Home Lower Mainland - (4) New Westminster - (6) North Burnaby - (13) North Vancouver - (5) Port Coquitlam Port Moody Province wide Retired - (6) Richmond - (3) S. F. U. South Burnaby - (6) Surrey - (2) U. B. C. Vancouver - (9) West Vancouver
Females Burnaby - (12) Burnaby - self employed Central Burnaby - (5) Downtown Vancouver - (11) East Vancouver - (3) Home - (9) Metrotown - (2) New Westminster - (3) North Burnaby- (9) North Vancouver Oakridge Retired - (4) Richmond - (3) South Burnaby - (7) St. Paul's Hospital Surrey V. G. H. Vancouver - (10) Willingdon & Canada Way
Table A Summary of Population, Movers and Dwelling Characteristics for Census Tracts in Burnaby, B.C. for 1986 Census Year.
Census Definitions
The percentage of people over the age of five who reside in the same dwelling as at the time of the 1981 census.
The percentage of people over the age of five who reside In a different dwelling than in the 1981 census.
Occupied private dwelling - a private dwelling where a person or group of people permanently reside. It must be a separate set of living quarters although it may have a common iobby or hall. The classes of dwellings are: Single Family dwelling, Apartments over 5 storeys, Movable Dwellings and Other Dwellings (semi-detached house, row-house, other slngle attached house, apartment or flat in detached duplex and apartment in a building that has fewer than 5 storeys).
Owned - a dwelling is classifled as owned even if it is not fully paid for, such as one which has a mortgage or some other claim on it. The dwelling may be situated on rented or leased land or be part of a condominium.
Rented - a dwelling is classified as rented even if it is provMed without cash rent or at a reduced rent or if the dwelling is part of a co-operative.
Single family dwelling - a single dwelling not attached to any other dwelling or structure (except its own garage or shed). A single detached house has open space on all sides and has no dwelling either above or below it.
Table B Summary of Census Family Characteristics and Number of Children from 1986 Ceysus
Census Definitions
Household - refers to a person or group of persons who occupy a private dwelling and do not have a usual place of residence elsewhere in Canada.
Census Family - refers to a husband and a wife (with or without children who have never married, regardless of age), or a lone parent of any marital status, with one or more children who have never married, regardless of age, living in the same dweHing. For census purposes, persons living in a common-law type arrangement are considered as now married regardless of their legal marital status.
The percentage of census families with husband and wife.
The percentage of census families wlth husband and wife and no children at home. The percentage of census families with husband and wife and children at home (any unmarried
children, regardless of age)
Any unmarried children regardless of age.
BIBLIOGRAPHY
Adams, J. S. Housing America in the 1980s. New York: Russell Sage Foundation, 1987.
"The Meaning of Housing in America", Annals, Association of American Geographers 74, 1984: 51 5-526.
Agnew J. A. and Duncan, J. (eds.) The Power of Place, Boston: Unwin Hyman, 1989.
Andrews, R. B. Urban Land Economics and Public Policy, New York: The Free PresslCoilier MacMillan. 1971 : 95-1 37.
Artle, R. and Varaiya, P. "Life Cycle Consumption and Home Ownership", Journal of Economic Theory, 18, 1978: 38-58.
Bacher, J. C. "Canadian Housing Policy in Perspective", Urban History Review l 5 ( l ) 1988: 5-1 5.
Badcock, B. & Cloher, D. "Neighbourhood Change in Inner Adelaide", Urban Studies 18, 1981 : 41-55.
Bell, W. "The City, the Suburb and a Theory of Social Choice" in S Greer, D. McElrath, D. Minar and P. Orleans (eds.) The New Urbanization., New Y ork: St. Martin's Press, 1968.
Berry, B. J. L. Land Use, Urban Form and Environmental Quality, University of Chicago, Research Paper No. 155, 1974.
Bonnes, M., and Giuliani, M. V., Amoni, F. and Bernard Y. "Cross- cultural Rules for the Optimization of the Living Room", Environment and Behavior 19(2), 1987: 204-227.
Bourne, L. S. "Worlds Apart: The Changing Geography of Income Distribution Within Canadian Metropolitan Areas", Prepared for the Annual Meeting of the Canadian Association of Geographers, Edmonton, May 1990.
"Are New Urban Forms Emerging? Empirical Tests for Canadian Urban Areas", Canadian Geompher 33(4),1989: 31 2-328.
(ed.) lnternal Structure of the City (2nd ed.). Oxford: Oxford University Press, 1982.
. The G e o g r a p h y o f g . . London: Edward Arnold, 1981.
and Berridge, J. D. "Apartment Location and Developer Behavior: A Reappraisal", Canadian Geoqrapher 17(4) 1973: 403-41 1 .
"Apartment Location and the Housing Market" in L. S. Bourne lnternal Structure of the City (1st ed.). London: Oxford University Press, 1971: 321-328.
(ed.) Internal Structure of the City (1st edJ. London: Oxford University Press, 1971.
Boyce, R. R. "Residential Mobility and Its Implications for Urban Spatial Change" in L. S. Bourne (ed.) lnternal Structure of the City ( I st. ed.). London: Oxford University Press, 1971 : 338-343.
Brown, L. A. and Moore, E. G. "The Intra-urban Migration Process: A Perspective " in L. S. Bourne (ed.) lnternal Structure of the City ( I st. ed.). London: Oxford University Press, 1971 : 200-209.
Bunting, T. E. and Phipps, A. "lnner City Home Renovation in Two Medium-Sized Canadian Cities: A Case of Modest Upgrading" in T. Bunting and P. Filion (eds.) The Changhg Canadian lnner City, Department of Geography, University of Waterloo, 1988: 137- 157.
"Invisible Upgrading in lnner Cities: Homeowners' Reinvestment Behavior in Central Kitchener", Canadian Geographer 31(3) 1987: 209-222.
Burgess, E. W. "The Growth of a City", in R. E. Park, E. W. Burgess and R. D. McKenzie (eds.) The City, Chicago: University of Chicago Press, 1925: 47-62.
Burnaby, The Corporation of the District of. A Draft Official Community Plan for Burnaby, British , Columbia,_ Burnaby Planning and Building Inspection Department, 1987.
. Burnaby Zoning B-. 1965. Amended up to and including Amendment Bylaw Number 891 6, January 1988.
. Minute Books for the Municipality of Burnaby, 1920-1 929, Simon Fraser University Archives.
Carter, H. The Study of Urban Geography (3rd. ed.), London: Edward Arnold, 1982.
. "A Decision-Making Approach to Town Plan Analysis: A Case Study of Llandudno" in H. Carter and W. K. D. Davies (eds.) Urban Essays: Studies in the Geography of Wales, London: Longman, 1970: 66-78.
Carver, H. "Building the Suburbs: A Planner's Reflections", C&y Magmine September 1978: 40-45.
Checkoway, B. "Large Builders, Federal Housing Programs and Postwar Suburbanization", In > e n 'o Mgional Research 4,1980: 21 -44.
Clark, W. A. V . and Onaka, J. L. "Life Cycle and Housing Adjustment as Explanations of Residential Mobility", Urban Studies 20, 1983: 47-57.
Clay, P. L. Nelghbourhood Renewal. Middle-class Resettlement , and Jncumbent Upgrading in American Neig-. Massachusetts: Lexington Books, 1979.
Collins, L. "Canadian Cities: Recent Developments and the Changing Image" in G. M. Robinson (ed.) A Social Geography of Canada, Edinburgh: North British Publishing, 1988. Republished by Dundunn Press, Toronto, 1991 .
Conzen, M. P. "Analytical Approaches to the Urban Landscape", K. Butzer (ed.) Dimensions of Human Geogm~hy: Essays on Some Familiar and Neglected Themes, University of Chicago, Department of Geography, Research Paper No. 186, 1978.
Conzen, M. R. G. "The Use of Town Plans in the Study of Urban History", H. J. Dyos (ed.) The Study of Urban History, 1968: 113-130.
. Alnwick, Northumberland. A Study-!, London: George Philip and son Ltd., 1960.
Doorn, P. K. and van Rietbergen, A. "Lifetime Mobility: Interrelationships of Labour Mobility, Residential Mobility and Household Cycle", Canadian Geographer 34(1) 1990: 33-48.
Duvall, E. M. Family Development, Philedelphia, 3rd. edition, 1967.
Dyck, I. J. "Integrating Home and Wage Workplace: Women's Daily Lives in a Canadian Suburb", Canadian Geographer 33(4) 1989: 329-341.
. "The Daily Lives of Women With Young Children: Redefining a Woman's Place? 15-32 in Current Research by Western Canadian Geo gf i~hers : The Simon Fraser Unive rsity Papers,- 1987, E. L. Jackson (ed.) B. C. Geographical Series No. 45, 1988.
. Towards a Geography of Motherhood: An Analysis of the Constitution of Safe Spaces for Children, Ph. D. Thesis, Department of Geography , Simon Fraser University, 1 988.
Evenden, L. J. and Walker, G. E. "From Periphery to Center: The Changing Geography of the Suburbs" (Forthcoming).
"The Expansion of Domestic Space on Vancouver's North Shore" in G. Robinson (ed.) A Social Geogra~hy of Canada. Edinburgh: North British Publishing, 1988. Republished by Dundunn Press, Toronto, 1991.
. Slngle Family House Expansion, Ottawa: Canada Mortgage and Housing Corporation, 1982.
."Shaping the Vancouver Suburbs", Western Geographical Series 16, 1978: 179-199.
Falk, K. "The Changing Floor Plan: A Study of the Evolution of House Plans in British Columbia", CMHC, 1983.
Filion, P. "Concepts of the inner City and Recent Trends in Canada", Canadian Geographer 31(3) 1987: 223-232.
Finighan, W. R. Privacy in Suburbia: A Study in Four Melbourne Areas, Division of Building Research, Commonwealth Scientific and Industrial Research Organization, Highett, Victoria, 1979.
Fusch, R. and Ford, L. "Architecture and the Geography of the American City", Geographical Review 73, 1983: 324-340.
Galster, G. "Identifying the Correlates of Dwelling Satisfaction. An Empirical Critique", Environment and Behavior 19(5) 1987: 539-568.
"What is Neighbourhood? An Externality-space Approach" International Journal of Urban and Regional Research 10(2) 1986: 243-262.
Gellen, M. Accessory Apartments in Single Family Housing, New Jersey: Center for Urban Policy Research, 1985.
Gill, W. G. M M v I e s : Indices and Determinants, Ph D. Thesis, Interdisciplinary Studies, University of British Columbia, 1981.
Giuliani, M. V. "Naming the Rooms: Implications of a Change in the Home Model", Environment and Behavior l9(2), 1987: 180-203.
Gladhart, P. Family Housing Adjustment and the T h e o r y d Residential Mobility: A Temporal Analysis of Family Residential Histories, Ithaca, New York: Cornell University Ph D. Thesis, 1973.
Glick, P. C. "Updating the Life Cycle of the Family", Journal of M a r r i a g e v , 39(1), 1977: 5-13.
Gober, P. "The Urbanization of the Suburbs", Urban Geography 10(4) 1989: 31 1-31 5.
Goldberg, M. and Horwood, P. Zoning. Its Costs and Relevance for the l98Os, Canada: The Fraser Institute, 1988.
Goodall, B. The Penguin Dictionary of Human Geography! Suffolk: The Chauser Press Ltd., 1987.
Goss, J. "The Built Environment and Social Theory: Towards An Architectural Geography", Professional Geographer 40(4) 1988: 392-403.
Gottmann, J. "Why the Skyscraper?" Geographical Review 56, 1966: 190-21 2 .
Greater Vancouver Key Facts. A Statistical Profile of Greater Vancouver, Canada, G. V. R. D. Development Series, Nov. 1989.
Green, G. History of Burnaby and Vicinity, North Vancouver: Shoemaker, McLean and Veitch Ltd., 1947.
Guest, A. "Neighbourhood Life Cycle and Social Status", Economic Geographv 50, 1974: 228-243.
Hammond, R. and McCullagh, P. S. Quantltat~ve Technig . .
Ll.i%Lh Geography. Oxford: Clarendon Press, 1978.
Hanson, S. and Johnston, I. "Gender Differences in Work-Trip Length: Explanations and Implications", Urban Geogm~hy.. l6(3), 1985: 1 9 3 - 2 1 9
and Pratt, G. "Spatial Dimension of the Gender Division of Labour in a Local Labour Market", Urban Geography 9(2), 1988: 180-202.
Harris, C. and Ullman, E. "The Nature of Cities" Annals of the American Academy of Political and Social Science, Nov., 1945: 7-17.
Harris, R. "Boom and Bust: The Effects of House Price Inflation on Homeownership Patterns in Montreal, Toronto and Vancouver", CanadIan Geogra~her 30(4) 1986: 302-31 5.
"Home Ownership and Class in Modern Canada", International Journal of Urban and Regional Research 10(1) 1986: 67-85.
Hartshorn, T. A. and Muller, P. 0. "Suburban Downtowns and the Transformation of Metropolitan Atlanta's Business Landscape", Urban Geography I O(4) 1989: 375-395.
Harvey, D. "Society, the City and the Space Economy of Urbanism", Association of American Geographers, Resource Paper No. 18, Washington, D. C., 1972.
Hellyer, P. Report of the Federal Task Force on Housing and Urban Dkyekpment. Ottawa: Queen's Printer, 1969.
Holdsworth, D. "Cottages and Castles for Vancouver Home-Seekers", B. C. Studies, 69-70, 1986: 11-32.
"House and Home in Vancouver: Images of West Coast Urbanism, 1886-1929", in G. A. Stelter and A. F. J. Artibise (eds.) The Canadian C i t - . v Ottawa: Macmillan of Canada Ltd., 1979: 186-21 1.
Hoover, E. M. and Vernon, R. Anatomy of a Metropoiis, New York: Doubleday, 1959.
Housin & . 'n da iew and Lesso ed. Issued under the Authority of Honorable Stewart Mclnnis, Minister Responsible for Canada Mortgage and Housing Corporation, 1987.
Hoyt, H. Structure and Growth of Residential Neighborhoods in American Cities, Washington, D. C. : FHA, 1939.
Huff, 0. and Clark, W. "Cumulative Stress and Cumulative Inertia: A Behavioral Model of the Decision to Move", Environment and P lann ingA 10, 1978: 1 101-1 11 9.
Hulchanski, J. D. "Canada's Housing and Housing Policy: An Introduction", University of British Columbia Planning Papers, Canadian Issues #27, 1988.
"The Dominion Housing Act: Setting the Stage for a Permanent Federal Presence in Canada's Housing Sector", Urban History Review l 5 ( l ) 1986: 19-40.
Jackson, J. T. "To Move or Extend? A Study of Housing Behaviour in Metropolitan Perth 1 979", Australian Geoarapher 16, 1 985: 207- 217.
. Home Improvers and Movers in Metropolitan Perth, 1979: A Working Paper. Geowest, Working Papers of the Department of Geography, University of Western Australia, No. 17, 1980.
Kalman, H. FxpIorin~ Vancouver, (2nd. ed.) Vancouver: U. B. C. Press, 1978.
Kendig, H. L. "Housing Careers, Life Cycle and Residential Mobility: Implications for the Housing Market", Urban Studies 21, 1981: 271-283.
Kidder, T. House. Boston: Houghton Mifflin Company, 1985.
Kirby, D. A. "Housing" in M. Pacione (ed.) Progress in Urban Geogmp&, Croom Helm, 1983: 7-44.
Kirschenbaum, A. "Sources of Neighbourhood Residential Change: A Micro-Level Analysis", Social Indicators Research 12, 1983: 183-1 98.
Kipnis, B. A. and Mansfield, Y. "Work-place Utilities and Commuting Patterns: Are They Class or Place Differentiated?" Professional Geogsa~her 38, 1986: 160-1 69.
Knox, P. L. "The Social Production of the Built Environment: Architects, Architecture and the Post-Modern City", Progress In Human Geography 1 l (3 ) 1987: 354-377.
Lansing, J. B. and Kish, L. "Family Life Cycle as an Independent Variable", American S o c i o l o g i c a l 22, 1957: 51 2-51 9.
Laske, S. B., Seaman, J. M. and McSeveney, D. R. "Inner-City Reinvestment: Neighbourhood Characteristics and Spatial Patterns Over Time" Urban Studies 19, 1982: 155-165.
Lawrence, R. J. "What Makes a House A Home?", Behavior l9(2), 1987: 154-1 68.
Ley, D. "Alternative Explanations for Inner-City Gentrification: A Canadian Assessment", Annals, Association of American Geoara~hers 76(4) 1986: 521-535.
"Downtown of the Suburbs? A Comparative Study of Two Vancouver Head Offices", Canadian Geogw& 29(1) 1985: 30- 43.
"Inner-City Revitalization in Canada: A Vancouver Case Study", Canadian Geographer 25(2) 1981 : 124-1 48.
McCann, L. D. and Smith, P. J. "The Residential Development Cycle in Space and Time" in P. J. Smith (ed.) Edmonton. The Emerghg Metropolitan Pattern. Western Geographical Series, Vol. 15, University of Victoria, 1978: 119-160.
. kghbourhoods in Transition. Edmonton, Alberta: The Department of Geography, 1975.
McConney, M. E. "An Empirical Look at Housing Rehabilitation as a Spatial Process", Urban Studies 22(1) 1985: 39-38.
. An Empirical Investigation of the Repair, Behavior of Nelghbouring Owners. Ph D. Thesis, University of Pennsylvania, 1983.
McLeod, P. 6. and Ellis, J. R. "Housing Consumption over the Family Life Cycle: An Empirical Analysis", Urban Studies 19, 1982: 177-1 85.
Meinig, D. W. (ed.) The Interpretation of Ordinary Landscapes. New York: Oxford University Press, 1979.
Mendelsohn, R. "Empirical Evidence on Home Improvement", Journal of Urban Economics 4, 1977: 459-468.
Mercer, J. and Phillips, D. A. "Attitudes of Homeowners and the Decision to Rehabilitate Property", Urban Geographer 12, 1981 : 21 6-236.
Metropolitan Atlas Series, 1981 Census of Canada. Vancouver: Supply and Services, 1984.
Michelson, W. Environmental Choice, Human Behavior and Residential Satisfaction. New Y ork: Oxford University Press, 1977.
Millward, H. "Classification of Residential Upgrading Processes: A Halifax Case Study" in T. Bunting and P. Filion (eds.) T A Chanaing Canadian Inner C i tb Department of Geography, University of Waterloo, 1988: 107-1 19.
and Davis, D. "Housing Renovation in Halifax: 'Gentrification' or 'Incumbent Upgrading'?" Plan Canada 26, 1986: 148-155.
"Single-family House Values in Metropolitan Halifax, 1981 ", Canadian Geographer 27(2) 1983: 178-183.
Miron, J. R. Housing in Postwar Canada. Montreal: McGill-Queen's University Press, 1988.
. "Economic Equilibrium in Urban Land Use" in L. S. Bourne (ed.) Internal Structure of the City(2nd. ed.) Oxford: Oxford University Press, l982:124-136.
Moore, P. "Zoning and Neighbourhood Change: The Annex in Toronto, 1900-1 WO", Canadian Gecgrapher 16(1), 1982: 21-36.
Morris, E. W. and Winter, M. "A Theory of Family Housing Adjustment", Journal of Marriage and the Family 37(1) 1975: 79-88.
Morrow-Jones, H. A. "Housing Tenure Change in American Suburbs", Urban Geography 1 O(4) 1989: 31 6-335.
"The Geography of Housing: Housing over the Life Course. Urban Geograp-Gy 1 O(5) 1989: 487-494.
Muller, P. 0. -Cmbmyoorary Suburban America, New Jersey: Prentice- Hall Inc., 1981.
Niwinski, A. "Pioneering Prefabs", Urban Reader 9(3) 1982: 5-7.
Nock, S. L. "The Family Life Cycle: Empirical or Conceptual Tool?" Journal of Marriage and the Family 41(1), 1979: 15-26.
Palmer, B. C. "Development of Domestic Architecture in British Columbia", Journal of the Royal Architectural Institute of Canada, 1928: 405-41 6.
Pet hick, D. Vancouver Recalled. A Pictorial History to 1887. Saanichton, B. C. : Hancock House Publishers, 1974.
Phipps, A. G. "Housing Renovation by Recent Movers into the Core Neighbourhoods of Saskatoon", Canadian Geogra~her 27, 1983: 240-262.
Pred, A. "Place as Historically Contingent Process: Structuration and the Time-Geograph y of Becoming Place", Annals, Association of American Geographers 74, 1984: 279-297.
Priemus, H. "Mousing as a Social Adaptation Process. A Conceptual Scheme", Environment and Behavior l 8 ( l ) 1986: 31-52.
Priest, G. Living Arrangements of Canada's Elderly: Changing Demaaraphic and Economic Factors. Vancouver, B. C.: Gerontology Research Center, Simon Fraser University, 1985.
. Operationalizing the Family Life Cycle Concept within the Context of United Nations Recommendations for the 1980 Census. The World Health Organization, Geneva, 1981.
. A m g a t i o n of the Elderly in the Urban Environment with Special Reference to their Housing, M. A. Thesis, Department of Geography, Simon Fraser University, 1970.
Prior, J. B. The Dwelling as a Node of Daily Activity-&mmg Non- Institutionalized Retired Men. Department of Geography, Simon Fraser University Ph D. Thesis, 1986.
Rapoport, A. The Meaning of the Built Environment, London: Sage Publications, 1982.
. House Form and Culture, Englewood Cliffs: Prentice-Hall, Inc., 1969.
Raynor, A. E. A Study of Development Control in Burnab y. B. C. Canada, M Sc Thesis, University of British Columbia, 1977.
Rossi, P. H. Why Families Move: A Study of the Psychology of Urban Residential Mobility, New York: Free Press, 1955.
Rubin, B. A. "Chronology of Architecture in Los Angeles", Annals,- . . Assoc~at~on of American Geographers 67(4) 1977: 521-537.
Rullo, G. "People and Home Interiors: A Bibliography of Recent Psychology Research", b v i r o n ment and Behavior, l9(2), 1 987: 250-259.
Rutherford, B. M. and Wekerle, G. R. "Captive Rider, Captive Labor: Spatial Constraints and Woman's Employment", Urban Geography 9(2), 1988: 11 6-1 37.
Rybczynski, W. Home: A Short History of an Idea. New York: Penguin Books, 1986.
Sabourin, J. M. The P r ocess of G entr ification. The Exam ple of Private Housing Renovation in Don Vale. Toronto. Ph D. Thesis, Department of Geography, York University, Toronto, 1988.
Sadalia, E. and Oxley, D. "The Perception of Room Size" Environment and Behavior, l6(3), 1 984: 394-405.
Seek, N. "Adjusting Housing Consumption: Improve or Move", Urban Studies 20, 1983: 455-469.
Siemens, A. H. (ed.) Evolution of a Cultural Landscape: l ower Fraser Valley, B . g r a p h i c a 1 Series No. 9 Vancouver: Tantalus Research Ltd., 1973.
Sixta, G. Urban Structure, Burnaby Planning Department, 1971 .
Smith, N. "Gentrification and Uneven Development", Economic Geography 58, 1982: 139-1 55.
Smith, P.J. & McCann, L.D. "Residential Land Use Change in Inner Edmonton" Annals, Association of American Geogrqhers 71(4) 1981 : 536-551.
Sone, M. (ed.) P P y as Recalled by Jhe Settlers, Burnaby, B. C.: Corporation of the District of Burnaby, 1987.
Spain, D. and Laska, S. "Renovators Two Years Later: New Orleans" in J. Palen and B. London (eds.) Gentrification, Displacement and
Neighbourhood Revitalization. Albany: State University of New York Press, I 984.
Stapleton, C. M. "Reformulation of the Family Life-Cycle Concept: Implications for Residential Mobility", Environment and PlanningA 12, 1980: 1103-18.
Steed, G. P. F. "lntrametroplitan Manufacturing: Spatial Distribution and Locational Dynamics in Greater Vancouver", Canadian %Q!J~her 17(3), 1973: 235-258.
Stelter, G. A. and Artibise, A. F. (eds.) Power and Place, Vancouver: University of British Columbia Press, 1986.
. (eds.) The Canadian City. Ottawa: Macmillan of Canada Ltd., 1979.
Turner, J. F. C. Housing By People, London: Marion Boyars, 1976.
Vance, J. E. T he S c ene of Man: The Role and Structure of the City& the Geography of Western Civilization., New York: Harper's College Press, 1 977.
Understanding Vancouver, Vancouver City Planning Department, 1977.
van Vliet, W. (ed.) International Handbook of HousingPolicy and Practices, 1989.
Villeneuve, P. and Rose, D. "Gender and Employment Separation in Metropolitan Montreal, 1971 -1 981 ", Urban Geography 9(2), 1988: 155-1 79.
Vischer, J. C. "The Changing Canadian Suburb", Plan Canada 27(5) 1987: 130-140.
Walker, R. A. "Theory of Suburbanization: Capitalism and the Construction of Urban Space in the United States" in M. Dear and A. Scott (eds.) Urbanization and Urban Planningin Capitalist Society, New York: Methuen, 1981 : 383-430.
Werner, C. M. "Home Interiors: A Time and Place for Interpersonal Relationships", Environment and Behavior l9(2), 1987 : 169- 179.
Woodland, A. 1. Ne New Westminster, B. C.: Nunaga Publishing Co., 1973.
Wright, G. Building the Dream: A Social History of Hous ingh America. New York: Pantheon Books, 1981.
Young T. G. The 'Typical' Residential Subdivision in Canada: Controlled Suburban Residential Developments Around Major Cities from 1945 to the mid 1970s, Master of City Planning, University of Manitoba, 1977.