17
HOUSEHOLD SURVEYS IN BANGLADESH How well are the urban poor represented? Ru-Yi Lin
| Date post: | 02-Jan-2016 |
| Category: |
Documents |
| Upload: | horatio-cole |
| View: | 213 times |
| Download: | 0 times |

HOUSEHOLD SURVEYS IN BANGLADESH
How well are the urban poor represented?
Ru-Yi Lin
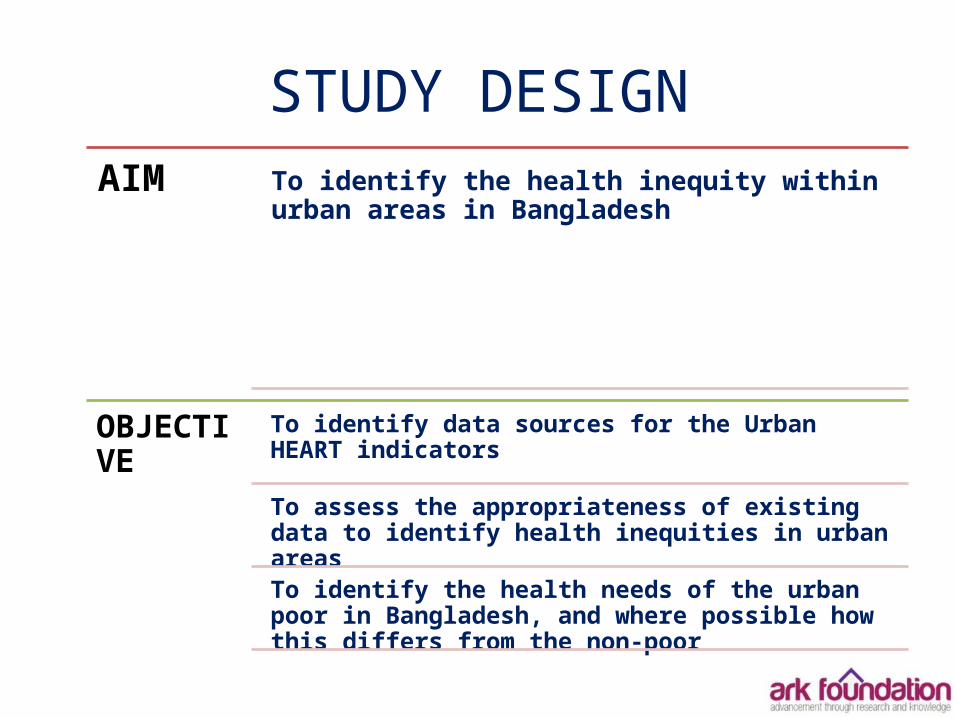
STUDY DESIGNAIM To identify the health inequity within urban areas in
Bangladesh
OBJECTIVE To identify data sources for the Urban HEART indicators
To assess the appropriateness of existing data to identify health inequities in urban areas
To identify the health needs of the urban poor in Bangladesh, and where possible how this differs from the non-poor
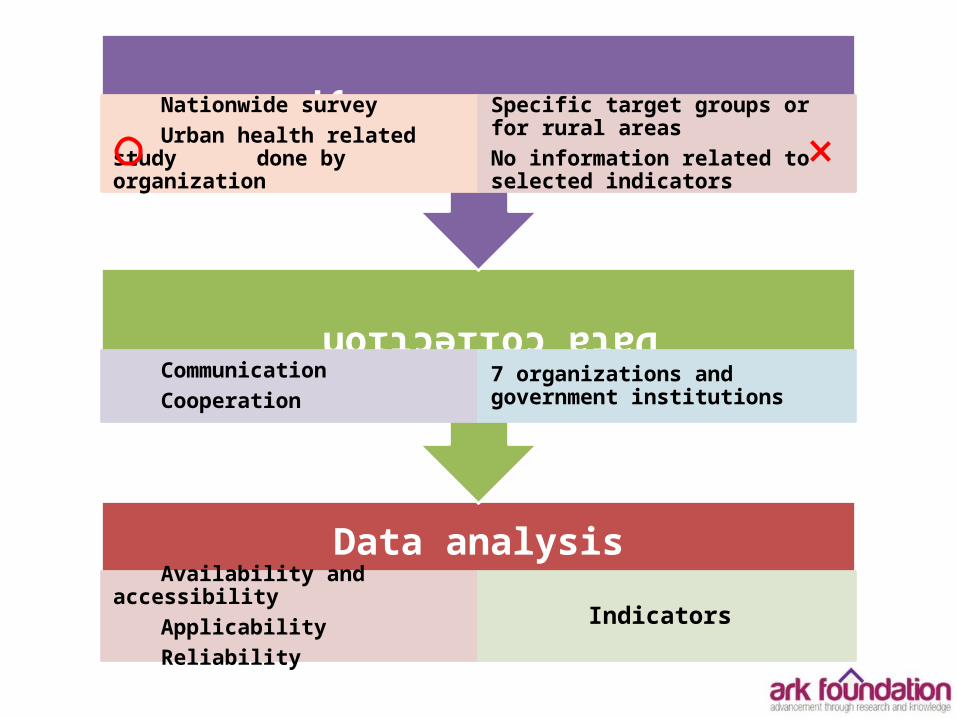
Data analysisAvailability and accessibilityApplicability Reliability
Indicators
Data collection CommunicationCooperation
7 organizations and government institutions
Selected data type
Nationwide surveyUrban health related study done by organization
Specific target groups or for rural areasNo information related to selected indicators

AvailabilityAccessibility
Both raw data and report are available
Sub group analysis can be done
Applicability
Covers 12 Urban HEART indicators
No further information about slum/non-slum groups
Reliability
Sample size: 18,000 household Urban: 6210 HHs; Rural: 11790 HHsTwo stages cluster randomize sampling*Covers 7 divisions
Used standard sample size formula for key indicators at subnational-level
2011 Bangladesh Demography and Health Survey
*Sample frame: select the Enumeration areas (EAs) covered whole country from 2011 census (113 household/EA). 600 EAs been selected(207 in urban/ 393 in rural)->30 Household been selected in each cluster

AvailabilityAccessibility
Report is available; raw data not available
Sub group analysis can NOT be done
Applicability
Covers 1 Urban HEART indicatorNationwide dataResult can be divided into urban/rural areas
No further information about patient’s socioeconomic status
Reliability
Data collected from patient register system Cover 6 divisions
Challenges of routine data collection including duplication and human errorThe most vulnerable may not have access to health system
2013 National Tuberculosis Control Programme (NTP) annual report
AvailabilityAccessibility
Both raw data and report are available
Sub group analysis can be done
Applicability
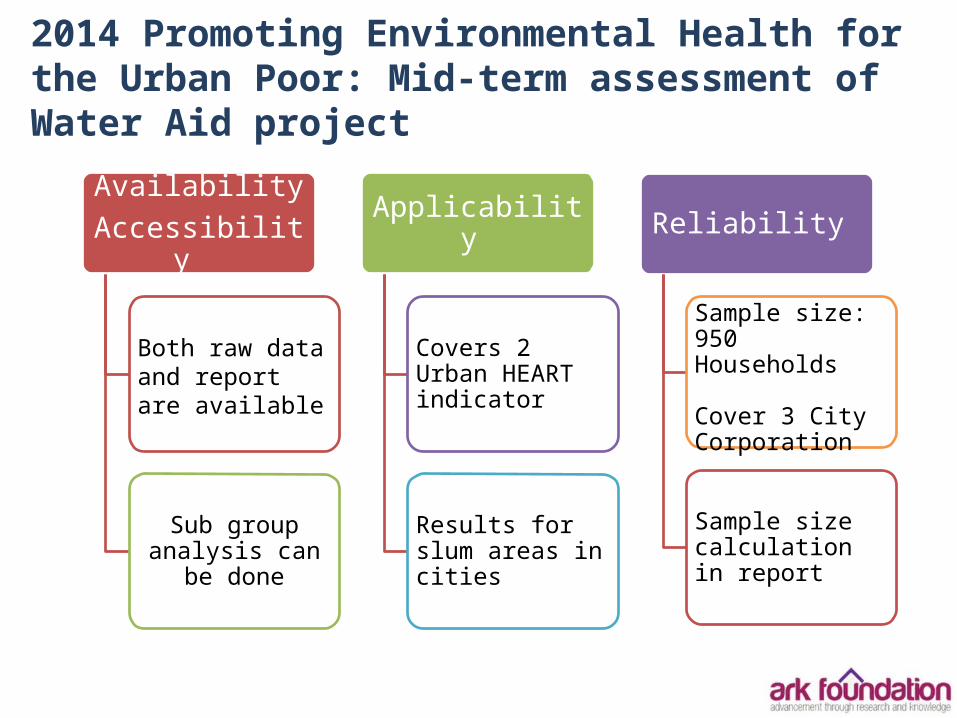
Covers 2 Urban HEART indicator
Results for slum areas in cities
Reliability
Sample size: 950 Households
Cover 3 City Corporation
Sample size calculation in report
2014 Promoting Environmental Health for the Urban Poor: Mid-term assessment of Water Aid project
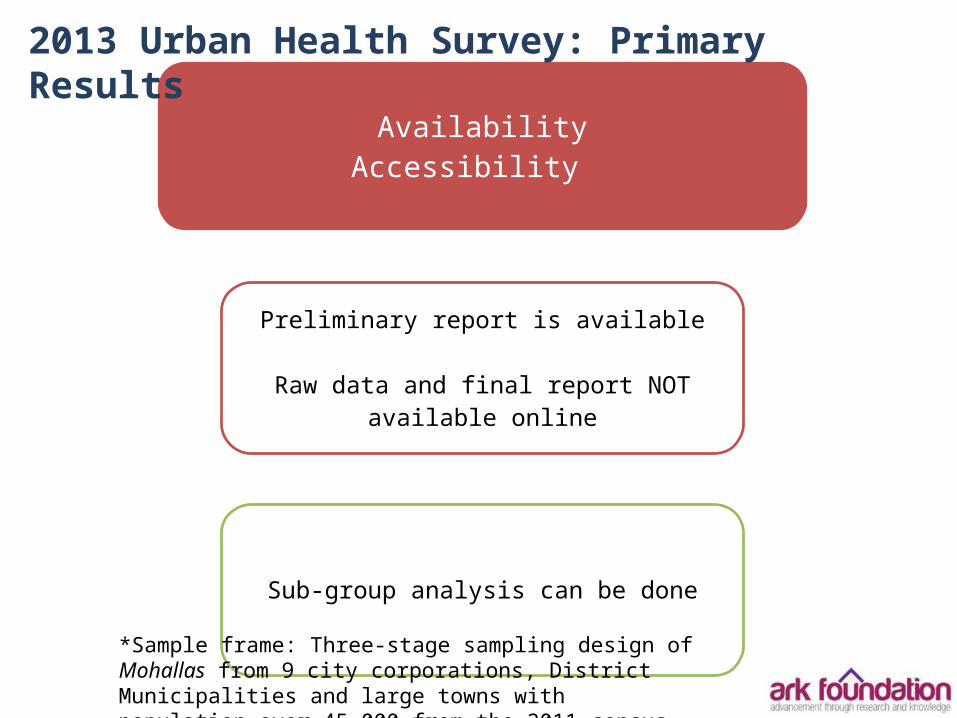
AvailabilityAccessibility
Preliminary report is available
Raw data and final report NOT available online
Sub-group analysis can be done
2013 Urban Health Survey: Primary Results
*Sample frame: Three-stage sampling design of Mohallas from 9 city corporations, District Municipalities and large towns with population over 45,000 from the 2011 census
AvailabilityAccessibility
Preliminary report is available
Raw data and final report NOT available online
Sub group analysis can be done
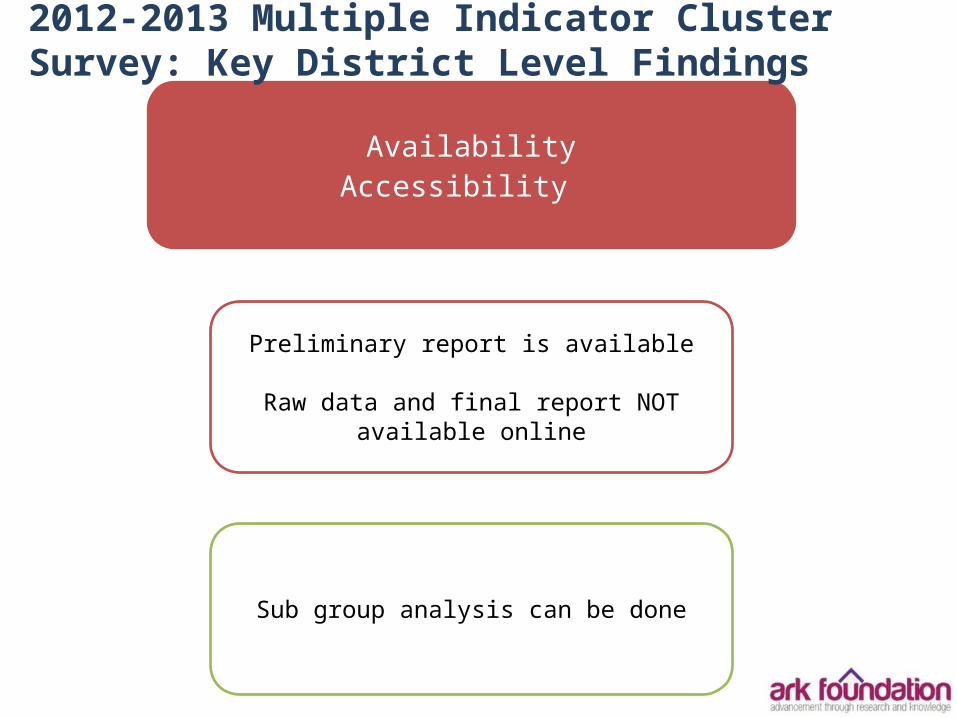
2012-2013 Multiple Indicator Cluster Survey: Key District Level Findings

AvailabilityAccessibility
Report available online.
Request raw data from MoHFW
Sub group analysis can be done
2010 STEPs: Non-Communicable Disease Risk Factor Survey Bangladesh 2010
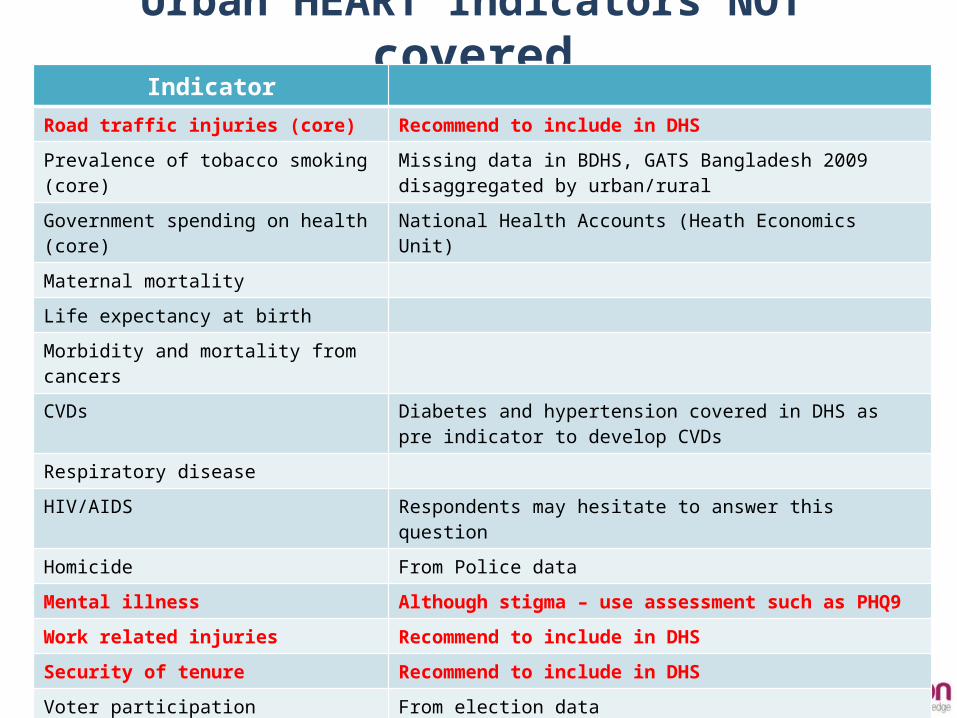
Urban HEART Indicators NOT covered
IndicatorRoad traffic injuries (core) Recommend to include in DHS
Prevalence of tobacco smoking (core) Missing data in BDHS, GATS Bangladesh 2009 disaggregated by urban/rural
Government spending on health (core) National Health Accounts (Heath Economics Unit)
Maternal mortality
Life expectancy at birth
Morbidity and mortality from cancersCVDs Diabetes and hypertension covered in DHS as pre indicator to
develop CVDsRespiratory disease
HIV/AIDS Respondents may hesitate to answer this question
Homicide From Police data
Mental illness Although stigma – use assessment such as PHQ9
Work related injuries Recommend to include in DHS
Security of tenure Recommend to include in DHS
Voter participation From election data
Insurance coverage From National Health Accounts (Heath Economics Unit)

Geographical coverage in analysis
DivisionCity
Corporation Muni.
2013 MICS
V (7
divisions)V
2011BDHS
V (7
divisions)V
2013NTP
V (6
divisions)
2013 UH
surveyV
(9 City Corporations)
V
2014 PEHUP
V (3 City
Corporations)
2010 STEPs
V (6 divisions)
Comila
Rarayanganj
2013 Urban Health Survey
2011 BDHS
2014 PEHUP
2012 MICS 2013 NTP
2010 STEPs
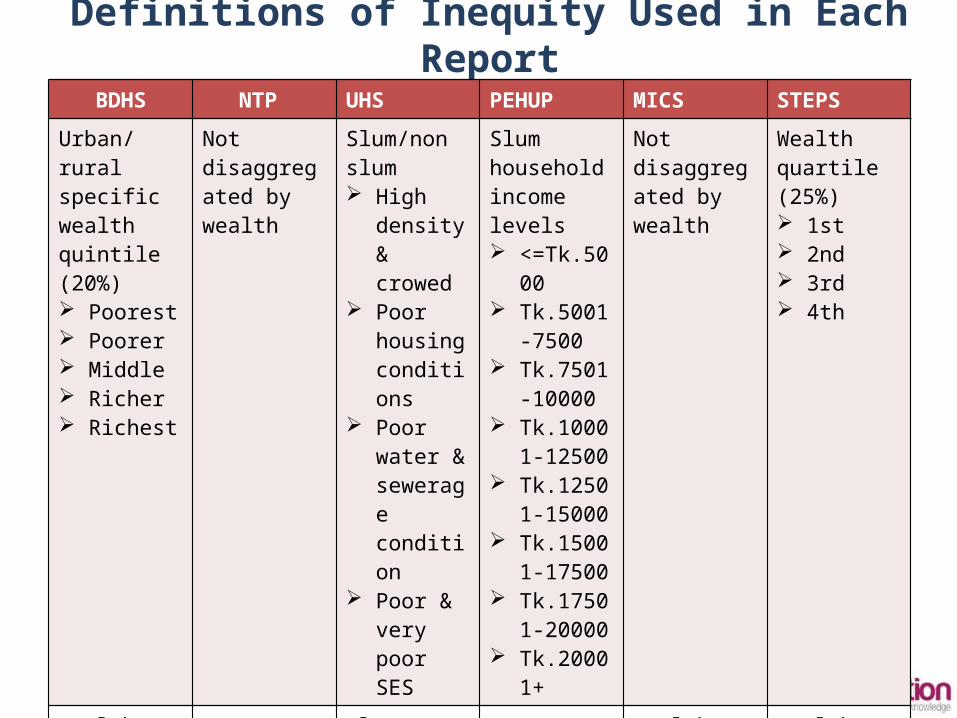
Definitions of Inequity Used in Each Report
BDHS NTP UHS PEHUP MICS STEPS
Urban/rural specific wealth quintile (20%) Poorest Poorer Middle Richer Richest
Not disaggregated by wealth
Slum/non slum High
density & crowed
Poor housing conditions
Poor water & sewerage condition
Poor & very poor SES
Slum household income levels <=Tk.5000 Tk.5001-
7500 Tk.7501-
10000 Tk.10001-
12500 Tk.12501-
15000 Tk.15001-
17500 Tk.17501-
20000 Tk.20001+
Not disaggregated by wealth
Wealth quartile (25%) 1st 2nd 3rd 4th
Wealth Index Slum/non-slum, wealth index
Income Wealth index Wealth index

Are the urban poor being identified?
DHS wealth quintile category
Urban n (unweighted)
Urban % Rural n (unweighted)
Rural %
poorest 515 3.00 3021 17.62poorer 433 2.53 2857 16.67middle 621 3.62 2565 14.96richer 1465 8.55 1931 11.27richest 2834 16.53 899 5.24Total 5868 34.23 11273 65.77
Absolute numbers and % sample size per wealth quintile across the national DHS 2011 sample (both urban and rural areas) n = sample size
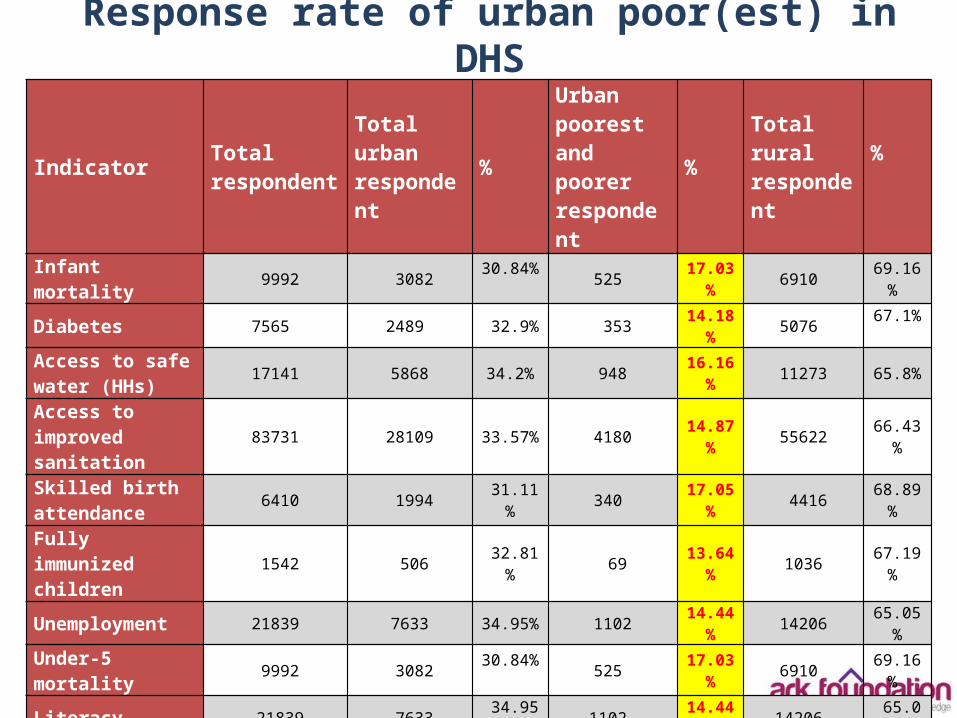
Response rate of urban poor(est) in DHS
Indicator Total respondent
Total urbanrespondent %
Urban poorest and poorerrespondent
% Total rural respondent
%
Infant mortality 9992 3082 30.84% 525 17.03% 6910 69.16%
Diabetes 7565 2489 32.9% 353 14.18% 5076 67.1%
Access to safe water (HHs) 17141 5868 34.2% 948 16.16% 11273 65.8%
Access to improved sanitation 83731 28109 33.57% 4180 14.87% 55622 66.43%
Skilled birth attendance 6410 1994 31.11% 340 17.05% 4416 68.89%
Fully immunized children 1542 506 32.81% 69 13.64% 1036 67.19%
Unemployment 21839 7633 34.95% 1102 14.44% 14206 65.05%
Under-5 mortality 9992 3082 30.84% 525 17.03% 6910 69.16%
Literacy 21839 7633 34.95% 1102 14.44% 14206 65.05
Underweight children 7647 2342 30.63% 396 16.91% 5305 69.37%
Breastfeeding 523 168 32.12% 47 27.98% 355 67.88%
Teenage pregnancy 1911 594 31.08% 128 21.55% 1317 68.92%

1. DHS, MICS, UHS, STEPs: 1st-stage sampling from census data, and 2nd-stage listing of households misses many urban-poorest so urban sample is not representative.
2. BDHS, MICS, STEPs: The sample size is too small to perform sub-urban analysis.
3. DHS, MICS, UHS, STEPs: People who have no house might be excluded in household survey, whom are the extreme poor people (homeless, illegal settlements).
4. DHS, MICS, UHS, STEPs: The wealth index allows us to look at physical assets only; not income, expenditures, savings, or access to credit.
5. All: Requesting access to raw data is often complicated and unclear which prolong the progresses of the study.
Challenge
Recommendation
1. Specific or booster surveys of the urban poorHousehold data can capture sufficient number of
urban poorest people.
2. Improved sampling methodsHouseholds data can be representative of urban
poorest people.
3. Mechanisms for sharing information Easier mechanisms to access raw data.

Thank you for your attention


