Business and Economic Research ISSN 2162-4860 2017, Vol. 7, No. 2 http://ber.macrothink.org 212 Households‟ Willingness to Pay for Community Based Health Insurance Scheme: in Kewiot and EfratanaGedem Districts of Amhara Region, Ethiopia Eshetu Mamo (MSc) (Corresponding author) Ethiopia Health Insurance Agency, PO BOX 164, Debre Berhan, Ethiopia Tel: 251-912-215-732 E-mail:[email protected]Getamesay Bekele (PhD) Department of Economics, Debre Berhan University PO BOX 3011CODE 1250, Debre Berhan, Ethiopia Tel: 251-912-049-636 E-mail:[email protected]Received: July 8, 2017 Accepted: August 15, 2017 doi:10.5296/ber.v7i2.11513 URL: https://doi.org/10.5296/ber.v7i2.11513 Abstract The purpose of this study is to examine determinants of Rural Households‟ Willingness to pay (WTP) for Community Based Health Insurance Scheme, in Kewiot and EfratanaGedem districts of Amhara region, Ethiopia. A cross-sectional design that followed a quantitative approach was used. Pre-tested structural and interviewer administered questionnaire was used to collect the desired data. A total of 392 sample rural households were taken by systematic random method. The contingent valuation method of double bounded dichotomous choice format (with calibration strategy) is applied to elicit households‟ willingness to pay for the scheme. An interval regression model is used to estimate the mean willingness to pay and to explore the degree of association between predicted WTP and predictor variables. Households‟ WTP for the scheme is found significantly associated with factor variables such as gender, education status, family size, level of awareness about the scheme, respondents‟ trust in the scheme management, family ill health experience, households‟ perceptions on health service quality, and their annual income level. The mean WTP amount is found 211ETB ($10.5) per annum per household. The result clearly shows that 79 % rural households are willing to pay for the scheme. Therefore, despite these factors affecting the rural households‟ WTP, there is a potential demand for the community based health insurance scheme. We suggest that, among
Transcript
Business and Economic Research
ISSN 2162-4860
2017, Vol. 7, No. 2
http://ber.macrothink.org 212
Households‟ Willingness to Pay for Community Based
Health Insurance Scheme: in Kewiot and
EfratanaGedem Districts of Amhara Region, Ethiopia
Eshetu Mamo (MSc) (Corresponding author)
Ethiopia Health Insurance Agency, PO BOX 164, Debre Berhan, Ethiopia
The purpose of this study is to examine determinants of Rural Households‟ Willingness to pay
(WTP) for Community Based Health Insurance Scheme, in Kewiot and EfratanaGedem
districts of Amhara region, Ethiopia. A cross-sectional design that followed a quantitative
approach was used. Pre-tested structural and interviewer administered questionnaire was used
to collect the desired data. A total of 392 sample rural households were taken by systematic
random method. The contingent valuation method of double bounded dichotomous choice
format (with calibration strategy) is applied to elicit households‟ willingness to pay for the
scheme. An interval regression model is used to estimate the mean willingness to pay and to
explore the degree of association between predicted WTP and predictor variables. Households‟
WTP for the scheme is found significantly associated with factor variables such as gender,
education status, family size, level of awareness about the scheme, respondents‟ trust in the
scheme management, family ill health experience, households‟ perceptions on health service
quality, and their annual income level. The mean WTP amount is found 211ETB ($10.5) per
annum per household. The result clearly shows that 79 % rural households are willing to pay
for the scheme. Therefore, despite these factors affecting the rural households‟ WTP, there is a
potential demand for the community based health insurance scheme. We suggest that, among
Business and Economic Research
ISSN 2162-4860
2017, Vol. 7, No. 2
http://ber.macrothink.org 213
others, to improve the quality of health care and to build up community awareness and trust on
the scheme management have paramount to enhance households‟ WTP and hence, to expand
health insurance coverage.
Keywords: Community Based Health Insurance, Willingness to Pay, Double Bounded,
Calibration Strategy, Ethiopia
1. Introduction
Achieving universal and equitable access to quality health care requires a sustainable
financial resource that meets the health needs of the population, without causing
impoverishment. Such accesses can contribute to the attainment of development goals and
economic growth through improved health status (Ahuja, 2004). However, around 1.3 billion
people globally lack access to the most basic health care, while 100 million people are pushed
into poverty because of direct payments for health care services (Ejughemre, 2014).The
situation is more serious in developing countries and while governments still strive to tackle
poverty, the issue of health care financing for the poor has remained unsolved, which causes
vicious circle of poverty (WHO, 2005 and Weil, 2013). In addressing this issue, health
financing systems through general taxation and with the development of health insurance are
generally recognized as two important strategies to achieve universal health coverage (Carrin
et al., 2005).In tax-funded systems, the population contributes indirectly via taxes, where as
in health insurance systems (e.g. social health insurance and community based health
insurance) individuals, households and organizations directly pay the premium on the basis of
employee‟s salary or means of income (Wiesmann, 2000).
Community based health insurance (CBHI), sometimes called community pre-payment
schemes, is widely accepted as viable option to increase both vertical and horizontal equity in
health, specially in the rural area of developing countries (Ejughemre, 2014).The reasons
behind for encouraging CBHI schemes are its particular role to reduce financial barriers to
health care utilization and its redistributive effects (Binam et al., 2007). Among others, South
Korean, Ghana and Rwanda are best example to take lessons from developing countries,
while South Korea is often cited as a success story for its rapid achievement of universal
health coverage through national health insurance (Xu et al., 2010). However, in most African
countries, public and private health insurance covers almost exclusively the formal sector and,
therefore, achieves no more than 10 percent of the population coverage. As a result, having
majority of their population involving informal sector, number of African countries have been
implementing CBHI scheme (Noubiap et al., 2013 and Ejughemre, 2014).
In 2010, Ethiopia also introduced health insurance program with the mission to achieve
universal primary health coverage, i.e providing basic package of essential health service for
all Ethiopian. However, social health insurance is still on its preparation to start, while CBHI
scheme is at its pilot stage, and hence, national health insurance implementation is remaining
behind its goal (Anagaw et al., 2015). Based on health insurance guideline of the Federal
Ministry of health (FMoH), Amhara National Regional State (ANRS) had designed the
regional community based health insurance scheme which was begun in 2011 only in three
pilot districts, and till 2015 it had been expanding to 98 districts. Among these, Kewiot and
Business and Economic Research
ISSN 2162-4860
2017, Vol. 7, No. 2
http://ber.macrothink.org 214
EfrataGedm are the two pilot districts in north showa zone of the region, where CBHI scheme
was established in 2013.Eventhough the local governments have been striving to promote the
general benefit of the CBHI scheme, health insurance coverage is too low(only31% in 2015),
while high dropout rate was recorded in subsequent two years. Thus, it shows that the CBHI
scheme is less likely to sustain unless major improvements to be done which requires an
investigation on household‟s willingness to pay for the scheme.
On the other hand, CBHI scheme is based on voluntarism (not obligatory),so that households
are assumed free to choose between pay and/or not to pay for the scheme premium. Moreover,
in principle it requires high community participation in all round including premium setting
(Defourny et al., 2008). However, households‟ WTP in these districts was not assessed at all.
Thus, it was very important to examine rural households‟ willingness to pay (WTP) for the
scheme in the study area, which required employing contingent valuation method (Cameron,
1988; Hoyos & Mariel, 2010 and Ejughemre, 2014).
In this regard, different empirical studies were conducted based on contingent valuation
method(CVM) to value households‟(individual‟s) willingness to pay for community health
insurance schemes(Binam et al.,2007;Ataguba,2008;Onwujekwe et al.,2009;Oriakhi et
al.,2012;Bukola & Usman,2013 and Tundui & Macha,2014). However, they used a single
bounded dichotomous choice (SBDC) and or another bidding game approach which are
considered statistically less efficient to elicit information about households‟ actual WTP
(Champ et al., 2009). This study used double bounded format which is recently recognized as
statistically efficient to elicit stated preference of WTP. More specifically, the methodological
contribution of this study is the application of calibration method to control the hypothetical
bias inherent in the CVM method so that ex-post certainty calibration of „yes‟ responses
yields a more efficient estimation (Loomis, 2013).
Therefore, this study assessed the voluntary and community based health insurance scheme,
aiming to investigate rural households‟ WTP and to contribute for health insurance policy
environment. Specifically, the study had the following objectives.
To describe households‟ willingness to pay distribution (using both double bounded and
single bonded response) for CBHI scheme
To investigate factors affecting households‟ willingness to pay for the CBHI scheme (using
double bounded dichotomous choice).
To estimate the average amount of money that households‟ are willing to pay for CBHI
Scheme.
2. Literature Review
A significant number of studies have been used CVM to estimate the WTP for CBHI scheme
in some rural areas of developing countries. So far, the review made on such literatures
focused on biding format, findings of WTP amount and its determinant factors are discussed
below.
Dong et al., (2004) examined households‟ differential WTP (from 688 households (HHs)) for
Business and Economic Research
ISSN 2162-4860
2017, Vol. 7, No. 2
http://ber.macrothink.org 215
CBHI premium for themselves and for other household members in North West Burkenafaso.
It applied a bidding game elicitation format to collect WTP information. The report shows
that the mean WTP for insurance for themselves (=3575 CFA) was twice more than their
mean WTP as a whole (1759 CFA).Among other determinant variables, Age, Gender, income
and educational level were found significantly associated with WTP. It showed that the old,
the females, the poor and these with less schooling had a lower WTP than their counter parts
(young, males, rich and these with more year of schooling respectively). This result is similar
with the findings by Onwujekwe et al. (2009), conducted in Nigeria. The justification made
by the later is that males stated higher WTP amounts than females could be an income effect
because males generally earn more than females. It suggested that, those living in rural areas
tend to be less willing to pay than those in urban areas because the former earn less and
mostly depend on subsistence farming for survival.
Similarly, Binam et al.(2007) assessed households‟ WTP for CBHI scheme in Cameroon. The
study was employed biding game format to elicit information from households (n= 837). It
revealed that 67% of respondents were WTP for the CBHI scheme while the estimated
average WTP was 9840FAFA ($17) per year. Among others, household‟s income level,
education, morbidity rate, Gender, community organization‟s experience, household‟s
perception of the medical staff attitude and the availability of essential drugs at the health
center were found significant variables determined WTP amount.
Ataguba (2008) also investigated households‟ WTP for the CBHI in Nigeria. It was based on
unidirectional biding game type of elicitation format, which proposed the use of in-kind
payment in the form of Agricultural commodities. The result shows that quarterly average
WTP amount was estimated as N1010 ($7.77). Variables such as Gender, households size,
health status, quality of health care center, confidence in the proposed scheme, distance to the
nearest health center and wealth, were significantly determine how much households WTP
for the scheme. However, unlike many empirical studies (Binam et al., 2007, Adane et al.,
2014 and Bukola & Usman, 2013), it found that level of education has insignificant impact
on WTP.
Oriakhi et al. (2012) conducted a study on determinants of rural households‟ willingness to
participate in CBHI scheme in Nigeria (Edo State).The finding revealed that 56.4 %( out of
360 samples HHs) expressed their willingness to participate in the scheme. It also reported
that household size and membership of the town association are key demographic factors,
while income, medical expense incurred, credit opportunities were found important economic
factors that significantly determine the rural households‟ willingness to participate.
Another cross sectional comparative study in Nigeria was conducted by Bukola & Usman
(2013) with the objective to assess the WTP for CBHI scheme among 450 rural and 450
urban households (HHs) in Osum State. Using open ended elicitation format, this study found
that large number of rural households (82%) were WTP than urban households (51.6%),
while the estimated average WTP amounts are N721.7K per year and N1798.9k per year,
respectively. The study reported that size of household members, level of education, income,
distance to the health center, marital status, age and male gender are major factors contribute
Business and Economic Research
ISSN 2162-4860
2017, Vol. 7, No. 2
http://ber.macrothink.org 216
to households‟ WTP for the scheme. The other important finding is that income variable is
negatively and positively associated with rural and urban HHs WTP, respectively. Age
variable also positively associated with the rural HHs WTP but negatively related with urban
households‟ WTP.
Adane et al.(2014) assessed households‟ maximum WTP for the scheme in Fogera district
found in North West of Ethiopia. The study employed double bounded format to assess
maximum WTP. Using multiple linear regression models, it revealed that 80% of households
were willing to pay for the scheme, while the mean amount of WTP was 187.4birr per year.
The study revealed that gender, households‟ size, schooling experience, being farmer and
merchant household, were significantly associated the WTP.
Tundui and Macha (2014) investigated the effect of social capital on HHs WTP for CBHI
scheme in rural Tanzania. It used to unidirectional (single bonded dichotomous choice) biding
game to elicit information about households‟ WTP (n= 274 HHs).The result shows that social
capital variables such as membership in social organization and network, Trust among
community members, Trust on scheme management, and income level are positively and
significantly related to WTP. On the other hand, unlike the pervious literatures, age of
household heads, education level, household size, and participation in health insurance are
found not affecting willingness to pay.
In general, these empirical studies were either based on open ended or closed ended biding
game (including iterative biding game) that follows SBDC type of elicitation formats. In this
regard, there is no absolutely correct and or universally accepted method to deal households
willingness to pay (for any nonmarket good/services). However, many authors agreed on that
the SBDC methods yields statistically less efficient to explain the actual WTP as compared to
DBDC format (Champ et al., (2009)). These studies also couldn‟t address the hypothetical
bias that most often leads to an over estimation of WTP. The results may, thus, not be fully
reliable for policy purposes (Kedir, 2011 and Loomis, 2013).
3. Methodology and Data
3.1 Data Source
This study is based on a household survey using structured survey instruments (i.e interview
questionnaires) to obtain desired data. Hence, it used solely primary data source.
3.2 Sampling Strategy
The study populations are all rural households who are currently living in these two pilot
districts. In order to gather quantitative data, the list of totality of households in those two
districts was considered as sample frame for the study, so that representative sample
households were chosen. However, CBHI scheme is designed for whom only involved in
informal sector.Hence, respondents who are working in the formal organization were
excluded from the study. Beside, these two districts have similar socio-economic
characteristics. Therefore, the sample size was calculated using single population proportion
formula (Singh, 2007). In order to obtain these sample households, multi-stage sampling
Business and Economic Research
ISSN 2162-4860
2017, Vol. 7, No. 2
http://ber.macrothink.org 217
technique was employed as following. First stage, simple random sampling method was used
to select sample „kebele‟1 administrations. Therefore, taking the list of kebeles from each
district as a sample frame, twelve Kebeles (six kebeles from each district) that accounts 32%
of the total kebeles were randomly selected out of 38 total kebeles (18 in Kewiot and 20 in
EfrataGedm).In the second stage, sample households were selected using systematic random
sampling method.
3.3 Method of Data Collection
Quantitative data was collected from sample households through face-to-face interview.
Structured questionnaire was prepared in English and for the purpose of easy communication
during interview, the questionnaire was translated to local language „Amharic‟, then back to
English to ensure the consistency of language during data analysis. Before launching the final
study, a pilot study was conducted. It had two objectives: (1) To test the design of the
questionnaire (reliability and validity) and (2) To draw information of the relevant initial bid
vector (described in section 3.4).
Therefore, content validity approach2 was employed to validate the research instrument,
while reliability was tested using Cronbach‟s alpha, which is a common way of computing
correlation values among the questions on instruments.The standardized test of alpha
coefficient was found 0.9223 which shows the research instrument is reliable enough. The final
face to face interview was took place from February 15, 2016 to May 25, 2016. A total of 422
questionnaires were administrated through face-to-face interview among sample households.
Then, after discarding a few incomplete responses, a total of 392 questionnaires remain for the
analysis. Thus, the response rate was 93%.
3.4 Elicitation Format and Bid Design
Double bounded dichotomous choice (DBDC) model with follow up certainty question
introduced by Champ et al. (1997) was used in this study, which requires setting a series of bid
intervals so that respondents could be asked yes or no questions for both lower and upper bids.
Here, the critical issue is how to set the initial bid amounts on which the second bids can be
derived from. In this regard, some literatures suggest to use focused group discussion or to
conduct pilot study (Hanemann et al., 1991 and Kedir, 2011). Thus, pilot survey was conducted
among 50 households. After announcing the main objective of the pilot study, the maximum
amount of money they are willing to pay per year and other basic socioeconomic information
was collected using the first version of interview questionnaire. To fit the observed data points
to underlying probability distribution, nonparametric kernel density estimation was used as
shown by the figure 1 below.
1„Kebele‟ is the lowest administrative body in Ethiopia which comprises at least population of 5000. 2Validity was traditionally subdivided into three categories: content, criterion-related and construct validity.
Content validity includes any validity strategies focus on the content of the test (Brown, 2000).
Business and Economic Research
ISSN 2162-4860
2017, Vol. 7, No. 2
http://ber.macrothink.org 218
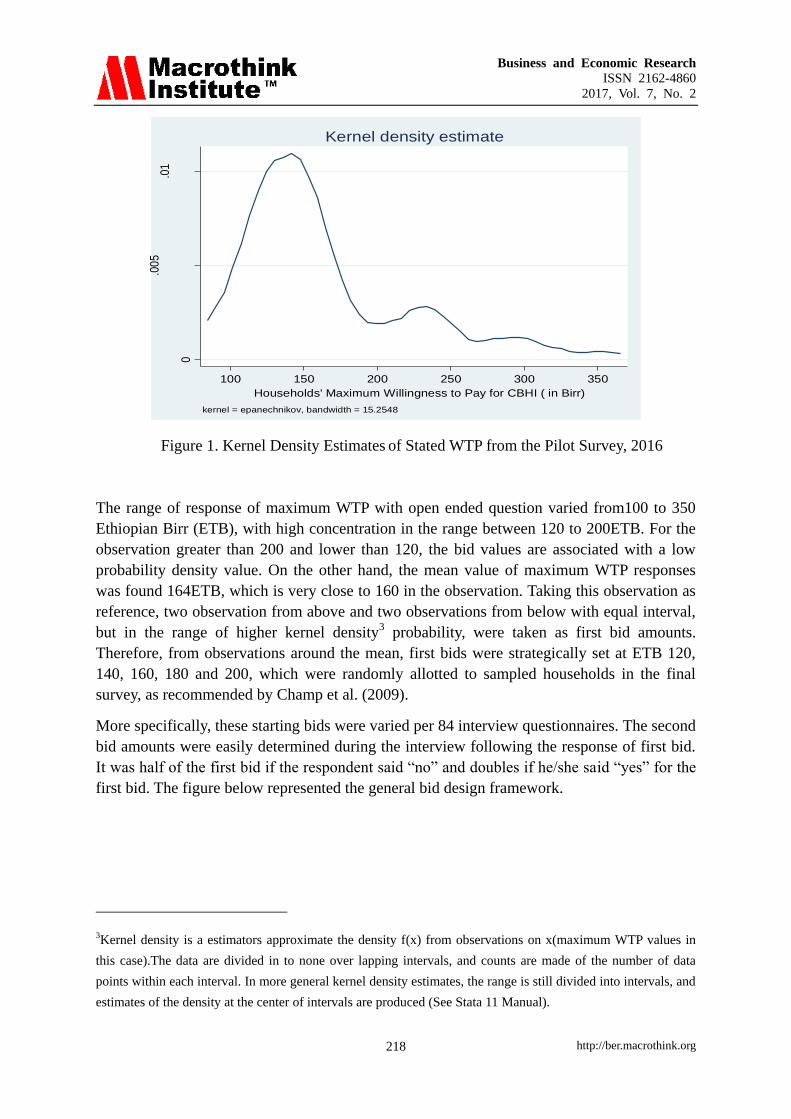
Figure 1. Kernel Density Estimates of Stated WTP from the Pilot Survey, 2016
The range of response of maximum WTP with open ended question varied from100 to 350
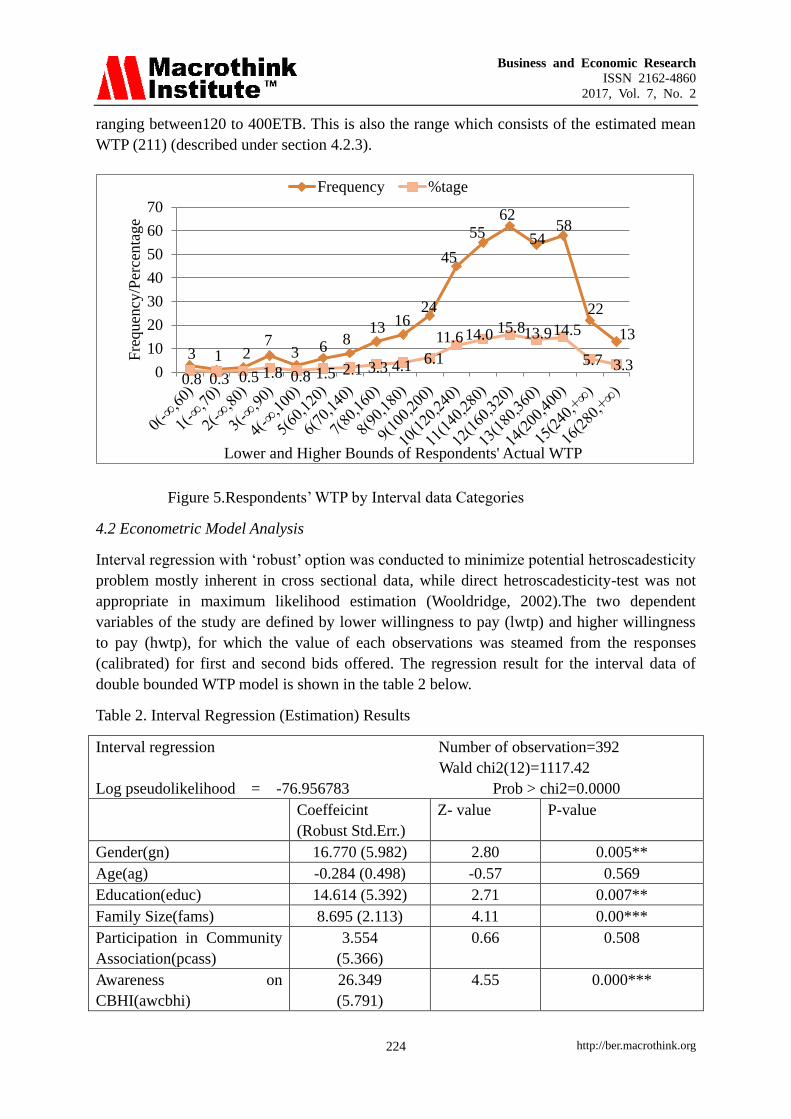
Ethiopian Birr (ETB), with high concentration in the range between 120 to 200ETB. For the
observation greater than 200 and lower than 120, the bid values are associated with a low
probability density value. On the other hand, the mean value of maximum WTP responses
was found 164ETB, which is very close to 160 in the observation. Taking this observation as
reference, two observation from above and two observations from below with equal interval,
but in the range of higher kernel density3 probability, were taken as first bid amounts.
Therefore, from observations around the mean, first bids were strategically set at ETB 120,
140, 160, 180 and 200, which were randomly allotted to sampled households in the final
survey, as recommended by Champ et al. (2009).
More specifically, these starting bids were varied per 84 interview questionnaires. The second
bid amounts were easily determined during the interview following the response of first bid.
It was half of the first bid if the respondent said “no” and doubles if he/she said “yes” for the
first bid. The figure below represented the general bid design framework.
3Kernel density is a estimators approximate the density f(x) from observations on x(maximum WTP values in
this case).The data are divided in to none over lapping intervals, and counts are made of the number of data
points within each interval. In more general kernel density estimates, the range is still divided into intervals, and
estimates of the density at the center of intervals are produced (See Stata 11 Manual).
0
.00
5.0
1
Pro
babi
lity
De
nsity
100 150 200 250 300 350
Households' Maximum Willingness to Pay for CBHI ( in Birr)
kernel = epanechnikov, bandwidth = 15.2548
Kernel density estimate
Business and Economic Research
ISSN 2162-4860
2017, Vol. 7, No. 2
http://ber.macrothink.org 219
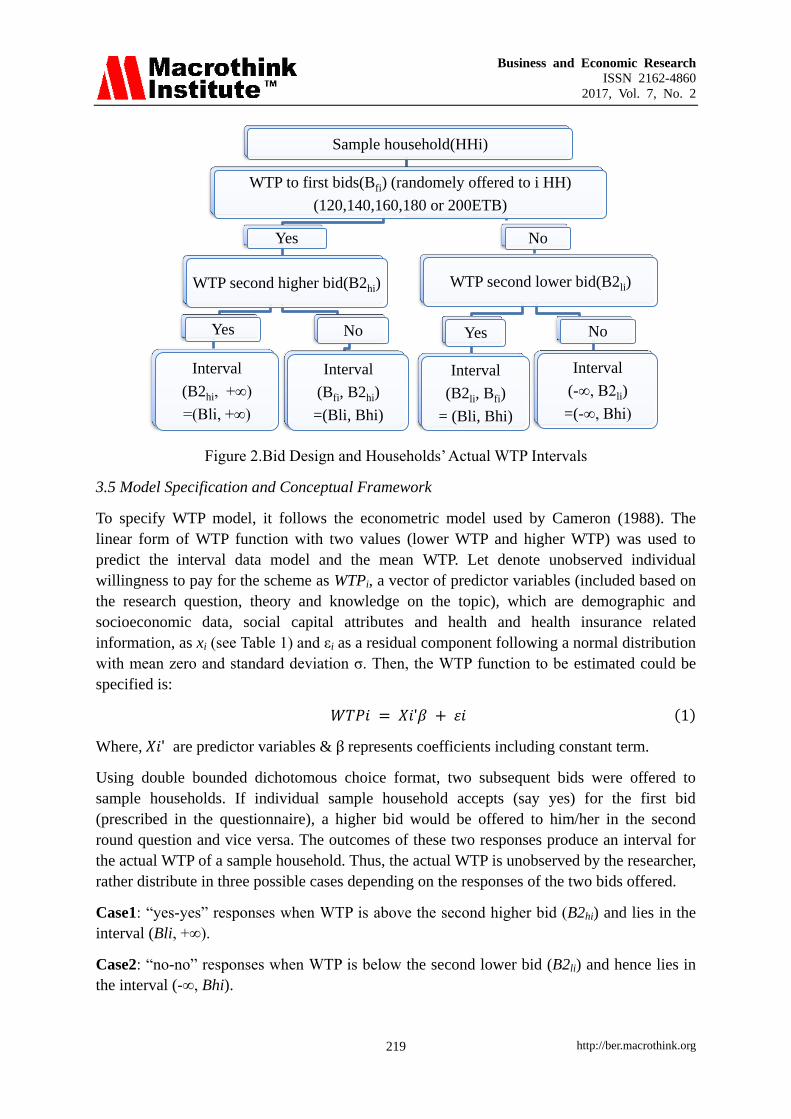
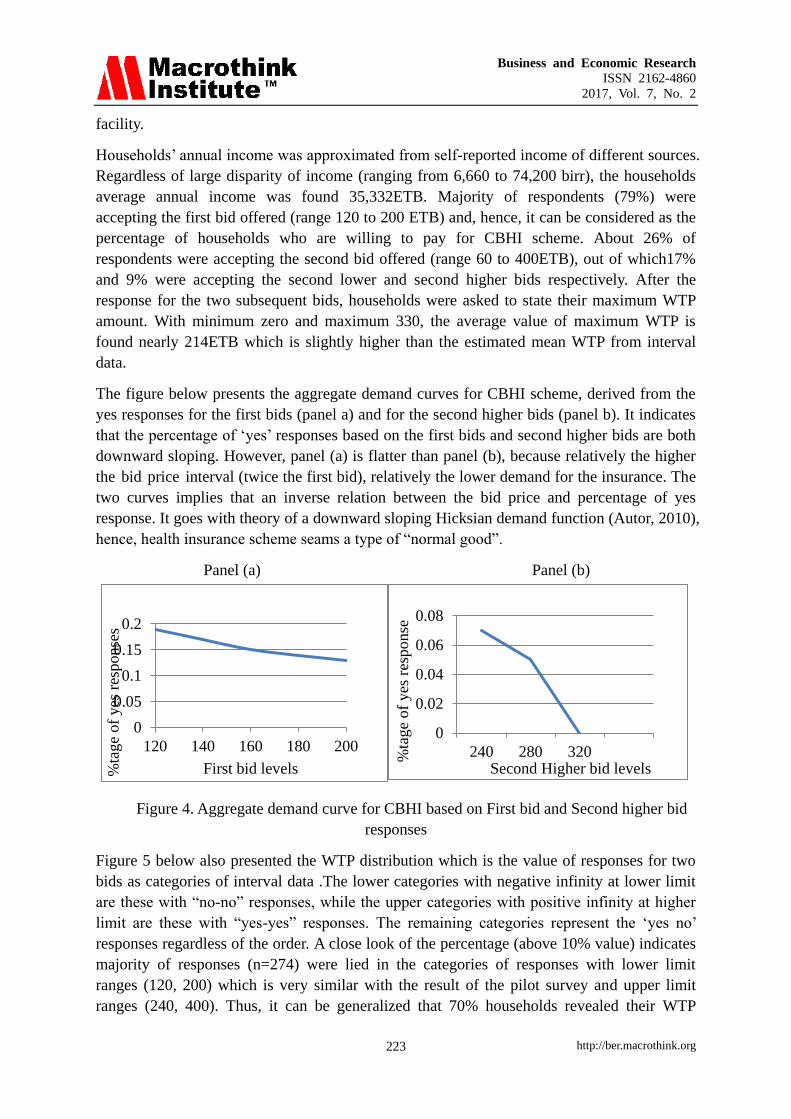
Figure 2.Bid Design and Households‟ Actual WTP Intervals
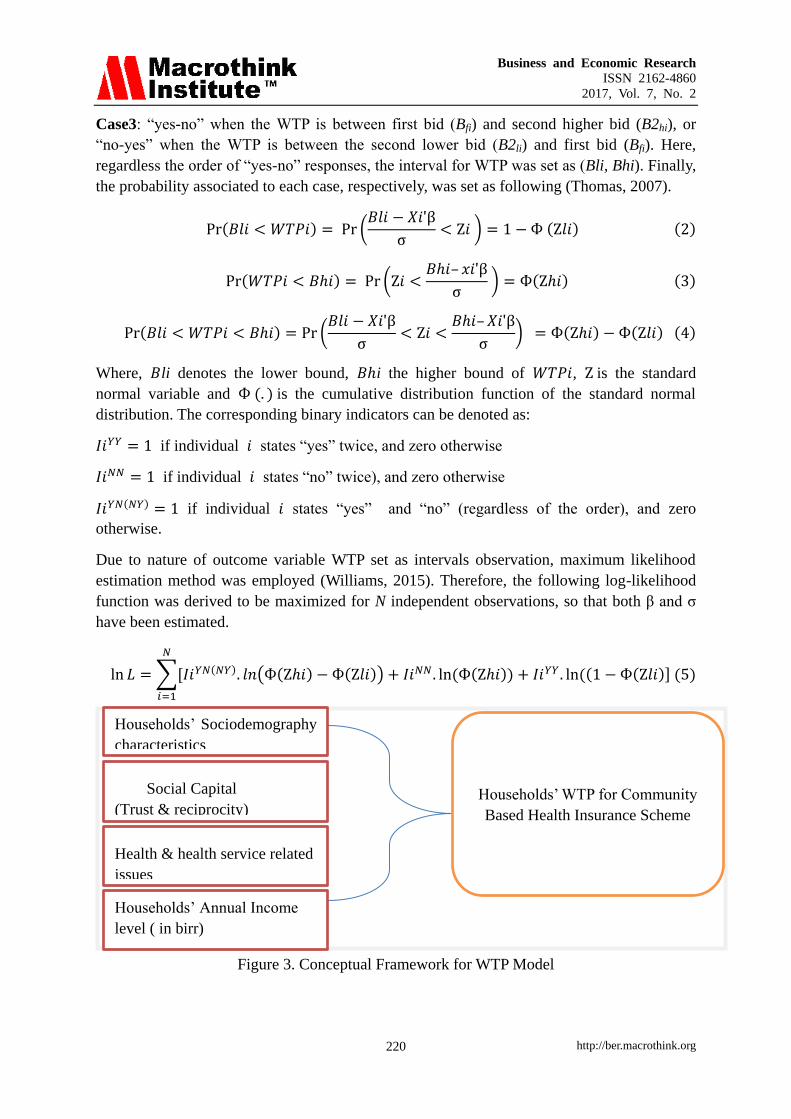
3.5 Model Specification and Conceptual Framework
To specify WTP model, it follows the econometric model used by Cameron (1988). The
linear form of WTP function with two values (lower WTP and higher WTP) was used to
predict the interval data model and the mean WTP. Let denote unobserved individual
willingness to pay for the scheme as WTPi, a vector of predictor variables (included based on
the research question, theory and knowledge on the topic), which are demographic and
socioeconomic data, social capital attributes and health and health insurance related
information, as xi (see Table 1) and εi as a residual component following a normal distribution
with mean zero and standard deviation σ. Then, the WTP function to be estimated could be
specified is:
𝑊𝑇𝑃𝑖 = 𝑋𝑖ʹ𝛽 + 𝜀𝑖 (1)
Where, 𝑋𝑖ʹ are predictor variables & β represents coefficients including constant term.
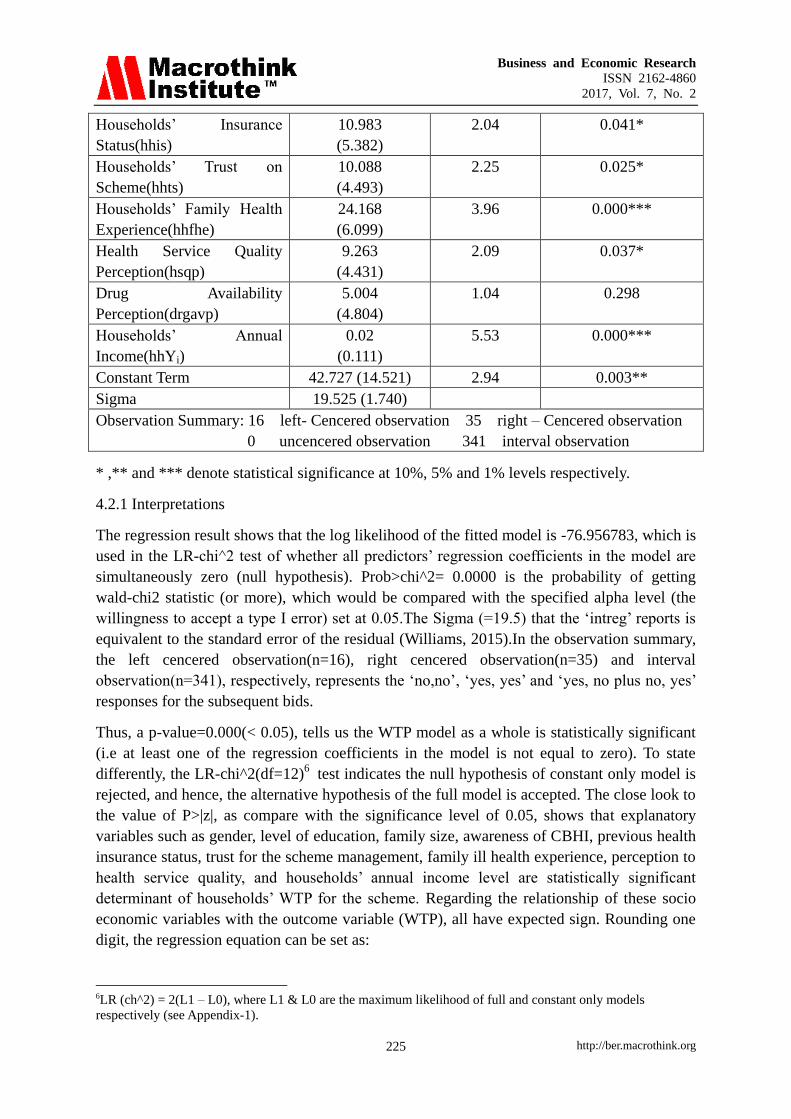
Using double bounded dichotomous choice format, two subsequent bids were offered to
sample households. If individual sample household accepts (say yes) for the first bid
(prescribed in the questionnaire), a higher bid would be offered to him/her in the second
round question and vice versa. The outcomes of these two responses produce an interval for
the actual WTP of a sample household. Thus, the actual WTP is unobserved by the researcher,
rather distribute in three possible cases depending on the responses of the two bids offered.
Case1: “yes-yes” responses when WTP is above the second higher bid (B2hi) and lies in the
interval (Bli, +∞).
Case2: “no-no” responses when WTP is below the second lower bid (B2li) and hence lies in
the interval (-∞, Bhi).
Sample household(HHi)
WTP to first bids(Bfi) (randomely offered to i HH)
(120,140,160,180 or 200ETB)
Yes
WTP second higher bid(B2hi)
Yes
Interval
(B2hi, +∞)
=(Bli, +∞)
No
Interval
(Bfi, B2hi)
=(Bli, Bhi)
No
WTP second lower bid(B2li)
Yes
Interval
(B2li, Bfi)
= (Bli, Bhi)
No
Interval
(-∞, B2li)
=(-∞, Bhi)
Business and Economic Research
ISSN 2162-4860
2017, Vol. 7, No. 2
http://ber.macrothink.org 220
Case3: “yes-no” when the WTP is between first bid (Bfi) and second higher bid (B2hi), or
“no-yes” when the WTP is between the second lower bid (B2li) and first bid (Bfi). Here,
regardless the order of “yes-no” responses, the interval for WTP was set as (Bli, Bhi). Finally,
the probability associated to each case, respectively, was set as following (Thomas, 2007).
Pr(𝐵𝑙𝑖 < 𝑊𝑇𝑃𝑖) = Pr (𝐵𝑙𝑖 − 𝑋𝑖ʹβ
σ< Ζ𝑖 ) = 1 − Ф (Ζ𝑙𝑖) (2)
Pr(𝑊𝑇𝑃𝑖 < 𝐵𝑖) = Pr (Ζ𝑖 <𝐵𝑖– 𝑥𝑖ʹβ
σ ) = Ф(Ζ𝑖) (3)
Pr(𝐵𝑙𝑖 < 𝑊𝑇𝑃𝑖 < 𝐵𝑖) = Pr (𝐵𝑙𝑖 − 𝑋𝑖ʹβ
σ< Ζ𝑖 <
𝐵𝑖– 𝑋𝑖ʹβ
σ) = Ф(Ζ𝑖) − Ф(Ζ𝑙𝑖) (4)
Where, 𝐵li denotes the lower bound, 𝐵i the higher bound of 𝑊𝑇𝑃𝑖, Ζ is the standard
normal variable and Ф (. ) is the cumulative distribution function of the standard normal
distribution. The corresponding binary indicators can be denoted as:
𝐼𝑖𝑌𝑌 = 1 if individual 𝑖 states “yes” twice, and zero otherwise
𝐼𝑖𝑁𝑁 = 1 if individual 𝑖 states “no” twice), and zero otherwise
𝐼𝑖𝑌𝑁(𝑁𝑌) = 1 if individual 𝑖 states “yes” and “no” (regardless of the order), and zero
otherwise.
Due to nature of outcome variable WTP set as intervals observation, maximum likelihood
estimation method was employed (Williams, 2015). Therefore, the following log-likelihood
function was derived to be maximized for N independent observations, so that both β and σ
One important thing about interval regression, as opposed to other ordinal methods, is that the
interpretation of the parameters can be done the same as the way for the OLS estimation does
(William R., 2015). However, because the observed values for the outcome variable (WTP)
are intervals, not exact values, the effect of these coefficients are on predicted value of WTP,
not simply on the mean of observed values. Hence, interpretation of these coefficients is
made accordingly (i.e based on ceteris paribus).
A nominal variable gender (gn) is statistically significant. While other variables held constant,
as compared to female headed household, being male household head increases the predicted
WTP for the scheme by 16.8ETB. This may be as a result of income effect, due to the fact
that in most rural setting of Ethiopia, female‟s income is highly dependent on male and or
earns money less than males. This finding is consistent with results obtained by Adane et al.,
2014, Binam et al.,(2007), Dong et al.,(2004), Bukola & Usman(2013) and Onwujekwe et
al.,( 2009).
The model also shows that the household head education status (educ) is significantly and
positively affects the predicted amount of money they are WTP for the CBHI scheme. As
compared to these who did not have formal education, these who attended formal education
have 14.6 higher predicted WTP, holding other variables constant. This is in line with result
of the studies done in Cameroon by Binam et al., (2007), in North West Burkinafaso by Dong
et al., (2004) and in rural Nigeria by Ataguba et al.,(2007).
Households with larger family size are willing to pay a higher amount than households with
smaller family size. Ceteris paribus, the coefficient of family size (fams) shows that one extra person join the household member increases the predicted WTP for the scheme by 8.7ETB.
This may be due to the fact that rural households always link the probable financial burden they
could face when their families seek medical treatment with the amount they are willing to pay
for the scheme. This is inline with the study conducted in Fogera district, ANRS of Ethiopia, by
Adane et al.(2014) and in Nigeria (Edo State) by Oriakhi et al.(2012).
The rural households in the study area, who are awared enough about the basic concept of
CBHI program (awcbhi), tend to be more willing than their counterparts. Holding other
variables constant, respondents‟ with enough awareness have 26.4ETB more WTP than these
not awared households. This finding is consistent with the finding in rural Nigeria, reported by
Ataguba et al. (2007).
The respondents‟ health insurance status (hhis) before interview is found positively influence
their WTP for the scheme. Holding other variables constant, it shows that the insured
households before interview have more WTP by 11ETB than these not insured. It was
inconsistent with Adane et al.(2013), probably due to the difference in the experience of
health insurance in terms of the time period since its establishment.
Households‟ trust (hhts) towards the general CBHI program management is found significantly
and positively affects their WTP for the scheme. The coefficient indicates that, under constant
Business and Economic Research
ISSN 2162-4860
2017, Vol. 7, No. 2
http://ber.macrothink.org 227
condition in other predictors, respondents who have trust on the scheme management have
more WTP by 10.1ETB than these who are distrusted. This finding is similar with the study
finding in Nigeria conducted by Ataguba(2008) and in Tanzania by Tundui & Macha(2014).
Household family ill health experience (hhfhe) is found another important factor that positively
affects the amount of money they are willingness to pay for CBHI scheme. Holding other
variables constant, respondents whose family was experienced ill health in last 12 months
before interview revealed 24.2ETB higher predicted WTP than their counterparts. This result is
consistent what was fond in Cameroon by Binam et al.(2007) and in rural Nigerian by Ataguba
et al. (2007). Thus, perhaps, it implies that rural households traditionally linked their family ill
health experience with the likely health cost in the future, and hence, consistent with theory of
„adverse selection behavior‟.
The model also shows that health service quality perception (hsqp) is found another significant
variable affecting the amount respondent are willing to pay for CBHI scheme. Respondents
who perceived quality health service (provided by the near health facility), have 9.3ETB higher
predicted willing to pay for the scheme than these who don‟t perceived quality health service,
while holding other predictor variables in the model constant. This was found consistent with
the study of Ataguba(2008) in Nigeria .
Households‟ annual income (hhYi) is also found an important variable in explaining their
decision on the amount of willing to pay for the scheme. It shows that for one ETB increase in
households‟ annual income, ceteris paribus, would increases the predicted WTP by 0.02ETB.
This finding is consistent with number of study findings including the study conducted in rural
Nigeria by Ataguba et al., (2007), in Cameroon by Binam et al., (2007), in Burkenafaso by
Dong et al., (2014) and in Tanzania by Mach et al., (2014). Thus, the amount households are
WTP for the scheme is an increasing function of their income level. This is due to the fact that
they have been traditionally linked to the ability to pay principle.
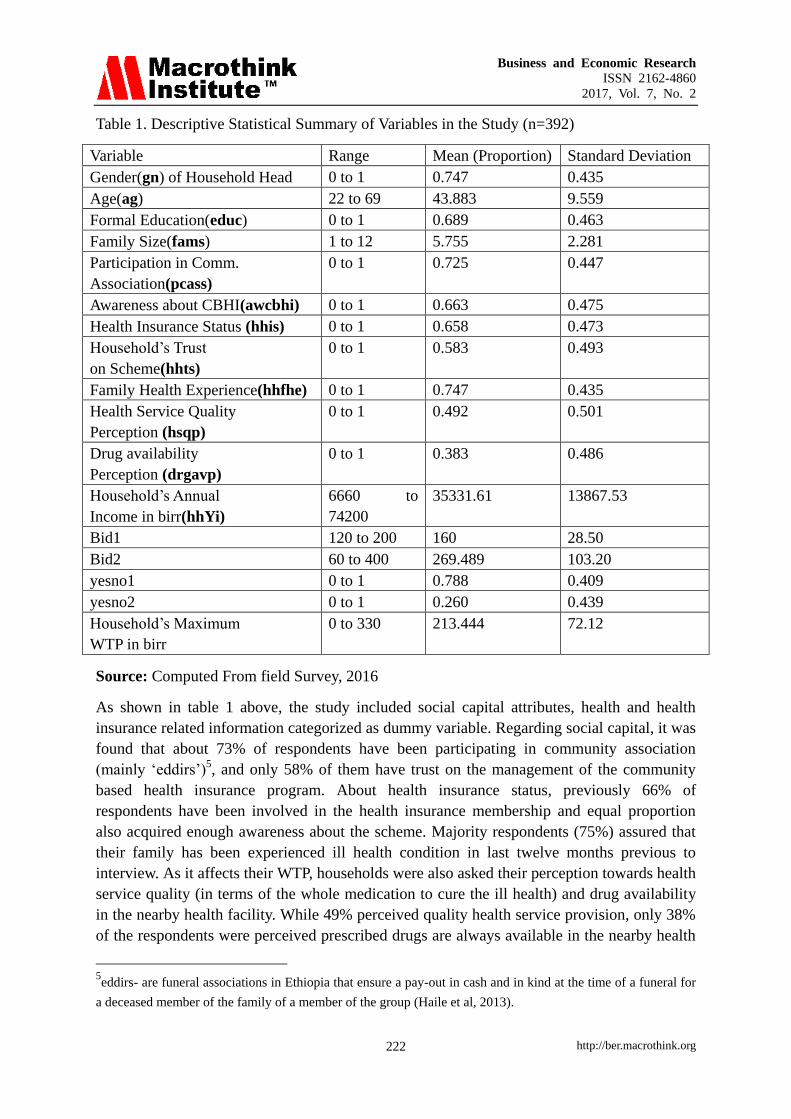
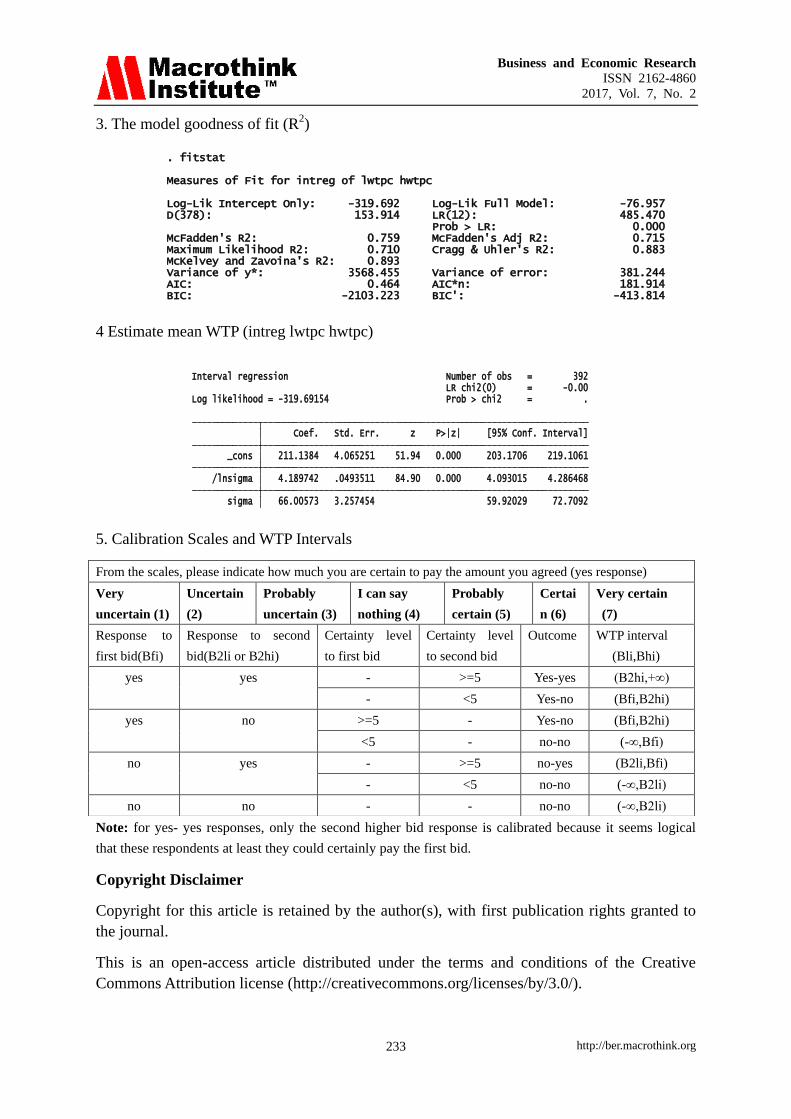
4.2.2 The Model Goodness of Fit
A way to find R2
is the online “findit fitstat” stata command right after running the interval
regression which provides a number of measures of fit. The Maximum Likelihood pseudo-R2
reflects a significant improvement of the full model over the intercept only model. Therefore,
the WTP model having 72% explained variation is said to be reasonably fitted (see Appendix
-1).
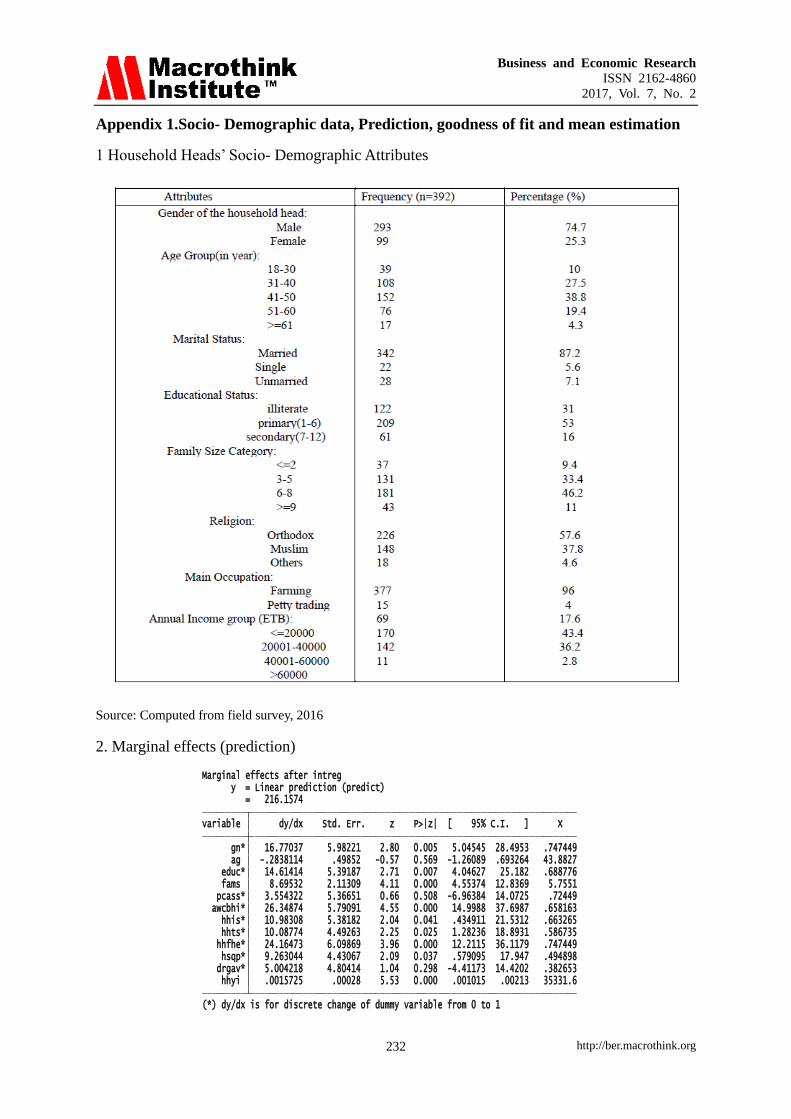
4.2.3 Estimation of Mean Willingness to Pay
Interval regression without any predictor variables, actually the intercept is the only predictor,
gives the estimated mean WTP i.e constant value (Conroy, 2005). Accordingly, the estimated
result shows that the mean willingness to pay is found 211 ETB. This is less than the
predicted mean value of 216 (i.e Marginal effects after intreg, linear prediction = 216.26696
(see Appendix-1)).Therefore, as some literatures point out (Conroy, 2005 and Kedir, 2011) the
conservative way of mean estimation is preferred for effective policy design.
Business and Economic Research
ISSN 2162-4860
2017, Vol. 7, No. 2
http://ber.macrothink.org 228
5. Conclusion and Policy Implication
The findings of this study revealed that majority (79%) of the rural households in the study
area were willing to pay for CBHI scheme. The average amount of money, they are willing to
pay, was ETB 211($10.5) per household per annum. It is much higher than ETB 144, which
is the annual premium value designed for pilot strategy, for which households up to five
family members should pay. Therefore, it could significantly improve the source of health
care finance and, hence, encouraging to launch the national health insurance program.
However, the amount that households are willing to pay is found significantly associated with
family head gender, educational status, level of awareness about the scheme, family size,
level of trust households have on the scheme management, ill health experience in the family,
and households‟ perception towards the quality of health care provision in the nearby health
facility, and their annual income.
From the finding, the following are important points to be considered in the policy
implication for the expansion of health insurance scheme. It needs health care quality
indication to be developed in to the contracts between health insurance scheme and health
service providers, so that health facilities could be monitored accordingly in terms of best
practice in health quality assurance and standard treatment protocols. This monitoring and
evaluation should be with incentives to promote quality care. It requires intensive awareness
creation and trust building programs in the community, particularly for those don‟t have
formal education and also for these don‟t insured before. The premium setting should take in
to account the rural households family size and their income sources, while selective strategy
to be include to support these female headed households not to be vulnerable groups in the
community.
For future researches, it is better to employ principal component analysis method following
wealth approach for estimation of income source of these rural households rather than
household‟s self-estimated annual income used in this study. The study has also shows only
the temporal relationship between dependent and independent variables. Thus, the researcher
suggests comprehensive and long term prospective studies might provide better evidence in
assessing households‟ willingness to pay or health insurance purchase.
Acknowledgement
Our great thanks and sincere appreciation goes to both Kewiot and EfratanaGedem district
Administration staffs and CBHI officers for their firm cooperation during data collection.
Special gratitude owed to two interviewers Ato Natan Hason and w/o Stehaynesh Debela, who
fully involved with much devotion from the beginning to the end of data collection. This
research also financed by Debre Berhan University and Ethiopia Health Insurance Agency. We
thank all the administrative bodies in these organizations. We also thank Ato Habtamu Bekele
for his kind support this publication.
Reference
Adane, K., Measho, G., & Mezgebu, Y. (2014). Willingness to pay for community based
health insurance among households in the rural community of Fogera District, North West
Business and Economic Research
ISSN 2162-4860
2017, Vol. 7, No. 2
http://ber.macrothink.org 229
Ethiopia; International Journal of Economics, Finance and Management Sciences, 2(4),
263-269.
Ahuja, R. (2004). Health insurance for the poor in India. Working paper no. 123. Retrieved
from http://faculty.chicagobooth.edu/john.cochrane/research/papers/after_aca.pdf
Anagaw, M., Robert, S., Zelalem,Y., Getnet, A., & Arjun, S. B. (2015). Dropping out of
Ethiopia‟s Community Based Health Insurance scheme. Health Policy and Planning, 30,
1296-1306. https://doi.org/10.1093/heapol/czu142
Ataguba, J. T. (2008). Community Health Insurance Scheme as a viable option for rural
population in Nigeria; Paper submitted to the Centre for the Study of African Economies
(CSAE) Department of Economics, University of Oxford: Retrieved from: