68
Housewares in the UK & Steamer Trading Cookshop Ben Phillips IBC Global Forum Mexico City, June 2015
Housewares in the UK & Steamer Trading Cookshop
Ben Phillips
IBC Global Forum
Mexico City, June 2015
Who Am I?
• Steamer Trading is the UK’s leading speciality kitchenware retailer
• We sell kitchenware, cookware, tableware, small electricals and utility: anything for the kitchen
• Currently 34 stores and sales of over $30m • Broad spread across the UK, from the South to
Scotland • GIA Winner 2010 • Celebrating 30 years in 2015 • Founded by my parents, we’ve grown from 1 ½ stores
in 2000 and plan for 50 by 2017

Agenda
• The UK market: facts and figures
• Structure of the retail market for housewares
• Steamer Trading – what we’re about and our place in the market
• Supplying the UK market – distribution or direct?
• Working with Steamer Trading
• Questions

The UK Market
• The #3 market for US housewares exporters
• We’re “friendly, receptive, English-speaking and appreciate US innovation and branding”
• With 64 million people in an area the size of Michigan distribution is “relatively easy to plan”
• We “have ample spending power” with GDP per capita of $46k vs. US ($55k), Canada ($50k)
• 20 retailers account for over 60% of sales in the UK
• We have “sophisticated”, “price sensitive” consumers With acknowledgements to Laura Spingola and the IHA Blog!

The UK Consumer and Cooking
In the last year: 88% Prepared a family meal 60% Watched TV cookery shows 57% Looked up recipes online 31% Cooked for a dinner party 27% Bought a cook book 5% Took a cooking lesson

The UK Consumer and Eating
84% Eat breakfast at home 58% Have lunch at home 92% Take dinner at home 43% Eat at the dining table 18% Have dinner in the kitchen 50% Eat dinner on the sofa
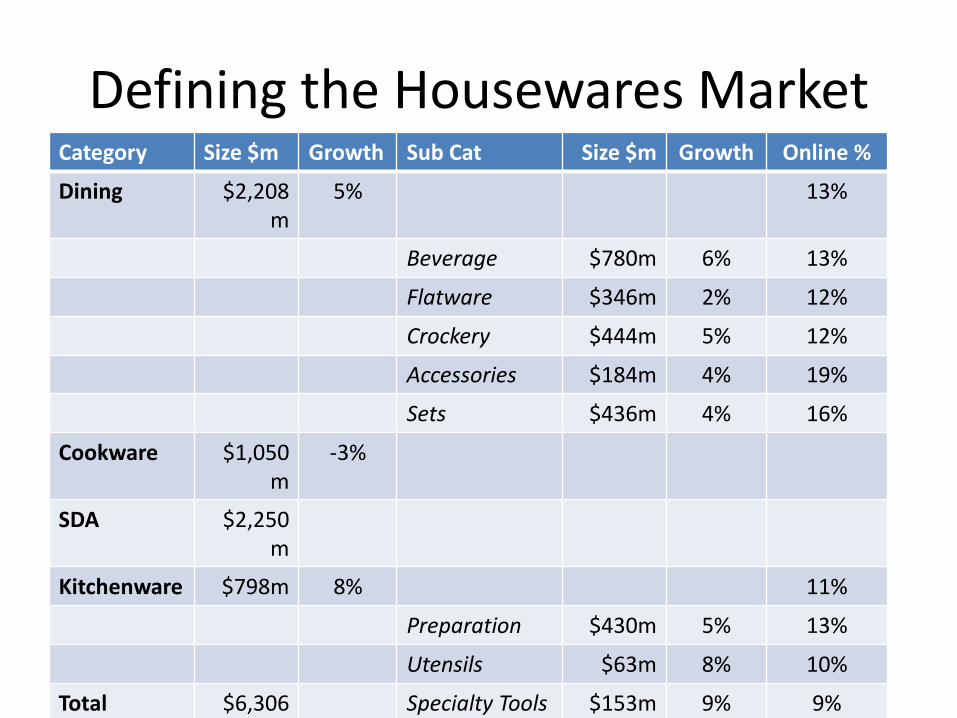
Defining the Housewares Market Category Size $m Growth Sub Cat Size $m Growth Online %
Dining $2,208m
5% 13%
Beverage $780m 6% 13%
Flatware $346m 2% 12%
Crockery $444m 5% 12%
Accessories $184m 4% 19%
Sets $436m 4% 16%
Cookware $1,050m
-3%
SDA $2,250m
Kitchenware $798m 8% 11%
Preparation $430m 5% 13%
Utensils $63m 8% 10%
Total $6,306m
Specialty Tools $153m 9% 9%
Figures 2015 est Source: Conlumino, other Boards $150m 10% 7%
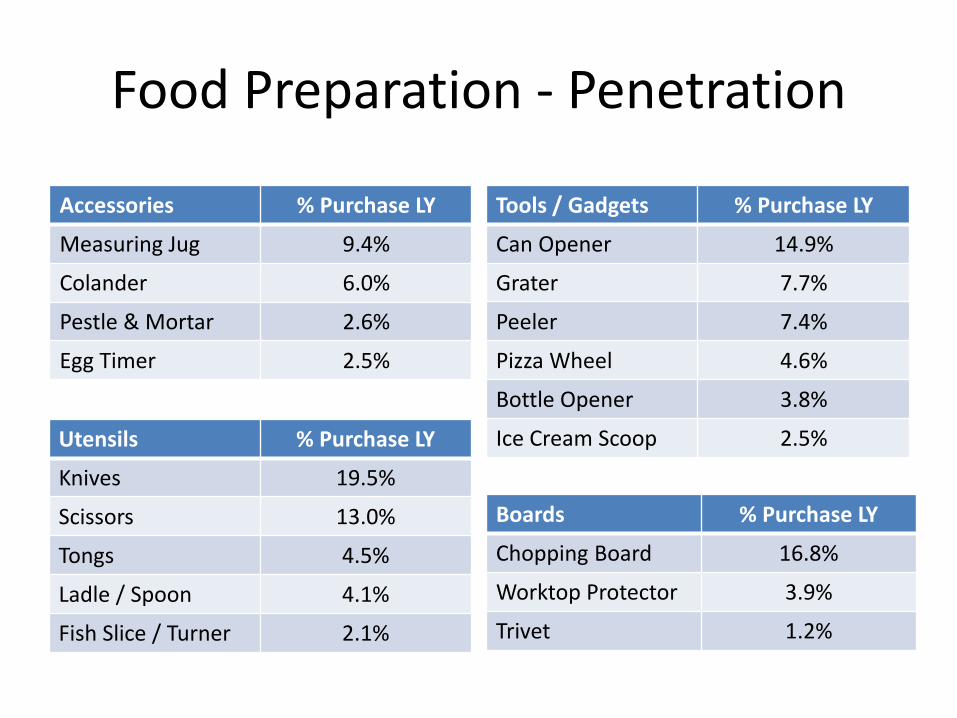
Food Preparation - Penetration
Accessories % Purchase LY
Measuring Jug 9.4%
Colander 6.0%
Pestle & Mortar 2.6%
Egg Timer 2.5%
Tools / Gadgets % Purchase LY
Can Opener 14.9%
Grater 7.7%
Peeler 7.4%
Pizza Wheel 4.6%
Bottle Opener 3.8%
Ice Cream Scoop 2.5% Utensils % Purchase LY
Knives 19.5%
Scissors 13.0%
Tongs 4.5%
Ladle / Spoon 4.1%
Fish Slice / Turner 2.1%
Boards % Purchase LY
Chopping Board 16.8%
Worktop Protector 3.9%
Trivet 1.2%

Tableware - Penetration
Accessories % Purchase LY
Salt/Pepper Pot 7.1%
Cheese Board 4.0%
Cake Stand 3.6%
Butter Dish 3.4%
Beverage % Purchase LY
Glasses 28.3%
Mugs 27.5%
Cups & Saucers 6.9%
Teapot 6.4%
Cafetiere 4.2%
Milk Jug 3.6% Crockery % Purchase LY
Bowls 14.2%
Dinner Plate 14.0%
Side Plate 9.3%
Egg Cups 4.2%
Serving Bowl 3.4%
Flatware % Purchase LY
Knives 12.8%
Teaspoons 11.8%
Spoons 9.8%

Why do Consumers Buy Kitchenware?
New Purchase
21.7% First time that the consumer has
purchased this product
Replacement
71.8% Replacing old (47%), broken (40%) or
disliked items (10%)
Upgrade /Complete
24.4% Purchase made for better
functionality (14%), a new look (12%) or to complete a set (4%)
Impulse
18.7% Reasons include a special offer (11%)
and pure impulse (6%)

Why Do Consumers Buy Tableware?
New Purchase
16.4% First time that the consumer has
purchased this product
Replacement
63.7% Replacing old (34%), broken (36%) or
disliked items (13%)
Upgrade /Complete
49.3% Purchase made to add to existing
items (33%), a new look (22%) or to complete a set (9%)
Impulse
33.5% Reasons include a special offer (17%)
and pure impulse (17%)
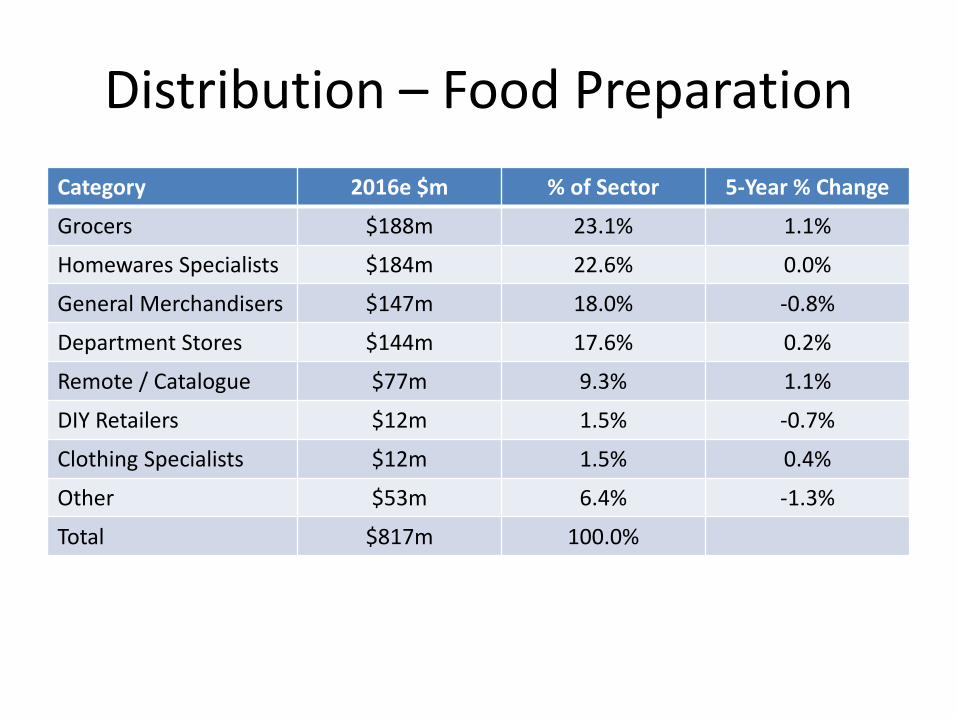
Distribution – Food Preparation
Category 2016e $m % of Sector 5-Year % Change
Grocers $188m 23.1% 1.1%
Homewares Specialists $184m 22.6% 0.0%
General Merchandisers $147m 18.0% -0.8%
Department Stores $144m 17.6% 0.2%
Remote / Catalogue $77m 9.3% 1.1%
DIY Retailers $12m 1.5% -0.7%
Clothing Specialists $12m 1.5% 0.4%
Other $53m 6.4% -1.3%
Total $817m 100.0%

Retailer Shares – Food Preparation
Retailer Market Share Type / Third Party Offer?
Tesco 9.4% Supermarket, limited
Wilkinsons 6.1% General, value, limited
Asda 5.9% Walmart, limited
John Lewis 5.8% Department store, c.50%
IKEA 5.1% Homewares, none
Lakeland 4.1% Specialist, c.50%
Argos 3.5% Generalist, value, some
Sainsburys 3.1% Supermarket, some
Debenhams 2.3% Department store, c.50%
Dunelm 2.0% Homewares, value, some
Marks & Spencer 0.8% Clothing, general, none
Total Top 11 48.1%

Distribution – Tableware
Category 2016e $m % of Sector 5-Year % Change
Department Stores $619m 27.5% 0.2%
Homewares Specialists $459m 20.4% -0.2%
Grocers $432m 19.2% 1.0%
General Merchandisers $372m 16.5% -0.9%
Remote / Catalogue $149m 6.6% 0.6%
Clothing Specialists $117m 5.2% 1.0%
DIY Retailers $63m 2.8% -0.2%
Other $41m 1.8% -1.5%
Total $2,252m 100.0%

Retailer Shares – Tableware
Retailer Market Share Type / Third Party Offer?
John Lewis 8.9% Department store, c.50%
Argos 6.8% Generalist, value, some
Tesco 6.1% Supermarket, none
Asda 5.9% Walmart, none
Debenhams 5.6% Department store, >50%
IKEA 5.2% Homewares, none
Wilkinsons 4.1% Generalist, value, limited
Marks & Spencer 3.9% Clothing, general, none
Total Top 8 46.5%

Why do Consumers Buy?
0 10 20 30 40 50 60 70
Low Prices
Convenient
Good Quality
In Stock
Wide Choice
Bargains
Get Product Immediately
Good Brand Selection
Pleasant Environment
Had Loyalty Card
Force of Habit
Innovative Products
Easily View Products
Good Customer Service
Offers Home Delivery
Good Guaranteed
Price Matching Scheme
Recommended by Friend
Ethical Credentials

Variations Between Retailers

Branded Housewares Market

The Steamer Trading Heritage

2001-2011: 10 Years of Growth
• 25 stores opened in 10 years (now 34)
• Mixed freehold/leasehold portfolio has provided exceptional stability
• 250,000 customer database (now 700,000)
• No closed or failing stores
• Industry reputation for staff knowledge, enthusiasm and friendliness
• Retained the feeling of ‘our’ local shop

Steamer Trading Sales

Steamer Trading Profits

Housewares Industry Awards • Specialist Multiple Retailer of the Year 2013, 2014 • Excellence in Training 2012 • Excellence in Display 2012 • Specialist Multiple Retailer of the Year 2010, 2011 • Global Innovator Award 2010 • Oracle / Retail Week Emerging Retailer of the Year 2009 • Excellence in Retail Display 2009 • Small Multiple Retailer of the Year 2007, 2008 • Multiple Retailer of the Year 2005, 2006 • Independent Retailer of the Year 2004 • Excellence in Retail Display 2003 • Global Innovator Award (UK Winner)2003 • Independent Retailer of the Year 2000

Growth Plan (2012)
• 5-Year objective to more than double Sales to $60m within 5 years
• Store numbers grown from 26 (2011) to 48 by 2017: over 35 by end 2015
• Same-store growth targeted against an assumed flat market
• Internet forecast as ‘largest store’ by 2016/7, doubling year-on-year
• Remain focussed on the UK market

What is the Steamer Trading Brand?
• We’re not a large, corporate retailer
• We’re family run, we’re enthusiastic and we care about our customers
• We’re about the kitchen – the heart of the home
• We’re a specialist retailer – we know our onions (and how to peel, slice, dice, cube and fry them)
• We’re about having fun in the kitchen, too
• …and never, ever, take ourselves too seriously

Strategy
• Develop position as a specialist, offering the very best for the kitchen
• Focus on developing key brands
• Enhance consumer awareness of the value of investing in the right equipment
• Set the highest standards in customer service
• Exceptional level of staff knowledge and engagement
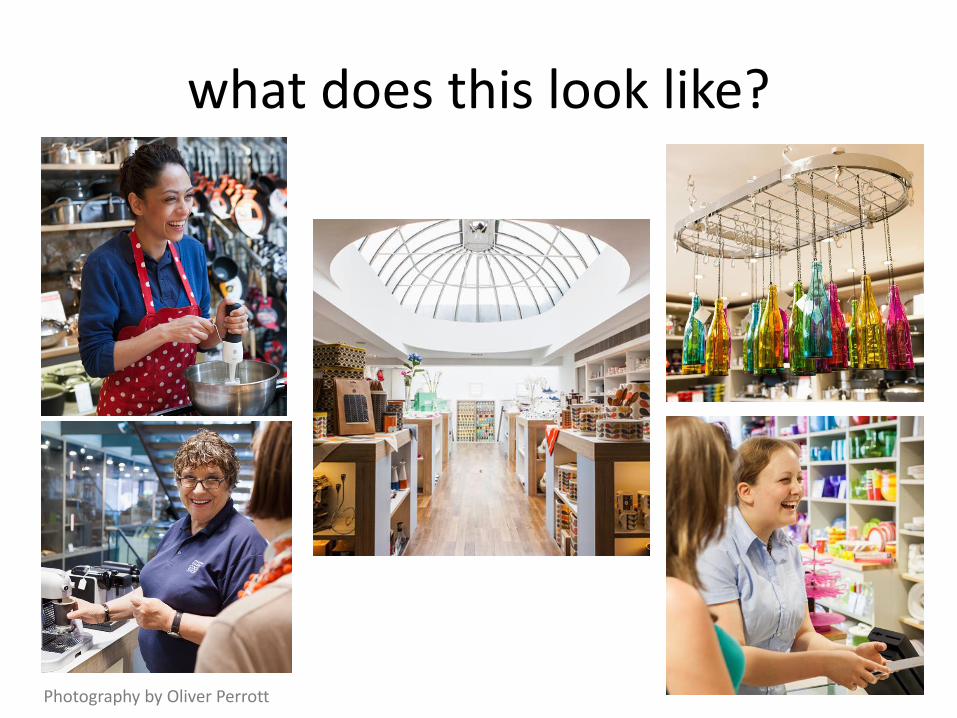
what does this look like?
Photography by Oliver Perrott

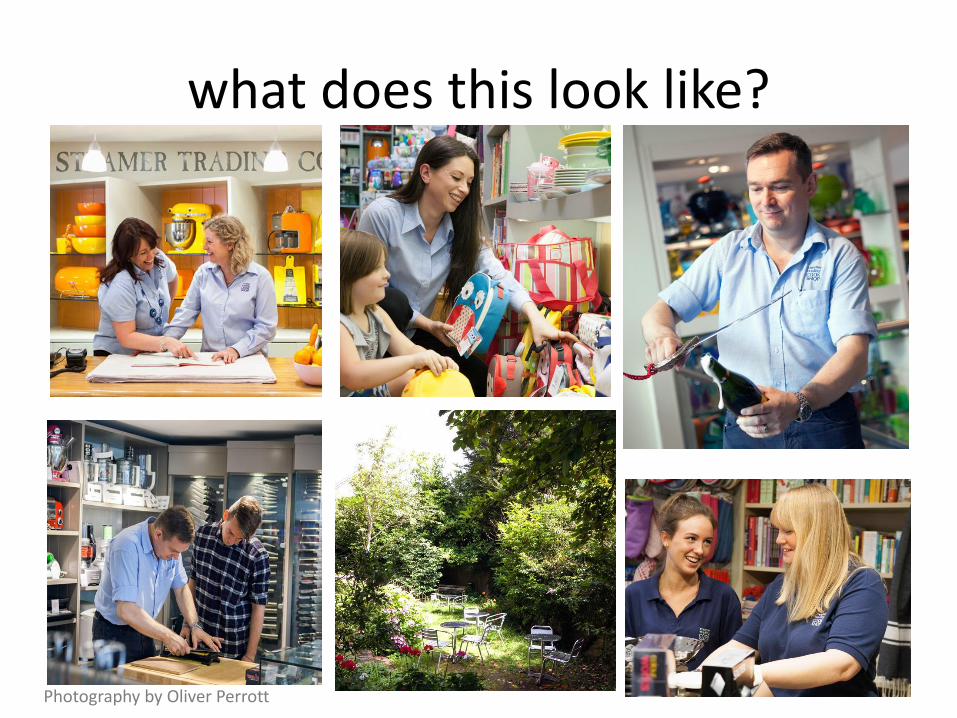
what does this look like?
Photography by Oliver Perrott
what does this look like?
Photography by Oliver Perrott

Store Strategy
• Beautiful buildings in prime locations
• Market towns in good areas
• Never become a ‘chain’
• Offer a truly comprehensive range
• Excite and delight with new ideas, colour, quirkiness – and fun
• Invest in making shops look as good as they can – don’t focus on the short term
• Brands are key in a polarising market
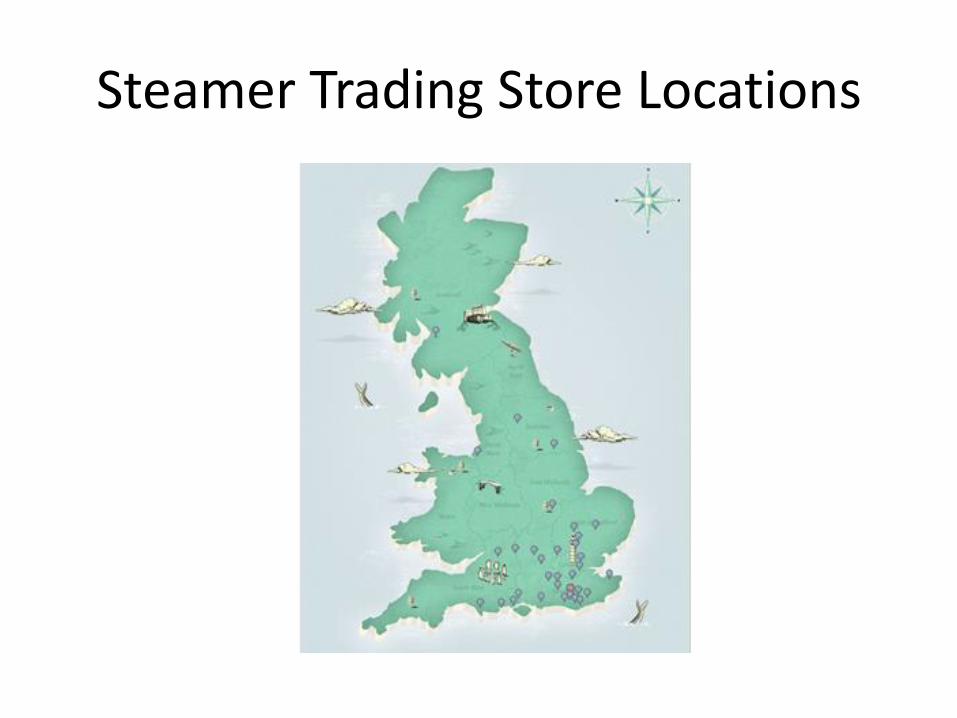
Steamer Trading Store Locations
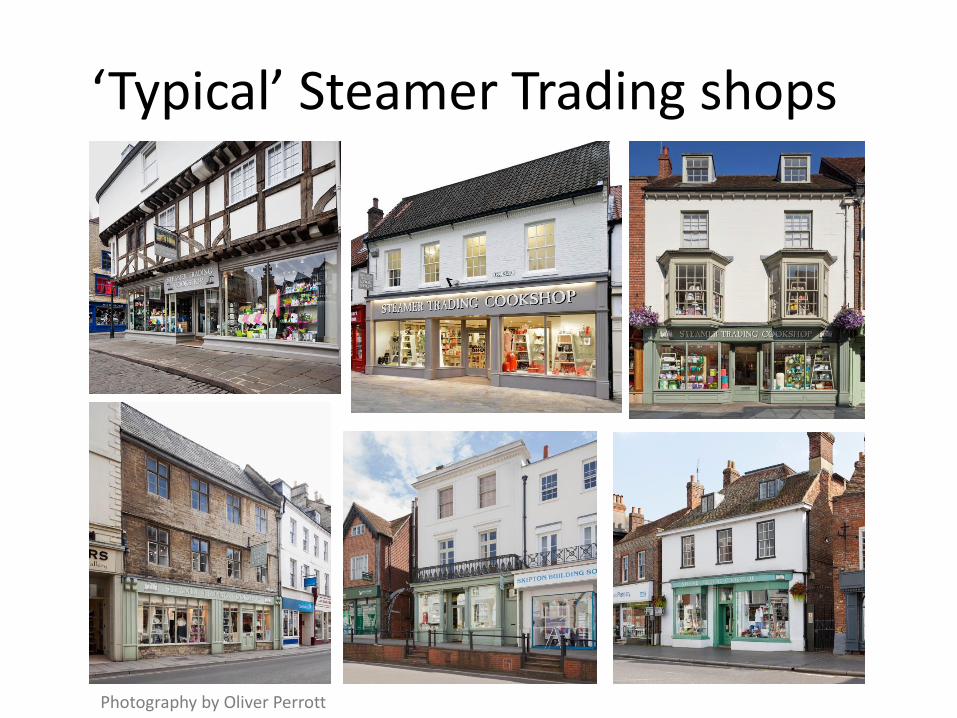
‘Typical’ Steamer Trading shops
Photography by Oliver Perrott

‘Typical’ Steamer Trading shops
Photography by Oliver Perrott

Guildford store
Photography by Oliver Perrott

Guildford interior
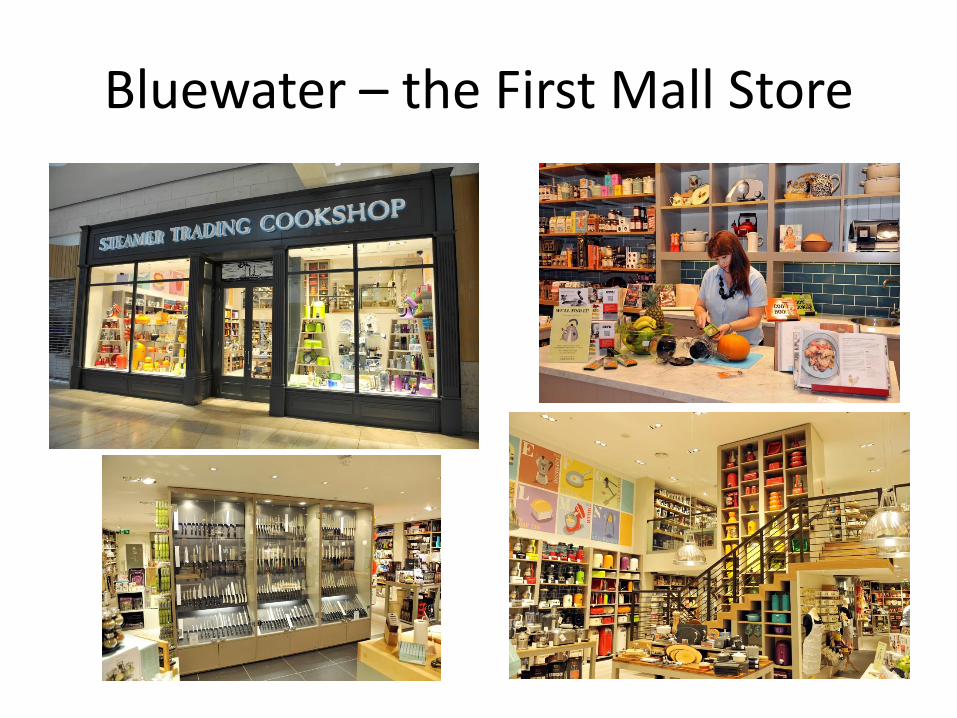
Bluewater – the First Mall Store
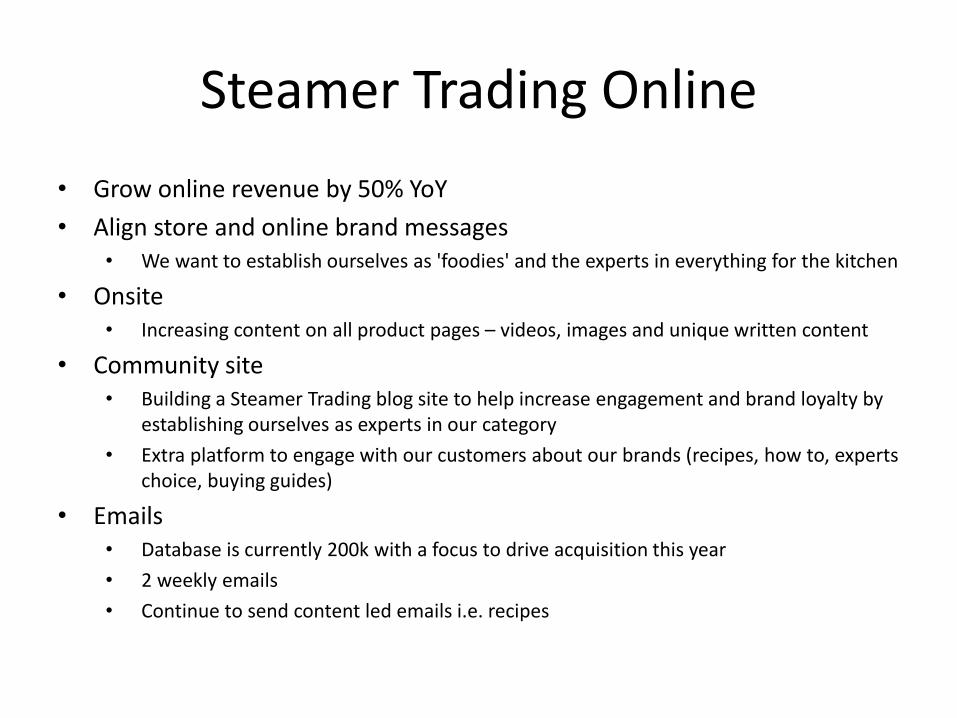
Steamer Trading Online
• Grow online revenue by 50% YoY
• Align store and online brand messages • We want to establish ourselves as 'foodies' and the experts in everything for the kitchen
• Onsite • Increasing content on all product pages – videos, images and unique written content
• Community site • Building a Steamer Trading blog site to help increase engagement and brand loyalty by
establishing ourselves as experts in our category
• Extra platform to engage with our customers about our brands (recipes, how to, experts choice, buying guides)
• Emails • Database is currently 200k with a focus to drive acquisition this year
• 2 weekly emails
• Continue to send content led emails i.e. recipes

www.steamer.co.uk

Brand Stories, Recipes
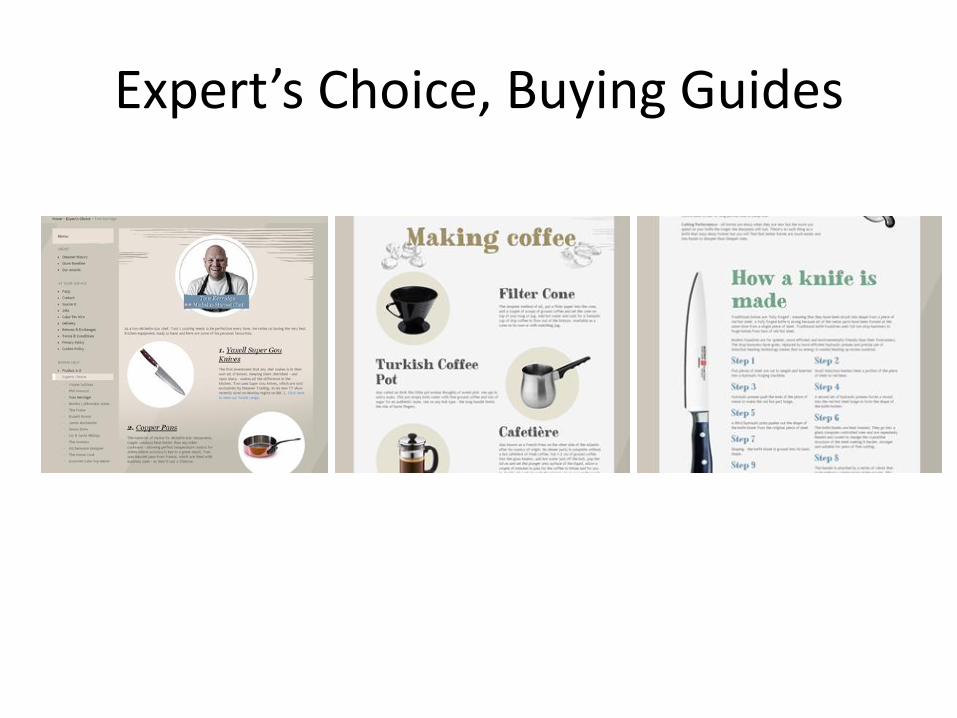
Expert’s Choice, Buying Guides

Engaging Emails
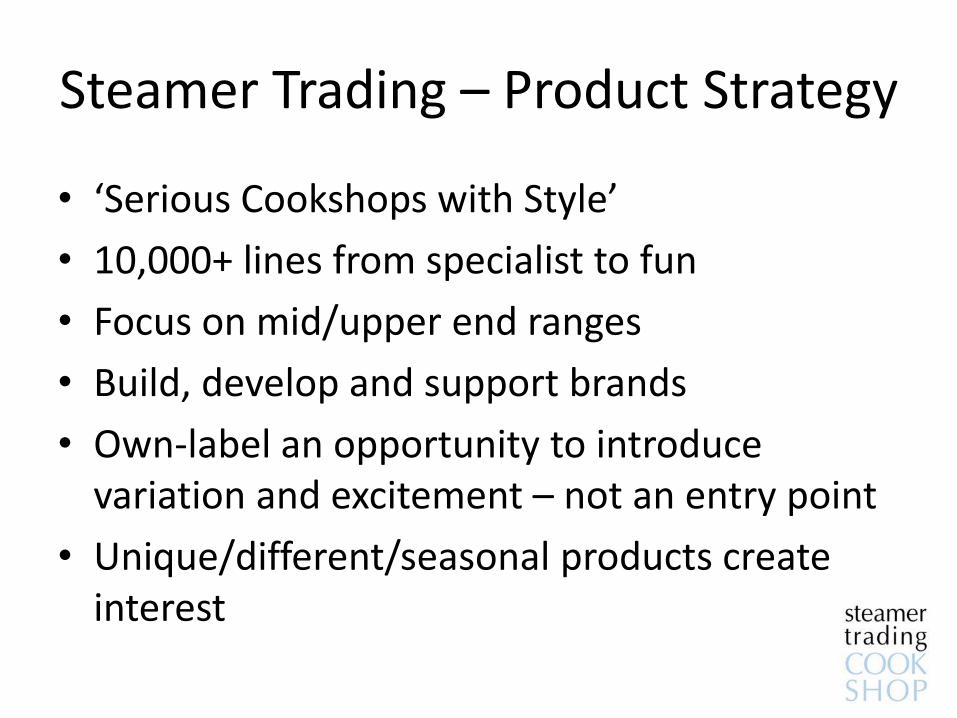
Steamer Trading – Product Strategy
• ‘Serious Cookshops with Style’
• 10,000+ lines from specialist to fun
• Focus on mid/upper end ranges
• Build, develop and support brands
• Own-label an opportunity to introduce variation and excitement – not an entry point
• Unique/different/seasonal products create interest

‘They sell things here
that I never knew
I didn’t have’

Steamer Trading Buying Team
Ben Phillips
Managing Director
Susan Millin
Interim B&M Director
Priti Merchant
Buying Manager
New Hire
Joanna Canham
Buying Admin
Melly Cooper
Buying Admin
Amy Wells
Buying Admin (Maternity Leave)
Neil Windsor
Merchandiser
New Hire
New Hire
Jennifer McCalvey
Project Merchandiser
Jess Taylor
Interim Retail Director
Nick O’Mahony
Head of Product Training
Lauren Nichol
Online and Marketing
Alastair Kerr
George Treves
Non-Executives

Sourcing Strategy
• Who we buy from: UK manufacturers/brand owners: 44% (25%)
UK subsidiaries/international brands: 25% (30%)
Multibrand distributors: 24% (40%)
Direct imports: 7% (5%)
• 200 active suppliers (from 300 ‘recent’) • Trade shows: Birmingham, Frankfurt, Chicago,
Paris, smaller UK events • Long-term, partner relationships with key
suppliers • All of our top 10 suppliers were represented
when we opened 30 years ago

Example Best Sellers

Example Key Suppliers
• Kitchencraft (Lifetime Brands) • Beam (KitchenAid distributor) • Le Creuset • Global • Dexam (Chef’n distributor) • PHA (Cuisipro distributor) • Eddingtons (multibrand distributor) • JosephJoseph • OXO Good Grips • Yaxell (Japanese specialty cutlery)
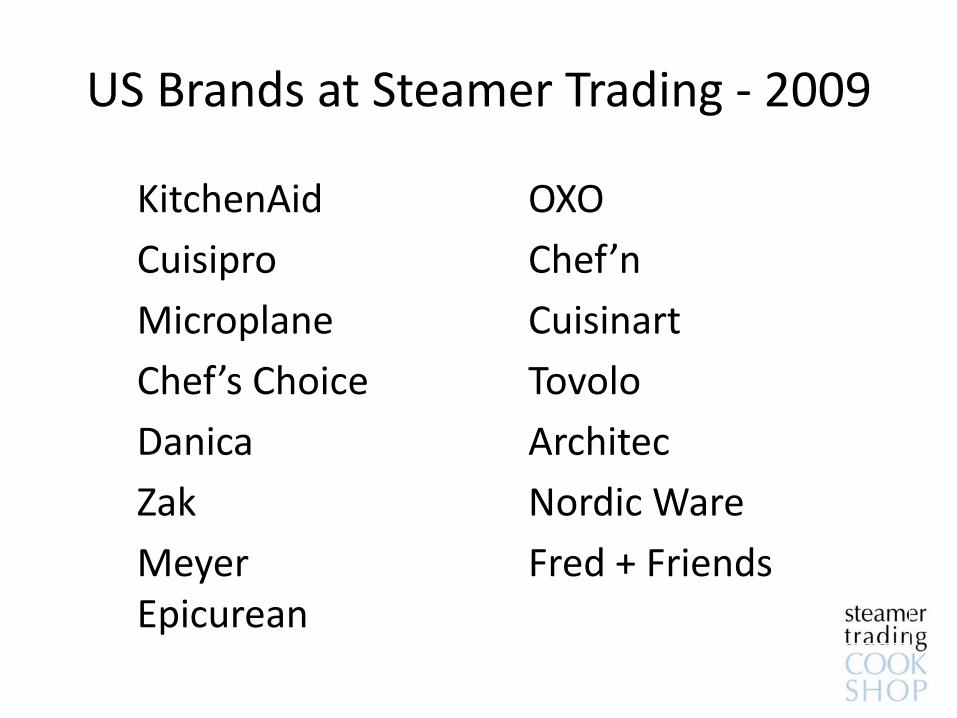
US Brands at Steamer Trading - 2009
KitchenAid OXO
Cuisipro Chef’n
Microplane Cuisinart
Chef’s Choice Tovolo
Danica Architec
Zak Nordic Ware
Meyer Epicurean
Fred + Friends

US Brands at Steamer Trading – 2015/6
Dash
True
Prepara
Vitamix
Blendtec
Pack-It
Olde Thompson
Aladdin
Stanley
Corkicle
KitchenAid
Cuisipro
Microplane
Chef’s Choice
Danica / NOW Designs
Zak
OXO
Chef’n
Cuisinart
Tovolo
Architec
Nordic Ware
Fred + Friends
Camelback
Mighty Mug
Full Circle
Zing Anything
MSC/Joie
Zoku
Bobble
That!
Anchor Hocking
Vinturi

Dealing with the UK Market
• Dominated by subsidiaries / distributors – virtually no UK-based manufacturing
• International brands have a great opportunity to enter and compete
• US principals seen as more supportive than Europeans – willing to take a long term view
• Importance of the independent sector – there is no ‘big box’ retailer to carry the success of a major product single-handedly

Key Market Differences
• Our ovens are smaller…
• …and so are our kitchens – before our customers buy, they have to think of where they’ll keep it
• We don’t do celebrations…
• …or have china for ‘best’
• We buy a lot more supermarket ready-meals
• We barbecue less and don’t have as much of an outdoor culture

Key Market Differences
• Induction is more important and essential future-proofing
• Our dishwashers are far more damaging to ‘dishwasher safe’ products
• We don’t eat together as a family as much • Seasonality – as determined by Crate & Barrel – is
a new discovery • Top end – introduced by Williams Sonoma to
every major town in the US – is a lonely place in the UK

What we look for from the US
• Product innovation and development – everyday products, better engineered
• Strong packaging and point of sale
• Brand communication
• ‘Unique’ products with limited UK presence
• Flexibility in sourcing
• Export pricing - £ for $ retail pricing rarely fools the internet-aware generation
• Awareness of export markets

Supplying the UK – A Distributor View
• ‘A good brand deserves a good distributor’
• Expect to carry c.50-60% of the range
• Give the brand its own ‘voice’
• Often uneconomic to ship from US – aim for factory volumes
• Take a view on timing – 1 year is too short
• A good export manager is key to the relationship

The Distributor’s Target Market
Retailer/Sector Possible % of Kitchenware Distribution
Independent Sector 25-30%
- Steamer Trading 3%+
- Fenwick (group) 2%+
John Lewis 15%
Lakeland 10%
Department Stores (other) 10%
Internet Retailers 10%
Other inc. Grocery 25%
A standard margin for independents will be 2.4x (including 20% taxes); larger retailers will expect 3x+; and department stores may demand 4x including support / rebates

Working with Steamer Trading
• Steamer Trading is the only growing retailer of scale in the UK that has a strategy of building brands
• Focus on strong, design and innovation-led products that offer a point of difference
• Tight focus on ‘the kitchen’ and the more aspirational consumer
• A brand must protect its routes to market – internet pricing cannot be policed in the UK

What we Offer
• A strong, highly respected and financially secure retail partner
• The highest levels of staff training, POS support and in-store demonstration
• Knowledgeable and passionate customer communication
• A database of over 700,000 customers reached through our Christmas catalogue
• Loyalty and openness to our key suppliers

Steamer Trading Christmas Catalogue

Brand Building