25
1 1 WASHINGTON STATE HOUSING INSIGHTS Svenja Gudell, PhD, Zillow Chief Economist @SvenjaGudell
11
WASHINGTON STATE HOUSING INSIGHTS
Svenja Gudell, PhD, Zillow Chief Economist@SvenjaGudell
2
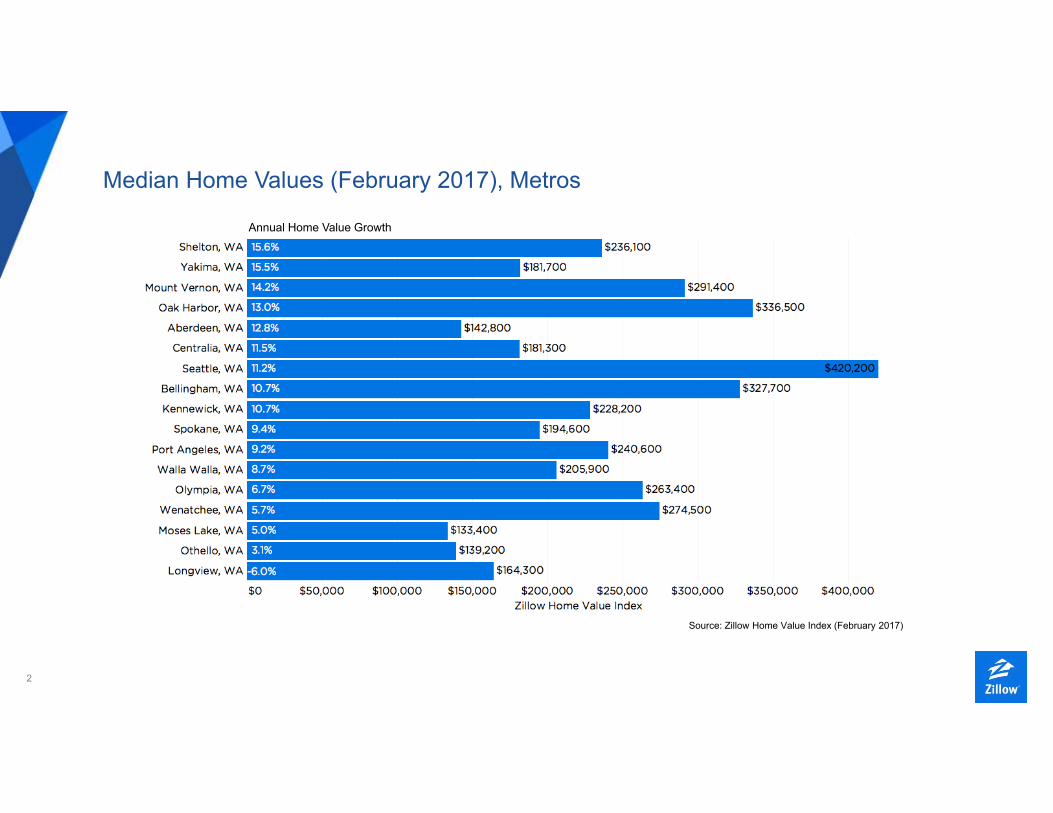
Median Home Values (February 2017), Metros
Source: Zillow Home Value Index (February 2017)
Annual Home Value Growth
-6.0%
3
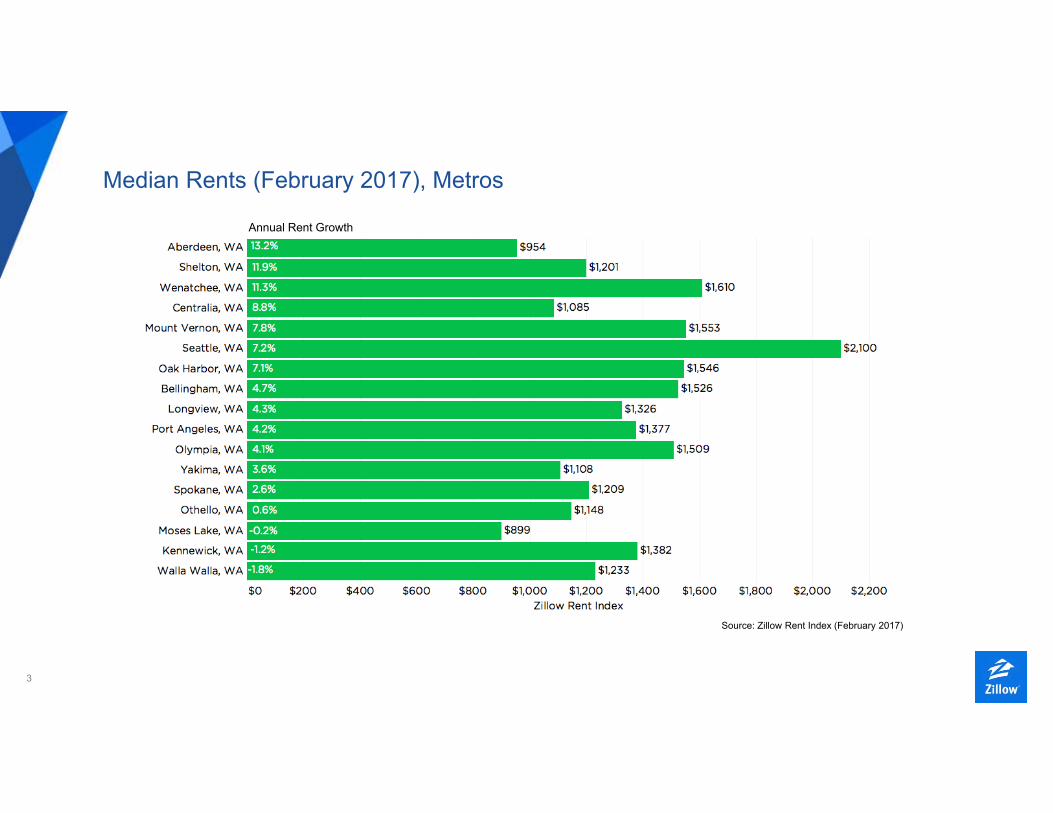
Median Rents (February 2017), Metros
Source: Zillow Rent Index (February 2017)
Annual Rent Growth
4
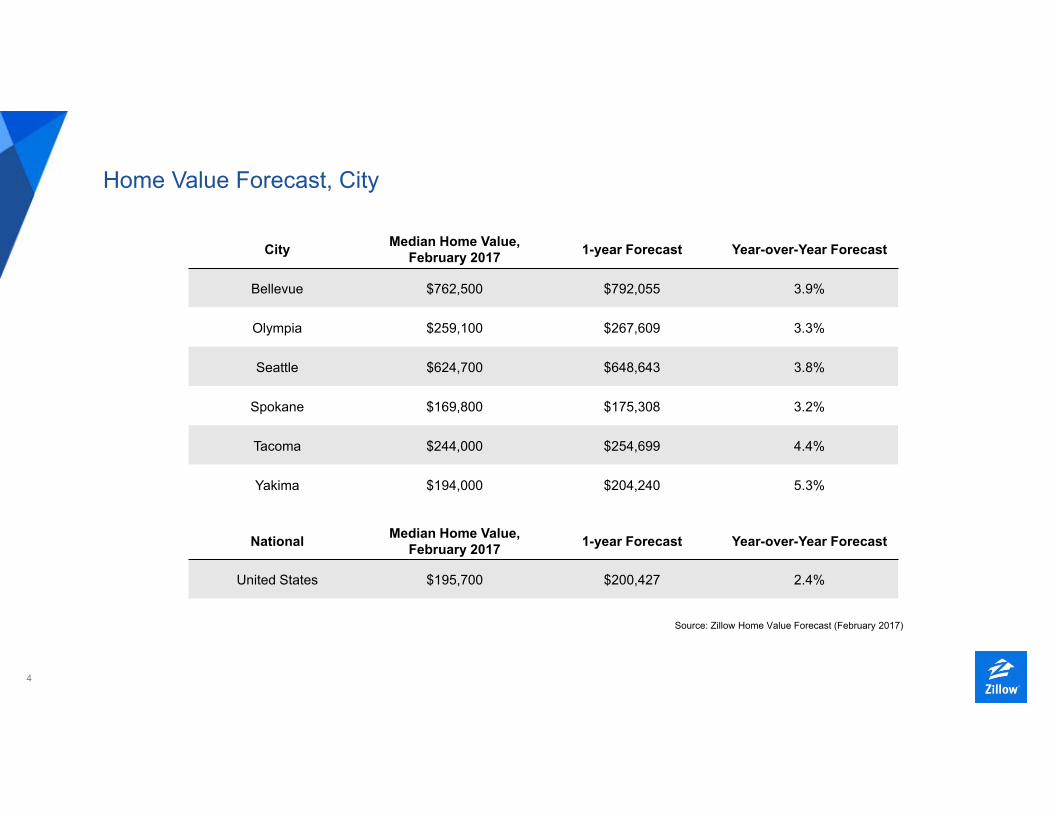
Home Value Forecast, City
City Median Home Value, February 2017 1-year Forecast Year-over-Year Forecast
Bellevue $762,500 $792,055 3.9%
Olympia $259,100 $267,609 3.3%
Seattle $624,700 $648,643 3.8%
Spokane $169,800 $175,308 3.2%
Tacoma $244,000 $254,699 4.4%
Yakima $194,000 $204,240 5.3%
Source: Zillow Home Value Forecast (February 2017)
National Median Home Value, February 2017 1-year Forecast Year-over-Year Forecast
United States $195,700 $200,427 2.4%
5
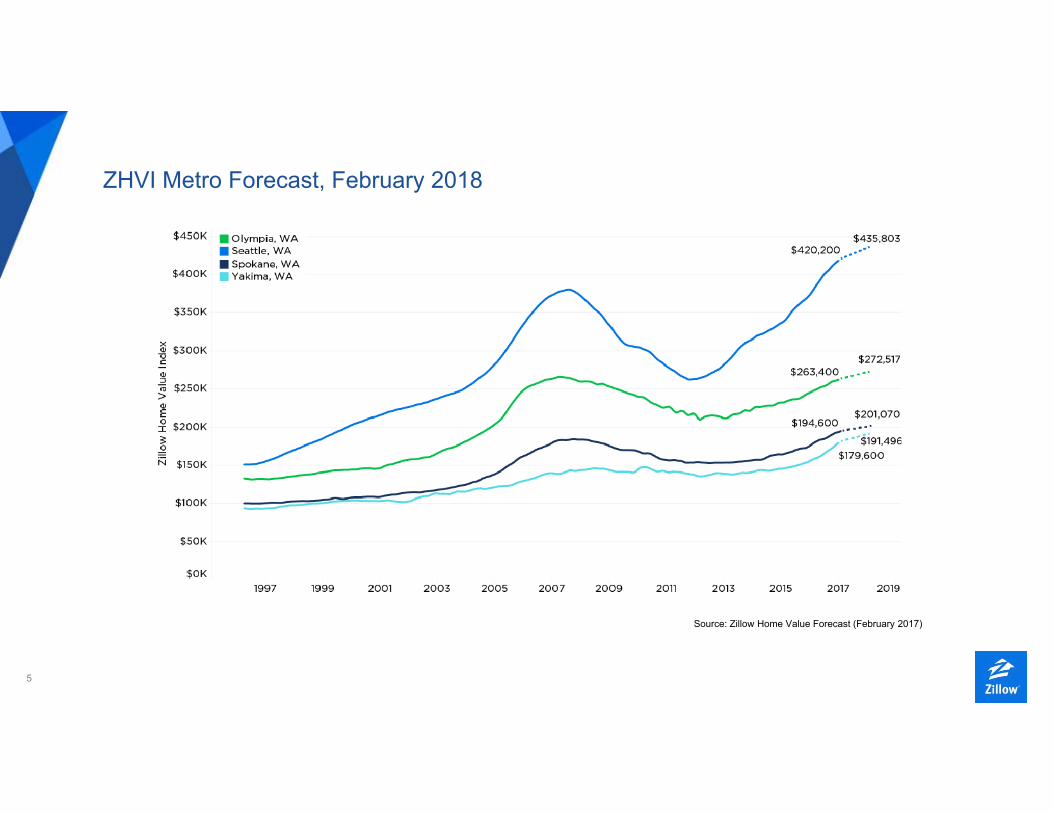
ZHVI Metro Forecast, February 2018
Source: Zillow Home Value Forecast (February 2017)
6
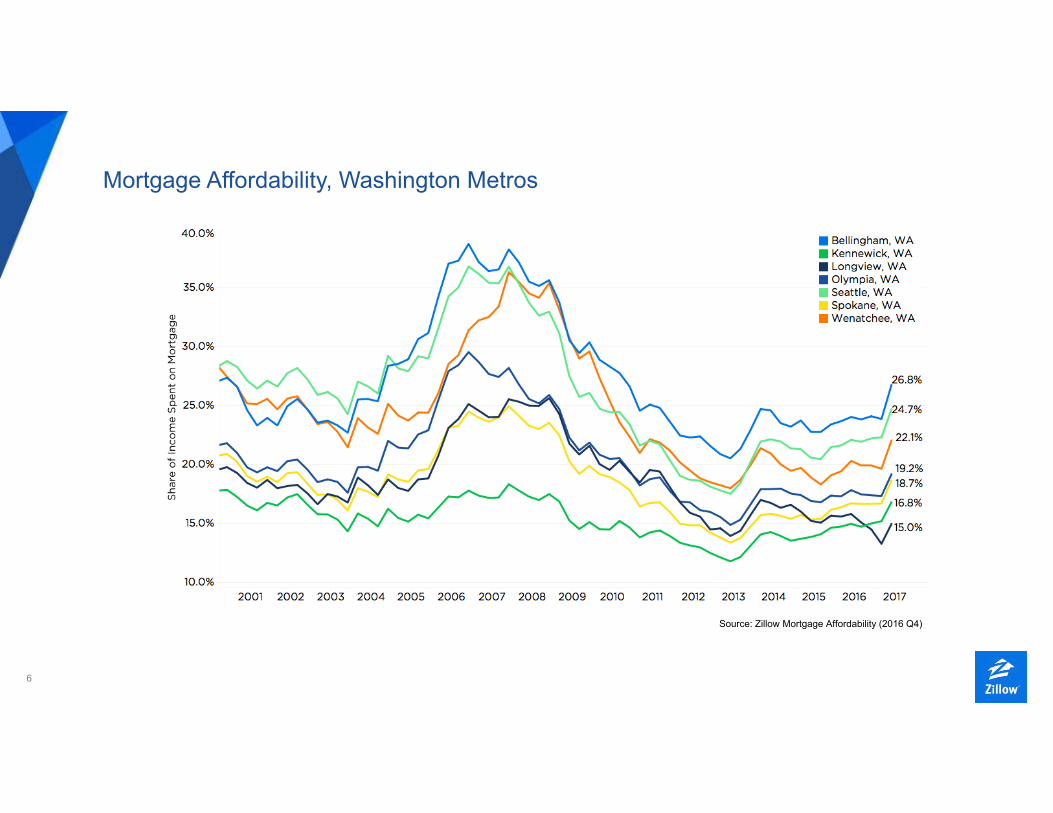
Mortgage Affordability, Washington Metros
Source: Zillow Mortgage Affordability (2016 Q4)
7
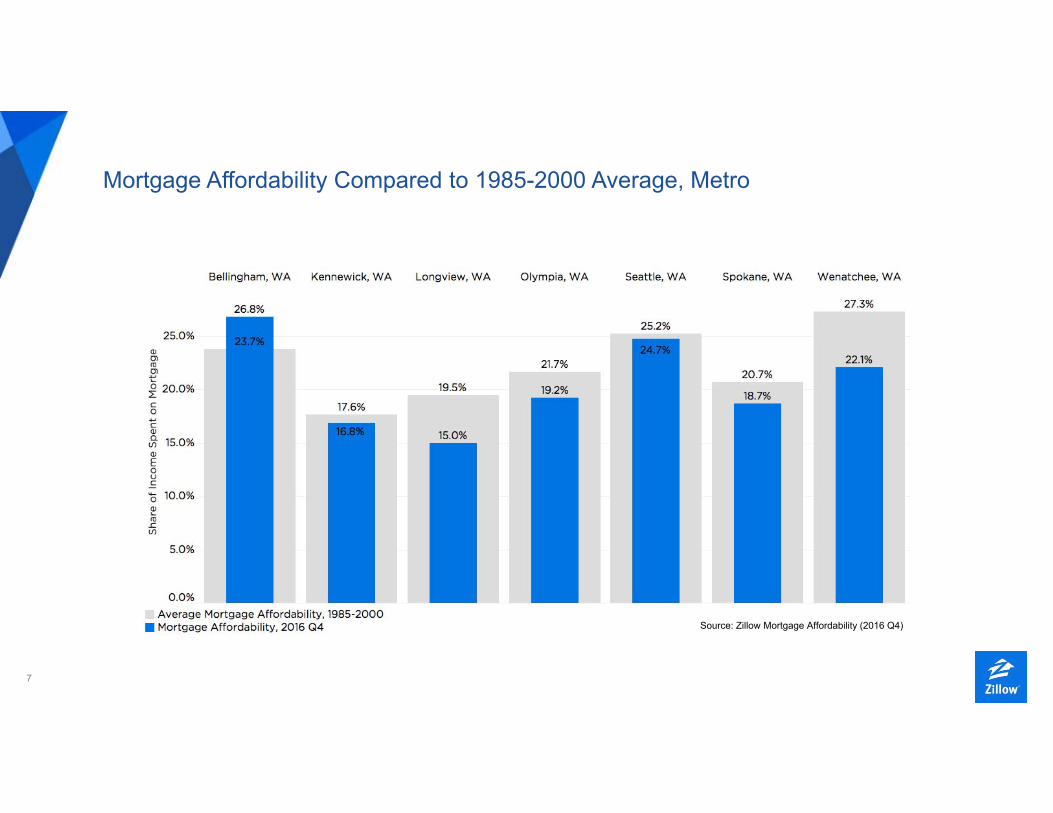
Mortgage Affordability Compared to 1985-2000 Average, Metro
Source: Zillow Mortgage Affordability (2016 Q4)
8
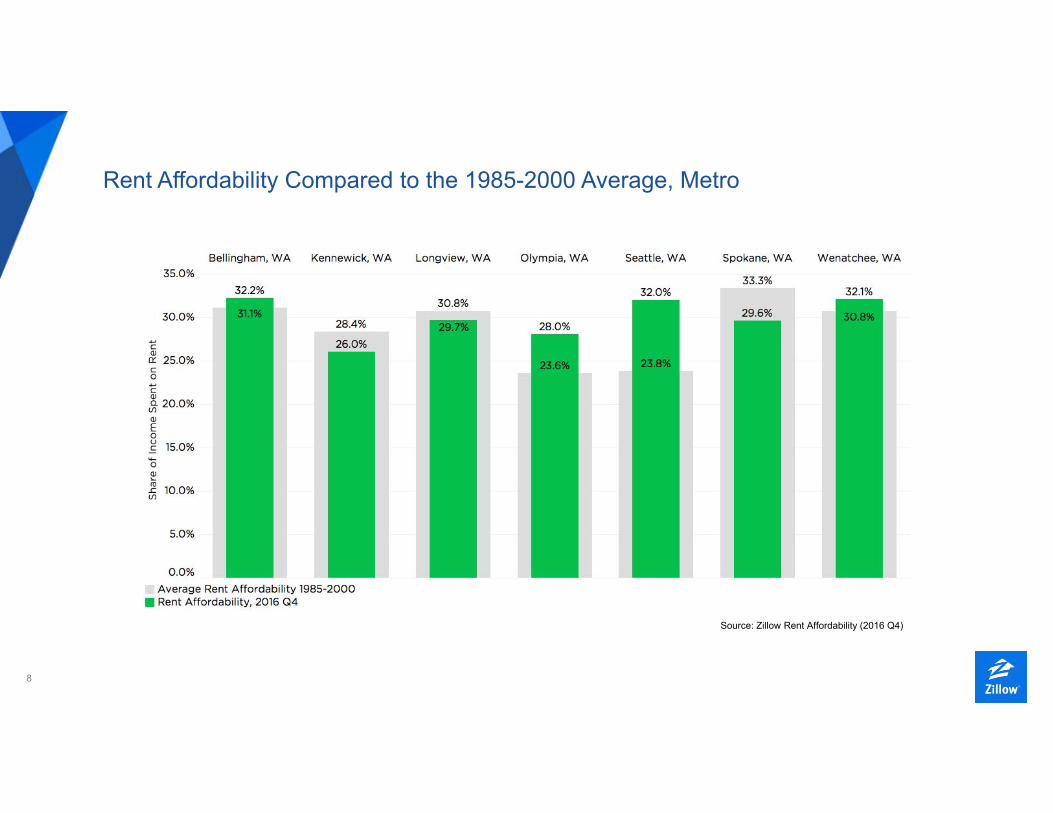
Rent Affordability Compared to the 1985-2000 Average, Metro
Source: Zillow Rent Affordability (2016 Q4)
9
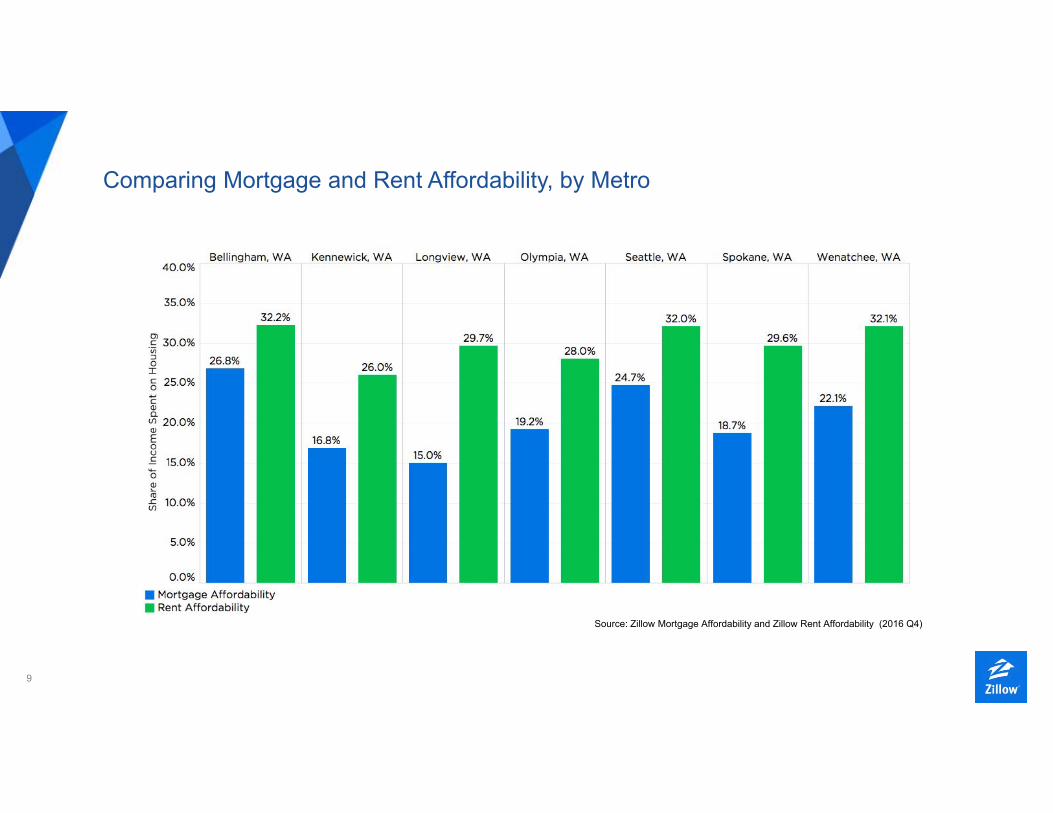
Comparing Mortgage and Rent Affordability, by Metro
Source: Zillow Mortgage Affordability and Zillow Rent Affordability (2016 Q4)
10
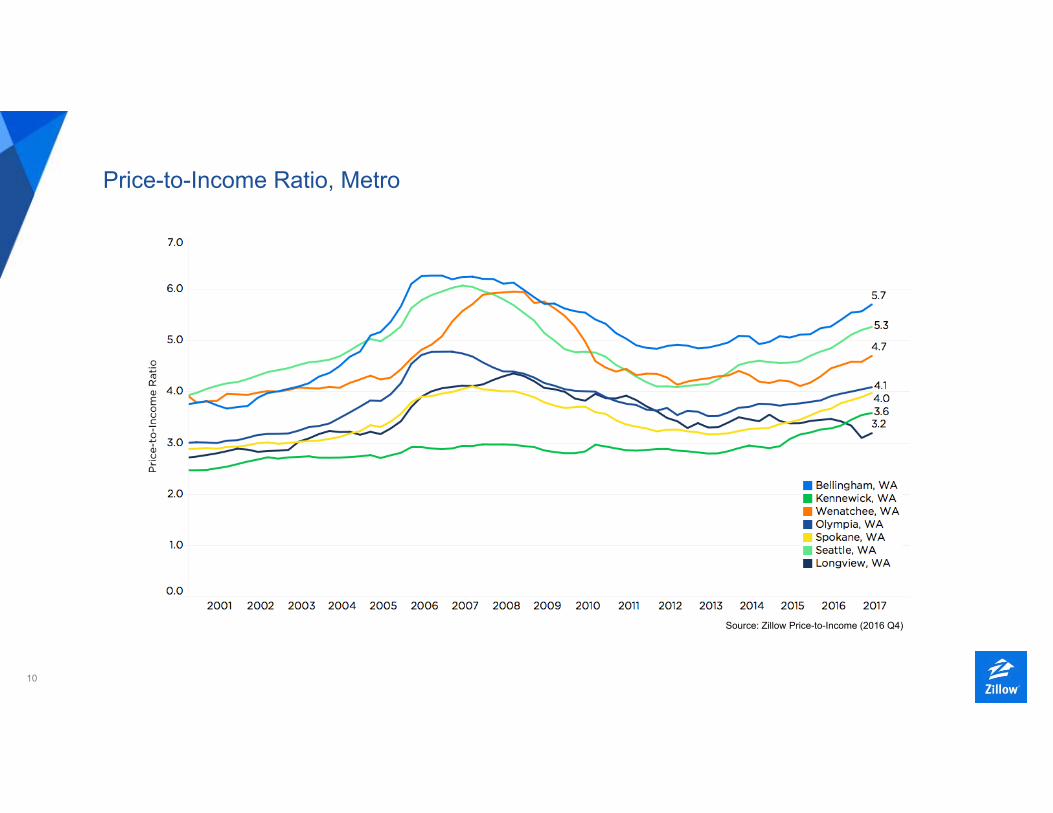
Price-to-Income Ratio, Metro
Source: Zillow Price-to-Income (2016 Q4)

11
For-Sale Inventory, City
Source: Zillow For-Sale Inventory (February 2017)
City Inventory, February 2017 1-Year % Change 5-Year % Change
Seattle 840 -12.7% -63.5%
Spokane 933 -17.7% -46.1%
Tacoma 417 -9.7% -61.7%
Vancouver 281 -1.4% -66.9%
Renton 192 -14.3% -67.1%
Bellevue 172 -27.1% -68.8%
Everett 151 0.7% -57.0%
Federal Way 156 0.6% -60.7%
Kennewick 237 -17.1% -61.8%
Yakima 318 -16.8% -15.9%
12
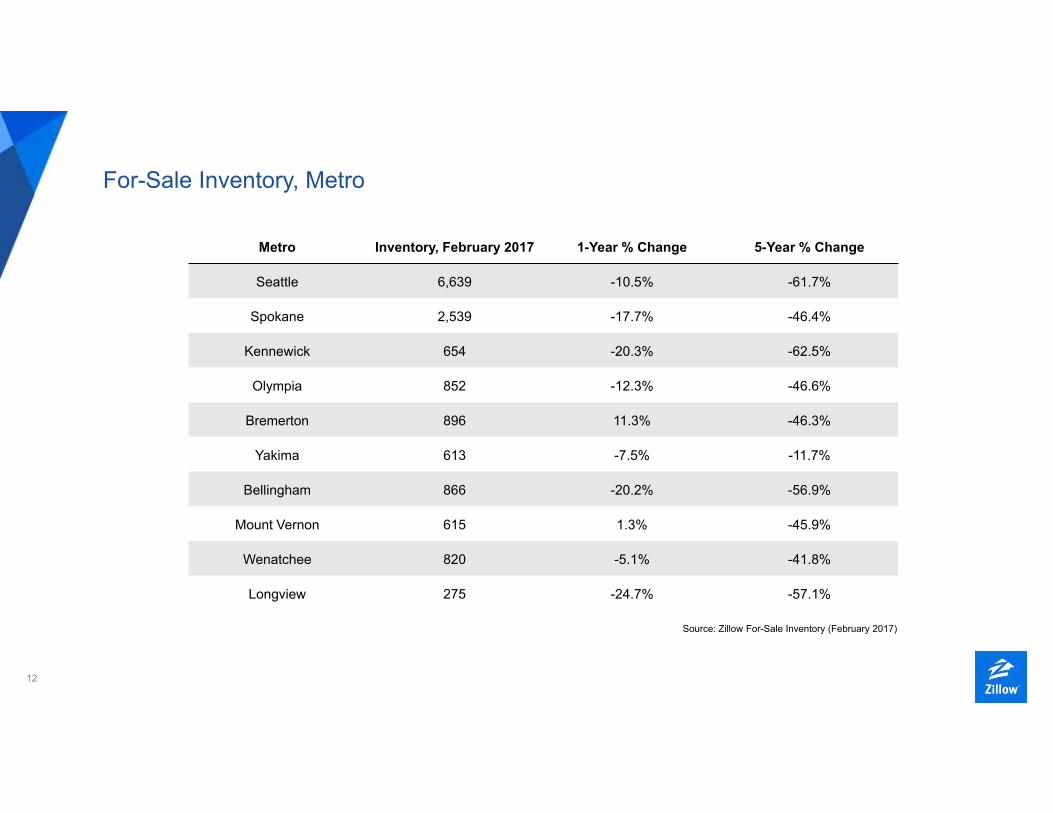
For-Sale Inventory, Metro
Source: Zillow For-Sale Inventory (February 2017)
Metro Inventory, February 2017 1-Year % Change 5-Year % Change
Seattle 6,639 -10.5% -61.7%
Spokane 2,539 -17.7% -46.4%
Kennewick 654 -20.3% -62.5%
Olympia 852 -12.3% -46.6%
Bremerton 896 11.3% -46.3%
Yakima 613 -7.5% -11.7%
Bellingham 866 -20.2% -56.9%
Mount Vernon 615 1.3% -45.9%
Wenatchee 820 -5.1% -41.8%
Longview 275 -24.7% -57.1%
13
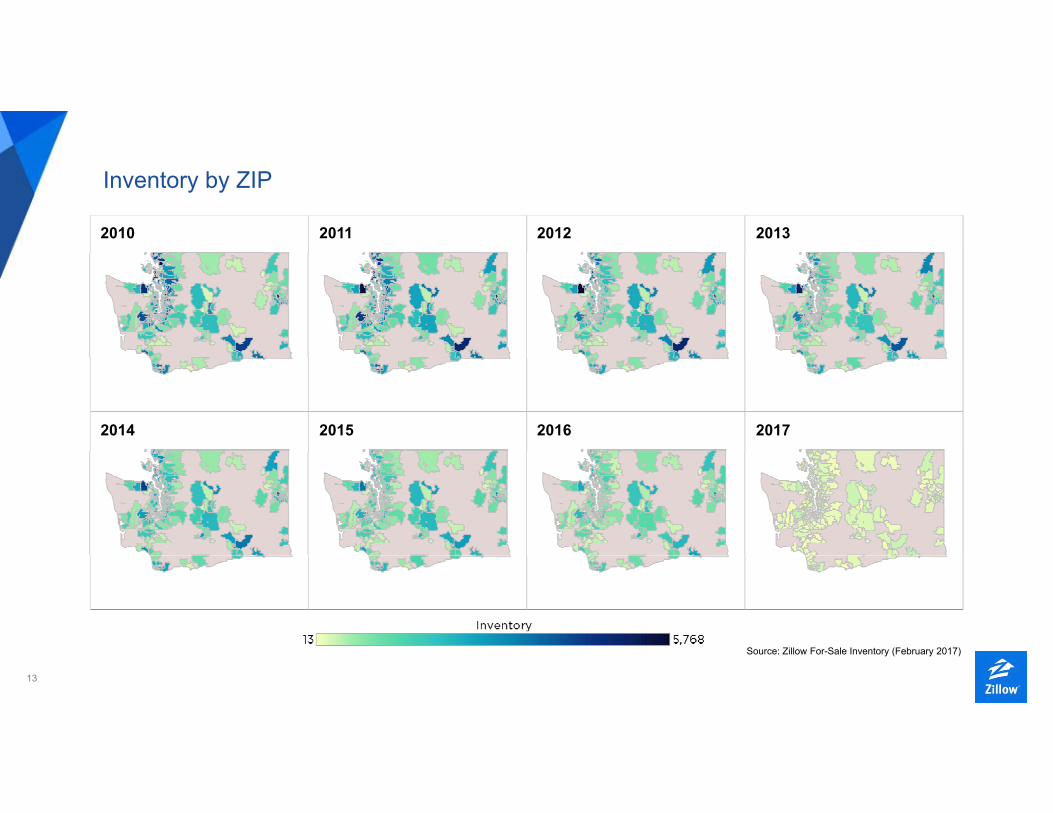
Inventory by ZIP
2010 2011 2012 2013
2014 2015 2016 2017
Source: Zillow For-Sale Inventory (February 2017)
14
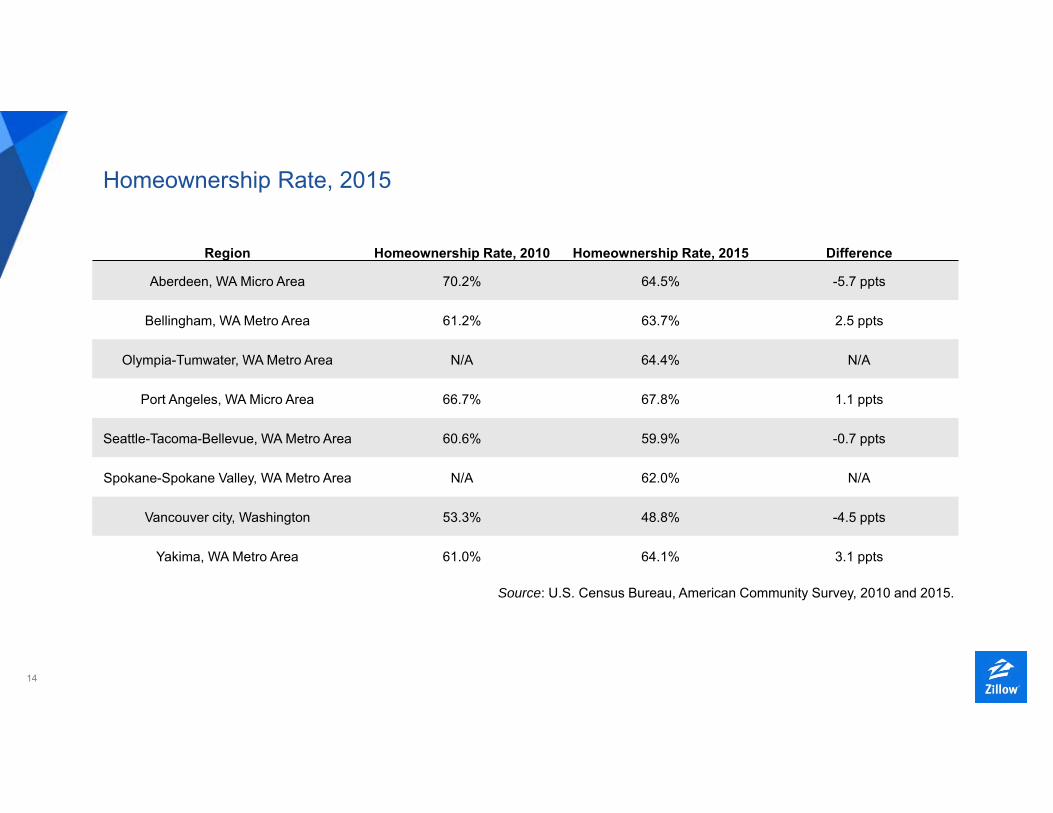
Homeownership Rate, 2015
Region Homeownership Rate, 2010 Homeownership Rate, 2015 Difference
Aberdeen, WA Micro Area 70.2% 64.5% -5.7 ppts
Bellingham, WA Metro Area 61.2% 63.7% 2.5 ppts
Olympia-Tumwater, WA Metro Area N/A 64.4% N/A
Port Angeles, WA Micro Area 66.7% 67.8% 1.1 ppts
Seattle-Tacoma-Bellevue, WA Metro Area 60.6% 59.9% -0.7 ppts
Spokane-Spokane Valley, WA Metro Area N/A 62.0% N/A
Vancouver city, Washington 53.3% 48.8% -4.5 ppts
Yakima, WA Metro Area 61.0% 64.1% 3.1 ppts
Source: U.S. Census Bureau, American Community Survey, 2010 and 2015.
15
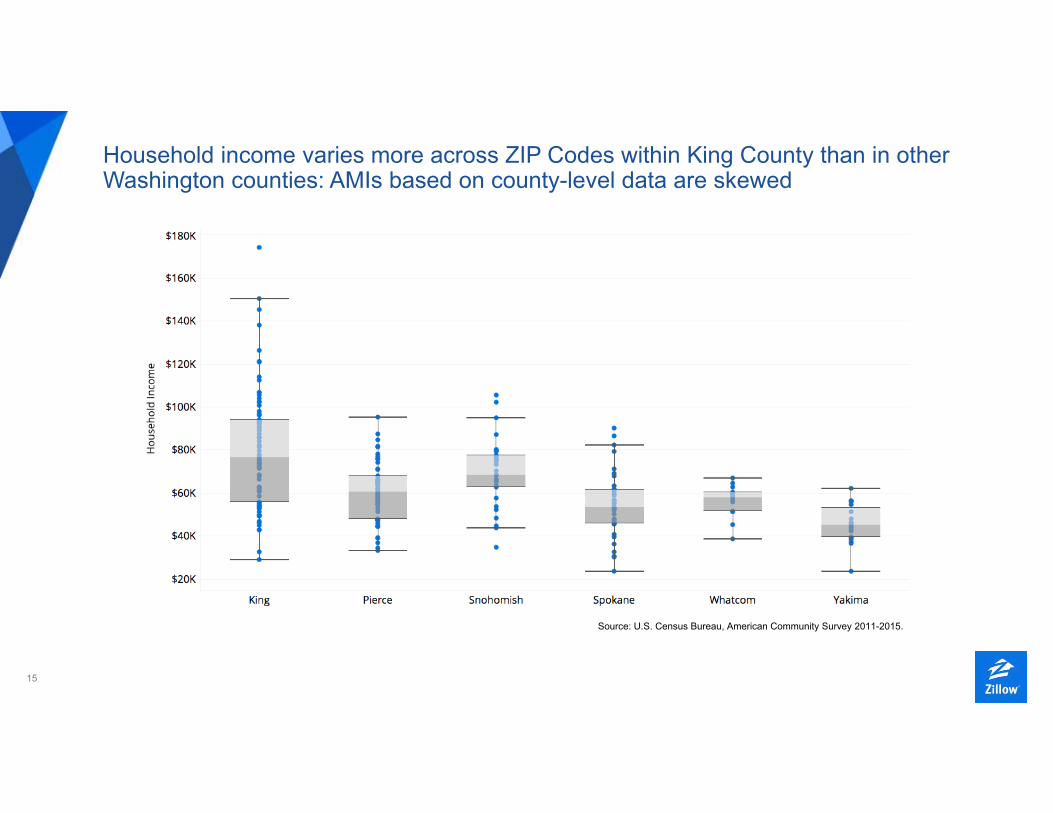
Household income varies more across ZIP Codes within King County than in other Washington counties: AMIs based on county-level data are skewed
Source: U.S. Census Bureau, American Community Survey 2011-2015.
16
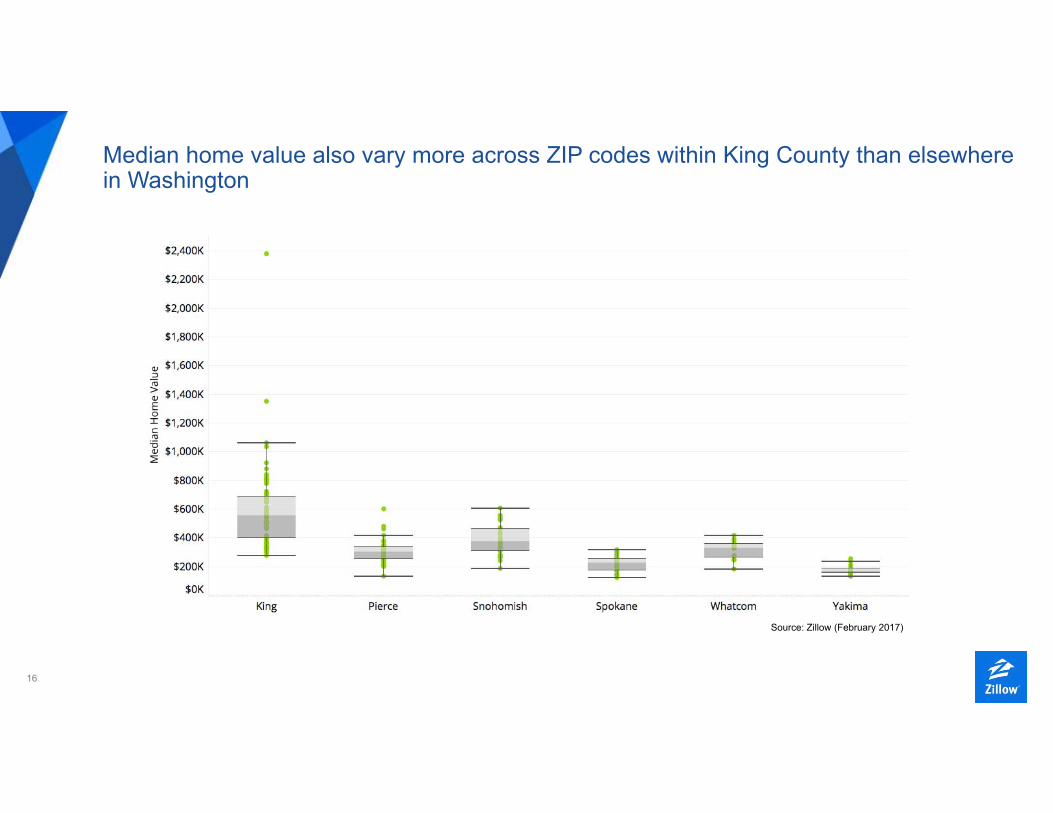
Median home value also vary more across ZIP codes within King County than elsewhere in Washington
Source: Zillow (February 2017)
17
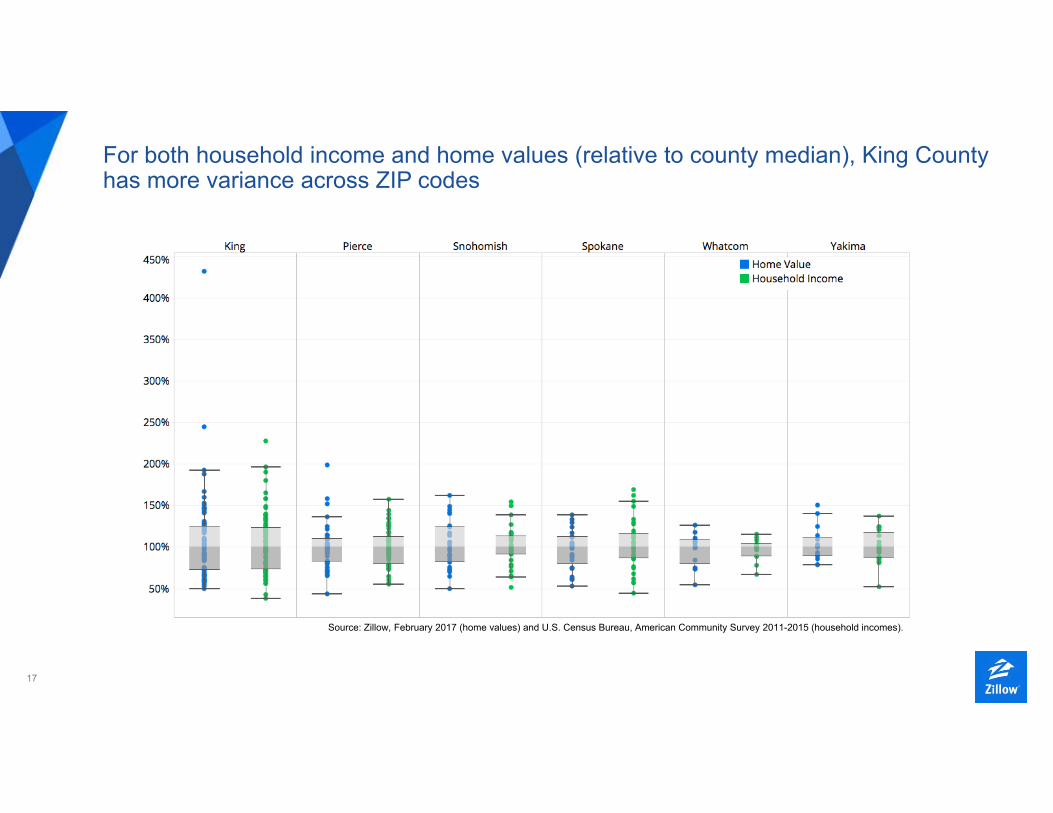
For both household income and home values (relative to county median), King County has more variance across ZIP codes
Source: Zillow, February 2017 (home values) and U.S. Census Bureau, American Community Survey 2011-2015 (household incomes).
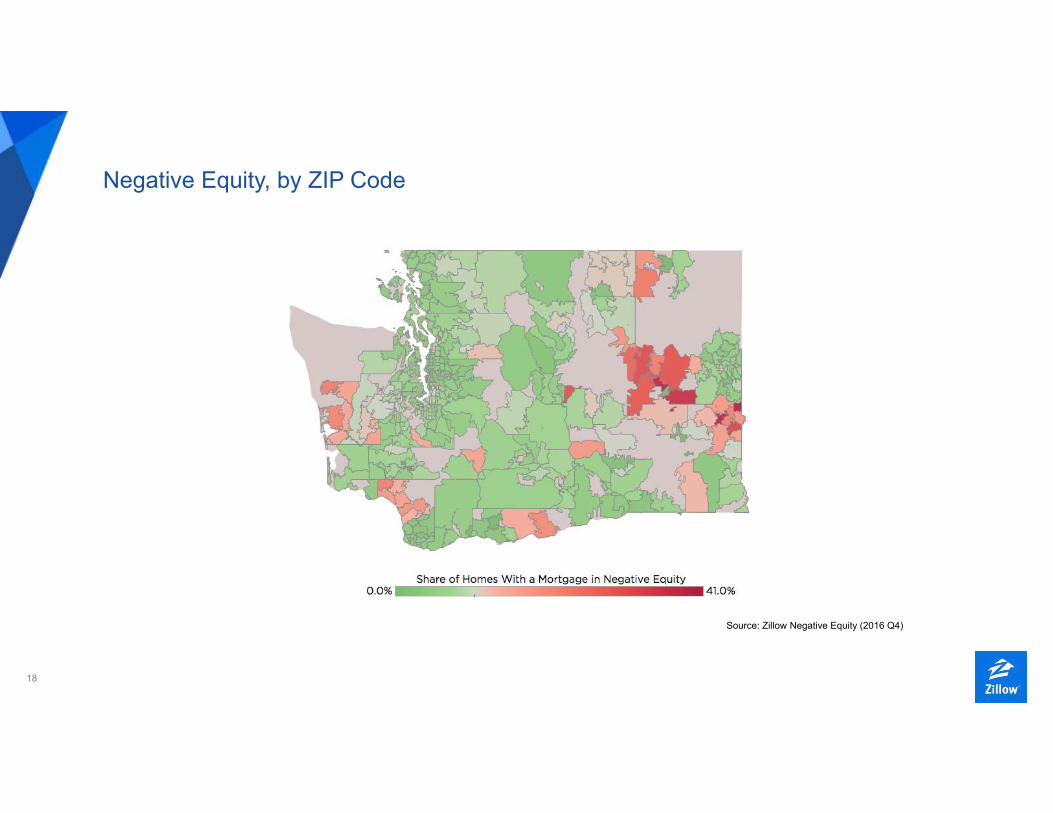
18
Negative Equity, by ZIP Code
Source: Zillow Negative Equity (2016 Q4)
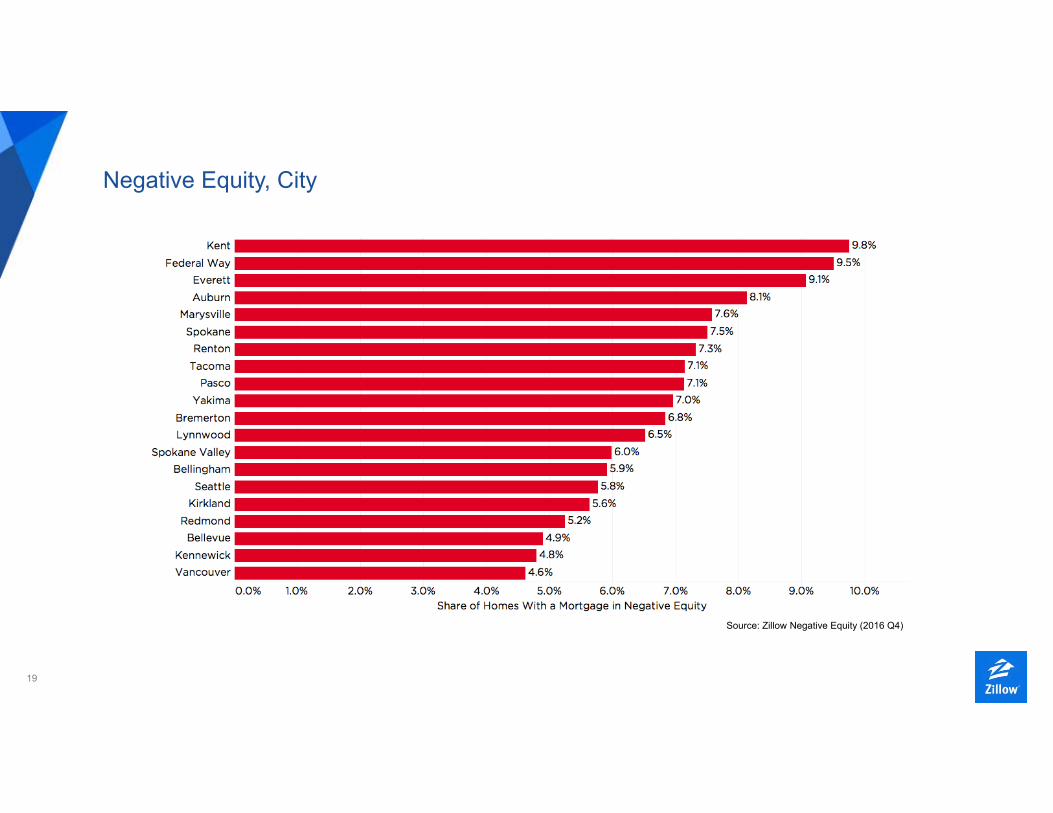
19
Negative Equity, City
Source: Zillow Negative Equity (2016 Q4)
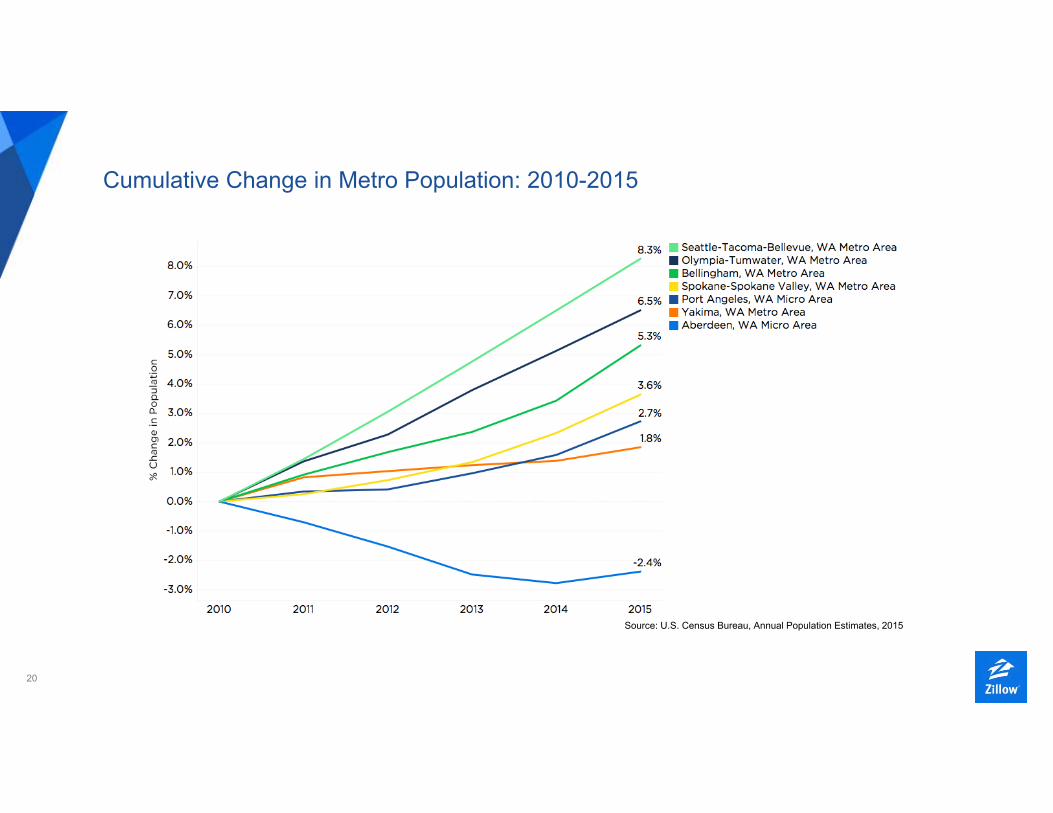
20
Cumulative Change in Metro Population: 2010-2015
Source: U.S. Census Bureau, Annual Population Estimates, 2015
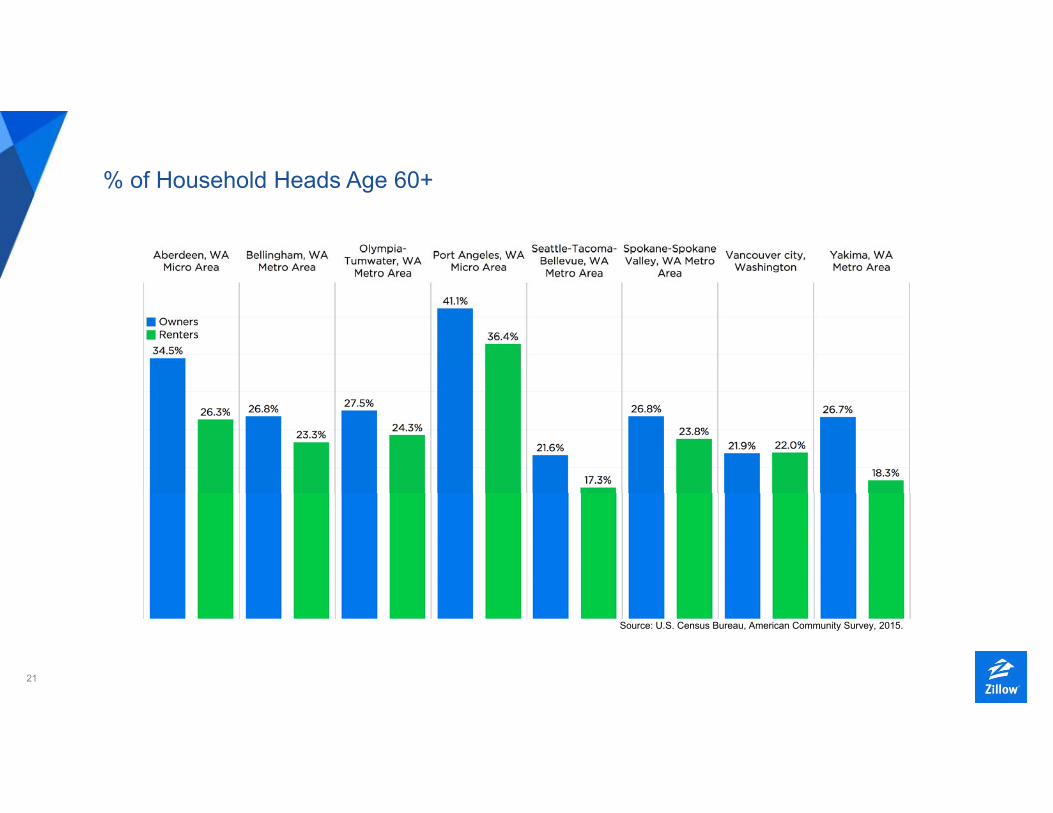
21
% of Household Heads Age 60+
Source: U.S. Census Bureau, American Community Survey, 2015.
22
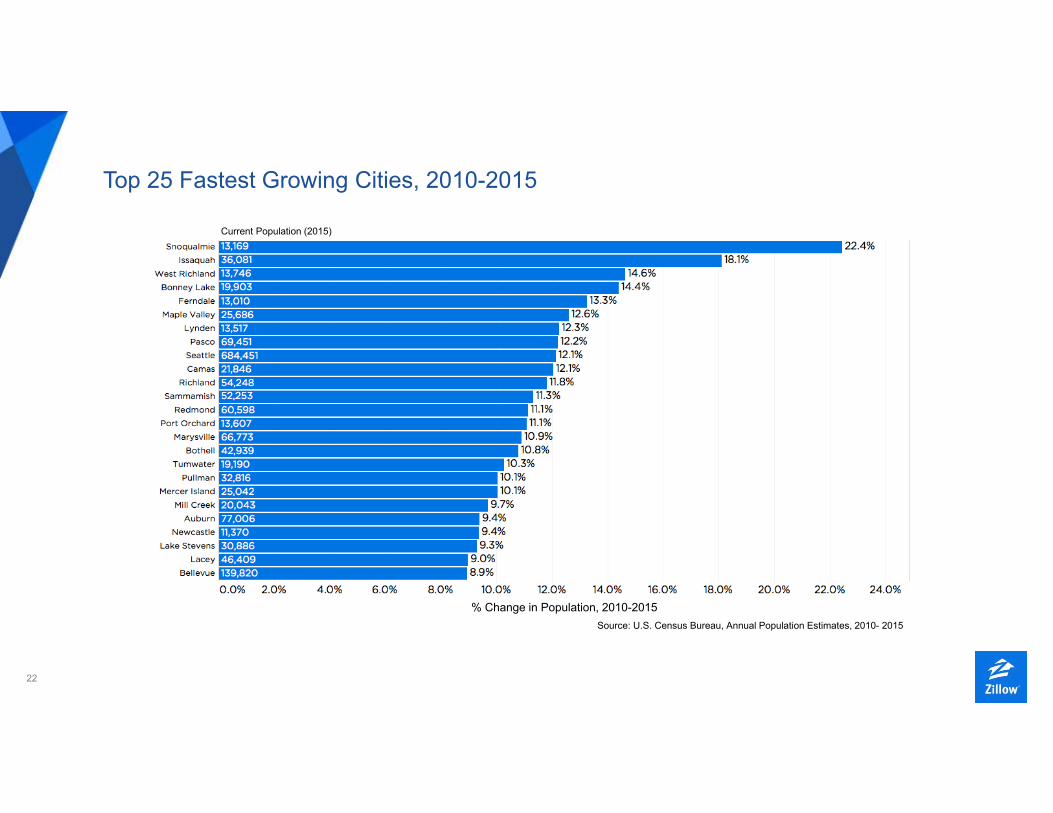
Top 25 Fastest Growing Cities, 2010-2015
Current Population (2015)
Source: U.S. Census Bureau, Annual Population Estimates, 2010- 2015
% Change in Population, 2010-2015
23
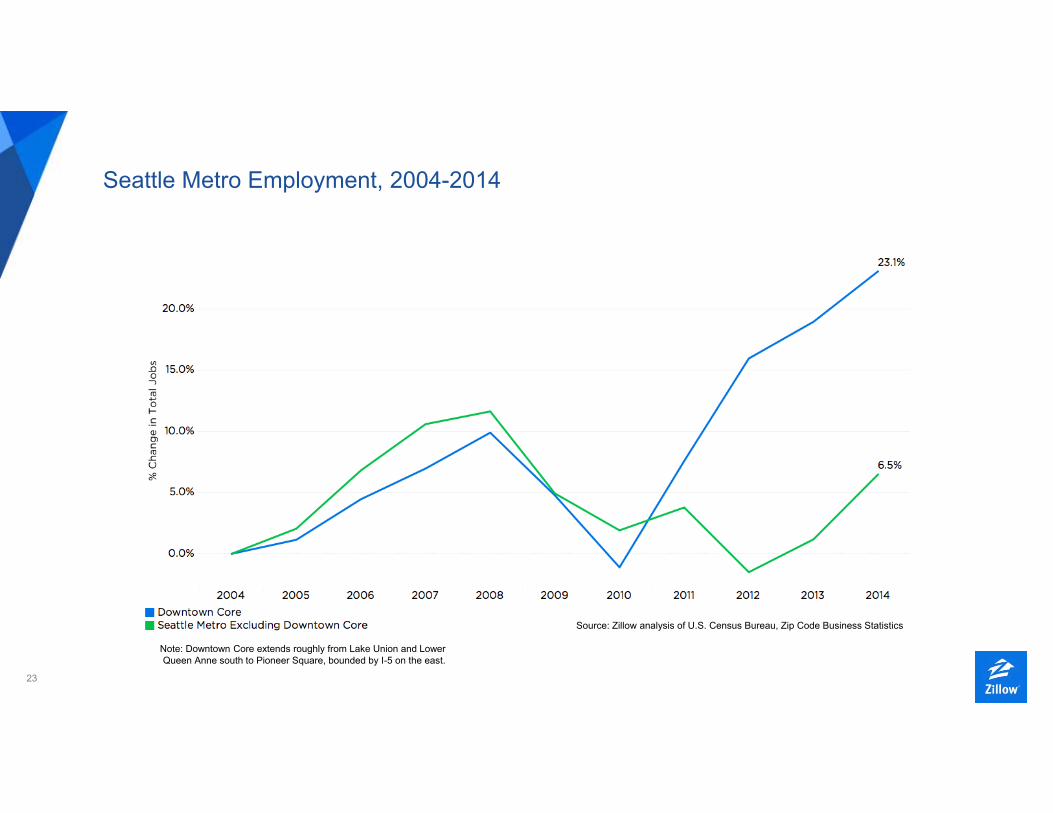
Seattle Metro Employment, 2004-2014
Source: Zillow analysis of U.S. Census Bureau, Zip Code Business Statistics
Note: Downtown Core extends roughly from Lake Union and Lower Queen Anne south to Pioneer Square, bounded by I-5 on the east.
24
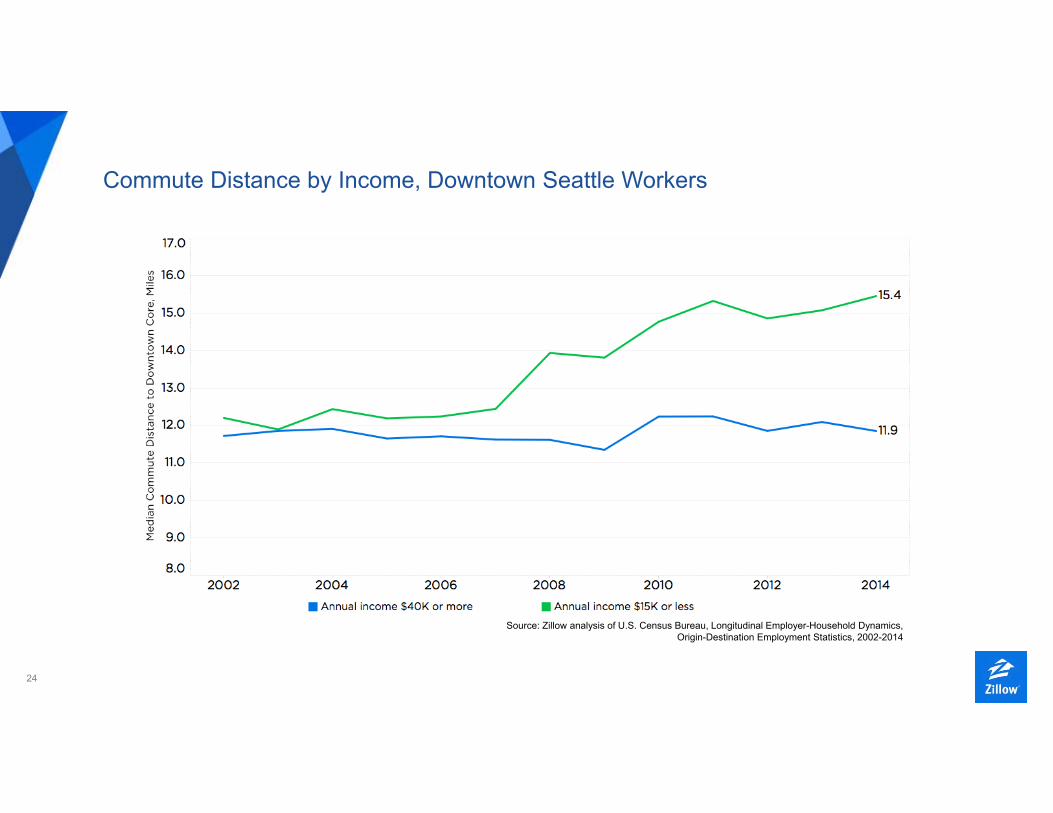
Commute Distance by Income, Downtown Seattle Workers
Source: Zillow analysis of U.S. Census Bureau, Longitudinal Employer-Household Dynamics, Origin-Destination Employment Statistics, 2002-2014
25
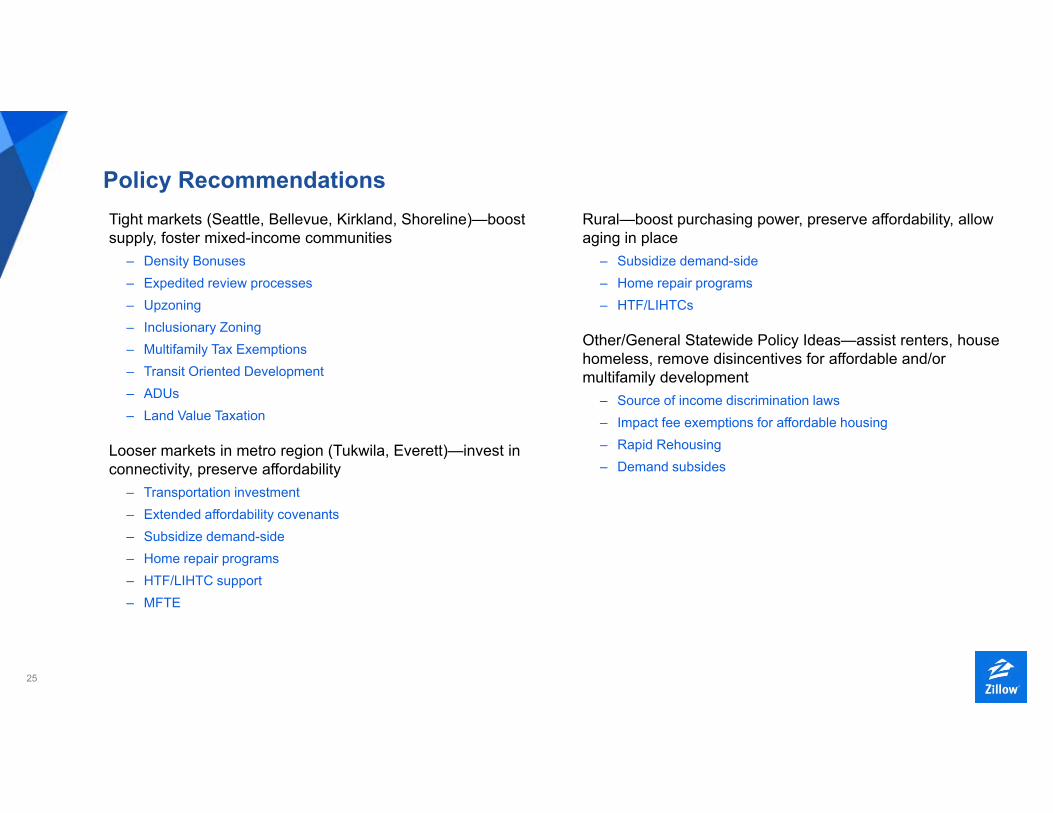
Policy RecommendationsTight markets (Seattle, Bellevue, Kirkland, Shoreline)—boost supply, foster mixed-income communities
– Density Bonuses– Expedited review processes – Upzoning– Inclusionary Zoning– Multifamily Tax Exemptions– Transit Oriented Development – ADUs – Land Value Taxation
Looser markets in metro region (Tukwila, Everett)—invest in connectivity, preserve affordability
– Transportation investment– Extended affordability covenants – Subsidize demand-side– Home repair programs– HTF/LIHTC support – MFTE
Rural—boost purchasing power, preserve affordability, allow aging in place
– Subsidize demand-side– Home repair programs– HTF/LIHTCs
Other/General Statewide Policy Ideas—assist renters, house homeless, remove disincentives for affordable and/or multifamily development
– Source of income discrimination laws– Impact fee exemptions for affordable housing– Rapid Rehousing – Demand subsides


