RESEARCH REPORT Affordable Housing Needs Assessment for the District of Columbia Phase II Peter Tatian Josh Leopold Elizabeth Oo Gerry Joseph Graham MacDonald Austin Nichols Maia Woluchem Simone Zhang with Katya Abazajian May 2015 HOUSING AND HOUSING FINANCE
Transcript
RESEARCH REPORT
Affordable Housing Needs
Assessment for the District of
Columbia Phase II
Peter Tatian Josh Leopold Elizabeth Oo Gerry Joseph
Graham MacDonald Austin Nichols Maia Woluchem Simone Zhang
with Katya Abazajian
May 2015
H O U S I N G A N D H O U S I N G F I N A N C E
ABOUT THE URBAN INSTITUTE The nonprofit Urban Institute is dedicated to elevating the debate on social and economic policy. For nearly five
decades, Urban scholars have conducted research and offered evidence-based solutions that improve lives and
strengthen communities across a rapidly urbanizing world. Their objective research helps expand opportunities for
all, reduce hardship among the most vulnerable, and strengthen the effectiveness of the public sector.
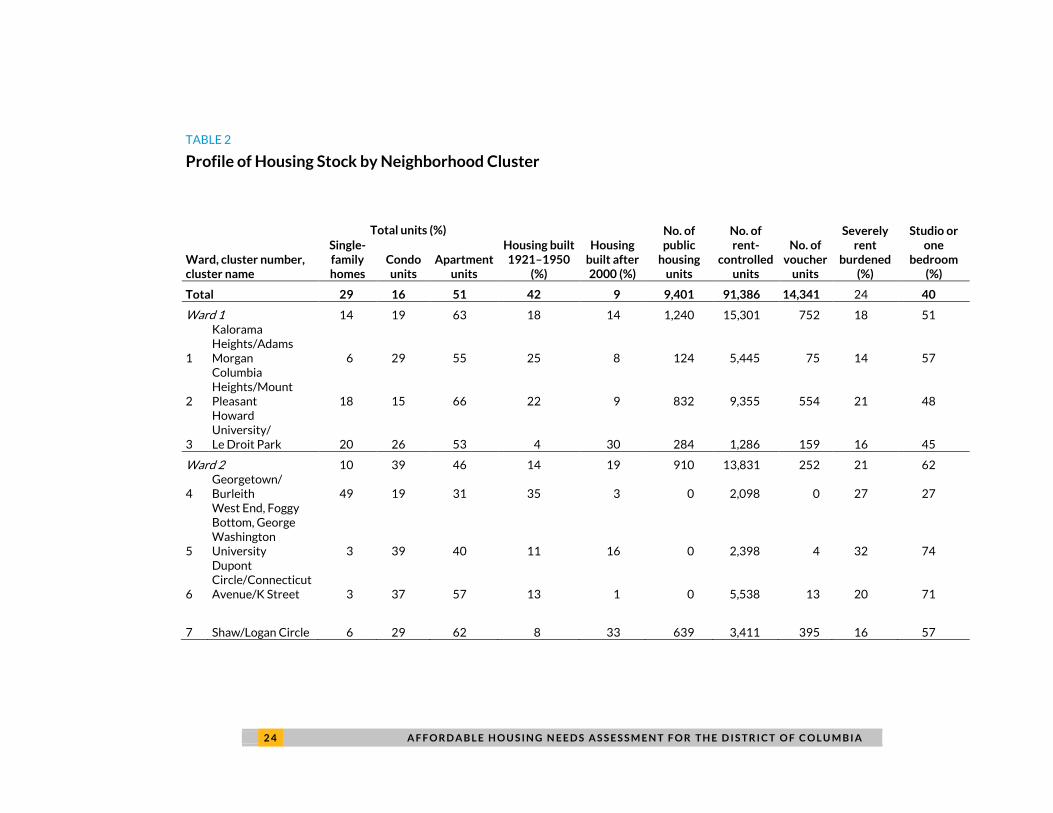
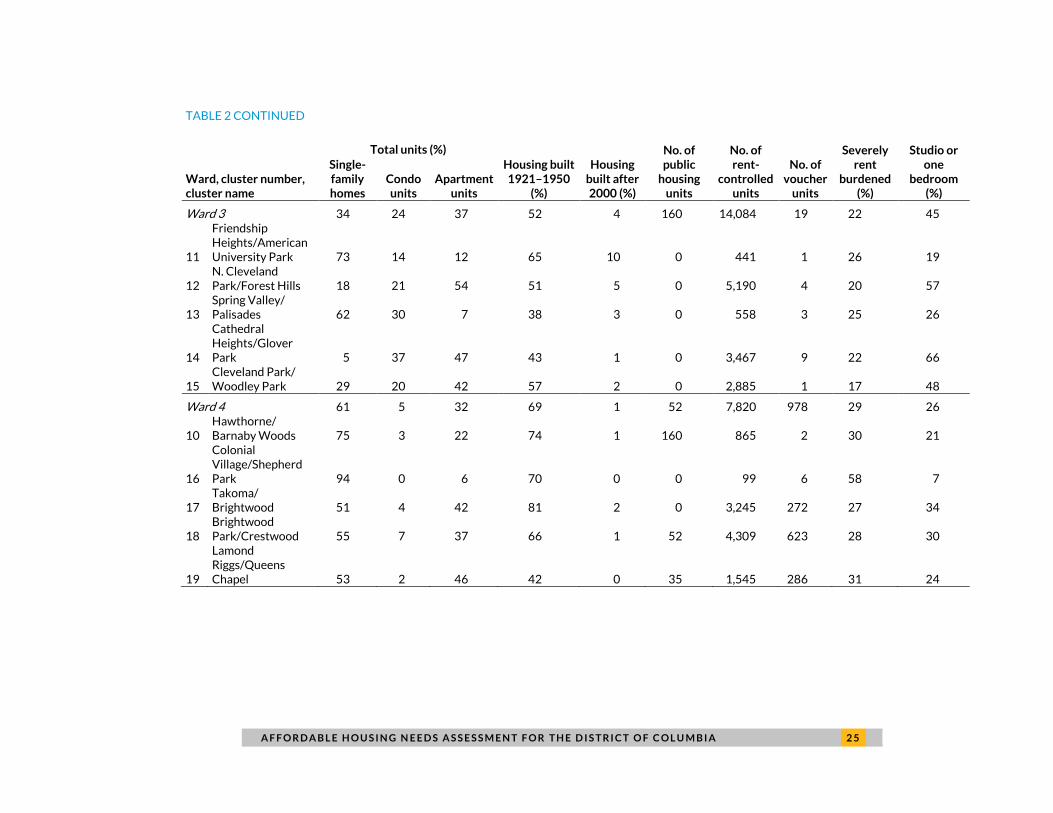
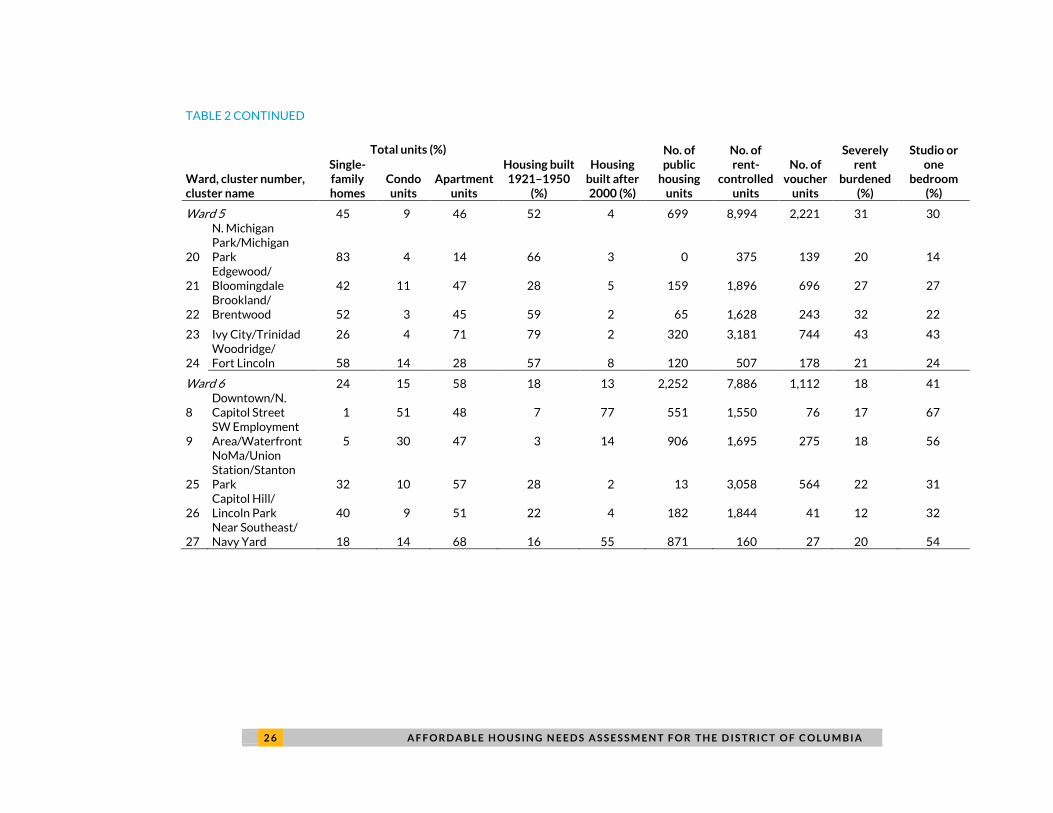
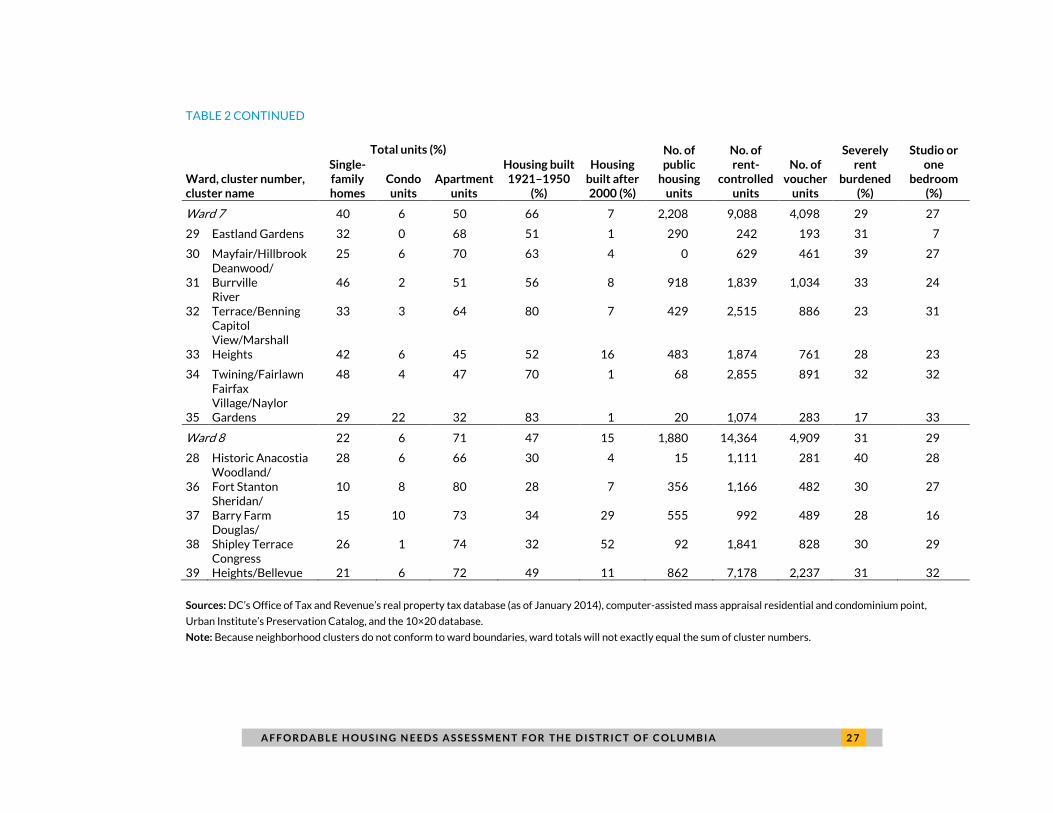
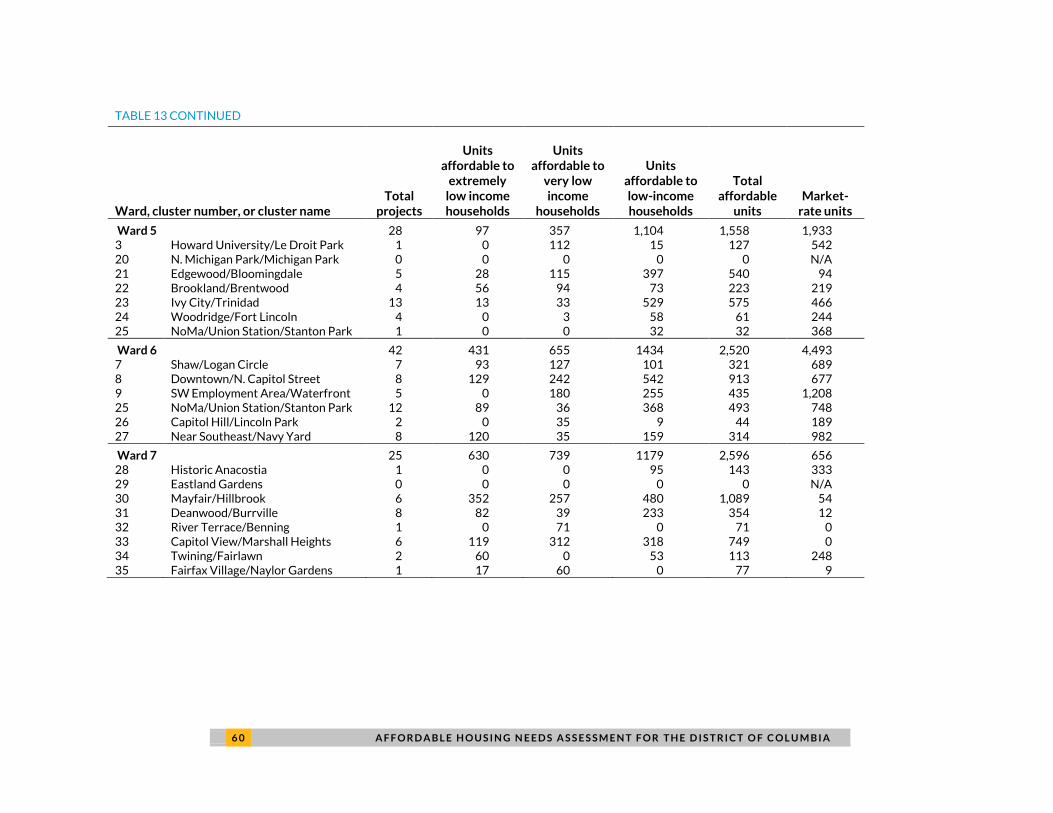
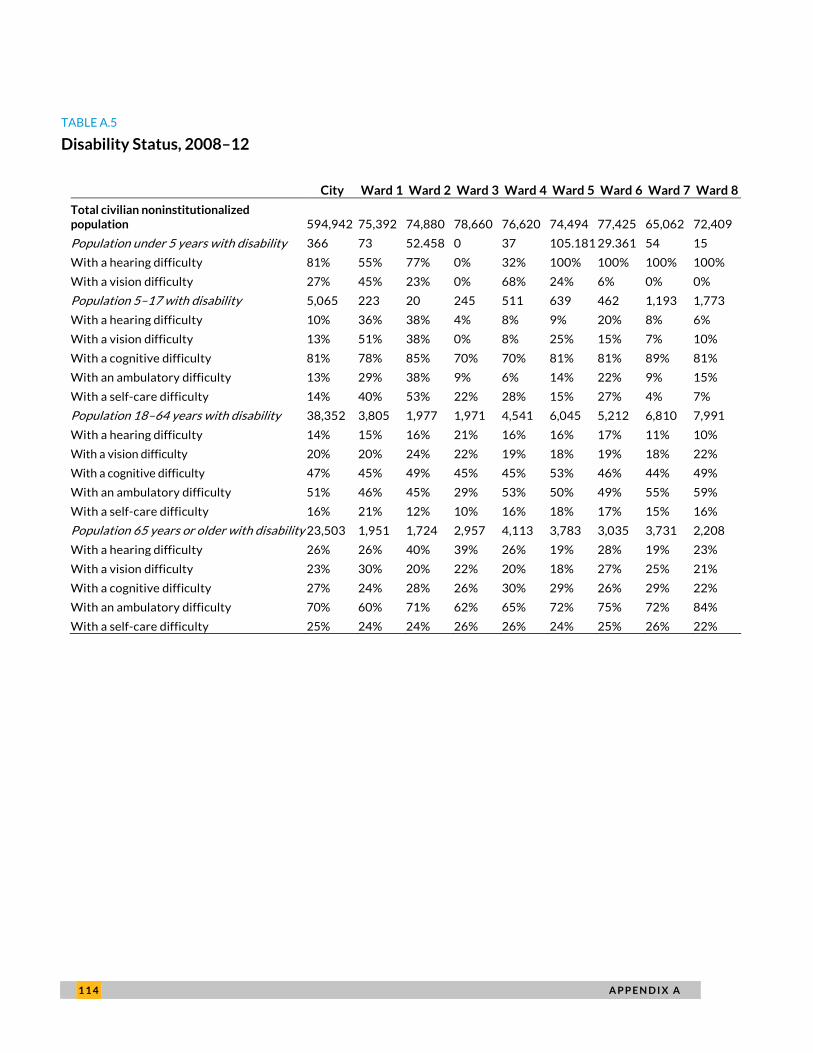
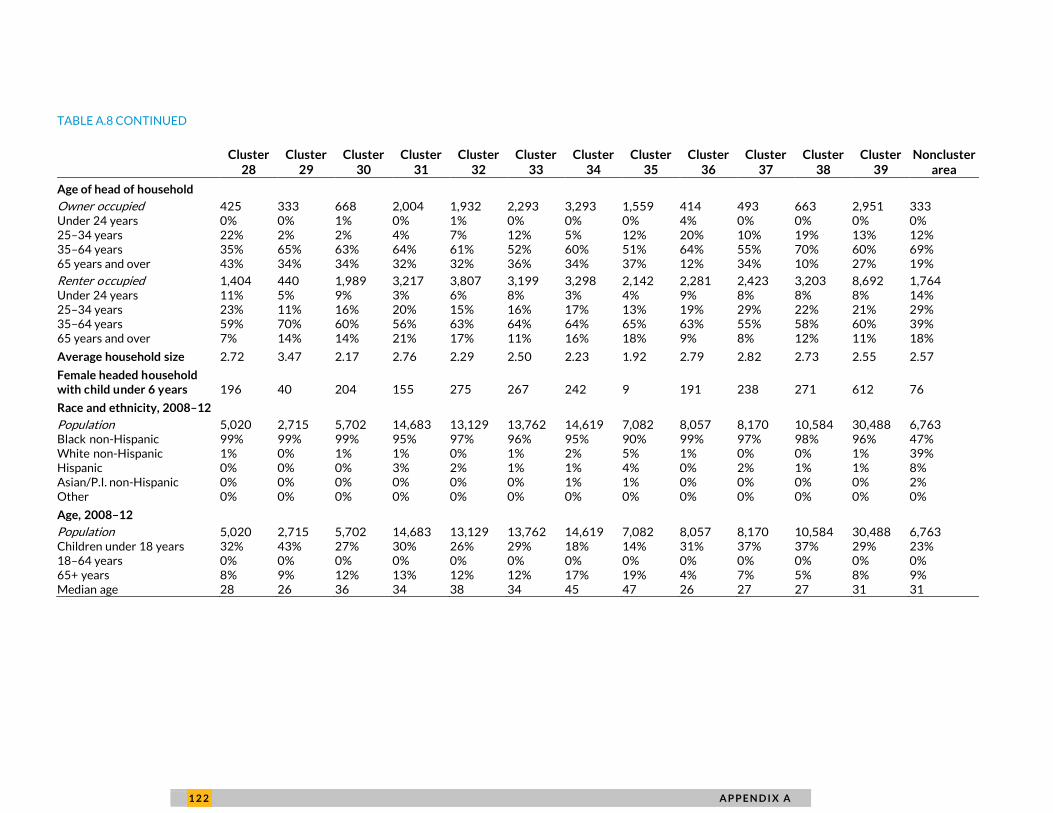
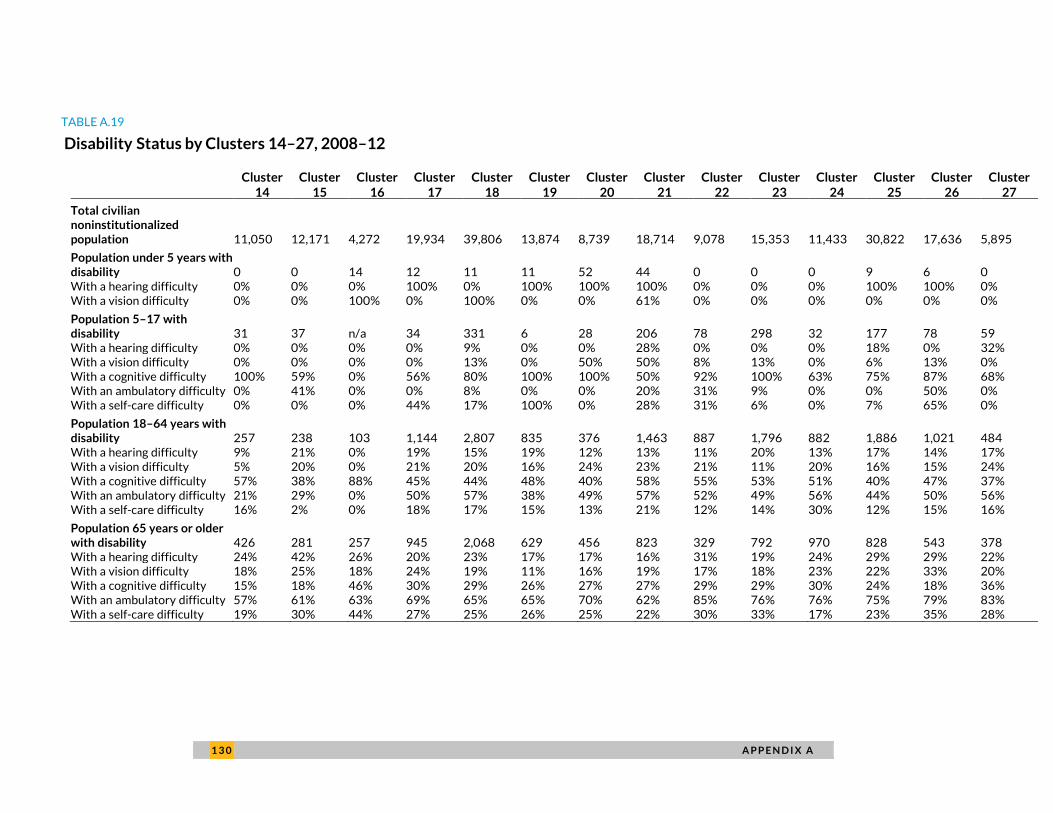
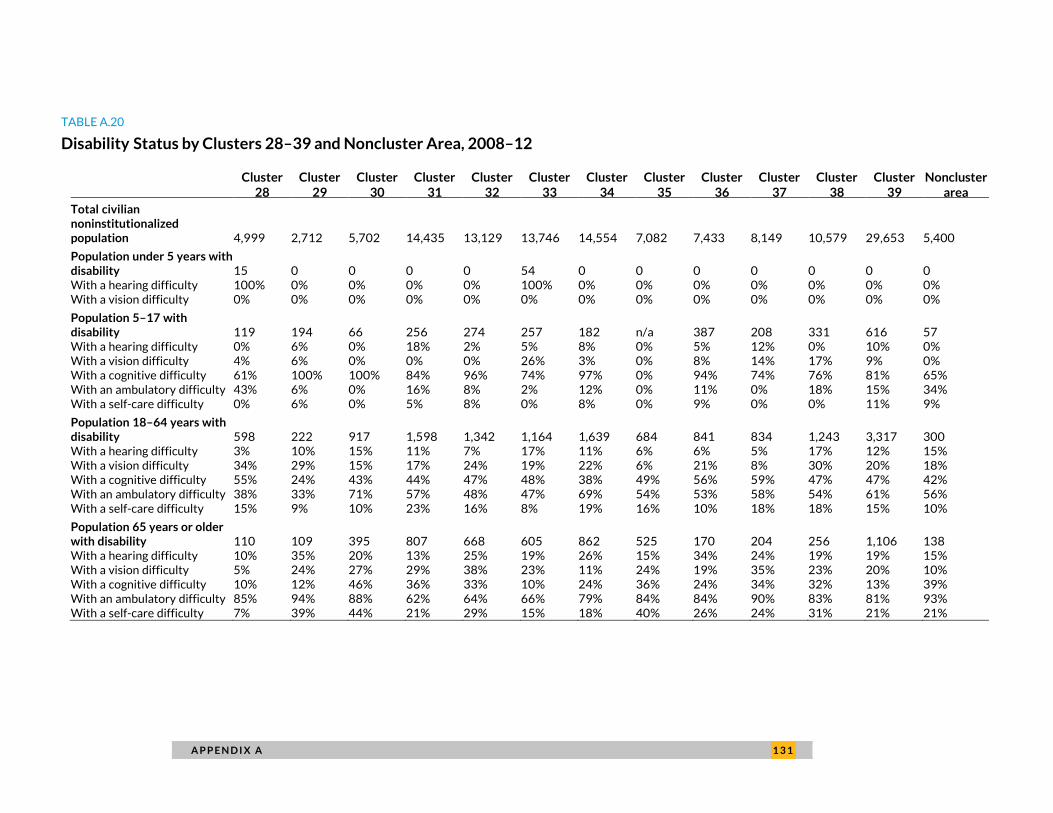
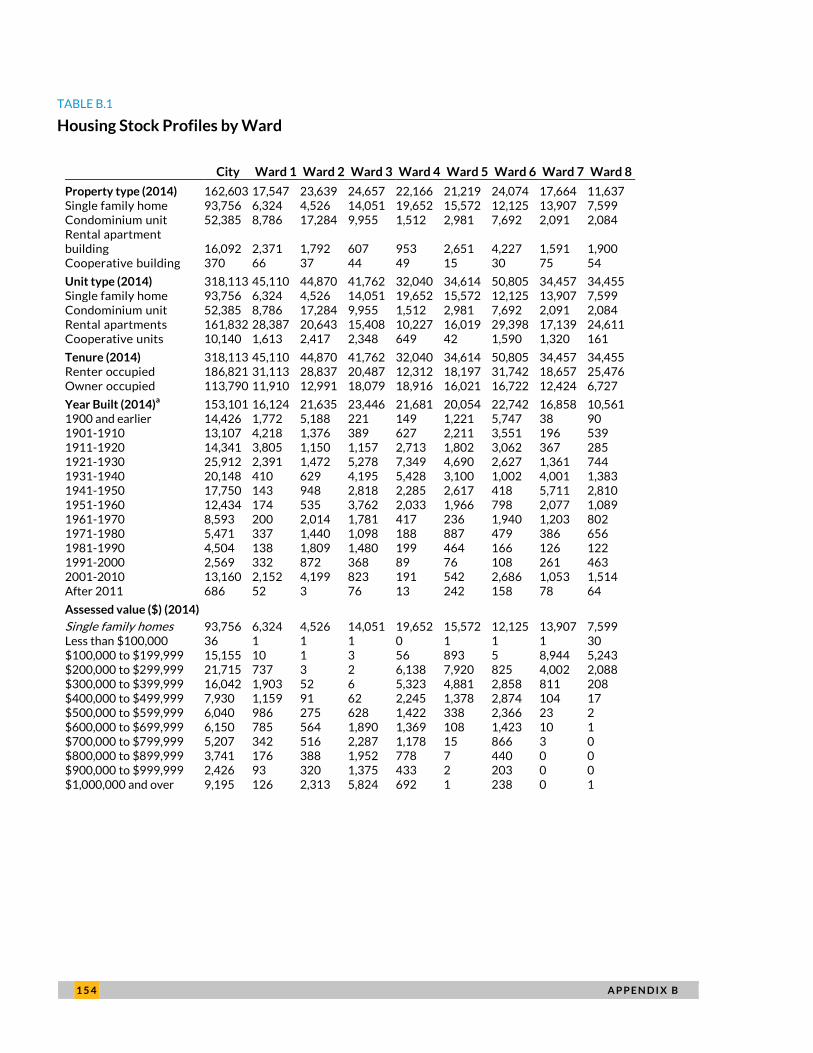
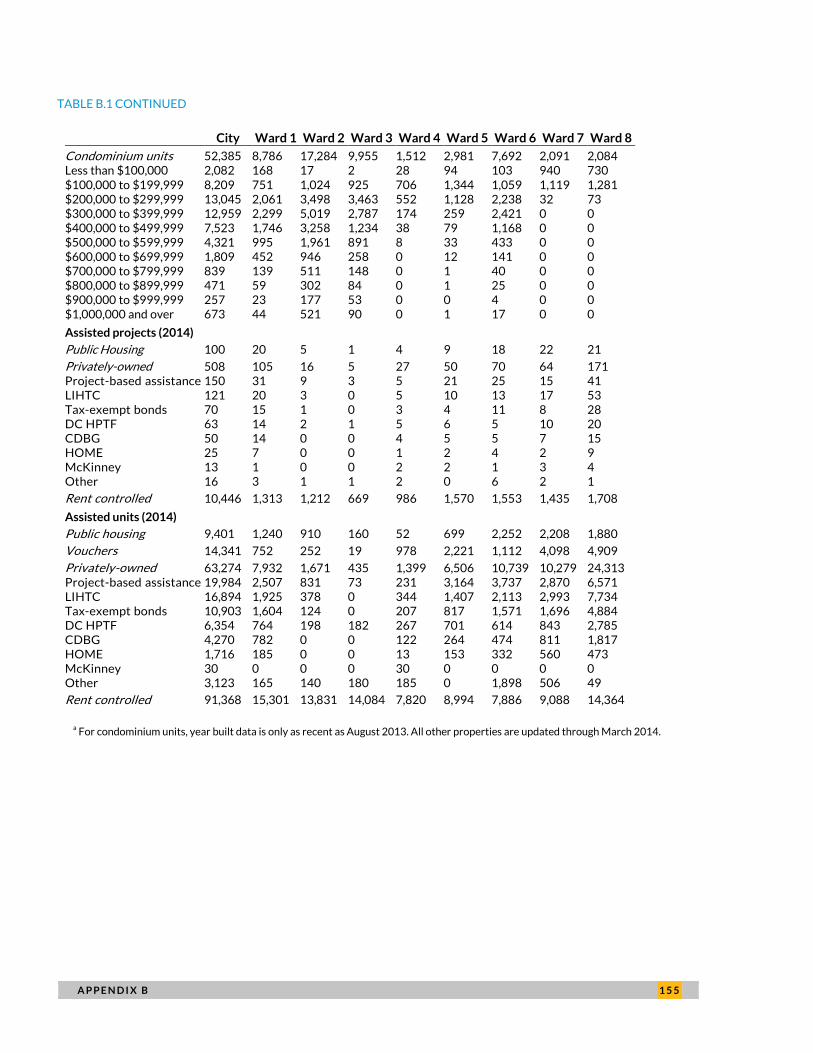
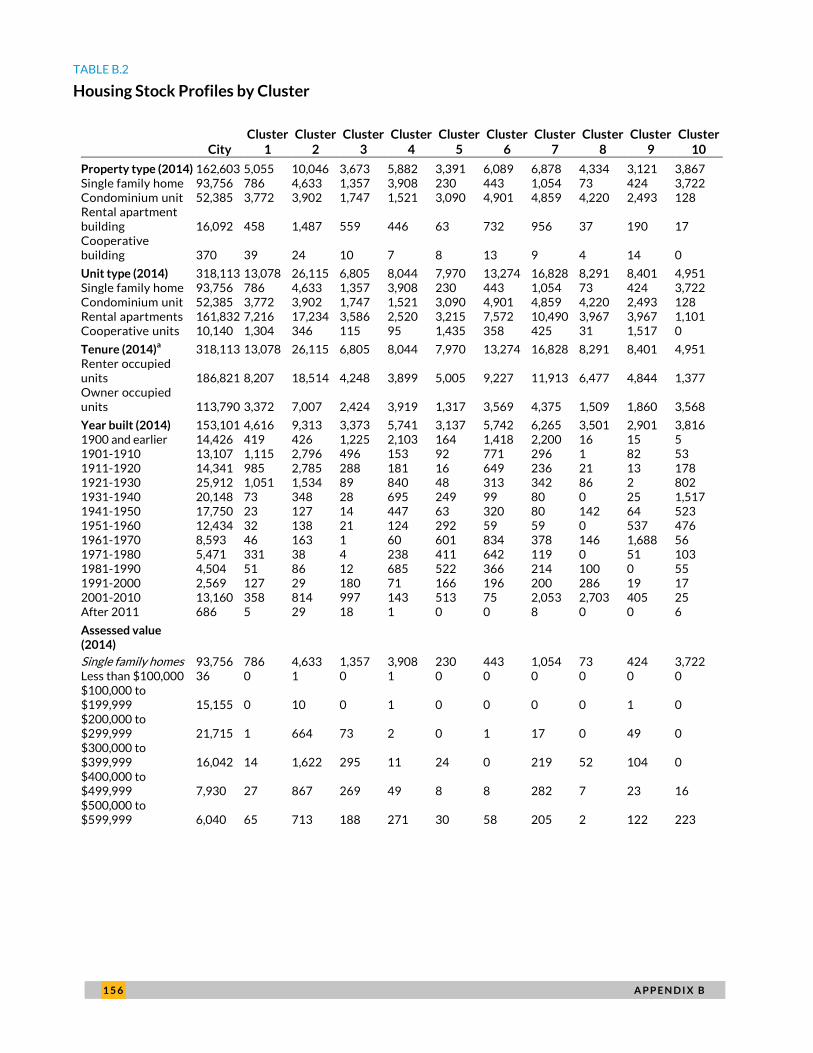
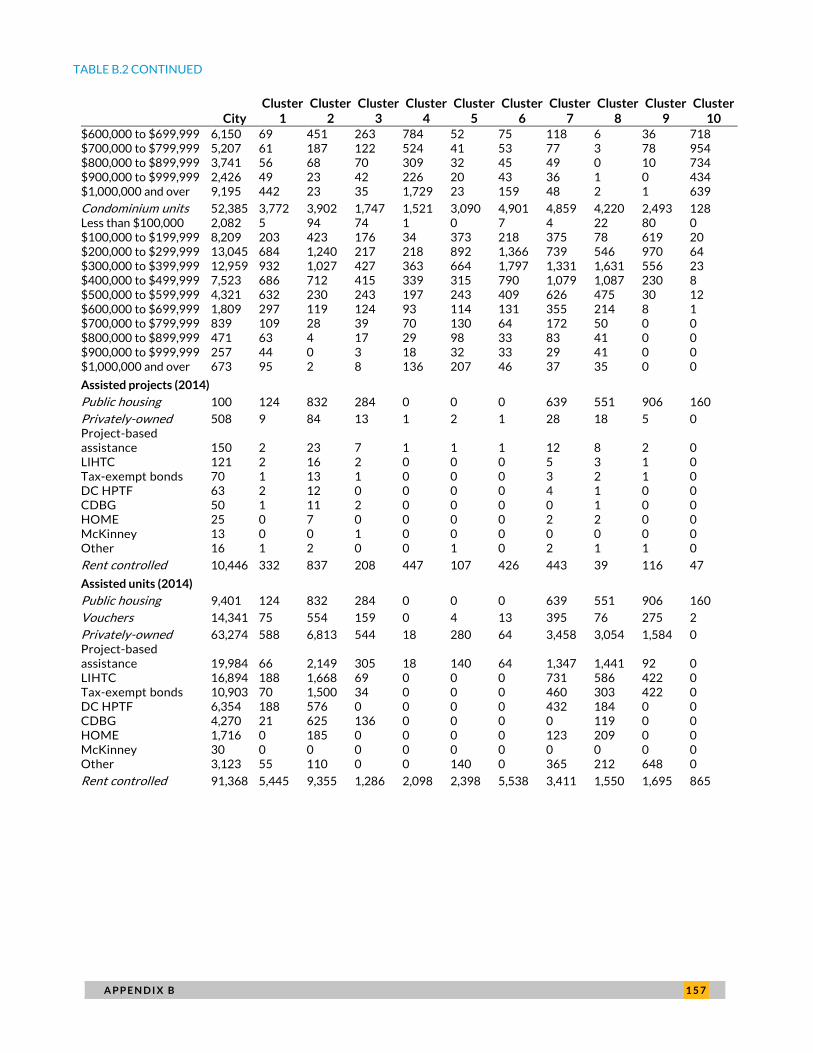
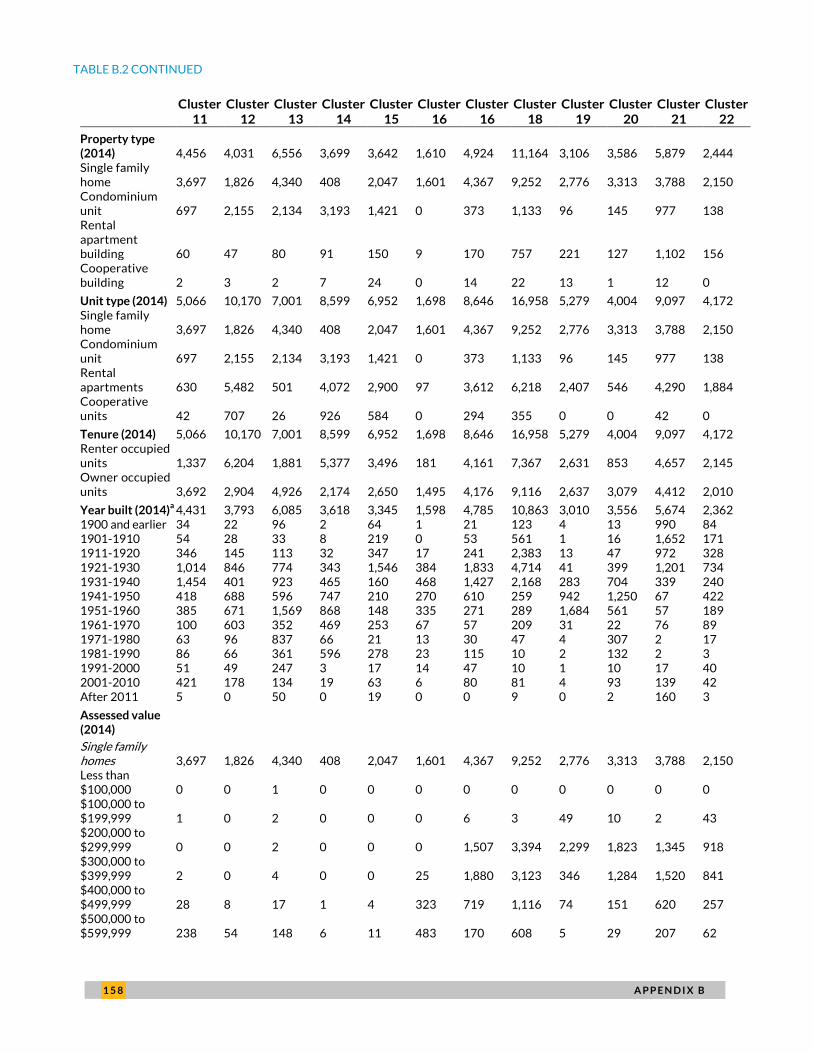
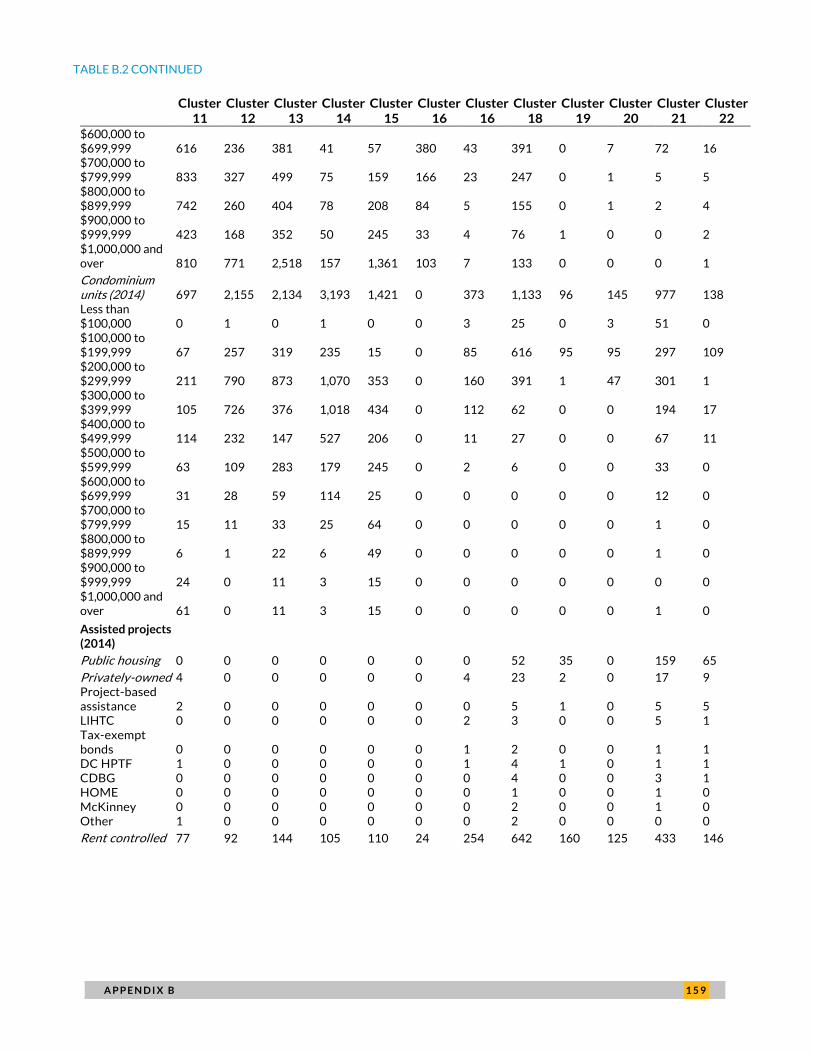
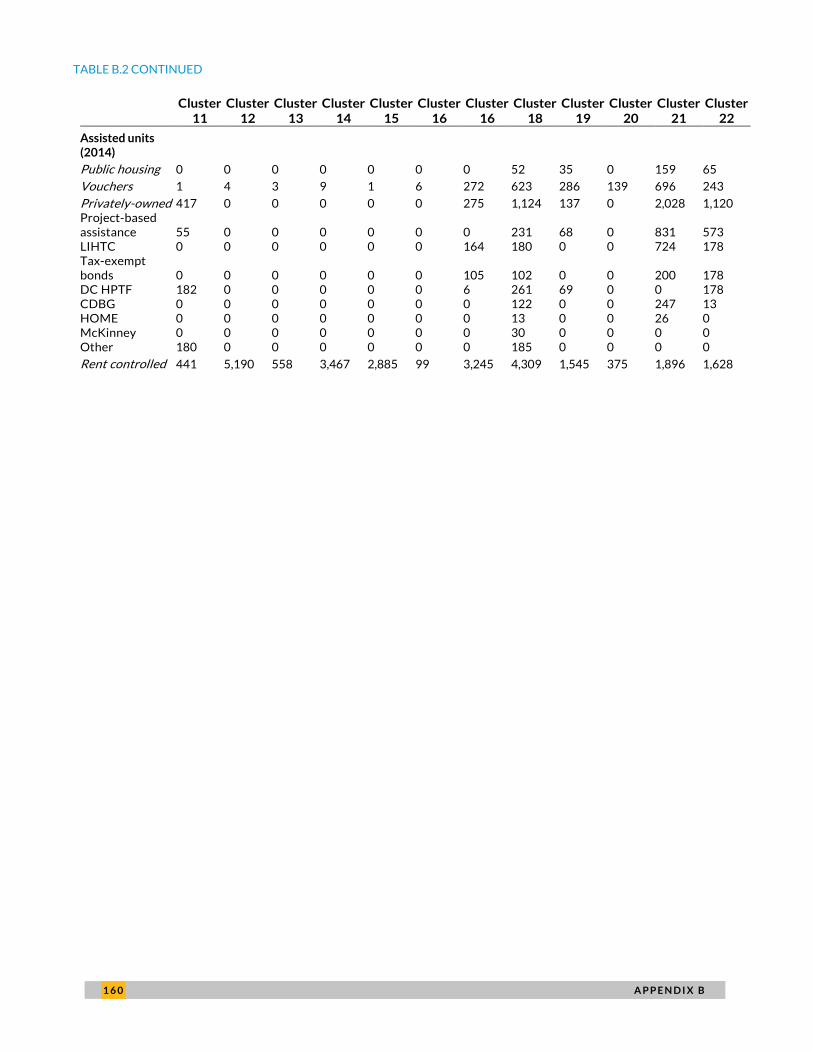
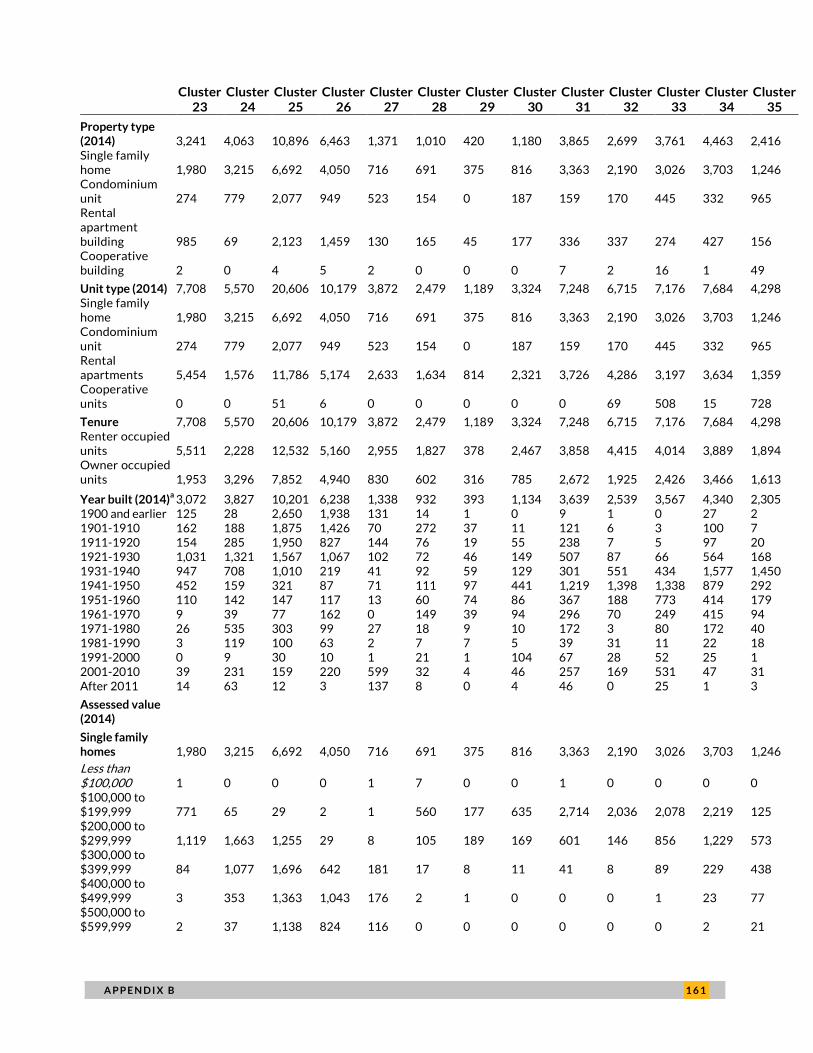
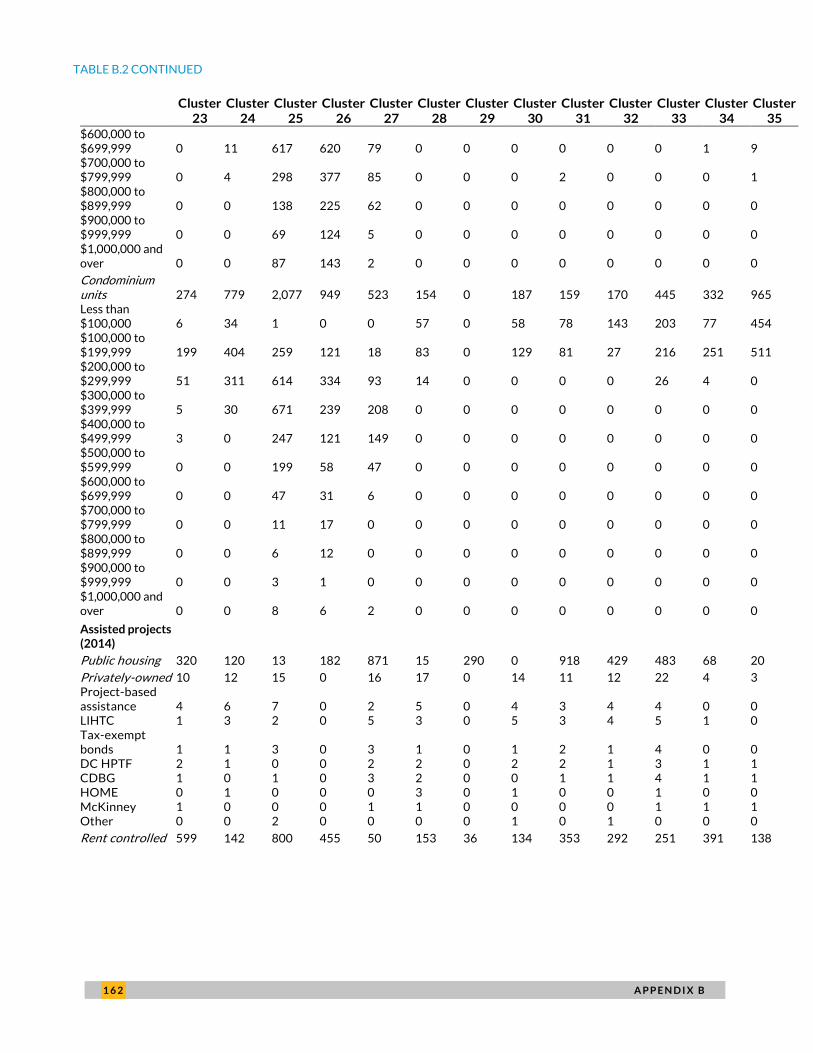
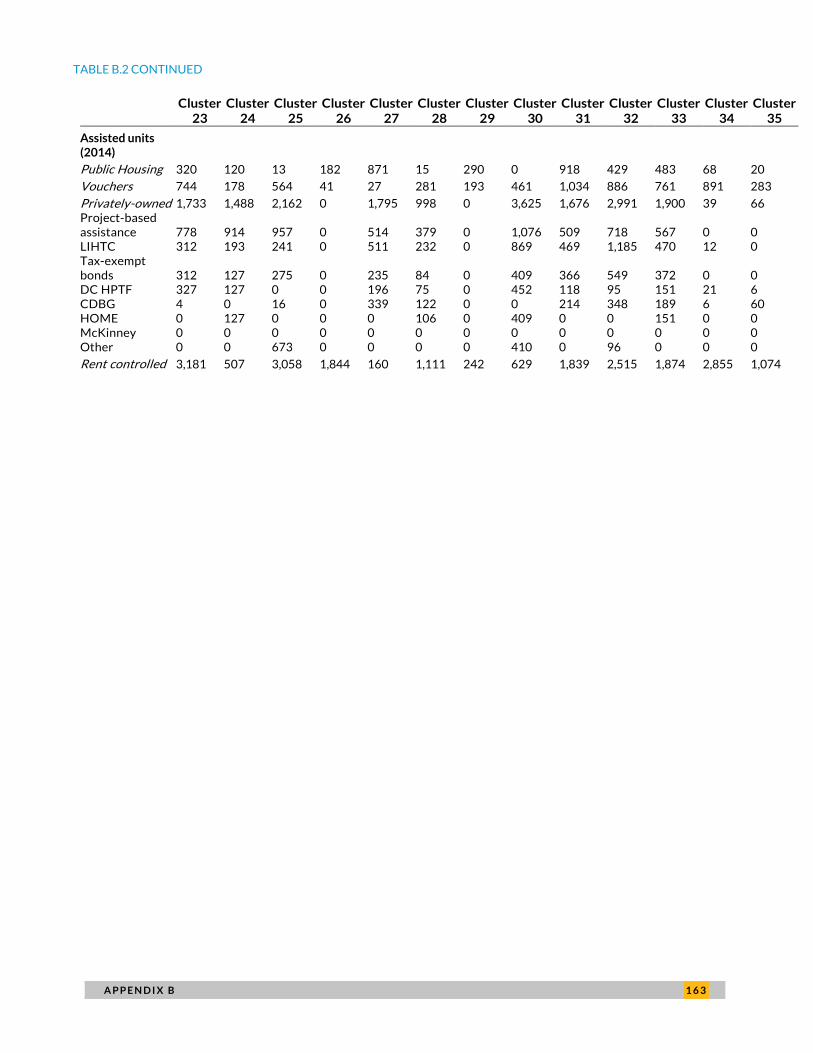
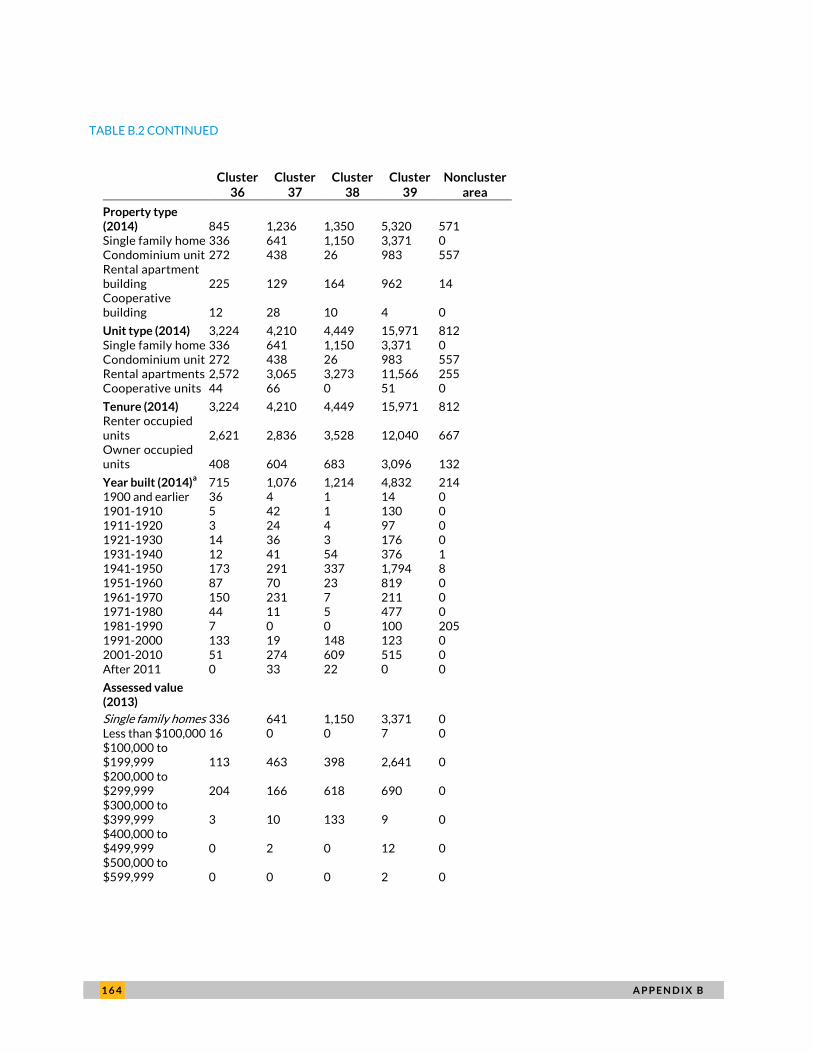
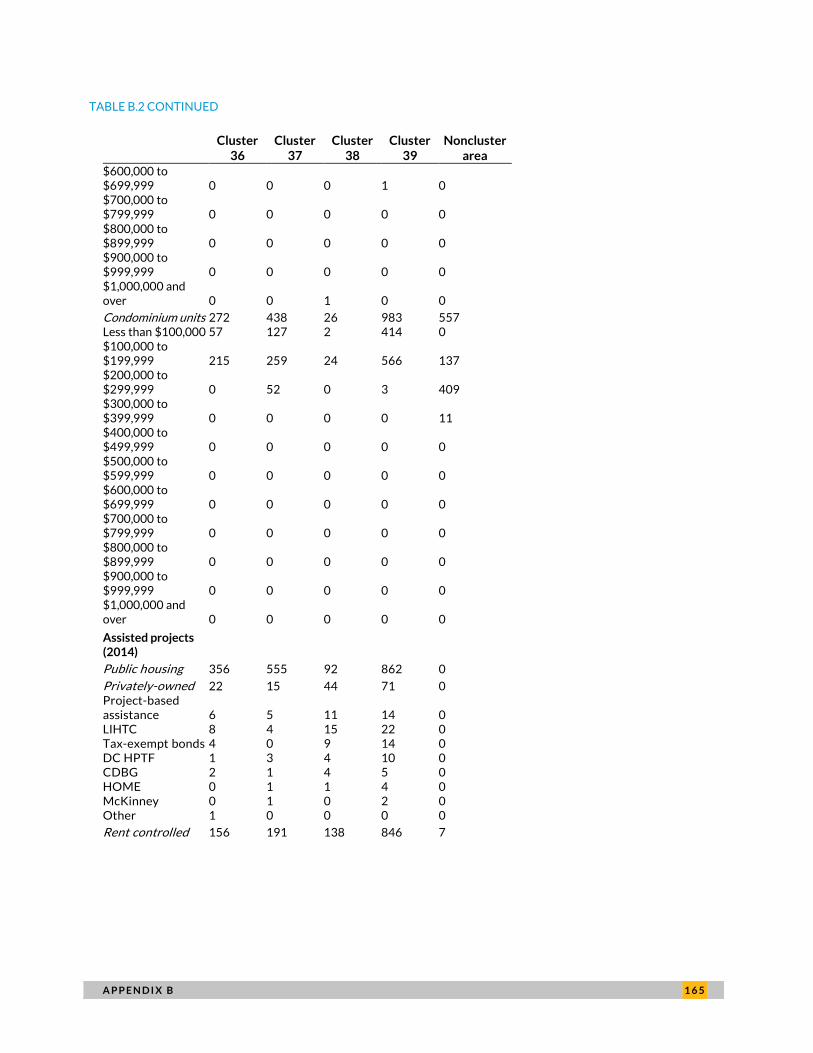
Sources: DC’s Office of Tax and Revenue’s real property tax database (as of January 2014), computer-assisted mass appraisal residential and condominium point,
Urban Institute’s Preservation Catalog, and the 10×20 database.
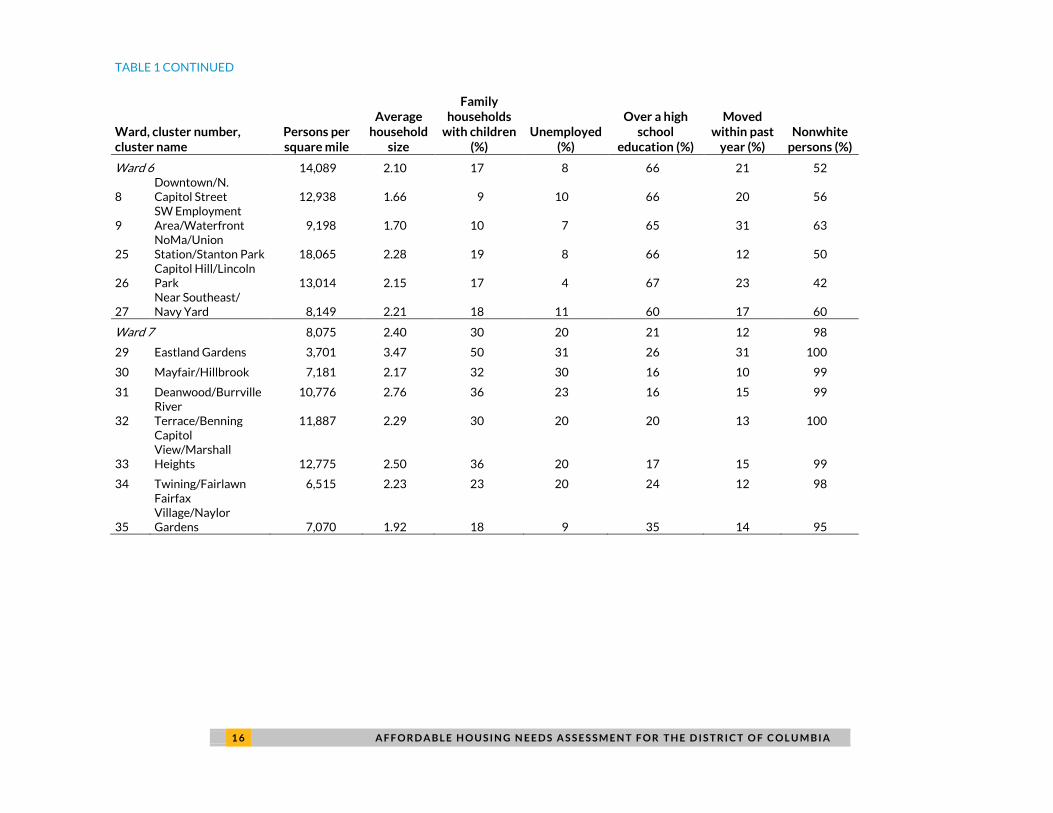
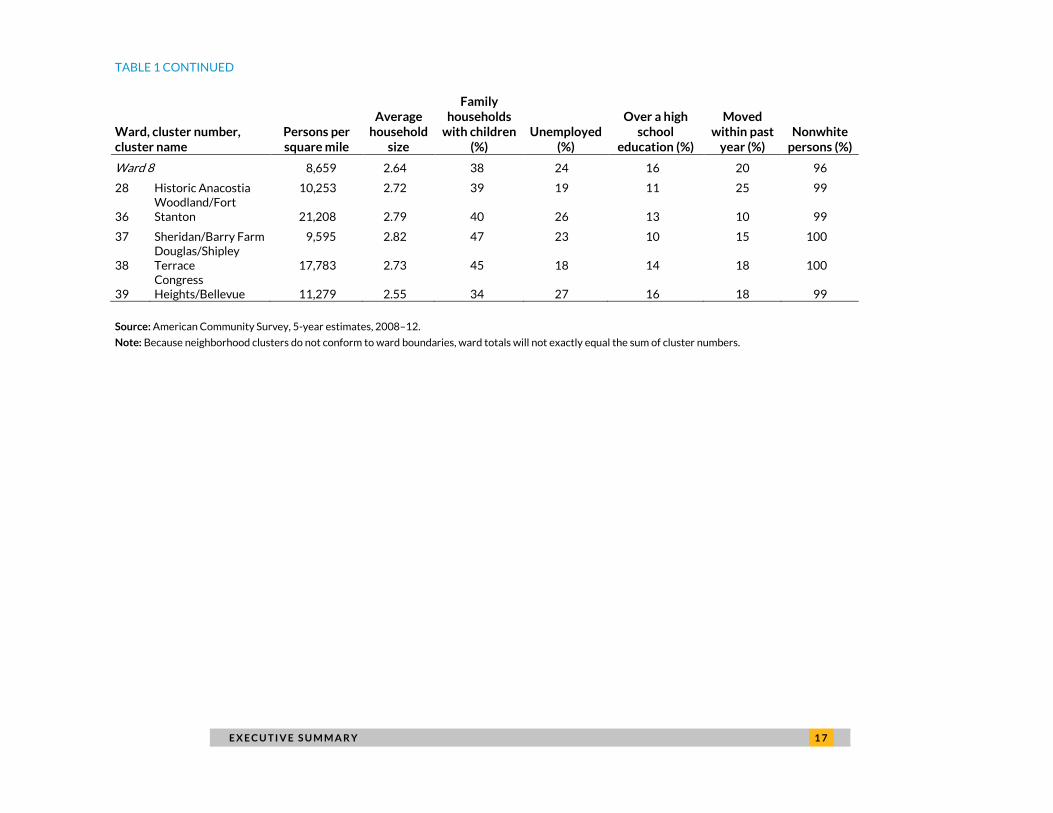
Note: Because neighborhood clusters do not conform to ward boundaries, ward totals will not exactly equal the sum of cluster numbers.
2 8 A F F O R D A B L E H O U S I N G N E E D S A S S E S S M E N T F O R T H E D I S T R I C T O F C O L U M B I A
Year Built
Although the bulk of the existing residential properties in Washington, DC, were built before 1950, a
significant number were constructed between 2001 and year-end 2010, more than in the previous three
decades combined. This boom is most observed in Ward 6, where nearly 25 times the 108 properties that
had been constructed in the decade prior were built. Ward 2 had the most new properties during this
time, with nearly 4,200 properties built. Wards 1, 7, and 8 all constructed over 1,000 new structures, and
the remaining wards all saw at least twice as much new construction between 2001 and year-end 2010
than between 1991 and 2000.
While most clusters saw at least a doubling of construction activity, some saw much greater growth,
such as Cluster 27 (Near Southeast/Navy Yard), which went from having one new property built
between 1991 and 2000 to 599 built in the following decade. Other areas with above average increase in
new construction include Clusters 2 (Columbia Heights/Mount Pleasant), 9 (SW Employment
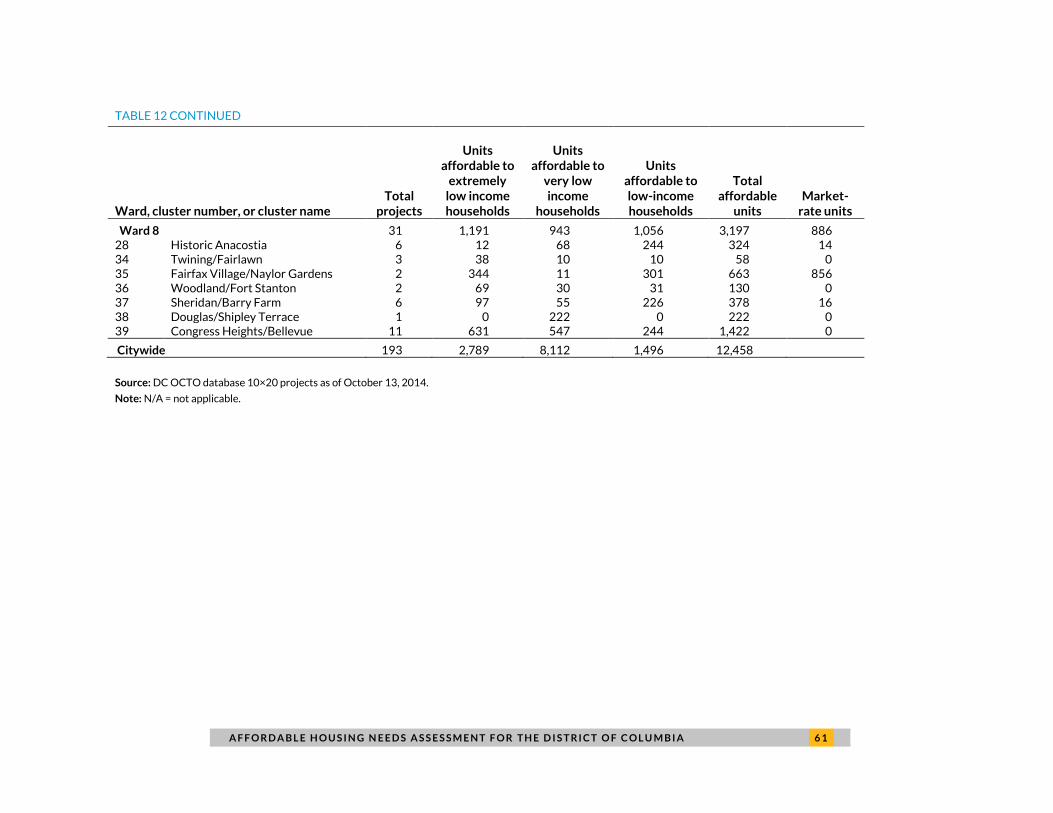
Source: DC OCTO database 10×20 projects as of October 13, 2014.
Note: N/A = not applicable.
6 2 A F F O R D A B L E H O U S I N G N E E D S A S S E S S M E N T F O R T H E D I S T R I C T O F C O L U M B I A
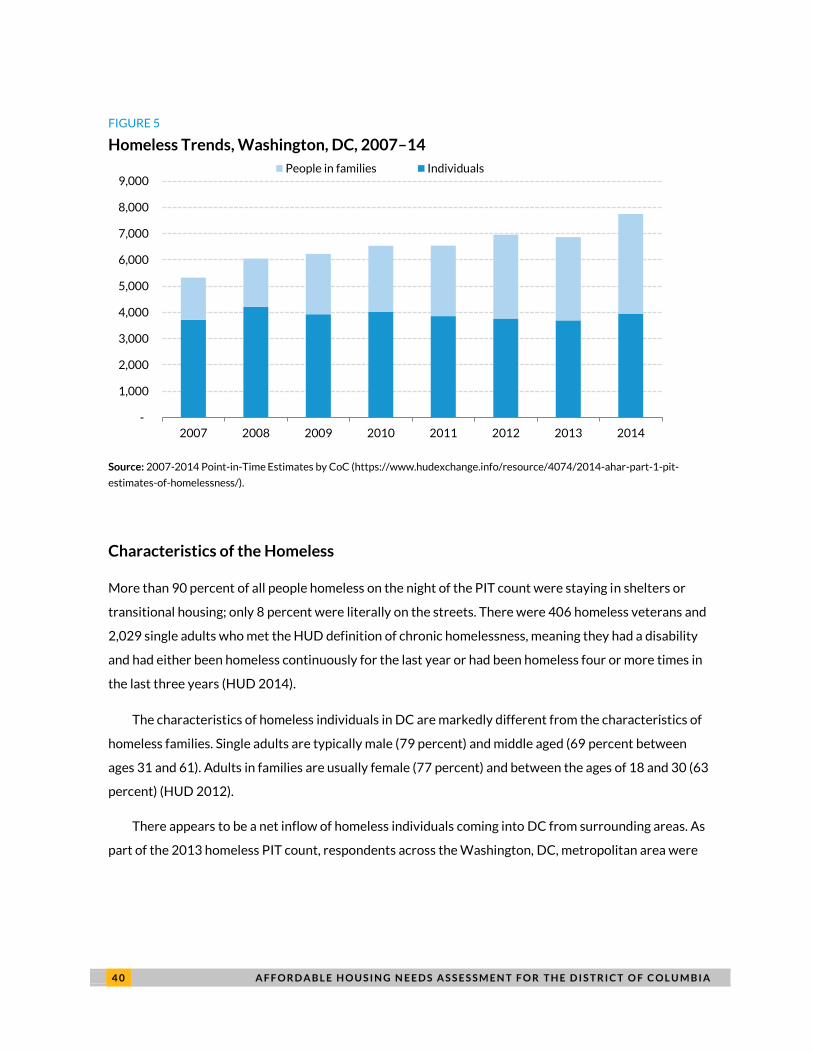
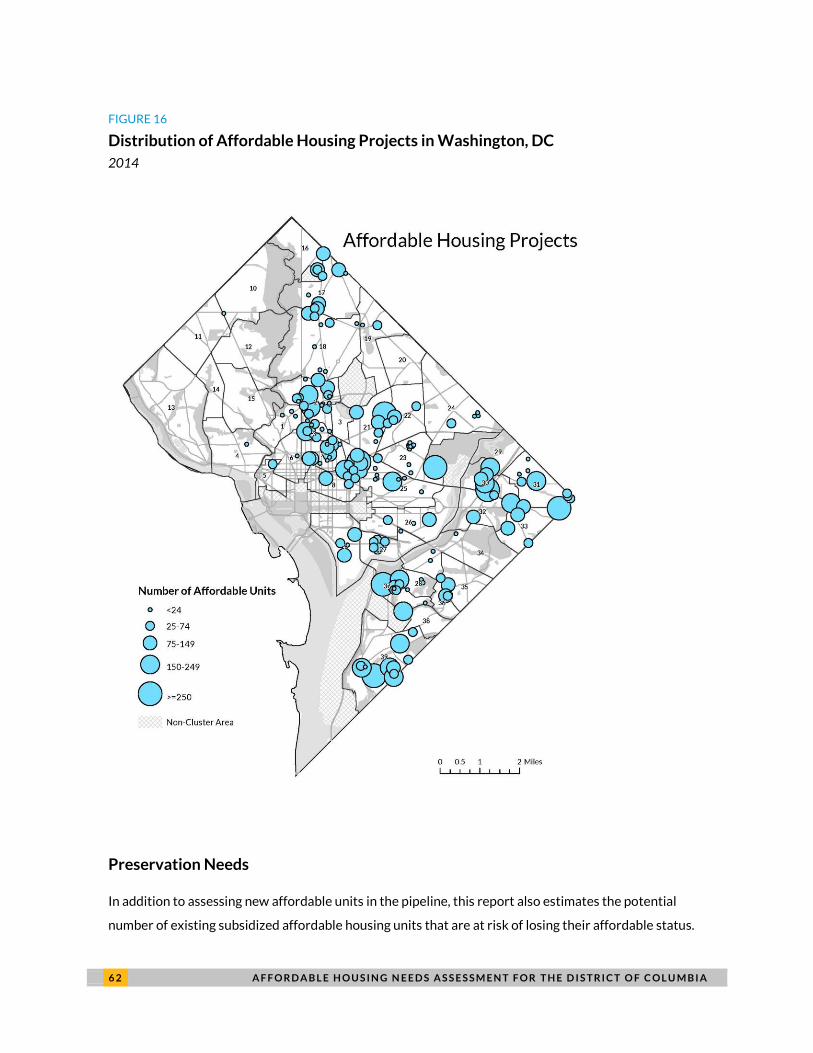
FIGURE 16
Distribution of Affordable Housing Projects in Washington, DC
2014
Preservation Needs
In addition to assessing new affordable units in the pipeline, this report also estimates the potential
number of existing subsidized affordable housing units that are at risk of losing their affordable status.
A F F O R D A B L E H O U S I N G N E E D S A S S E S S M E N T F O R T H E D I S T R I C T O F C O L U M B I A 6 3
The primary data source for this analysis is the DC Preservation Catalog, a compilation of information
from HUD’s public databases on assisted households in DC broken down by assistance type, which is
maintained by NeighborhoodInfo DC.4 This report uses these data to assess the number of properties
and assisted units, both overall and within each ward and neighborhood cluster, which are considered at
risk of losing affordable units, as well as the number of projects and assisted units whose subsidies are
scheduled to expire between 2014 and 2020.
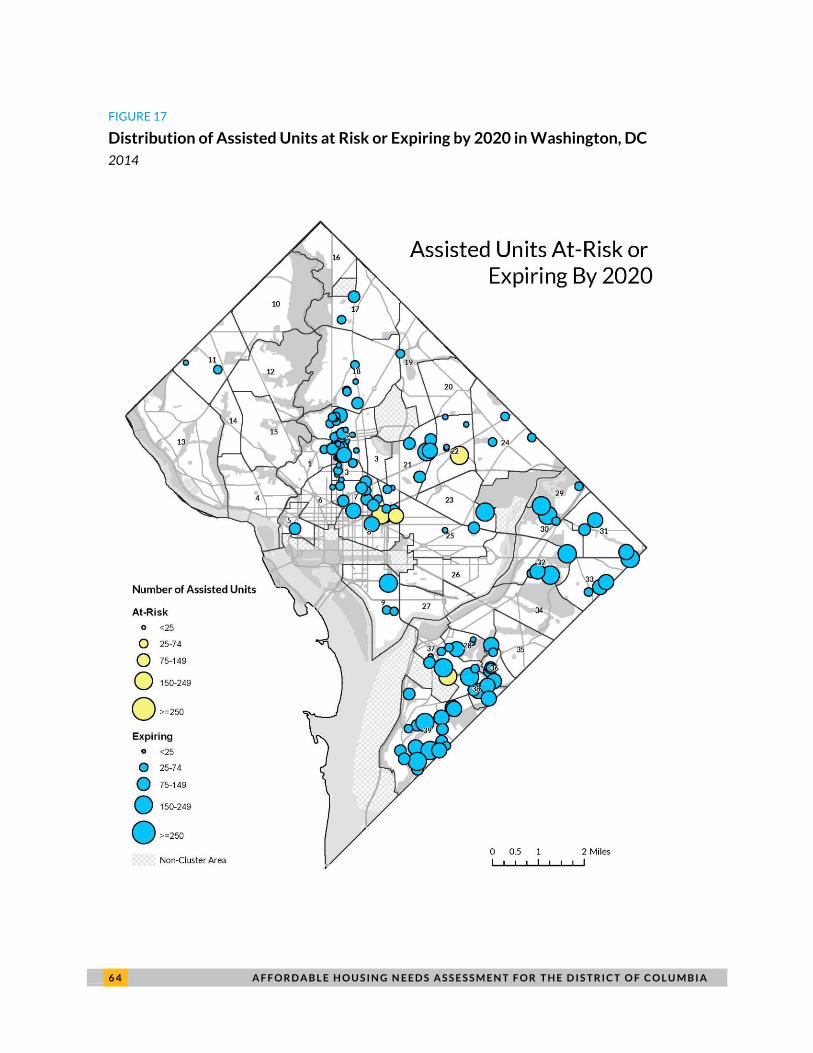
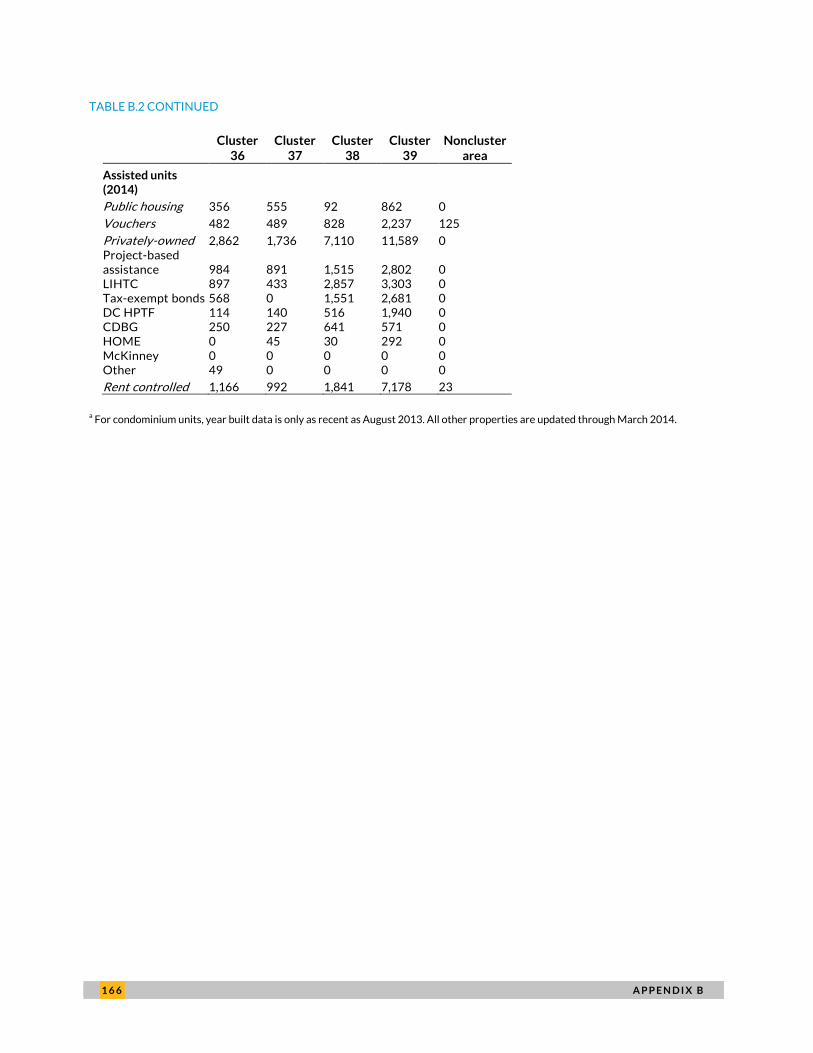
The Preservation Catalog identified 1,246 assisted units throughout the city that are currently at
risk of losing their affordability because of subsidy expiration or conversion to a use other than
affordable housing. Increasing demand in the city for higher-end, expensive housing exacerbates these
risks, particularly in neighborhoods undergoing rapid development. As shown in figure 17, these units
are primarily located in Cluster 8 (Downtown), Cluster 22 (Brookland), and Cluster 38 (Douglass,
Shipley Terrace). In addition, there are 145 projects with 15,226 assisted units whose subsidies are
expiring in or before 2020. Ward 8 has the highest number of assisted units with expiring subsidies
(5,464), followed by Ward 7 (3,244), Ward 5 (1,638), and Ward 6 (1,540). Among neighborhood clusters,
Cluster 39 (Congress Heights) had the highest number of assisted units with expiring subsidies (2,478),
and Cluster 2 (Columbia Heights) had the second highest with 2,071.
An analysis of projects in the Preservation Catalog from 2007 through 2013 found that between
4.2 and 6.4 percent of assisted units were lost through demolition or conversion to condos or market-
rate units during this period. The uncertainty concerning the exact number of projects lost is the result
of several assisted projects whose current status is being negotiated. Using these ranges as a guide to
the potential loss of assisted units between 2014 and 2020, the minimum number of assisted units that
will be lost is 1,714, and the maximum number is 2,586.
This report does not include a separate analysis of affordable market-rate units that are at risk of
becoming unaffordable to low-income households. However, previous analysis by the Urban Institute
has shown a steep decline in the number of rental units affordable to very low and extremely low
income households, particularly for studio and one-bedroom units.5 Market trends, coupled with
projections for an increase in upper-income households, suggest that much of the remaining affordable,
market-rate housing stock could also be at risk. The Affordable Housing Development Funding Needs
and Challenges chapter provides recommendations for how the city can preserve both its assisted and
market-rate affordable housing.
6 4 A F F O R D A B L E H O U S I N G N E E D S A S S E S S M E N T F O R T H E D I S T R I C T O F C O L U M B I A
FIGURE 17
Distribution of Assisted Units at Risk or Expiring by 2020 in Washington, DC
2014
A F F O R D A B L E H O U S I N G N E E D S A S S E S S M E N T F O R T H E D I S T R I C T O F C O L U M B I A 6 5
Projected Housing Needs by Affordability Level
This section of the report pulls together information on present housing needs, demographic
projections, and housing stock projections to anticipate the gap between renters at different income
levels and the number of units affordable to them by 2020. The estimates start with an analysis of the
number of housing units, both rental and owner occupied, affordable to extremely low income, very low
income, and low-income households.6 A unit is affordable at a certain income level if the monthly cost of
the unit is less than or equal to 30 percent of the monthly income of a household at the maximum
income limit for that income category. The HUD income and affordability limits for the Washington
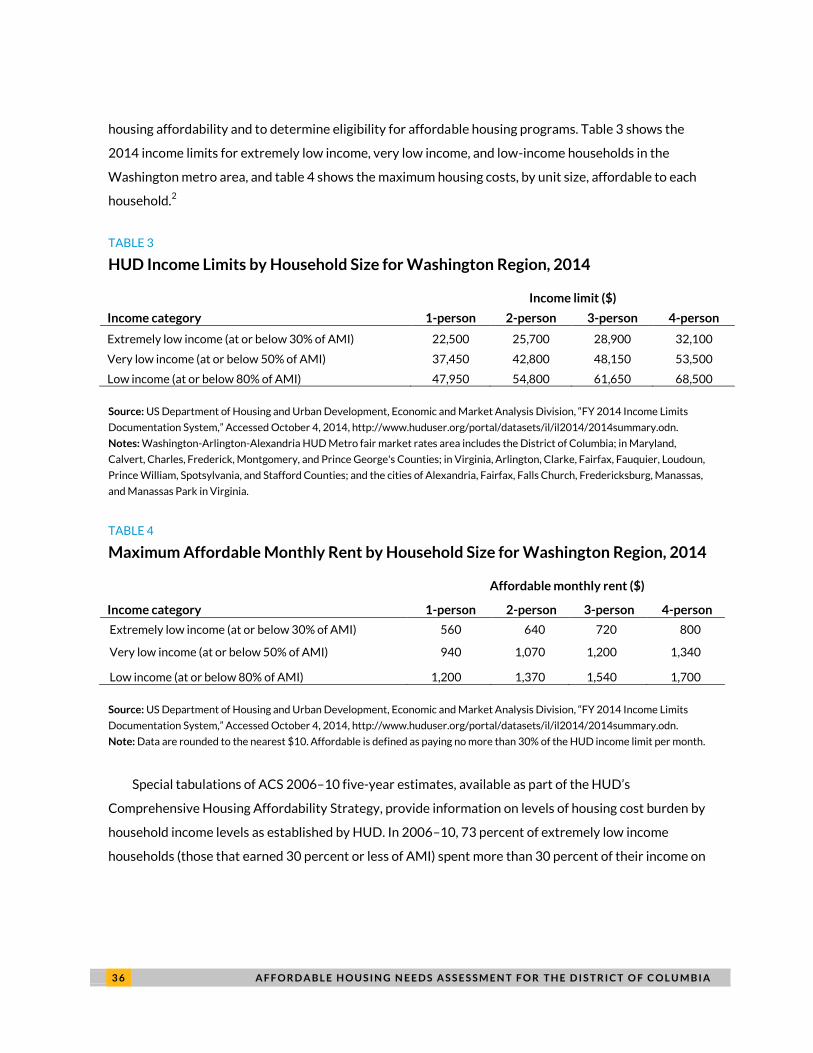
metropolitan area were provided in tables 3–4. An extremely-low income household of four could
afford to pay a monthly rent of up to $800 without being rent-burdened and a low-income household of
four could afford to pay up to $1,700.
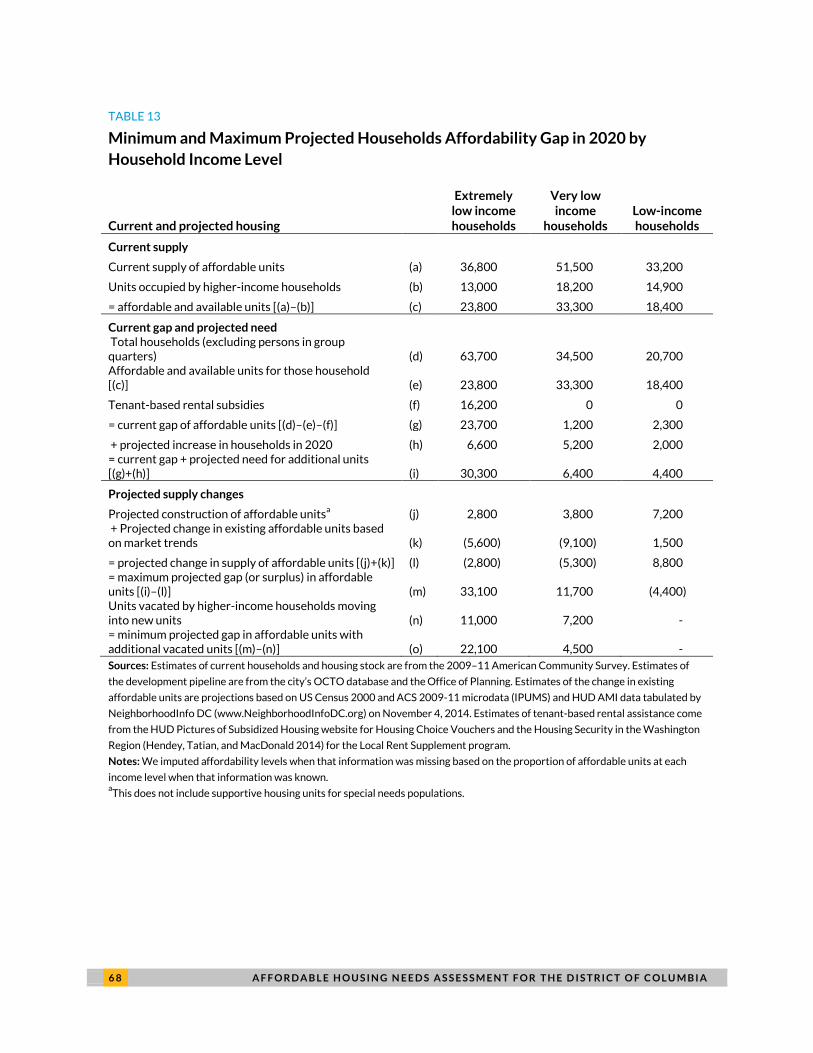
Table 13 presents minimum and maximum projected affordability gaps in 2020 by household
income level. The lowercase letters in parenthesis in following discussion refer to table 13. Based on the
available data, across the city there are roughly 36,800 units affordable to extremely low income
households, 51,500 units for very low income households, and 33,200 units for low-Income households
(a). However, at each affordability level households are in competition with higher-income households
looking for less expensive housing. Therefore, the number of units actually affordable at each income
level is equal to the total affordable stock minus the number of units occupied by higher-income
households (b). The number of affordable and available units by income level (c) is approximately
23,800 for extremely low income households, 33,300 for very low income households, and 18,300 for
low-income households.
The existing gap, or surplus, of available housing units at each income level is equal to the number of
renter and owner households at each income level (d) minus the number of units affordable and
available to these households (e) and the number of tenant-based rental subsidies, which allow low-
income households to afford market-rate units (f).7 For extremely low income households, the gap of
affordable and available housing units (g) is almost 24,000; for very low income households the gap is
1,200 units; and for low-income households it is 2,400.
These figures represent the gaps in affordable housing based on housing supply and demand as of
2009–11. The city’s population is expected to continue to increase across all income levels, which will
widen the gap between the number of households and the number of available and affordable units (h).
By 2020, based on the projections presented earlier in this report, the city will have approximately
6,600 more extremely low income households, 5,200 more very low income households, and 2,000
6 6 A F F O R D A B L E H O U S I N G N E E D S A S S E S S M E N T F O R T H E D I S T R I C T O F C O L U M B I A
more low-income households. Without any changes to the existing housing stock, this would lead to a
projected affordability gap (i) of 30,300 units for extremely low income households, 6,400 units for very
low income households, and 4,400 units for low-income households.
Fortunately, some of this increase in projected housing needs will be met by the pipeline of new
affordable units expected to be completed by 2020 (j). Not including supportive housing for people
experiencing homelessness, which is discussed below, the city is projected to add 2,800 units affordable
to extremely low income households, 3,800 units affordable to very low income households, and 7,200
units affordable to low-income households.8 However, the increase in housing costs jeopardizes the
affordability of much of the existing market-rate housing stock (k). Based on changes to the total stock
of affordable units—rental and for sale, assisted and unassisted—between 2000 and 2011, if present
trends continue 5,500 existing units will cease to be affordable to extremely low income households,
and 9,100 additional existing units will cease to be affordable to very low income renters. The number
of units affordable to low-income renters is expected to increase by 1,500 units.
Combining the number of new units in the pipeline and the projected changes to the existing stock
yields the net change in the supply of available units at each income level (l). Despite the current
planned new construction, this analysis projects a net loss of 2,800 units affordable to extremely low
income households by 2020 and a loss of 5,300 units affordable to very low income households. For low
income households, the analysis projects a net increase of 8,700 affordable units. The maximum
projected gap in affordable units by income-level (m) is the projected need (i) subtracting the net change
in affordable units (l).
However, there is some uncertainty in this projection based on the anticipated effect of additional
higher-income units on the availability of affordable units for lower-income renters. As noted earlier,
many lower-cost housing units are occupied by higher-income households. If these households move
into new units in the city’s pipeline, it will create vacancies in existing units. This could increase the
availability of affordable units if higher-income households vacate units affordable at lower-income
levels. To address this uncertainty, these estimates provide a minimum and maximum expected
affordability gap. The maximum gap (m) assumes no additional units will become affordable through
vacancies produced by higher-income movers. The minimum gap (o) assumes that every household
moving into one of the new units in the pipeline will vacate a unit affordable at a lower-income level (n),
which would create up to 11,000 additional affordable units for extremely low income households and
up to 7,200 additional affordable units for very low income households. Our analysis does not include
projections of the net change in units affordable to moderate- or high-income households, so we cannot
A F F O R D A B L E H O U S I N G N E E D S A S S E S S M E N T F O R T H E D I S T R I C T O F C O L U M B I A 6 7
project how many low-income units might become available through higher-income households
vacating these units.
In conclusion, the lower range of additional affordable units needed for extremely low income
households by 2020 is approximately 22,100, and the upper range is approximately 33,100. The lower
range of units needed for very low income households is approximately 4,500, and the upper range is
11,700. For low-income households, we project a surplus of at least 4,300 affordable units.
These estimates of the need for additional units are beyond the number of units already projected
to be added to the District of Columbia’s housing stock based on projects tracked in the city’s pipeline
database. The estimates do not include the need for additional supportive housing units, which combine
permanent housing and wraparound supports, for people with disabilities who are experiencing
homelessness. A 2013 report from the DC Interagency Council on Homelessness estimated a need for
an additional 2,679 supportive housing units for this population (Permanent Supportive Housing
Committee 2013).
6 8 A F F O R D A B L E H O U S I N G N E E D S A S S E S S M E N T F O R T H E D I S T R I C T O F C O L U M B I A
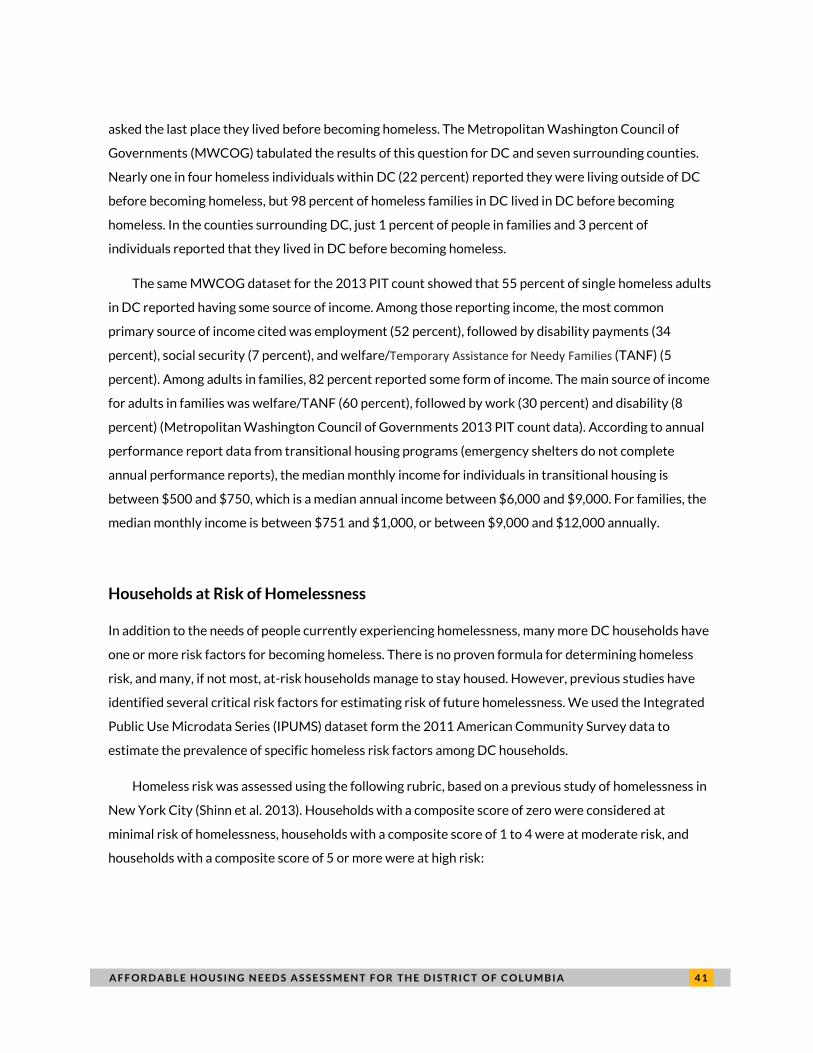
TABLE 13
Minimum and Maximum Projected Households Affordability Gap in 2020 by
Household Income Level
Current and projected housing
Extremely low income households
Very low income
households Low-income households
Current supply
Current supply of affordable units (a) 36,800 51,500 33,200
Units occupied by higher-income households (b) 13,000 18,200 14,900
= affordable and available units [(a)–(b)] (c) 23,800 33,300 18,400
Current gap and projected need
Total households (excluding persons in group quarters) (d) 63,700 34,500 20,700 Affordable and available units for those household [(c)] (e) 23,800 33,300 18,400
Tenant-based rental subsidies (f) 16,200 0 0
= current gap of affordable units [(d)–(e)–(f)] (g) 23,700 1,200 2,300
+ projected increase in households in 2020 (h) 6,600 5,200 2,000 = current gap + projected need for additional units [(g)+(h)] (i) 30,300 6,400 4,400
Projected supply changes
Projected construction of affordable unitsa (j) 2,800 3,800 7,200
+ Projected change in existing affordable units based on market trends (k) (5,600) (9,100) 1,500
= projected change in supply of affordable units [(j)+(k)] (l) (2,800) (5,300) 8,800 = maximum projected gap (or surplus) in affordable units [(i)–(l)] (m) 33,100 11,700 (4,400) Units vacated by higher-income households moving into new units (n) 11,000 7,200 - = minimum projected gap in affordable units with additional vacated units [(m)–(n)] (o) 22,100 4,500 -
Sources: Estimates of current households and housing stock are from the 2009–11 American Community Survey. Estimates of
the development pipeline are from the city’s OCTO database and the Office of Planning. Estimates of the change in existing
affordable units are projections based on US Census 2000 and ACS 2009-11 microdata (IPUMS) and HUD AMI data tabulated by
NeighborhoodInfo DC (www.NeighborhoodInfoDC.org) on November 4, 2014. Estimates of tenant-based rental assistance come
from the HUD Pictures of Subsidized Housing website for Housing Choice Vouchers and the Housing Security in the Washington
Region (Hendey, Tatian, and MacDonald 2014) for the Local Rent Supplement program.
Notes: We imputed affordability levels when that information was missing based on the proportion of affordable units at each
income level when that information was known. aThis does not include supportive housing units for special needs populations.
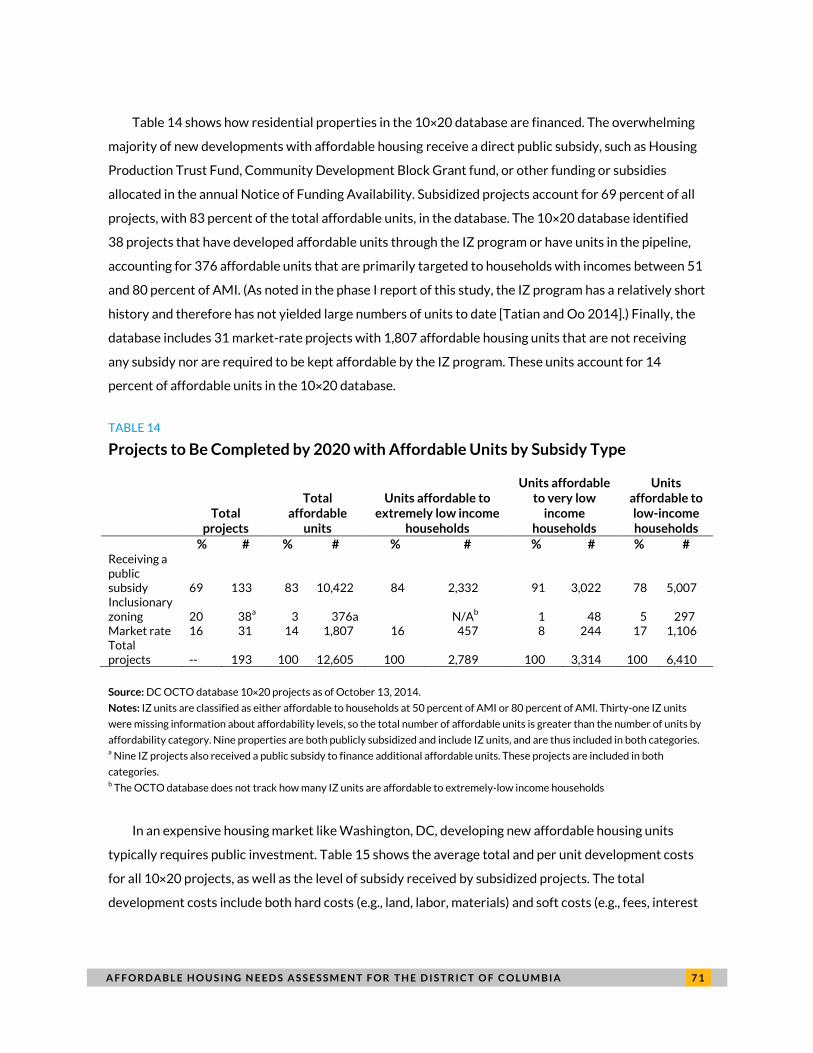
Source: DC OCTO database 10×20 projects as of October 13, 2014.
Notes: IZ units are classified as either affordable to households at 50 percent of AMI or 80 percent of AMI. Thirty-one IZ units
were missing information about affordability levels, so the total number of affordable units is greater than the number of units by
affordability category. Nine properties are both publicly subsidized and include IZ units, and are thus included in both categories. a Nine IZ projects also received a public subsidy to finance additional affordable units. These projects are included in both
categories. b The OCTO database does not track how many IZ units are affordable to extremely-low income households
In an expensive housing market like Washington, DC, developing new affordable housing units
typically requires public investment. Table 15 shows the average total and per unit development costs
for all 10×20 projects, as well as the level of subsidy received by subsidized projects. The total
development costs include both hard costs (e.g., land, labor, materials) and soft costs (e.g., fees, interest
7 2 A F F O R D A B L E H O U S I N G N E E D S A S S E S S M E N T F O R T H E D I S T R I C T O F C O L U M B I A
payments, taxes, marketing), but not ongoing operating costs. The total development costs are
estimated for projects that are still under development.
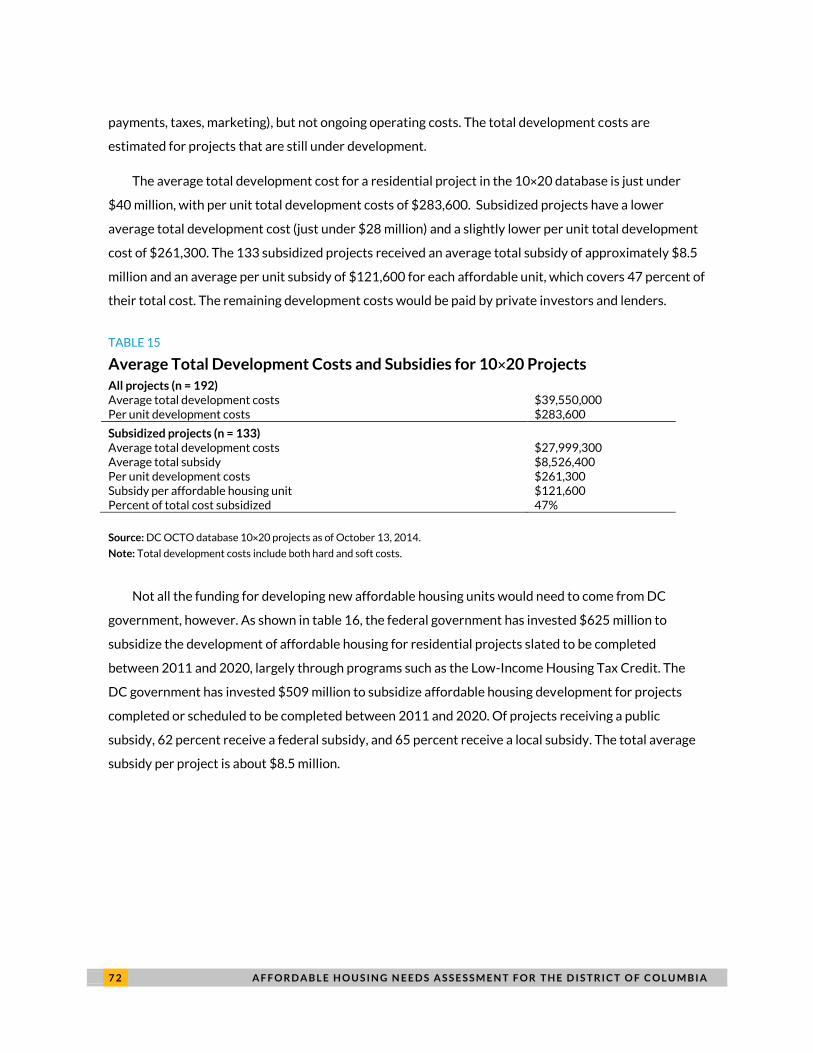
The average total development cost for a residential project in the 10×20 database is just under
$40 million, with per unit total development costs of $283,600. Subsidized projects have a lower
average total development cost (just under $28 million) and a slightly lower per unit total development
cost of $261,300. The 133 subsidized projects received an average total subsidy of approximately $8.5
million and an average per unit subsidy of $121,600 for each affordable unit, which covers 47 percent of
their total cost. The remaining development costs would be paid by private investors and lenders.
TABLE 15
Average Total Development Costs and Subsidies for 10×20 Projects
All projects (n = 192) Average total development costs $39,550,000 Per unit development costs $283,600
Subsidized projects (n = 133) Average total development costs $27,999,300 Average total subsidy $8,526,400 Per unit development costs $261,300 Subsidy per affordable housing unit $121,600 Percent of total cost subsidized 47%
Source: DC OCTO database 10×20 projects as of October 13, 2014.
Note: Total development costs include both hard and soft costs.
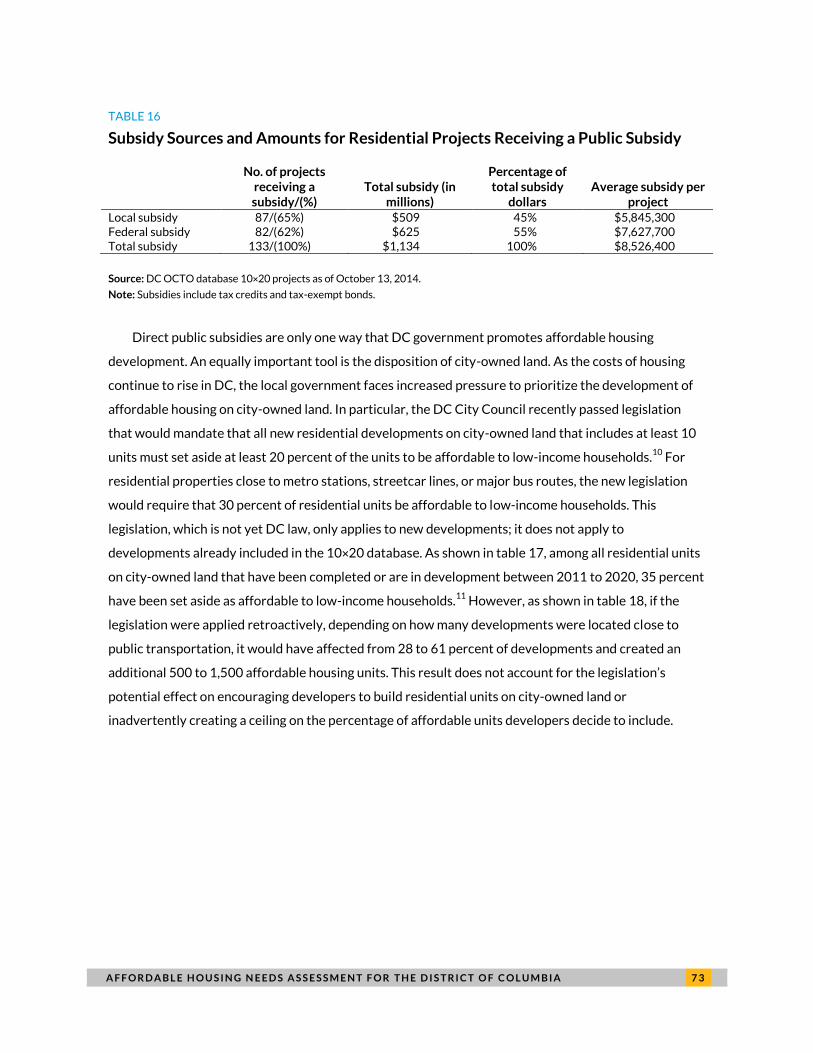
Not all the funding for developing new affordable housing units would need to come from DC
government, however. As shown in table 16, the federal government has invested $625 million to
subsidize the development of affordable housing for residential projects slated to be completed
between 2011 and 2020, largely through programs such as the Low-Income Housing Tax Credit. The
DC government has invested $509 million to subsidize affordable housing development for projects
completed or scheduled to be completed between 2011 and 2020. Of projects receiving a public
subsidy, 62 percent receive a federal subsidy, and 65 percent receive a local subsidy. The total average
subsidy per project is about $8.5 million.
A F F O R D A B L E H O U S I N G N E E D S A S S E S S M E N T F O R T H E D I S T R I C T O F C O L U M B I A 7 3
TABLE 16
Subsidy Sources and Amounts for Residential Projects Receiving a Public Subsidy
No. of projects receiving a subsidy/(%)
Total subsidy (in millions)
Percentage of total subsidy
dollars Average subsidy per
project Local subsidy 87/(65%) $509 45% $5,845,300 Federal subsidy 82/(62%) $625 55% $7,627,700 Total subsidy 133/(100%) $1,134 100% $8,526,400
Source: DC OCTO database 10×20 projects as of October 13, 2014.
Note: Subsidies include tax credits and tax-exempt bonds.
Direct public subsidies are only one way that DC government promotes affordable housing
development. An equally important tool is the disposition of city-owned land. As the costs of housing
continue to rise in DC, the local government faces increased pressure to prioritize the development of
affordable housing on city-owned land. In particular, the DC City Council recently passed legislation
that would mandate that all new residential developments on city-owned land that includes at least 10
units must set aside at least 20 percent of the units to be affordable to low-income households.10
For
residential properties close to metro stations, streetcar lines, or major bus routes, the new legislation
would require that 30 percent of residential units be affordable to low-income households. This
legislation, which is not yet DC law, only applies to new developments; it does not apply to
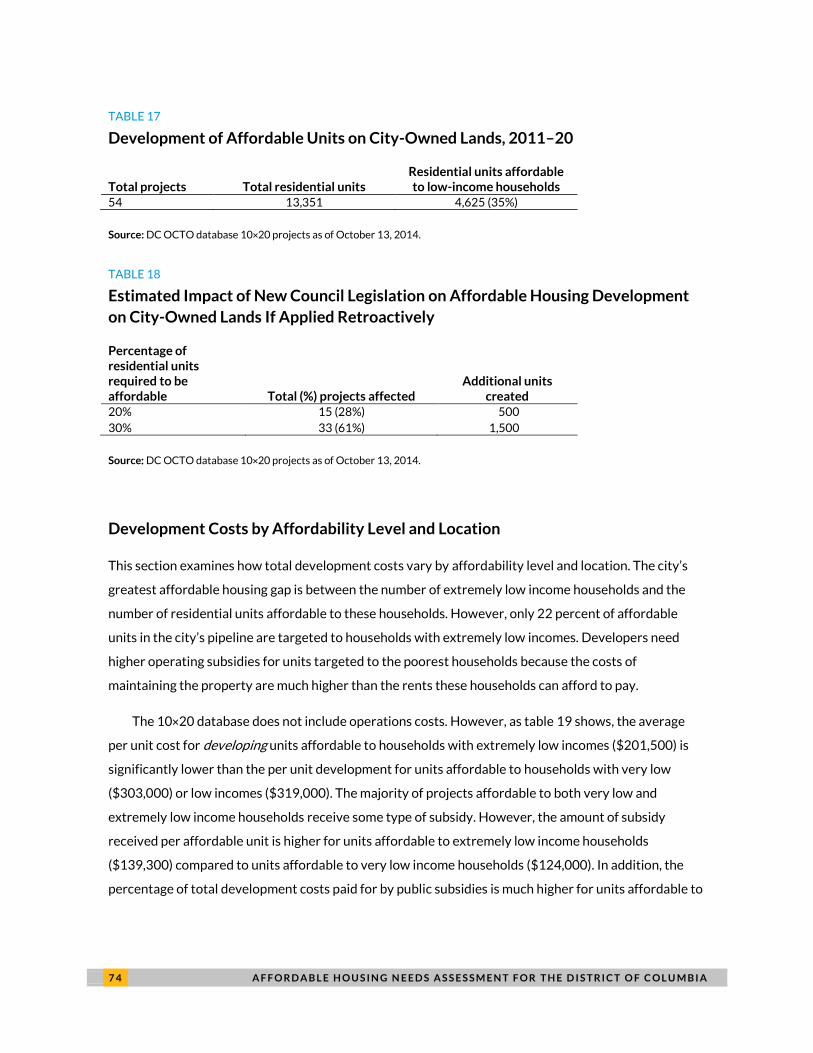
developments already included in the 10×20 database. As shown in table 17, among all residential units
on city-owned land that have been completed or are in development between 2011 to 2020, 35 percent
have been set aside as affordable to low-income households.11
However, as shown in table 18, if the
legislation were applied retroactively, depending on how many developments were located close to
public transportation, it would have affected from 28 to 61 percent of developments and created an
additional 500 to 1,500 affordable housing units. This result does not account for the legislation’s
potential effect on encouraging developers to build residential units on city-owned land or
inadvertently creating a ceiling on the percentage of affordable units developers decide to include.
7 4 A F F O R D A B L E H O U S I N G N E E D S A S S E S S M E N T F O R T H E D I S T R I C T O F C O L U M B I A
TABLE 17
Development of Affordable Units on City-Owned Lands, 2011–20
Total projects Total residential units Residential units affordable to low-income households
54 13,351 4,625 (35%)
Source: DC OCTO database 10×20 projects as of October 13, 2014.
TABLE 18
Estimated Impact of New Council Legislation on Affordable Housing Development
on City-Owned Lands If Applied Retroactively
Percentage of residential units required to be affordable Total (%) projects affected
Additional units created
20% 15 (28%) 500
30% 33 (61%) 1,500
Source: DC OCTO database 10×20 projects as of October 13, 2014.
Development Costs by Affordability Level and Location
This section examines how total development costs vary by affordability level and location. The city’s
greatest affordable housing gap is between the number of extremely low income households and the
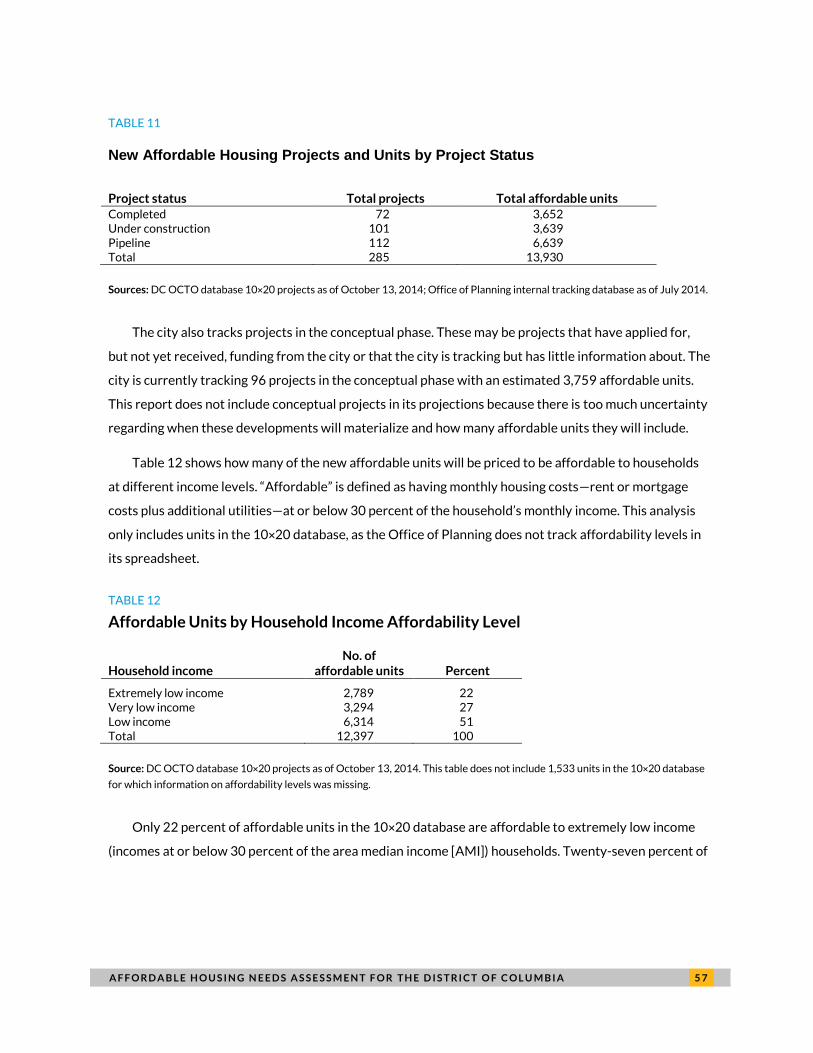
number of residential units affordable to these households. However, only 22 percent of affordable
units in the city’s pipeline are targeted to households with extremely low incomes. Developers need
higher operating subsidies for units targeted to the poorest households because the costs of
maintaining the property are much higher than the rents these households can afford to pay.
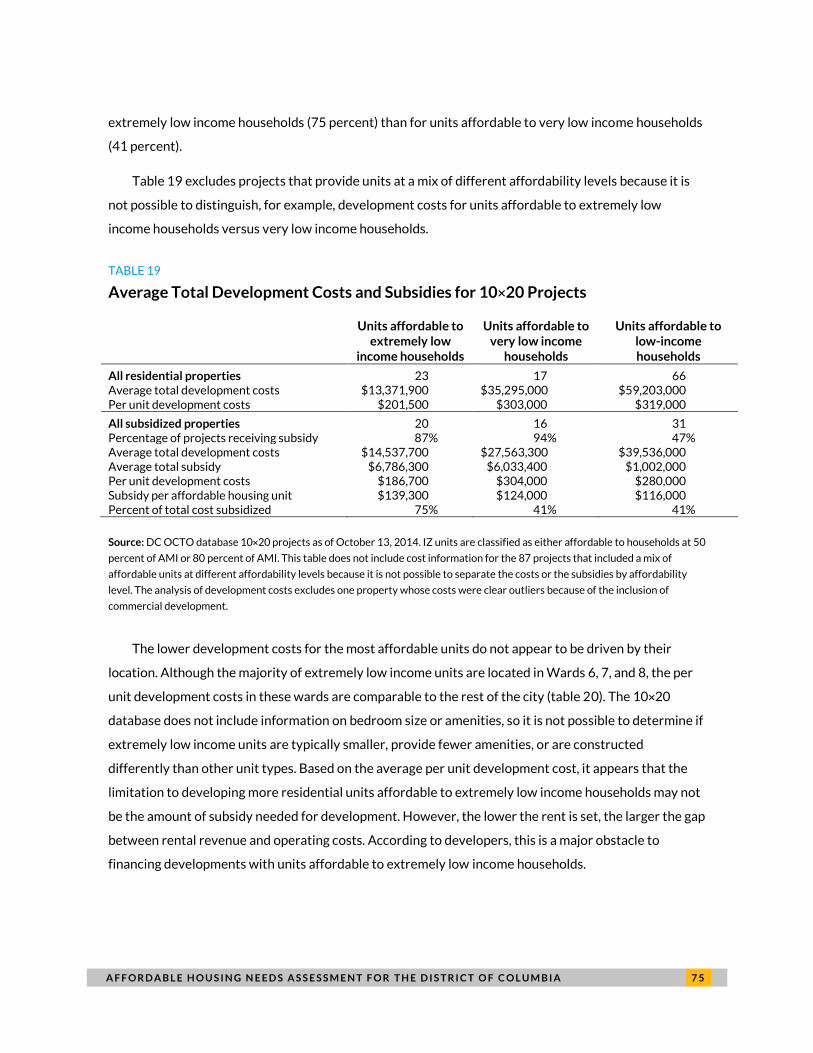
The 10×20 database does not include operations costs. However, as table 19 shows, the average
per unit cost for developing units affordable to households with extremely low incomes ($201,500) is
significantly lower than the per unit development for units affordable to households with very low
($303,000) or low incomes ($319,000). The majority of projects affordable to both very low and
extremely low income households receive some type of subsidy. However, the amount of subsidy
received per affordable unit is higher for units affordable to extremely low income households
($139,300) compared to units affordable to very low income households ($124,000). In addition, the
percentage of total development costs paid for by public subsidies is much higher for units affordable to
A F F O R D A B L E H O U S I N G N E E D S A S S E S S M E N T F O R T H E D I S T R I C T O F C O L U M B I A 7 5
extremely low income households (75 percent) than for units affordable to very low income households
(41 percent).
Table 19 excludes projects that provide units at a mix of different affordability levels because it is
not possible to distinguish, for example, development costs for units affordable to extremely low
income households versus very low income households.
TABLE 19
Average Total Development Costs and Subsidies for 10×20 Projects
Units affordable to extremely low
income households
Units affordable to very low income
households
Units affordable to low-income households
All residential properties 23 17 66 Average total development costs $13,371,900 $35,295,000 $59,203,000 Per unit development costs $201,500 $303,000 $319,000
All subsidized properties 20 16 31 Percentage of projects receiving subsidy 87% 94% 47% Average total development costs $14,537,700 $27,563,300 $39,536,000 Average total subsidy $6,786,300 $6,033,400 $1,002,000 Per unit development costs $186,700 $304,000 $280,000 Subsidy per affordable housing unit $139,300 $124,000 $116,000 Percent of total cost subsidized 75% 41% 41%
Source: DC OCTO database 10×20 projects as of October 13, 2014. IZ units are classified as either affordable to households at 50
percent of AMI or 80 percent of AMI. This table does not include cost information for the 87 projects that included a mix of
affordable units at different affordability levels because it is not possible to separate the costs or the subsidies by affordability
level. The analysis of development costs excludes one property whose costs were clear outliers because of the inclusion of
commercial development.
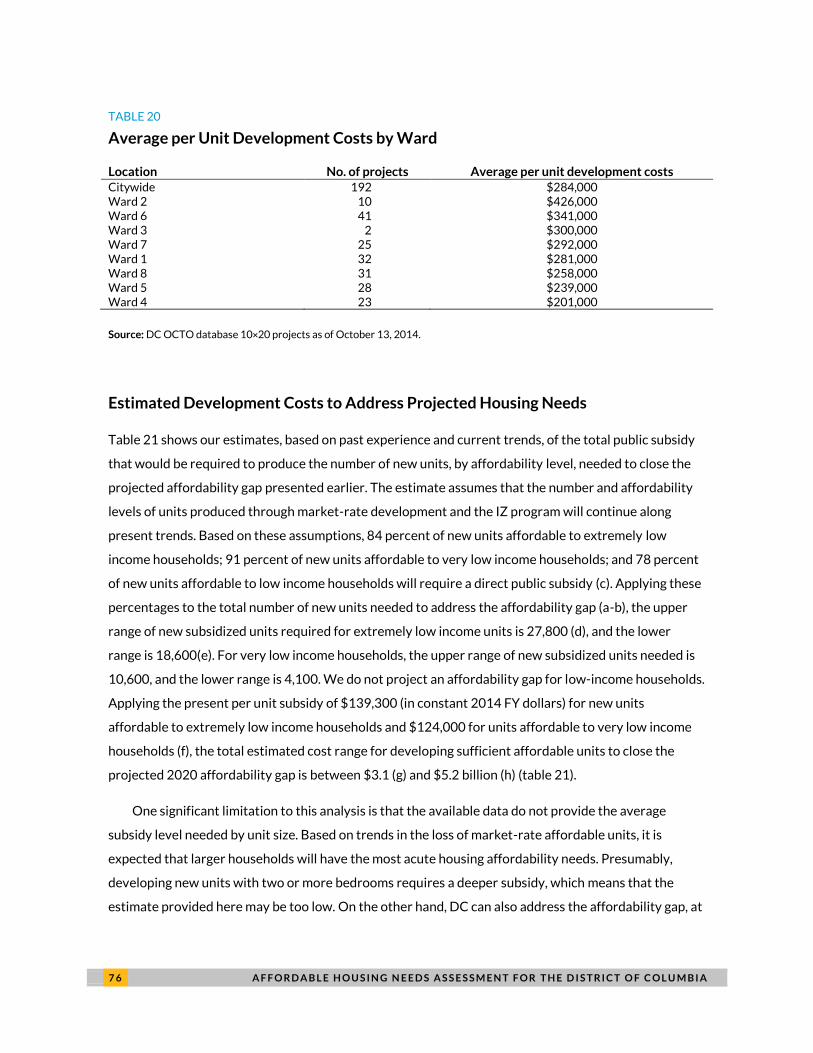
The lower development costs for the most affordable units do not appear to be driven by their
location. Although the majority of extremely low income units are located in Wards 6, 7, and 8, the per
unit development costs in these wards are comparable to the rest of the city (table 20). The 10×20
database does not include information on bedroom size or amenities, so it is not possible to determine if
extremely low income units are typically smaller, provide fewer amenities, or are constructed
differently than other unit types. Based on the average per unit development cost, it appears that the
limitation to developing more residential units affordable to extremely low income households may not
be the amount of subsidy needed for development. However, the lower the rent is set, the larger the gap
between rental revenue and operating costs. According to developers, this is a major obstacle to
financing developments with units affordable to extremely low income households.
7 6 A F F O R D A B L E H O U S I N G N E E D S A S S E S S M E N T F O R T H E D I S T R I C T O F C O L U M B I A
TABLE 20
Average per Unit Development Costs by Ward
Location No. of projects Average per unit development costs Citywide 192 $284,000 Ward 2 10 $426,000 Ward 6 41 $341,000 Ward 3 2 $300,000 Ward 7 25 $292,000 Ward 1 32 $281,000 Ward 8 31 $258,000 Ward 5 28 $239,000 Ward 4 23 $201,000
Source: DC OCTO database 10×20 projects as of October 13, 2014.
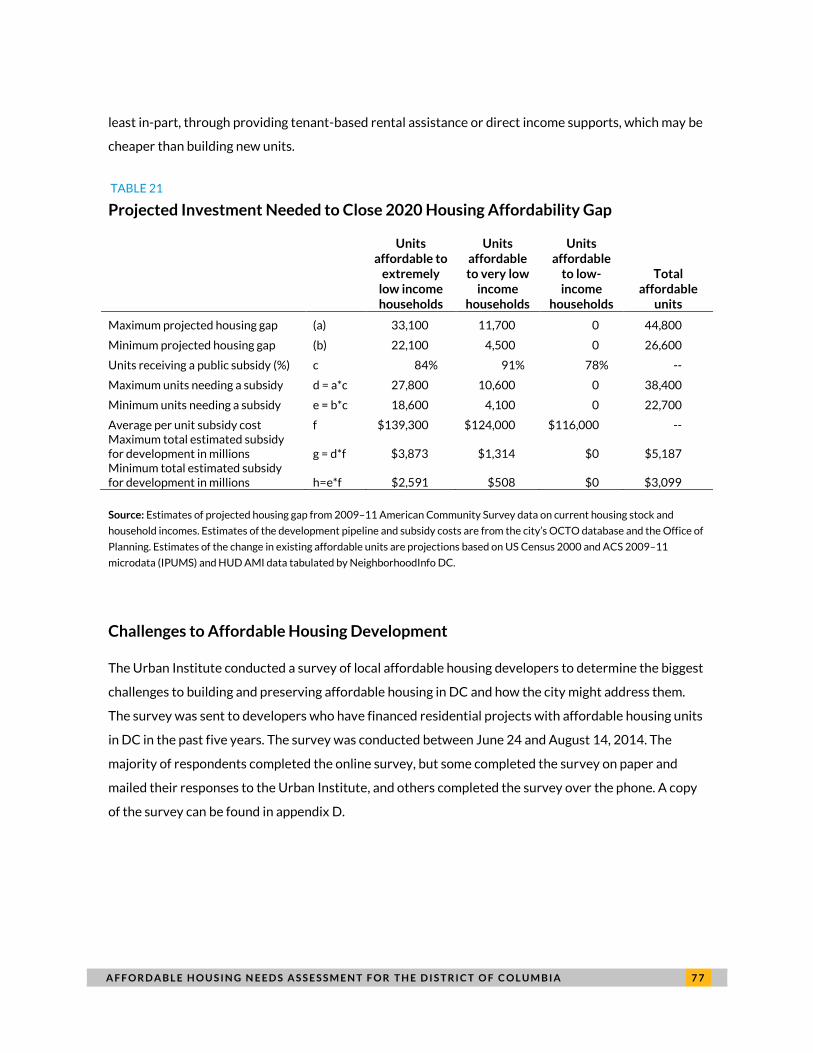
Estimated Development Costs to Address Projected Housing Needs
Table 21 shows our estimates, based on past experience and current trends, of the total public subsidy
that would be required to produce the number of new units, by affordability level, needed to close the
projected affordability gap presented earlier. The estimate assumes that the number and affordability
levels of units produced through market-rate development and the IZ program will continue along
present trends. Based on these assumptions, 84 percent of new units affordable to extremely low
income households; 91 percent of new units affordable to very low income households; and 78 percent
of new units affordable to low income households will require a direct public subsidy (c). Applying these
percentages to the total number of new units needed to address the affordability gap (a-b), the upper
range of new subsidized units required for extremely low income units is 27,800 (d), and the lower
range is 18,600(e). For very low income households, the upper range of new subsidized units needed is
10,600, and the lower range is 4,100. We do not project an affordability gap for low-income households.
Applying the present per unit subsidy of $139,300 (in constant 2014 FY dollars) for new units
affordable to extremely low income households and $124,000 for units affordable to very low income
households (f), the total estimated cost range for developing sufficient affordable units to close the
projected 2020 affordability gap is between $3.1 (g) and $5.2 billion (h) (table 21).
One significant limitation to this analysis is that the available data do not provide the average
subsidy level needed by unit size. Based on trends in the loss of market-rate affordable units, it is
expected that larger households will have the most acute housing affordability needs. Presumably,
developing new units with two or more bedrooms requires a deeper subsidy, which means that the
estimate provided here may be too low. On the other hand, DC can also address the affordability gap, at
A F F O R D A B L E H O U S I N G N E E D S A S S E S S M E N T F O R T H E D I S T R I C T O F C O L U M B I A 7 7
least in-part, through providing tenant-based rental assistance or direct income supports, which may be
cheaper than building new units.
TABLE 21
Projected Investment Needed to Close 2020 Housing Affordability Gap
Units affordable to
extremely low income households
Units affordable to very low
income households
Units affordable
to low-income
households
Total affordable
units
Maximum projected housing gap (a) 33,100 11,700 0 44,800
Minimum projected housing gap (b) 22,100 4,500 0 26,600
Units receiving a public subsidy (%) c 84% 91% 78% --
Maximum units needing a subsidy d = a*c 27,800 10,600 0 38,400
Minimum units needing a subsidy e = b*c 18,600 4,100 0 22,700
Average per unit subsidy cost f $139,300 $124,000 $116,000 -- Maximum total estimated subsidy for development in millions g = d*f $3,873 $1,314 $0 $5,187 Minimum total estimated subsidy for development in millions h=e*f $2,591 $508 $0 $3,099
Source: Estimates of projected housing gap from 2009–11 American Community Survey data on current housing stock and
household incomes. Estimates of the development pipeline and subsidy costs are from the city’s OCTO database and the Office of
Planning. Estimates of the change in existing affordable units are projections based on US Census 2000 and ACS 2009–11
microdata (IPUMS) and HUD AMI data tabulated by NeighborhoodInfo DC.
Challenges to Affordable Housing Development
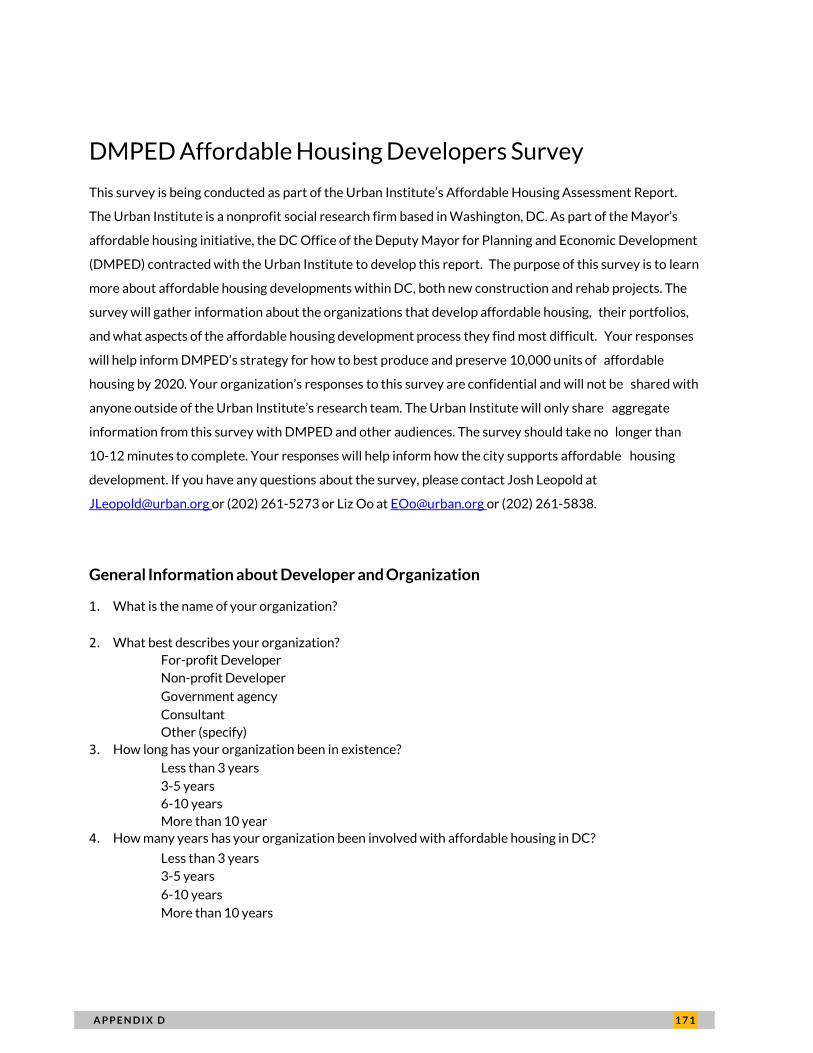
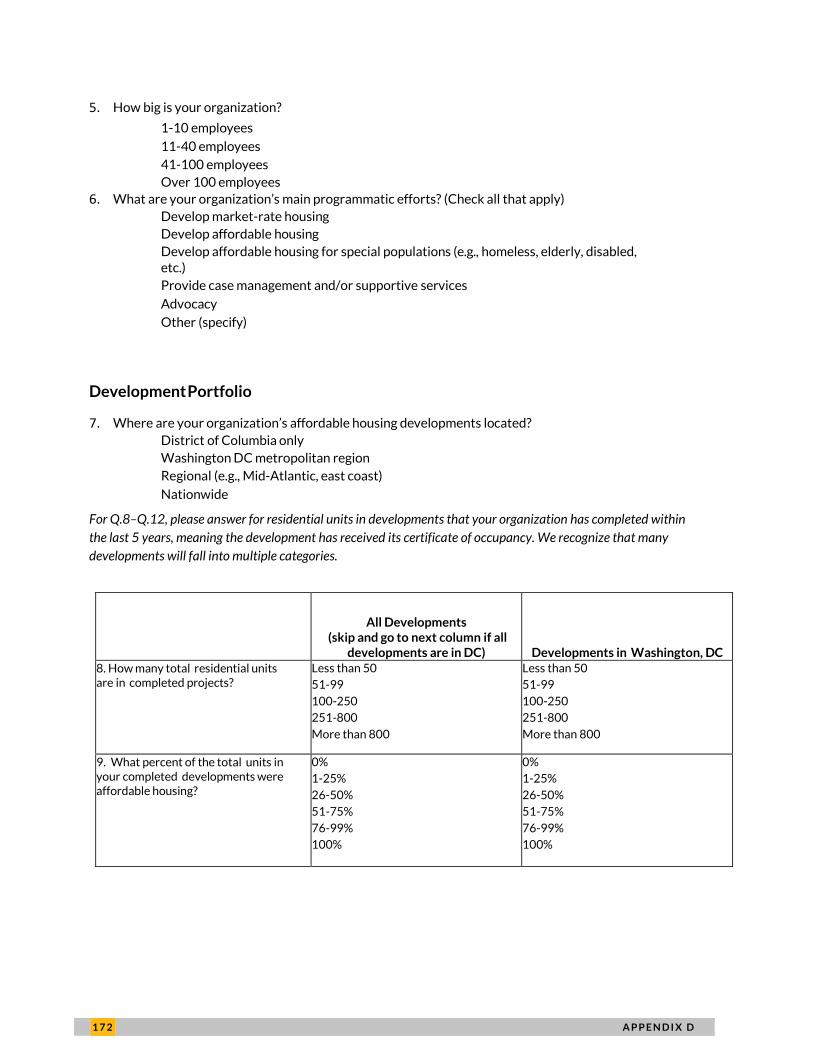
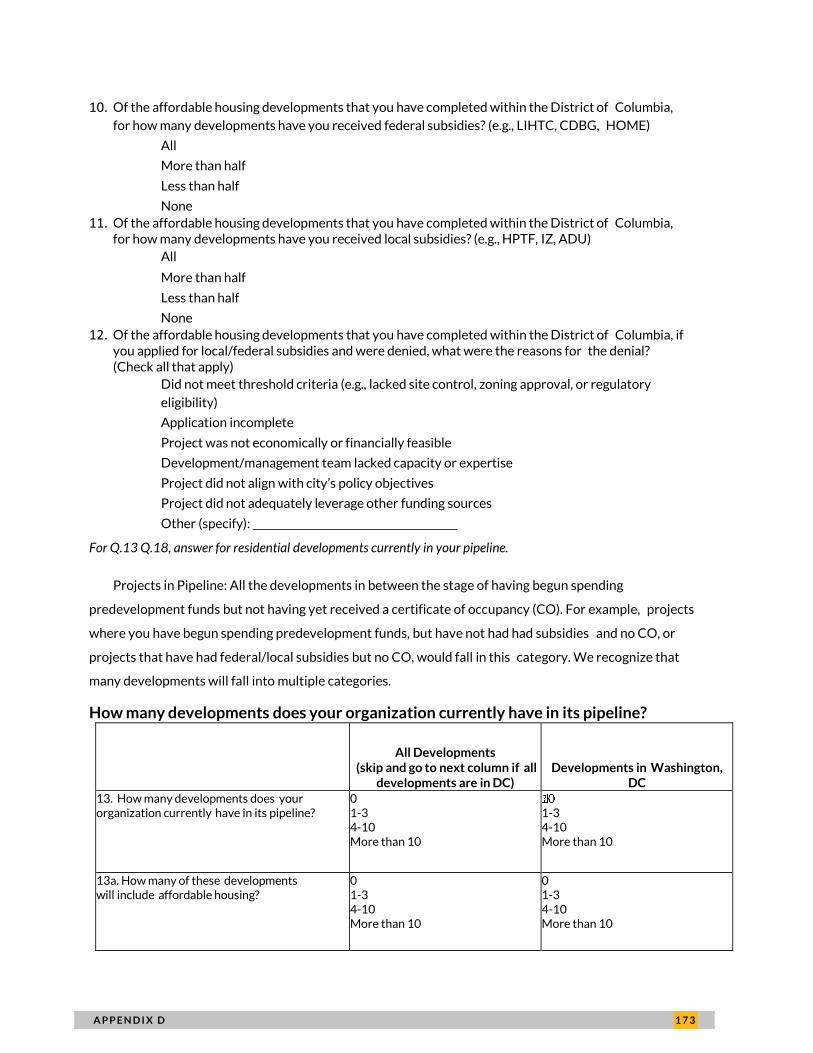
The Urban Institute conducted a survey of local affordable housing developers to determine the biggest
challenges to building and preserving affordable housing in DC and how the city might address them.
The survey was sent to developers who have financed residential projects with affordable housing units
in DC in the past five years. The survey was conducted between June 24 and August 14, 2014. The
majority of respondents completed the online survey, but some completed the survey on paper and
mailed their responses to the Urban Institute, and others completed the survey over the phone. A copy
of the survey can be found in appendix D.
7 8 A F F O R D A B L E H O U S I N G N E E D S A S S E S S M E N T F O R T H E D I S T R I C T O F C O L U M B I A
SURVEY METHODOLOGY
2014 DC Affordable Housing Developer Survey
The Urban Institute used several sources to identify developers to complete the survey. The survey
invitation was sent to organizations listed as sponsors of affordable housing projects in the DC
Department of Housing and Community Development (DHCD) Development Finance Division (DFD)
pipeline. The DHCD DFD database contains a list of all private developers that have submitted loan
requests through the Notice of Funding Availability (NOFA); tenant associations seeking loans to
purchase rental properties through the Tenant Opportunity to Purchase Act (TOPA); and funding
requests from DC sister agencies such as the Housing Authority. The database includes all projects that
have received or are in the pipeline for financing from DHCD DFD beginning October 1, 2010 (or FY
2011). Many of the developers in this database have worked with and received financing and other
conditional commitments (i.e., land) from other DC agencies. The survey was also sent to large
developers of market-rate rental properties that had developed affordable units through the IZ
program as well as members of the Housing Production Trust Fund boarda and affordable housing
developer members of the Coalition for Non-Profit Housing and Economic Development.
The survey universe represents a significant portion of all developers building and preserving
affordable housing in DC; according to experts in DC agencies, most developments in DC with
affordable housing units would have received some form of public funding as gap financing or a subsidy.
These developers would be listed in the DHCD DFD pipeline.
a Members of the Housing Production Trust Fund board were provided the survey on June 26, 2014 and developers that are
members of the Coalition for Nonprofit Housing and Economic Development were provided the survey on July 24, 2014.
After the survey, Urban Institute conducted follow-up interviews with representatives of six
organizations to get more in-depth insight about the development challenges they identified in the
survey. A copy of the interview questions can be found in appendix E. Respondents were purposively
selected to ensure diversity by organizational type and size; length of time developing in DC; mission;
and geographic experience. The respondents interviewed represented two for-profit development
companies; two nonprofit development organizations; one consulting firm; and one agency that
performed policy analysis, advocacy, and financial consulting, as well as affordable housing
development.
A F F O R D A B L E H O U S I N G N E E D S A S S E S S M E N T F O R T H E D I S T R I C T O F C O L U M B I A 7 9
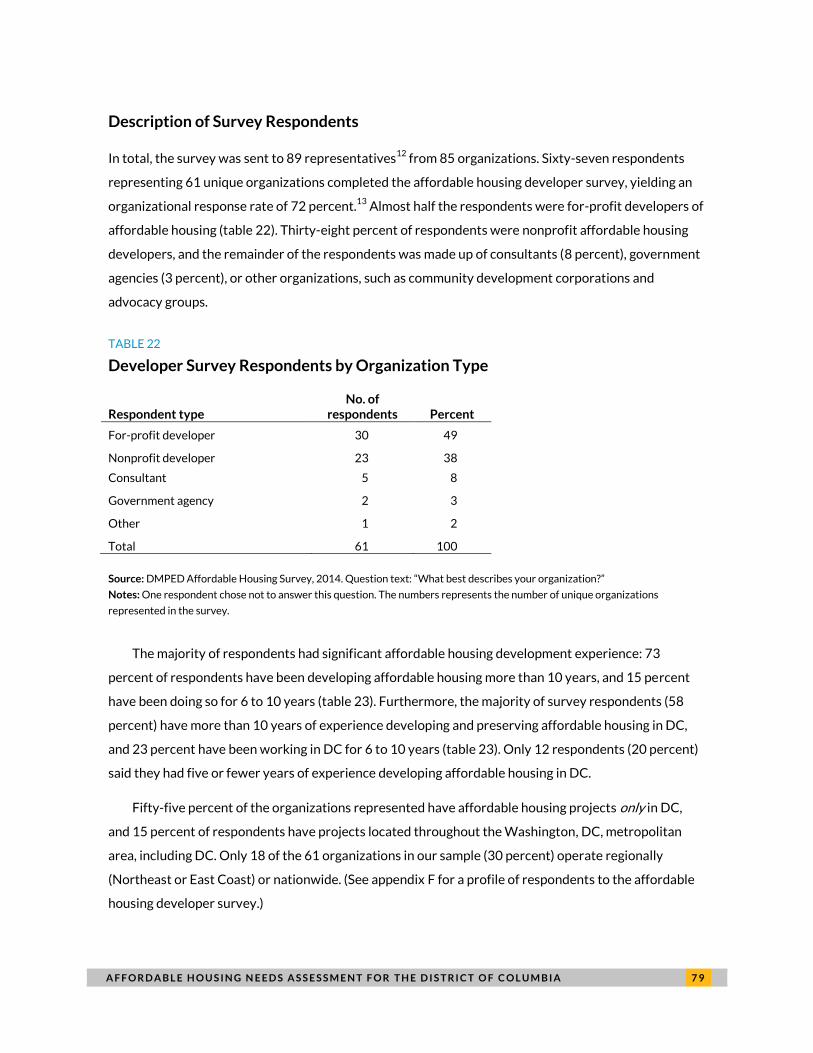
Description of Survey Respondents
In total, the survey was sent to 89 representatives12
from 85 organizations. Sixty-seven respondents
representing 61 unique organizations completed the affordable housing developer survey, yielding an
organizational response rate of 72 percent.13
Almost half the respondents were for-profit developers of
affordable housing (table 22). Thirty-eight percent of respondents were nonprofit affordable housing
developers, and the remainder of the respondents was made up of consultants (8 percent), government
agencies (3 percent), or other organizations, such as community development corporations and
advocacy groups.
TABLE 22
Developer Survey Respondents by Organization Type
Respondent type No. of
respondents Percent
For-profit developer 30 49
Nonprofit developer 23 38
Consultant 5 8
Government agency 2 3
Other 1 2
Total 61 100
Source: DMPED Affordable Housing Survey, 2014. Question text: “What best describes your organization?”
Notes: One respondent chose not to answer this question. The numbers represents the number of unique organizations
represented in the survey.
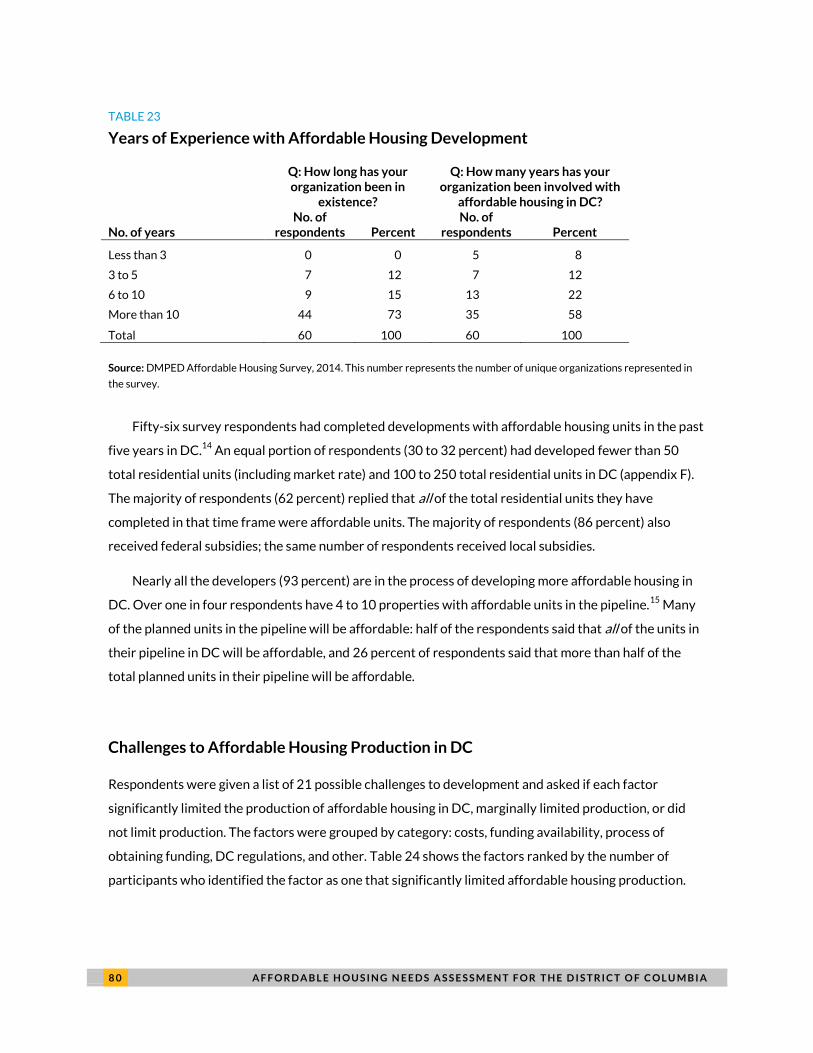
The majority of respondents had significant affordable housing development experience: 73
percent of respondents have been developing affordable housing more than 10 years, and 15 percent
have been doing so for 6 to 10 years (table 23). Furthermore, the majority of survey respondents (58
percent) have more than 10 years of experience developing and preserving affordable housing in DC,
and 23 percent have been working in DC for 6 to 10 years (table 23). Only 12 respondents (20 percent)
said they had five or fewer years of experience developing affordable housing in DC.
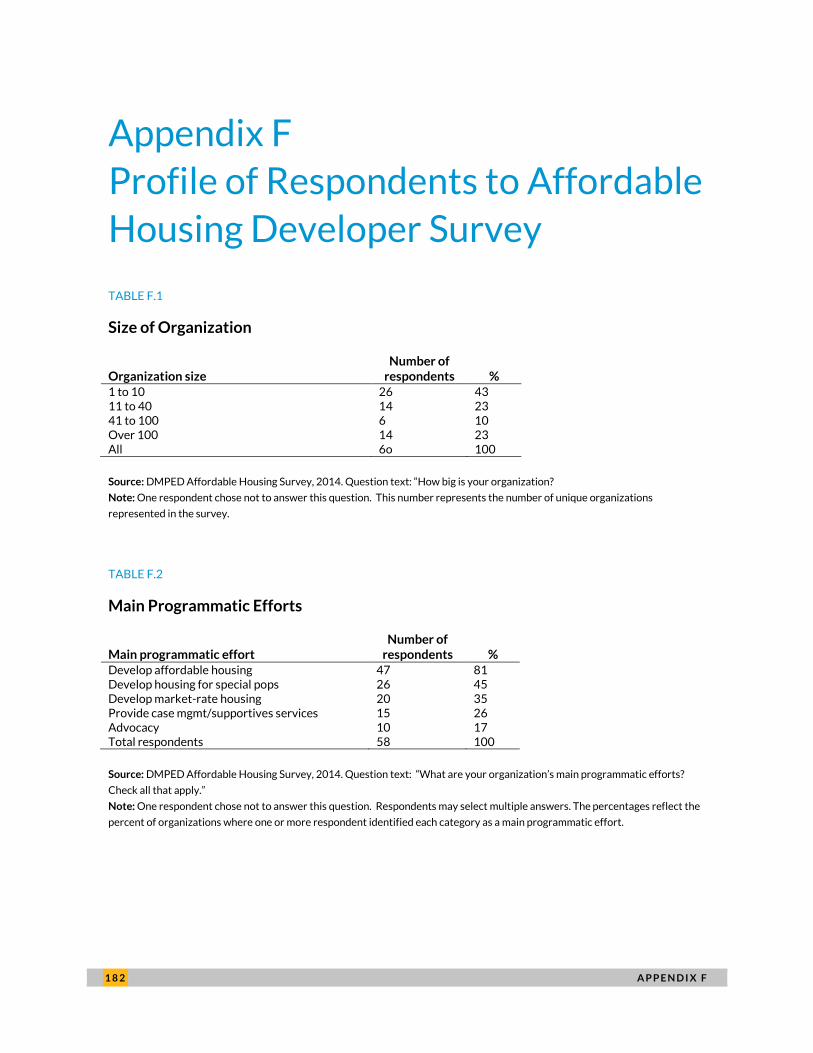
Fifty-five percent of the organizations represented have affordable housing projects only in DC,
and 15 percent of respondents have projects located throughout the Washington, DC, metropolitan
area, including DC. Only 18 of the 61 organizations in our sample (30 percent) operate regionally
(Northeast or East Coast) or nationwide. (See appendix F for a profile of respondents to the affordable
housing developer survey.)
8 0 A F F O R D A B L E H O U S I N G N E E D S A S S E S S M E N T F O R T H E D I S T R I C T O F C O L U M B I A
TABLE 23
Years of Experience with Affordable Housing Development
Q: How long has your organization been in
existence?
Q: How many years has your organization been involved with
affordable housing in DC?
No. of years No. of
respondents Percent No. of
respondents Percent
Less than 3 0 0 5 8
3 to 5 7 12 7 12
6 to 10 9 15 13 22
More than 10 44 73 35 58
Total 60 100 60 100
Source: DMPED Affordable Housing Survey, 2014. This number represents the number of unique organizations represented in
the survey.
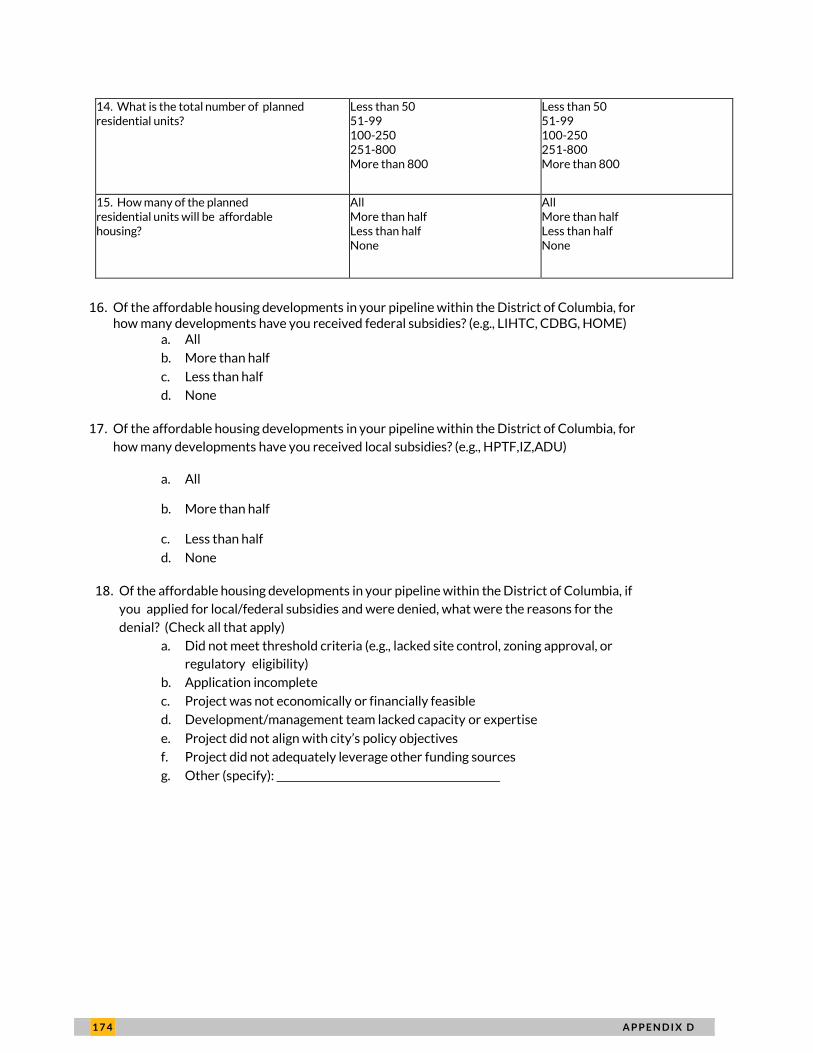
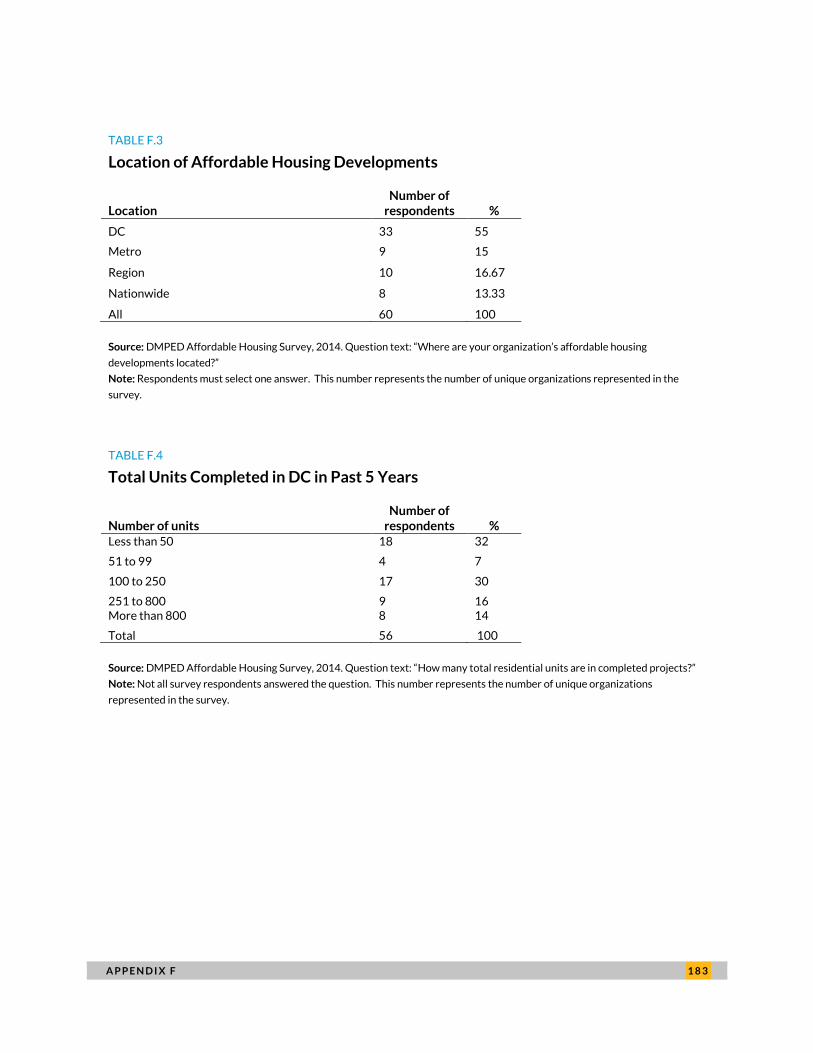
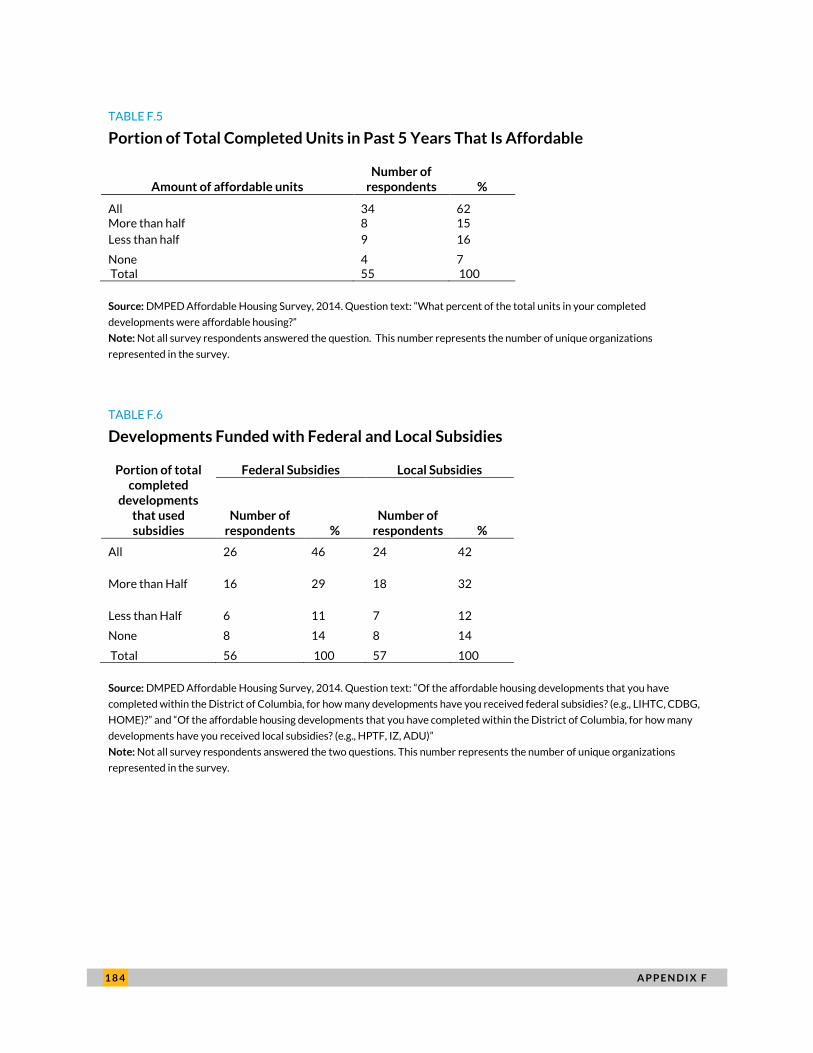
Fifty-six survey respondents had completed developments with affordable housing units in the past
five years in DC.14
An equal portion of respondents (30 to 32 percent) had developed fewer than 50
total residential units (including market rate) and 100 to 250 total residential units in DC (appendix F).
The majority of respondents (62 percent) replied that all of the total residential units they have
completed in that time frame were affordable units. The majority of respondents (86 percent) also
received federal subsidies; the same number of respondents received local subsidies.
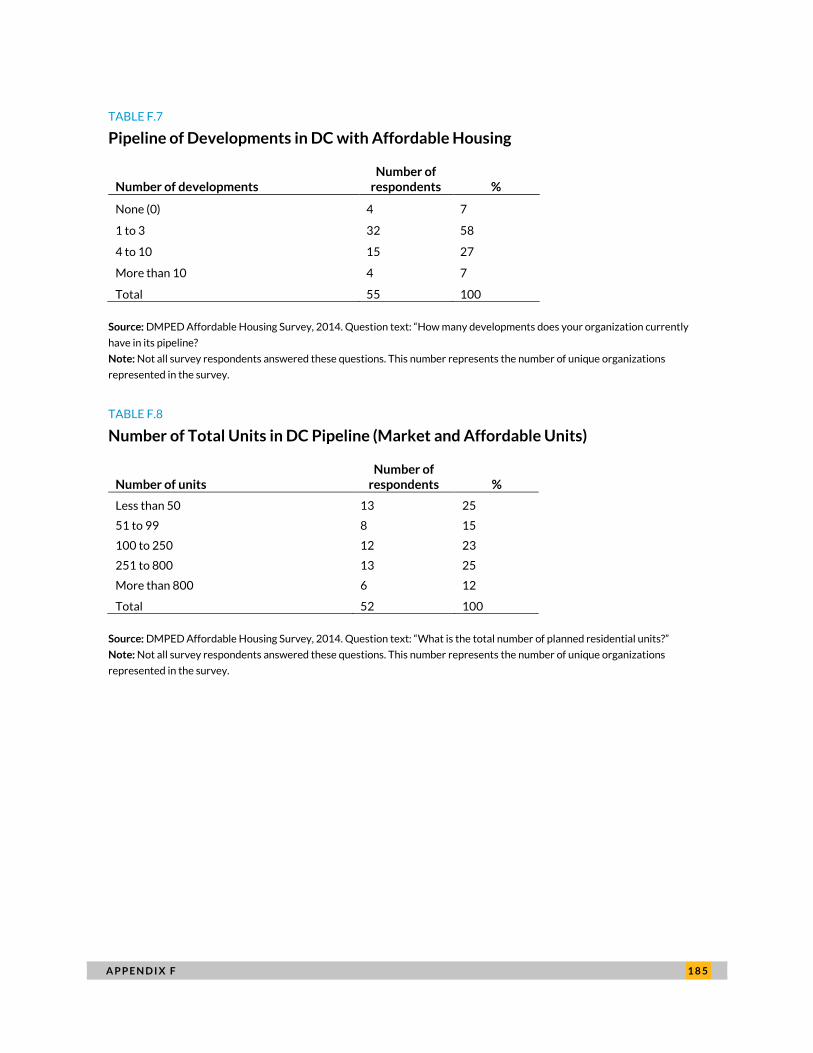
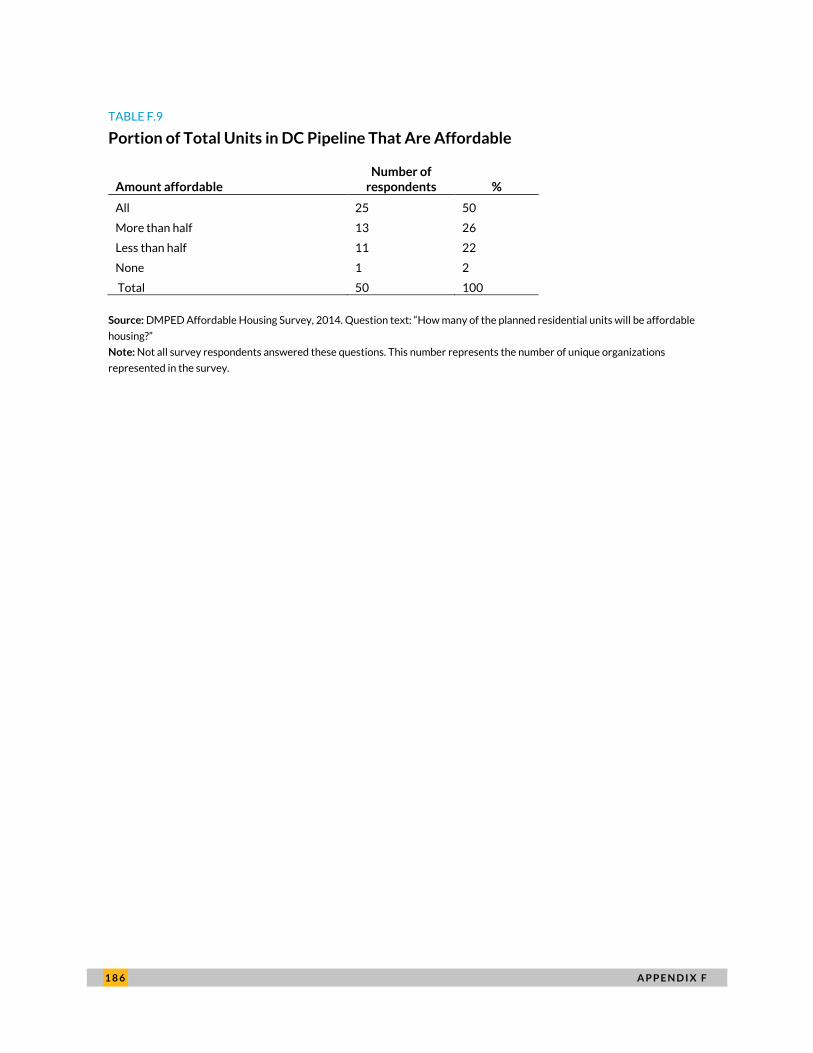
Nearly all the developers (93 percent) are in the process of developing more affordable housing in
DC. Over one in four respondents have 4 to 10 properties with affordable units in the pipeline.15
Many
of the planned units in the pipeline will be affordable: half of the respondents said that all of the units in
their pipeline in DC will be affordable, and 26 percent of respondents said that more than half of the
total planned units in their pipeline will be affordable.
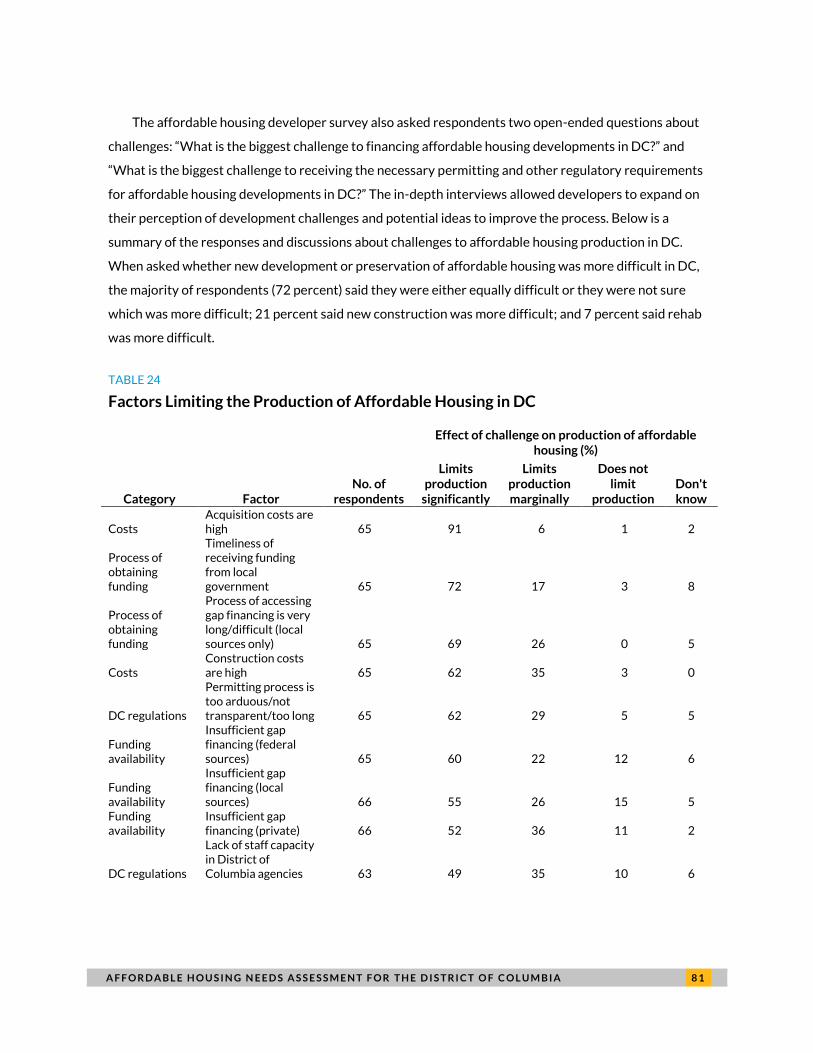
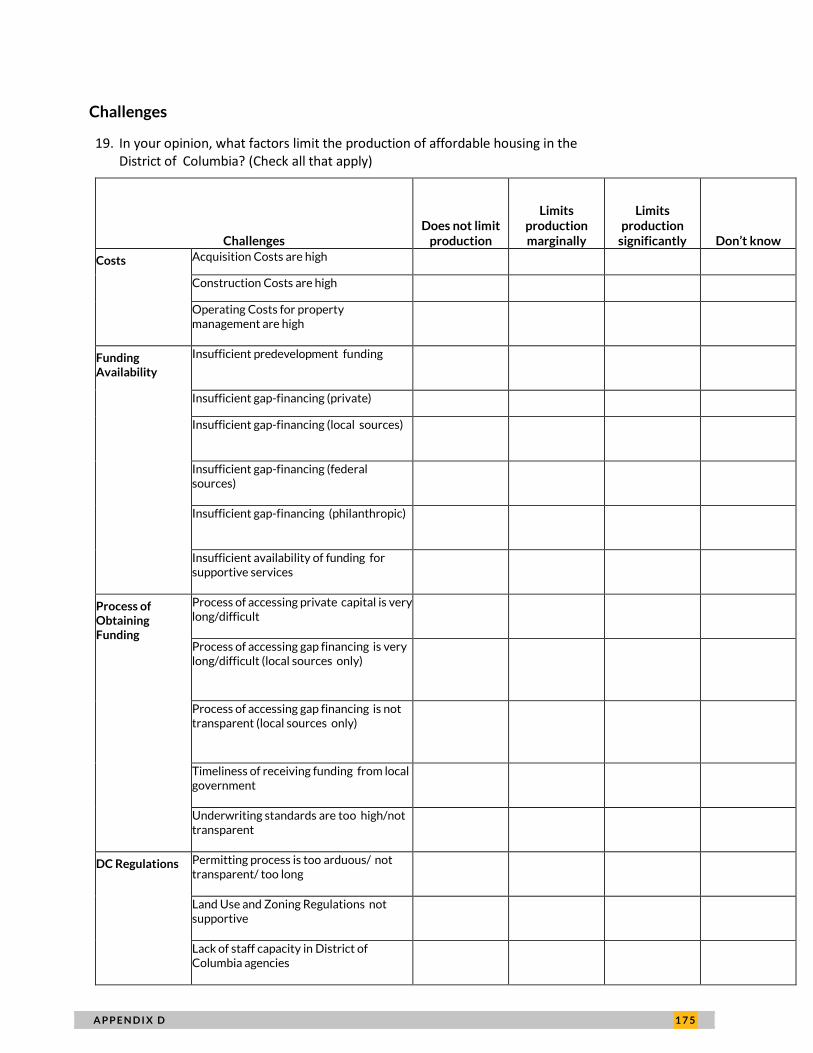
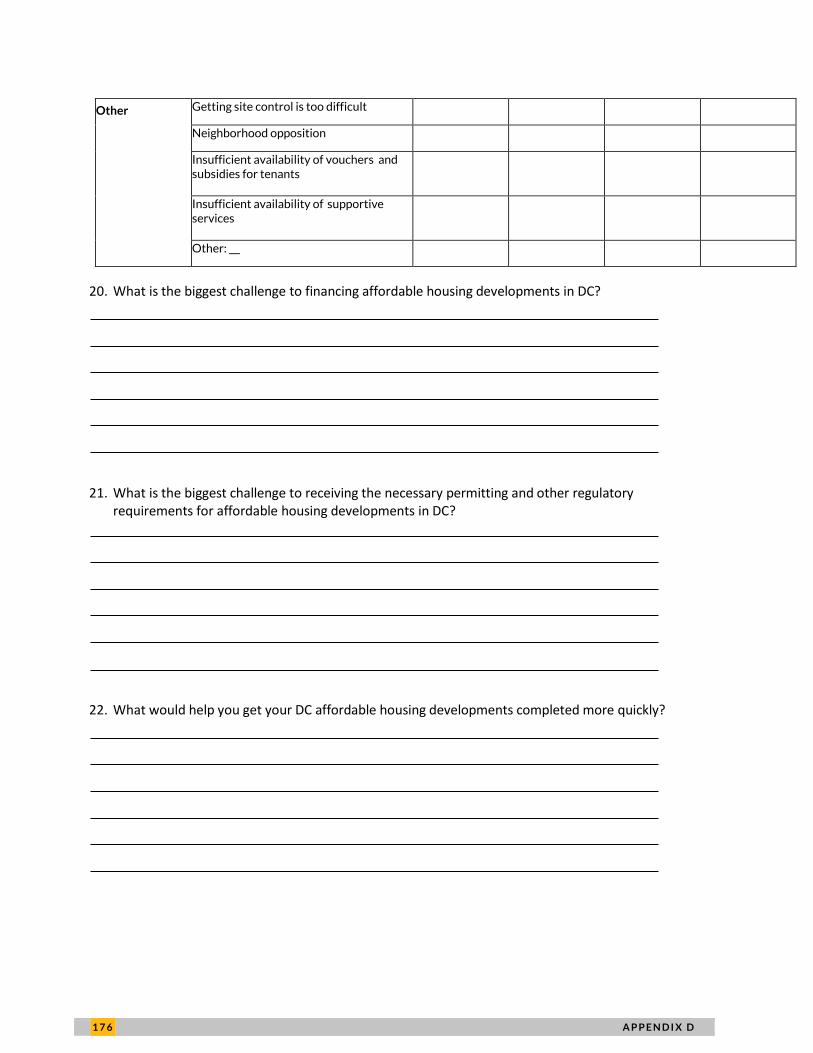
Challenges to Affordable Housing Production in DC
Respondents were given a list of 21 possible challenges to development and asked if each factor
significantly limited the production of affordable housing in DC, marginally limited production, or did
not limit production. The factors were grouped by category: costs, funding availability, process of
obtaining funding, DC regulations, and other. Table 24 shows the factors ranked by the number of
participants who identified the factor as one that significantly limited affordable housing production.
A F F O R D A B L E H O U S I N G N E E D S A S S E S S M E N T F O R T H E D I S T R I C T O F C O L U M B I A 8 1
The affordable housing developer survey also asked respondents two open-ended questions about
challenges: “What is the biggest challenge to financing affordable housing developments in DC?” and
“What is the biggest challenge to receiving the necessary permitting and other regulatory requirements
for affordable housing developments in DC?” The in-depth interviews allowed developers to expand on
their perception of development challenges and potential ideas to improve the process. Below is a
summary of the responses and discussions about challenges to affordable housing production in DC.
When asked whether new development or preservation of affordable housing was more difficult in DC,
the majority of respondents (72 percent) said they were either equally difficult or they were not sure
which was more difficult; 21 percent said new construction was more difficult; and 7 percent said rehab
was more difficult.
TABLE 24
Factors Limiting the Production of Affordable Housing in DC
Category Factor No. of
respondents
Effect of challenge on production of affordable housing (%)
Limits production
significantly
Limits production marginally
Does not limit
production Don't know
Costs Acquisition costs are high 65 91 6 1 2
Process of obtaining funding
Timeliness of receiving funding from local government 65 72 17 3 8
Process of obtaining funding
Process of accessing gap financing is very long/difficult (local sources only) 65 69 26 0 5
Costs Construction costs are high 65 62 35 3 0
DC regulations
Permitting process is too arduous/not transparent/too long 65 62 29 5 5
Funding availability
Insufficient gap financing (federal sources) 65 60 22 12 6
Funding availability
Insufficient gap financing (local sources) 66 55 26 15 5
Funding availability
Insufficient gap financing (private) 66 52 36 11 2
DC regulations
Lack of staff capacity in District of Columbia agencies 63 49 35 10 6
8 2 A F F O R D A B L E H O U S I N G N E E D S A S S E S S M E N T F O R T H E D I S T R I C T O F C O L U M B I A
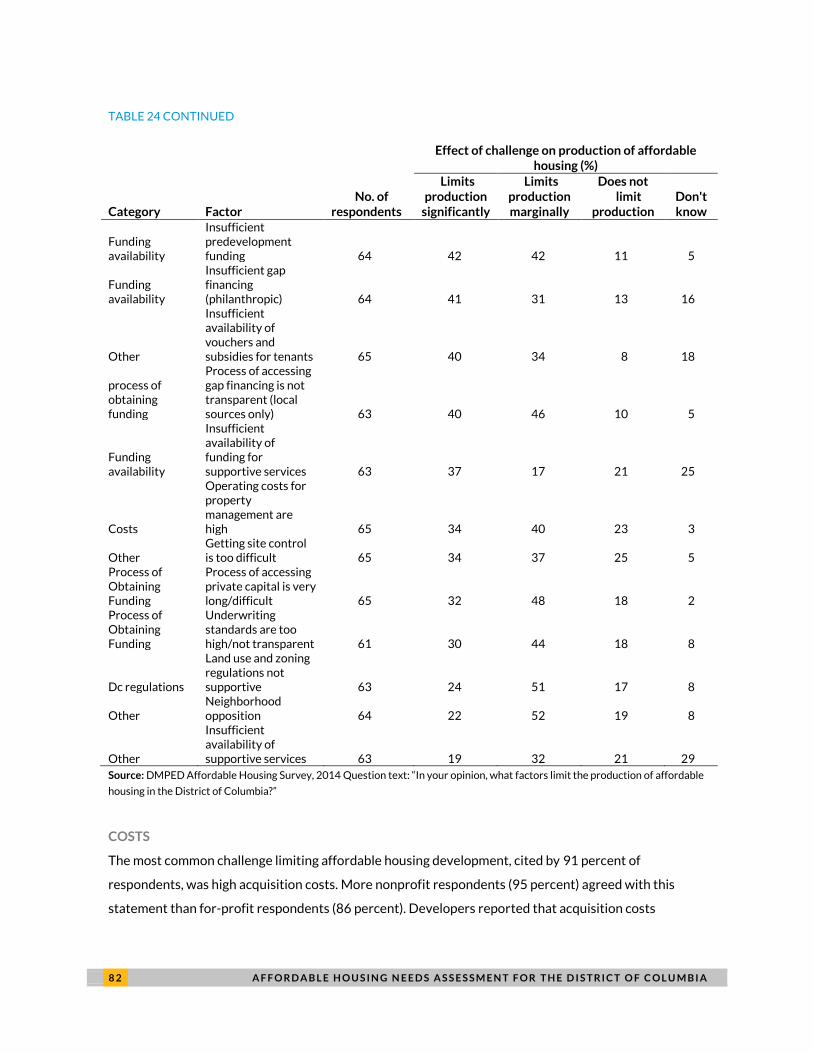
TABLE 24 CONTINUED
Category Factor
No. of respondents
Effect of challenge on production of affordable housing (%)
Limits production
significantly
Limits production marginally
Does not limit
production
Don't know
Funding availability
Insufficient predevelopment funding 64 42 42 11 5
Funding availability
Insufficient gap financing (philanthropic) 64 41 31 13 16
Other
Insufficient availability of vouchers and subsidies for tenants 65 40 34 8 18
process of obtaining funding
Process of accessing gap financing is not transparent (local sources only) 63 40 46 10 5
Funding availability
Insufficient availability of funding for supportive services 63 37 17 21 25
Costs
Operating costs for property management are high 65 34 40 23 3
Other Getting site control is too difficult 65 34 37 25 5
Process of Obtaining Funding
Process of accessing private capital is very long/difficult 65 32 48 18 2
Process of Obtaining Funding
Underwriting standards are too high/not transparent 61 30 44 18 8
Dc regulations
Land use and zoning regulations not supportive 63 24 51 17 8
Other Neighborhood opposition 64 22 52 19 8
Other
Insufficient availability of supportive services 63 19 32 21 29
Source: DMPED Affordable Housing Survey, 2014 Question text: “In your opinion, what factors limit the production of affordable
housing in the District of Columbia?”
COSTS
The most common challenge limiting affordable housing development, cited by 91 percent of
respondents, was high acquisition costs. More nonprofit respondents (95 percent) agreed with this
statement than for-profit respondents (86 percent). Developers reported that acquisition costs
A F F O R D A B L E H O U S I N G N E E D S A S S E S S M E N T F O R T H E D I S T R I C T O F C O L U M B I A 8 3
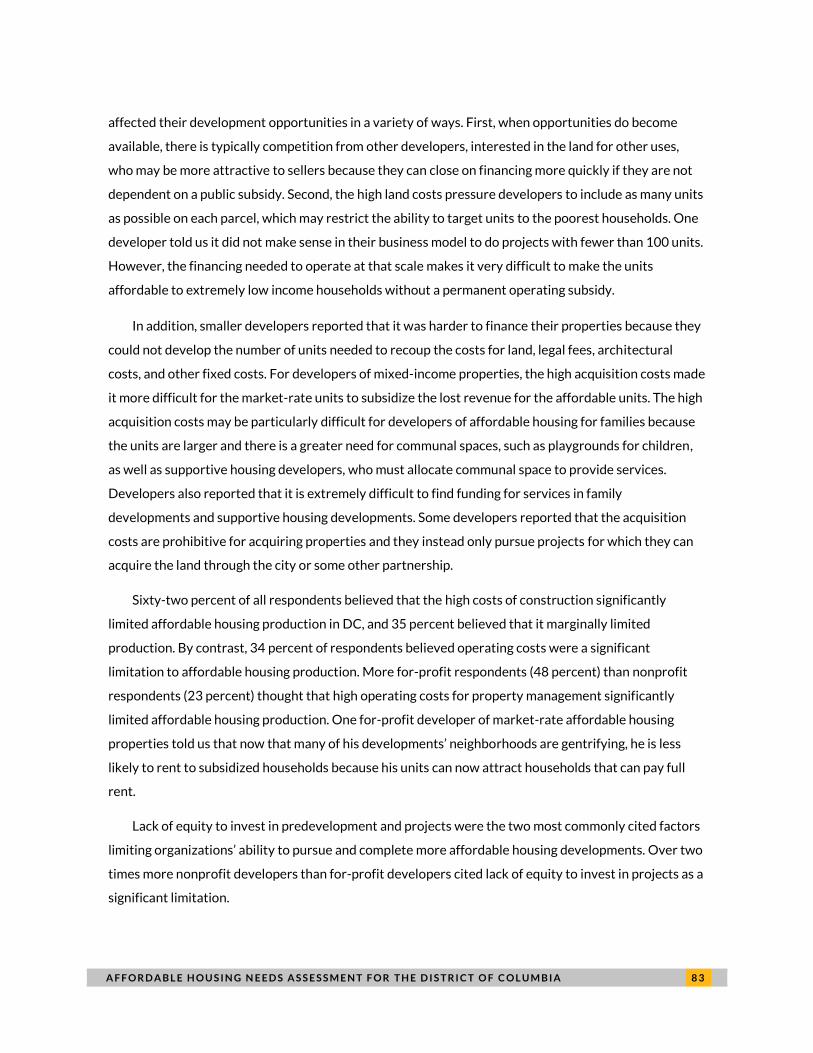
affected their development opportunities in a variety of ways. First, when opportunities do become
available, there is typically competition from other developers, interested in the land for other uses,
who may be more attractive to sellers because they can close on financing more quickly if they are not
dependent on a public subsidy. Second, the high land costs pressure developers to include as many units
as possible on each parcel, which may restrict the ability to target units to the poorest households. One
developer told us it did not make sense in their business model to do projects with fewer than 100 units.
However, the financing needed to operate at that scale makes it very difficult to make the units
affordable to extremely low income households without a permanent operating subsidy.
In addition, smaller developers reported that it was harder to finance their properties because they
could not develop the number of units needed to recoup the costs for land, legal fees, architectural
costs, and other fixed costs. For developers of mixed-income properties, the high acquisition costs made
it more difficult for the market-rate units to subsidize the lost revenue for the affordable units. The high
acquisition costs may be particularly difficult for developers of affordable housing for families because
the units are larger and there is a greater need for communal spaces, such as playgrounds for children,
as well as supportive housing developers, who must allocate communal space to provide services.
Developers also reported that it is extremely difficult to find funding for services in family
developments and supportive housing developments. Some developers reported that the acquisition
costs are prohibitive for acquiring properties and they instead only pursue projects for which they can
acquire the land through the city or some other partnership.
Sixty-two percent of all respondents believed that the high costs of construction significantly
limited affordable housing production in DC, and 35 percent believed that it marginally limited
production. By contrast, 34 percent of respondents believed operating costs were a significant
limitation to affordable housing production. More for-profit respondents (48 percent) than nonprofit
respondents (23 percent) thought that high operating costs for property management significantly
limited affordable housing production. One for-profit developer of market-rate affordable housing
properties told us that now that many of his developments’ neighborhoods are gentrifying, he is less
likely to rent to subsidized households because his units can now attract households that can pay full
rent.
Lack of equity to invest in predevelopment and projects were the two most commonly cited factors
limiting organizations’ ability to pursue and complete more affordable housing developments. Over two
times more nonprofit developers than for-profit developers cited lack of equity to invest in projects as a
significant limitation.
8 4 A F F O R D A B L E H O U S I N G N E E D S A S S E S S M E N T F O R T H E D I S T R I C T O F C O L U M B I A
PROCESS OF OBTAINING FUNDING
The second and third most commonly cited challenges to affordable housing were the timeliness of
receiving funds from DC agencies and the difficulty of the process for getting local funds. An equal
portion of for-profit and nonprofit developers (76 to 77 percent) thought that the lack of timeliness of
receiving funding from DC agencies significantly limited affordable housing production.
In addition, approximately three-quarters of for-profit developers and a little over two-thirds of
nonprofit developers believe that the long and difficult process of accessing gap financing from the local
government significantly hampers affordable housing development.
No other process challenges were cited as significant factors that limited production by a majority
of respondents. However, it is notable that a larger portion of developers representing nonprofit
organizations (45 percent) than for-profit firms (21 percent) thought that the long and difficult process
of obtaining private capital was a significant challenge.
Many developers believed that the consolidated request for proposals, which combines most of the
primary affordable housing funding streams into a single annual competitive application, has made the
funding process easier in DC. However, developers’ ability to apply for funding only once a year can
create complications and delays in the financing process. Nonetheless, the timing of the application is at
least a predictable delay. The larger problem developers expressed was uncertainty regarding when
they would hear from the Department of Housing and Community Development (DHCD) about their
project and lack of clarity about its criteria for evaluating applications.
The time it takes to receive DHCD financing can cause deals to fall apart. Sellers typically want to
close within 90 days on a property, and developers cannot afford to hold a property for the amount of
time it takes for an application to work its way through DHCD. Even when delays do not kill a project,
they add extra costs in terms of staff time and debt. There appears to be a perception that DHCD is
particularly difficult to work with for smaller developers whose projects may be perceived as lower
priority and for developers with less experience working in DC. Several developers reported that the
decision to contract out the underwriting process and the decision to embed consultants that can serve
as project managers for some affordable housing developments has made it easier to work with DHCD
than in the past. However, the lack of qualified staff knowledgeable about the affordable housing
process is perceived to be a problem by many developers.
A F F O R D A B L E H O U S I N G N E E D S A S S E S S M E N T F O R T H E D I S T R I C T O F C O L U M B I A 8 5
DC REGULATIONS
A little over half of all respondent (51 percent) thought that unsupportive land use and zoning
regulations marginally limited affordable housing production and 24 percent thought it significantly
limited production. Almost half (49 percent) of all respondents believed that staff capacity in DC
agencies was a significant challenge. A larger portion of nonprofit developers (59 percent) thought staff
capacity was a significant challenge than for-profit developers (48 percent).
The permitting process is another factor that slows affordable housing development in DC.
Developers told us it typically takes between six and nine months to receive the necessary permits for
new construction or rehabilitation projects. The use of expediters—third parties that facilitate the
permitting process within the Department of Consumer and Regulatory Affairs—appears to be
widespread among developers. Several developers reported that, compared to other cities, DC has less
burdensome regulations but more bureaucracy in terms of finding the appropriate people within each
agency needed to receive permitting approvals. In addition to the permitting process, developers cited
challenges with height limitations that can restrict affordable housing development and zoning
regulations that prevent the development of microunits.
For market-rate developers, understanding the IZ program is a challenge. Paradoxically, one
developer reported that IZ units set aside to be affordable to low-income households may provide less
revenue than units set aside to very low income households. The low-income units are close enough to
market rent that households may decide to opt for a unit on the private market without the paperwork
required for the IZ program. Conversely, the very low income units are less likely to sit vacant because
of the large demand.
FUNDING AVAILABILITY
Fifty-five percent of all respondents thought that insufficient gap financing from local sources
significantly limited affordable housing production, though a larger portion of nonprofit developers saw
this as a significant challenge than the portion of for-profit developers. A little over half of all
respondents (52 percent) cited insufficient gap financing from private sources such as commercial
banks as a significant challenge. An equal portion (55 percent) of for-profit and nonprofit developers
thought that insufficient gap financing from federal sources significantly limited affordable housing
production. In their comments, a number of respondents cited the lack of 9 percent Low-Income
Housing Tax Credits (LIHTC) as a significant challenge to financing affordable housing developments.
8 6 A F F O R D A B L E H O U S I N G N E E D S A S S E S S M E N T F O R T H E D I S T R I C T O F C O L U M B I A
There was also a difference in perception about the effect of insufficient gap financing from
philanthropic sources: 59 percent of nonprofit developers found this factor to be a significant challenge
compared to only 25 percent of for-profit developers.
OTHER
Forty percent of respondents said that an insufficient availability of vouchers and subsidies for tenants
significantly limited the production of affordable housing. One in three respondents said getting site
control was a significant challenge. Roughly one in five respondents (22 percent) thought that
neighborhood opposition was a significant limitation to affordable housing development.
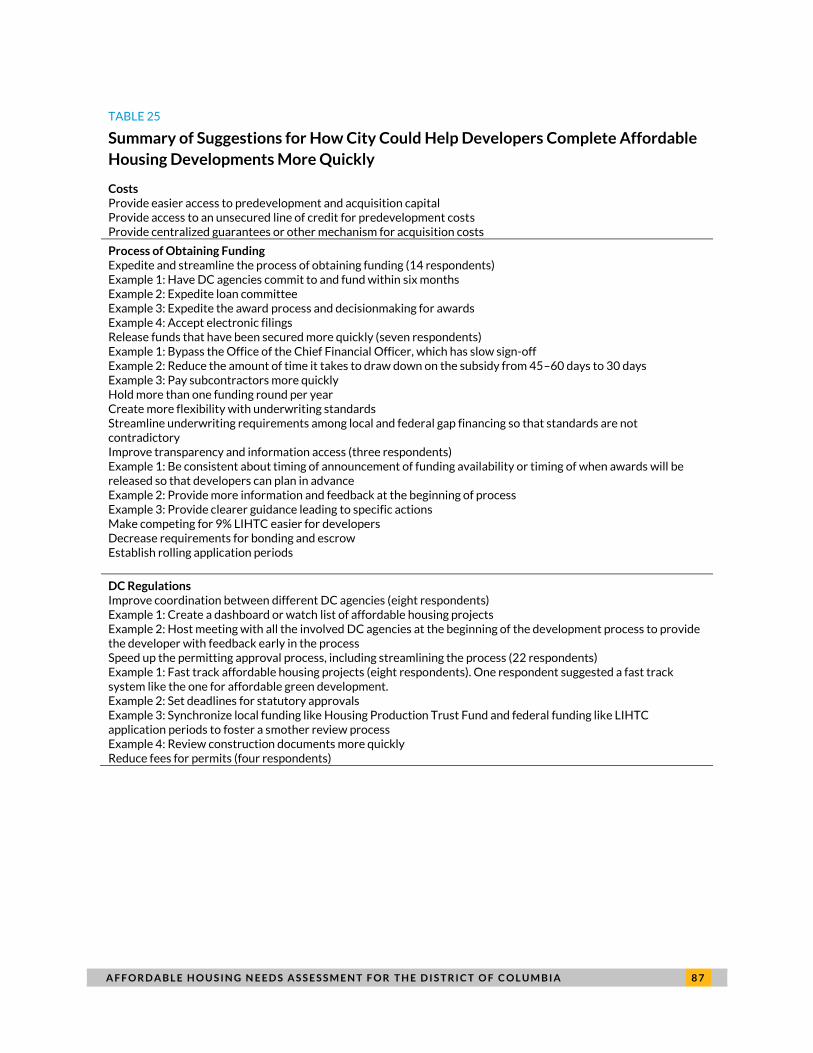
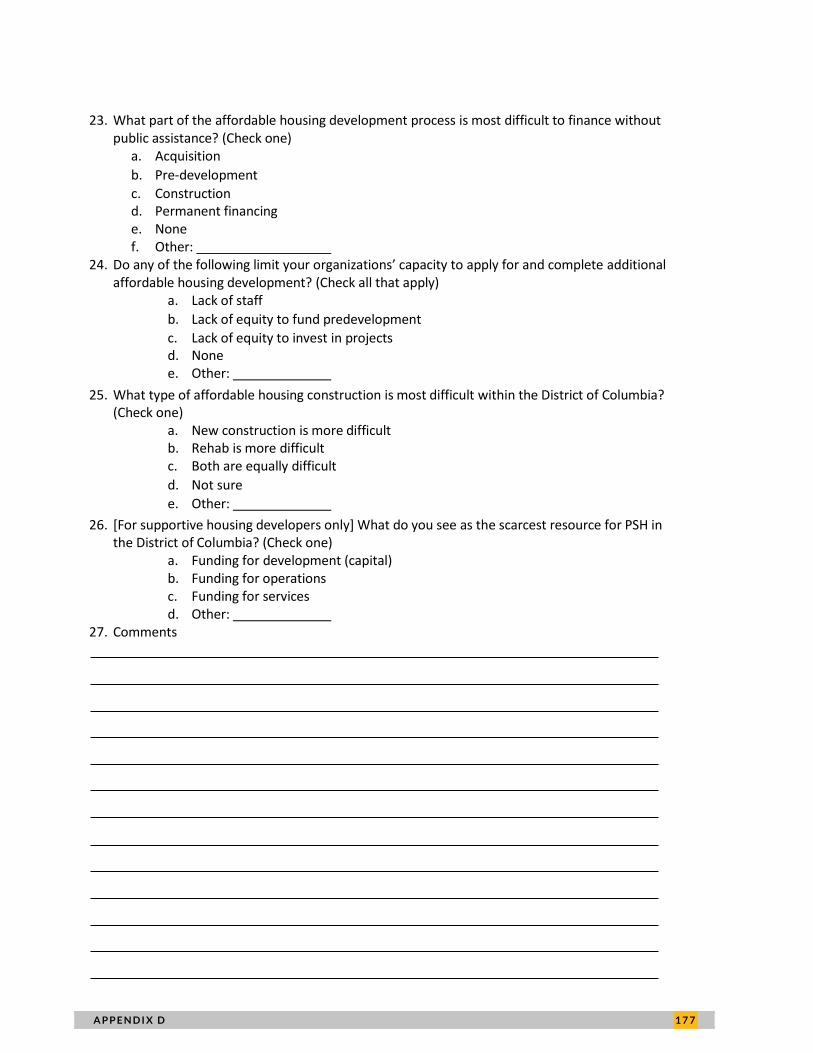
Respondent Recommendations
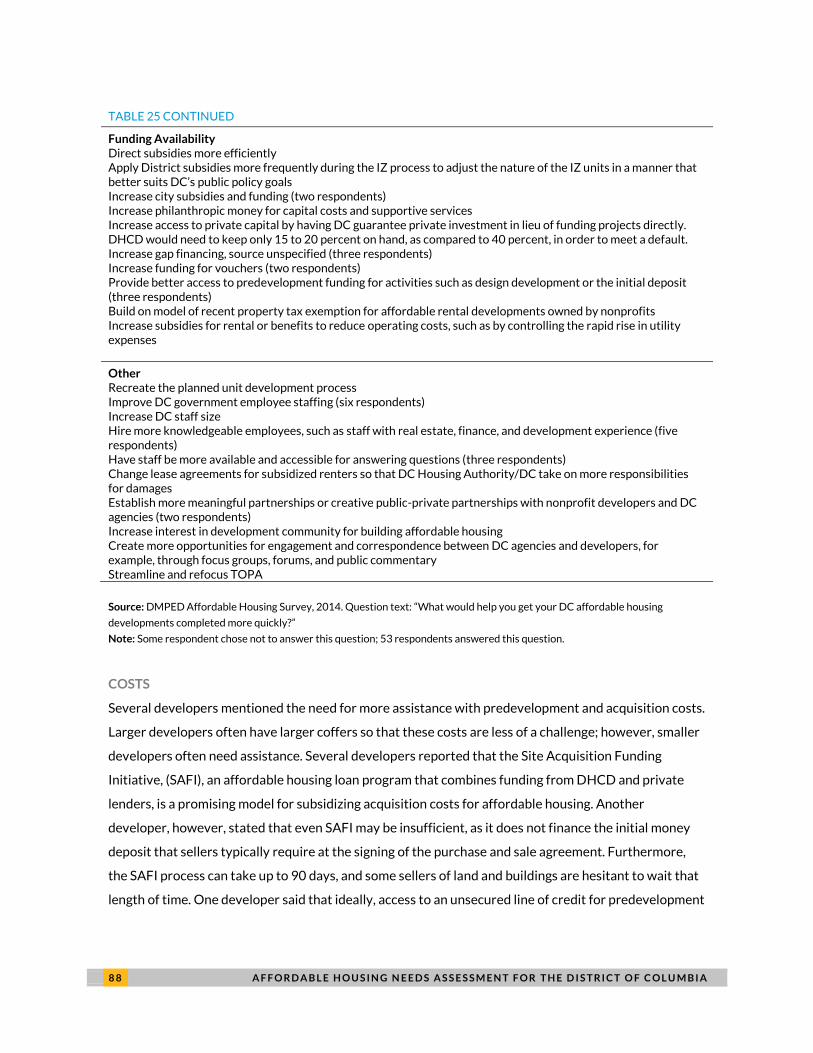
The survey also asked respondents, “What would help you get your DC affordable housing
developments completed more quickly?” Fifty-three developers responded to this question.16
Responses are discussed below and summarized in table 25. As with the challenges section of the
survey, the most common responses were related to processes rather than the amount of funding
available: 22 developers provided statements about the process of obtaining funding, and 20 responded
with statements about DC regulations.
A F F O R D A B L E H O U S I N G N E E D S A S S E S S M E N T F O R T H E D I S T R I C T O F C O L U M B I A 8 7
TABLE 25
Summary of Suggestions for How City Could Help Developers Complete Affordable
Housing Developments More Quickly
Costs Provide easier access to predevelopment and acquisition capital Provide access to an unsecured line of credit for predevelopment costs Provide centralized guarantees or other mechanism for acquisition costs
Process of Obtaining Funding Expedite and streamline the process of obtaining funding (14 respondents) Example 1: Have DC agencies commit to and fund within six months Example 2: Expedite loan committee Example 3: Expedite the award process and decisionmaking for awards Example 4: Accept electronic filings Release funds that have been secured more quickly (seven respondents) Example 1: Bypass the Office of the Chief Financial Officer, which has slow sign-off Example 2: Reduce the amount of time it takes to draw down on the subsidy from 45–60 days to 30 days Example 3: Pay subcontractors more quickly Hold more than one funding round per year Create more flexibility with underwriting standards Streamline underwriting requirements among local and federal gap financing so that standards are not contradictory Improve transparency and information access (three respondents) Example 1: Be consistent about timing of announcement of funding availability or timing of when awards will be released so that developers can plan in advance Example 2: Provide more information and feedback at the beginning of process Example 3: Provide clearer guidance leading to specific actions Make competing for 9% LIHTC easier for developers Decrease requirements for bonding and escrow Establish rolling application periods
DC Regulations Improve coordination between different DC agencies (eight respondents) Example 1: Create a dashboard or watch list of affordable housing projects Example 2: Host meeting with all the involved DC agencies at the beginning of the development process to provide the developer with feedback early in the process Speed up the permitting approval process, including streamlining the process (22 respondents) Example 1: Fast track affordable housing projects (eight respondents). One respondent suggested a fast track system like the one for affordable green development. Example 2: Set deadlines for statutory approvals Example 3: Synchronize local funding like Housing Production Trust Fund and federal funding like LIHTC application periods to foster a smother review process Example 4: Review construction documents more quickly Reduce fees for permits (four respondents)
8 8 A F F O R D A B L E H O U S I N G N E E D S A S S E S S M E N T F O R T H E D I S T R I C T O F C O L U M B I A
TABLE 25 CONTINUED
Funding Availability Direct subsidies more efficiently Apply District subsidies more frequently during the IZ process to adjust the nature of the IZ units in a manner that better suits DC’s public policy goals Increase city subsidies and funding (two respondents) Increase philanthropic money for capital costs and supportive services Increase access to private capital by having DC guarantee private investment in lieu of funding projects directly. DHCD would need to keep only 15 to 20 percent on hand, as compared to 40 percent, in order to meet a default. Increase gap financing, source unspecified (three respondents) Increase funding for vouchers (two respondents) Provide better access to predevelopment funding for activities such as design development or the initial deposit (three respondents) Build on model of recent property tax exemption for affordable rental developments owned by nonprofits Increase subsidies for rental or benefits to reduce operating costs, such as by controlling the rapid rise in utility expenses
Other Recreate the planned unit development process Improve DC government employee staffing (six respondents) Increase DC staff size Hire more knowledgeable employees, such as staff with real estate, finance, and development experience (five respondents) Have staff be more available and accessible for answering questions (three respondents) Change lease agreements for subsidized renters so that DC Housing Authority/DC take on more responsibilities for damages Establish more meaningful partnerships or creative public-private partnerships with nonprofit developers and DC agencies (two respondents) Increase interest in development community for building affordable housing Create more opportunities for engagement and correspondence between DC agencies and developers, for example, through focus groups, forums, and public commentary Streamline and refocus TOPA
Source: DMPED Affordable Housing Survey, 2014. Question text: “What would help you get your DC affordable housing
developments completed more quickly?”
Note: Some respondent chose not to answer this question; 53 respondents answered this question.
COSTS
Several developers mentioned the need for more assistance with predevelopment and acquisition costs.
Larger developers often have larger coffers so that these costs are less of a challenge; however, smaller
developers often need assistance. Several developers reported that the Site Acquisition Funding
Initiative, (SAFI), an affordable housing loan program that combines funding from DHCD and private
lenders, is a promising model for subsidizing acquisition costs for affordable housing. Another
developer, however, stated that even SAFI may be insufficient, as it does not finance the initial money
deposit that sellers typically require at the signing of the purchase and sale agreement. Furthermore,
the SAFI process can take up to 90 days, and some sellers of land and buildings are hesitant to wait that
length of time. One developer said that ideally, access to an unsecured line of credit for predevelopment
A F F O R D A B L E H O U S I N G N E E D S A S S E S S M E N T F O R T H E D I S T R I C T O F C O L U M B I A 8 9
and acquisition costs would expedite the integral, early parts of the process. One developer suggested
that centralized guarantees might be one way to assist with acquisition and carry costs.
Several respondents believed that the city could be more aggressive in using publicly owned land
for affordable housing and providing more support for the TOPA program for affordable housing
preservation. Four developers suggested that DC could reduce the fee for permits.
PROCESS OF OBTAINING FUNDING
Several developers would like to see a semi-annual or quarterly funding application process. Fourteen
developers wanted a faster process of obtaining funding, generally. One interview participant
suggested that, to identify jams in the process, DC agencies should create a flowchart of the process to
see how long it takes on average to receive a public subsidy to pinpoint specific places where the
process could move faster. Furthermore, the interviewee suggested that the present process is too
linear, when several steps can be done concurrently. Seven respondents noted that even when they
have secured a loan, subsidy, or award, the process of actually releasing funds or drawing down could be
much faster, especially when compared to conventional banks that typically have a turn-around time of
10 days.
To improve transparency and increase access, several respondents wished for clearer guidance,
especially at the beginning of the process, and consistency with timing of the announcement of the
NOFAs and the awards, as their business decisions need to be planned in advance. Information sharing
might be improved by simply making staff more available to answer questions that developers have,
according to three respondents. Some developers went further to say that the process would be made
easier if DC agencies hired additional staff with better knowledge of real estate, development, and
finance.
DC REGULATIONS
When asked about ideas that would help developers build or preserve affordable housing
developments more quickly, 21 developers thought that the process of getting permit approvals should
be made faster, perhaps through a more streamlined process. Eight of the 21 respondents specifically
recommended creating a fast-track system for affordable housing developments. As one participant
noted, creating a fast-track system is a way for DMPED or DHCD to say that affordable housing
projects are a priority. Eight respondents suggested that better coordination among the various DC
agencies would help expedite the affordable housing development process. In a phone interview, a
participant expanded on the issue of having to navigate through multiple agencies. This participant
9 0 A F F O R D A B L E H O U S I N G N E E D S A S S E S S M E N T F O R T H E D I S T R I C T O F C O L U M B I A
suggested that it might be helpful to designate a single point of contact in city government who is held
accountable for moving the project through to approval across agencies and can communicate with
developers about what is needed. Other suggestions that arose from the in-depth interviews included
relaxing the height limit to create more density. DC could offer to relax the height limit for certain
developments in exchange for the developer agreeing to create additional affordable units.
FUNDING AVAILABILITY
Several developers thought that increasing gap financing from any source would help with getting
affordable housing development built more quickly; only two respondents specifically cited an increase
in city funds. Several respondents also said that more gap financing specifically for predevelopment
activities would be helpful. One developer suggested that local funding agencies should better target
existing subsidies, and in particular, that DC should use more subsidies with IZ projects to align the
market-rate projects with the goals.
A F F O R D A B L E H O U S I N G N E E D S A S S E S S M E N T F O R T H E D I S T R I C T O F C O L U M B I A 9 1
Recommendations on Policy and
Investment Decisions The most frequently cited recommendations from developers to improve the affordable
housing development process were increased funding for housing subsidies and a more
streamlined and transparent funding and permitting process. Increased gap financing
and subsidies will naturally assist the production of affordable housing development in
DC. Beyond increasing funding there are other actions DC government can take to
encourage and foster affordable housing production and preservation. Strategic,
organizational, and administrative changes to the current affordable housing
development processes will help to create a development environment that minimizes
developers’ challenges and the time it takes to build and preserve housing, thus
reducing the cost of developing affordable housing in DC. A more coordinated approach
will also make it more likely that DC will get the amount and kind of housing
development that it needs to meet both current and future demand. In turn, the rate of
affordable housing production may increase as DC retains or attracts more developers.
The following recommendations are changes that DC agencies can implement with financing strategies
and processes, regulations and administration, and organizational policy. These recommendations are
discussed more thoroughly in the rest of this chapter:
Funding availability
» Recommendation 1: Consider pooled tax-exempt bond structures to leverage Housing
Production Trust Fund resources and 4% Low-Income Housing Tax Credits Program.
» Recommendation 2: Target subsidies appropriately to priority geographic areas for new
affordable housing investments.
Process of obtaining funding
» Recommendation 3: Continue to support efforts to streamline and expedite the process for
obtaining funding, and release awarded funds more quickly.
» Recommendation 4: Increase predictability and improve transparency of funding decisions.
DC regulations
9 2 A F F O R D A B L E H O U S I N G N E E D S A S S E S S M E N T F O R T H E D I S T R I C T O F C O L U M B I A
» Recommendation 5: Speed up permitting and other processes that may be needlessly
lengthening time frames and increasing costs for developing affordable housing; consider a
fast-track permitting for affordable housing projects.
» Recommendation 6: Improve coordination between different DC agencies.
Other recommendations
» Recommendation 7: Increase agency capacity.
» Recommendation 8: Create more opportunities to engage meaningfully with developers. » Recommendation 9: Preserve existing affordable rental housing.
Funding Availability
Recommendation 1: Consider pooled tax-exempt bond structures to leverage
Housing Production Trust Fund resources and 4% Low-Income Housing Tax Credit
Program
The most valuable federal resource available for the production or preservation of affordable housing is
the Low-Income Housing Tax Credit (LIHTC). DC’s annual allocation of 9 percent LIHTC is $2.6 million,
the minimum level for any state (and the same level as South Dakota, North Dakota, Vermont,
Delaware, and Rhode Island). DC has an annual tax-exempt bond volume cap authority of
approximately $285 million per year. Qualified affordable housing projects financed at least 50 percent
by tax-exempt bonds are eligible for 4% LIHTC Program as of right.
The majority, but not all, of the volume cap authority in DC is assigned to the DC Housing Finance
Agency (DCHFA) and is used to issue tax-exempt bond financing. According to DCHFA, except during
recessionary periods (e.g., 2009–11), DCHFA generally uses most of its bond authority. The bonds can
be issued for a variety of activities and project types, not all of which end up leveraging LIHTCs. For
example, bond authority can be used to finance tax-exempt rate home mortgages or “80-20” mixed-
income multifamily developments (such as the Yards, where at least 20 percent of the units are set aside
for low-income households) with tax-exempt interest rates but without using LIHTC.
A F F O R D A B L E H O U S I N G N E E D S A S S E S S M E N T F O R T H E D I S T R I C T O F C O L U M B I A 9 3
There is a public policy question, however, as to whether some of the volume cap capacity could or
should be used more proactively to better leverage other resources, such as the Housing Production
Trust Fund (HPTF), which would make those subsidies go further and provide more affordability.
The 4% LIHTC Program that is available for qualified tax-exempt bond transactions can typically
generate equity that can cover approximately 30 percent of a project’s total development cost. This
resource could stretch the dollars that are appropriated by the city for producing and preserving
affordable housing and may currently be underused.
Nevertheless, there are many challenges owners and developers face in using bonds and LIHTC:
Tax-exempt bond transactions are complicated and expensive.
It is generally not cost-effective to issue bonds for smaller projects (under 50 to 75 units);
DCHFA recommends a minimum of $5 million per transaction.
Most small developers do not have the capacity or expertise to undertake a LIHTC/tax-
exempt bond transaction.
Many small owners and developers would likely resist taking on partners and adding
further layers of regulation to their projects, which would be necessary for them to make
use of tax-exempt bonds and LIHTC.
To address some of these challenges, a potential structure would require a proactive approach
organized or facilitated by DHCD or DCHFA. A master developer could be assigned to manage the
process, execute the transactions, and provide necessary guarantees to LIHTC investors. DHCD or
DCHFA could facilitate this by
Issuing a request for proposal (RFP) for a master developer,
Assembling a pool of potential projects through its annual RFP process,
Requiring applicants/borrowers to participate in the pool to leverage HPTF resources, and
Using its resources to provide credit enhancements for the bonds.
Potentially, bonds could be used for construction only and would be taken out by a combination of
taxable debt, LIHTC equity, and HPTF funds. LIHTC equity might need to be funneled through the
master developer.
9 4 A F F O R D A B L E H O U S I N G N E E D S A S S E S S M E N T F O R T H E D I S T R I C T O F C O L U M B I A
A similar approach, which DCHFA is currently considering, would focus on the inventory of existing
unsubsidized affordable rental properties in DC. The real estate market is quickly pushing many of
these properties out of the reach of low- and moderate-income tenants. Using the 4% LIHTC Program
resource as a financing tool, DCHFA plans to explore the potential of a targeted program to reach out to
current owners of smaller properties and pool them in a tax-exempt bond issuance that would provide
lower-cost financing to facilitate preservation.
Recommendation 2: Target subsidies appropriately to priority geographic areas for
new affordable housing investments
The needs and costs for producing affordable housing vary across the city. In higher-income wards and
neighborhoods, the need for affordable housing is greatest in terms of relative costs. The supply of
existing market-affordable housing is rapidly diminishing in these areas, making the need to preserve
existing affordable housing and create new affordable units all the more urgent. At the same time, the
cost of producing and preserving units in these locations can be much higher than in lower-income
sections of the city because the real estate values are higher. Therefore, if the city wants to preserve or
develop affordable units in these areas, to provide inclusive housing options across different income
levels, it must be prepared to invest higher amounts of subsidy per unit to accomplish this goal.
Conversely, the need for affordable housing in terms of concentration of rent-burdened, low-
income families is greatest in low-income wards and neighborhoods. In these parts of the city, the cost
to produce and preserve affordable housing is lower because real estate values are lower. Over the
years, the result has been a higher concentration of affordable and assisted units in these wards and
neighborhoods. In these lower-income areas, the priority should be to create more mixed-income and
market-rate housing to promote income diversity and reduce concentrated poverty.
To address the differing needs and costs in wards and neighborhoods, DHCD should consider
establishing variable total development cost limits in its guidelines based on where properties are
located. The current DHCD RFP establishes universal total development cost limits and, therefore,
these guidelines do not take into account the variation in development costs across the city. As
presented earlier, the average total development cost in Ward 2 is $426,194 per unit, but the average
cost per unit in Ward 4 is $201,392. In comparison, the cost guidelines established in the DHCD spring
2014 notice of funding availability (NOFA) list the total development costs by type of building and
number of units for a maximum total development cost of $230,000 per unit for studios and one-
bedroom units and $270,000 for units with three or more bedrooms.17
The guideline thus discourages,
A F F O R D A B L E H O U S I N G N E E D S A S S E S S M E N T F O R T H E D I S T R I C T O F C O L U M B I A 9 5
though perhaps unintentionally, development projects in higher-cost areas, although DHCD does allow
applicants to make a case for exceptions to these limits.
The allocation of resources in lower-income areas, however, should promote more income
diversity, in addition to affordable unit production and preservation. The current DHCD competitive
scoring criteria may inadvertently discourage income diversity by prioritizing projects that have high
leverage ratios (private to public resources) and lower per unit subsidy requirements. Although it is
appropriate for DHCD to encourage developers to leverage private investment, it could also consider
whether it can adjust its scoring criteria to reward projects that promote income diversity by expanding
the supply of market-rate housing in certain neighborhoods with a current high concentration of
assisted units.18
The development costs per ward reported in this study provide a first level of information that DC
can use to create more geographically aware cost guidelines and affordable housing incentives. The city
should collect more detailed and updated development cost data so that the amount of gap financing
needed in different parts of the city can be determined. Future studies could also estimate the amount
of gap financing needed to support specific affordable housing development types, such as supportive
housing. Ultimately, the estimates provided in this report may help to galvanize advocates and
policymakers and help to inform not just DC budgeting decisions but also decisions by private investors,
advocacy groups, and philanthropies interested in investing in DC.
CASE STUDY: VIRGINIA QUALIFIED ALLOCATION PLAN
Other states have used their qualified allocation plan (QAP) and resource allocation process to try to
incentivize different types of properties in different geographic areas. In Virginia, for example, bonus
points are awarded to projects that propose to build family developments in census tracts that have
poverty rates of less than 10 percent or have an increasingly rent-burdened population (Virginia
Housing Development Authority 2013). Virginia’s QAP also divides the total tax credit allocated every
year into pools to reflect the state’s priority areas and needs. These pools include a nonprofit pool, a
local housing authority pool, a new construction pool, and geographic pools (Northern Virginia/inner
Washington metropolitan statistical area [MSA]; northwest/north-central Virginia; Richmond MSA;
Tidewater MSA pool; remaining geographic areas). The Northern Virginia/inner Washington MSA pool
and the new construction pool typically are the same geographies, reflecting the state’s desire to build
and preserve more housing in that region.
Virginia’s QAP also sets forth different total development cost limits based on geography. Because
of the higher costs of developing in Arlington and Fairfax Counties and the cities of Alexandria, Fairfax,
9 6 A F F O R D A B L E H O U S I N G N E E D S A S S E S S M E N T F O R T H E D I S T R I C T O F C O L U M B I A
and Falls Church, the inner Northern Virginia has a cost limit of $335,475 per unit (plus an additional
$37,274 per unit for developments with underground or structured parking) or $292,875 for
acquisition/rehabilitation. In contrast, Prince William, Loudoun, and Fauquier Counties have total
development cost limits of $249,210 per unit for new construction or adaptive reuse and $175,725 per
unit for acquisition/rehabilitation (Virginia Housing Development Authority 2013).
CASE STUDY: MINNESOTA HOUSING FINANCE AGENCY
The Minnesota Housing Finance Agency (Minnesota Housing) conducted a similar study of
development costs and cost guidelines to help guide the use of their resources (Minnesota Housing
Research 2006). Minnesota Housing looked at development costs of multifamily rental and
homeownership new construction from 2003 to 2005. Costs included construction costs; cost of land;
and soft costs, such as fees and financing. The total costs were compiled for the Minneapolis-Saint Paul
metropolitan area and the Greater Minnesota area and were further broken down for one- to three-
story apartments, four- to seven-story apartments, elderly housing, public housing low rise, assisted
living, and supportive housing types (mixed, all, not supportive). Based on the data, Minnesota Housing
developed cost guidelines intended to be useful in evaluating proposals for the funding of new
construction, as well as a set of conditions that may cause development costs to vary above or below
the norm. Minnesota Housing saw these guidelines as the beginning of a process to better quantify,
understand, and communicate the nature and cost of the development of affordable housing on an
ongoing basis.
Process of Obtaining Funding
Recommendation 3: Continue to support efforts to streamline and expedite the
process for obtaining funding, and release awarded funds more quickly.
In the affordable housing developer survey, 72 percent of respondents said that the timeliness of
receiving funding from local government significantly limited production of affordable housing. The
delays that they listed in the survey and in interviews are twofold: the process of applying for funds and
the lengthy amount of time it takes to actually draw down from their awards.
As noted by some developers, the process of applying for funds seems to be improving. The past
two NOFAs have been considered “super NOFAs,” as they consolidated the HPTF, LIHTC, Community
A F F O R D A B L E H O U S I N G N E E D S A S S E S S M E N T F O R T H E D I S T R I C T O F C O L U M B I A 9 7
Development Block Grant, HOME Investment Partnerships Program, and other funding streams from
partner agencies. One key interviewee noted that this consolidation is an improvement as it streamlines
the application process and increases the predictability of funding availability for developers, helping
them to plan.
Moreover, DHCD and other DC agencies have begun reducing the amount of time between the
issuance of the NOFA and the announcement of the award. On April 2, 2013, DHCD released the
consolidated spring FY 2013 NOFA; awardees for this round were announced on February 11, 2014,
just a little over 10 months after the NOFA was released. DC issued the next NOFA on April 3, 2014,
almost exactly a year later. The awardees for the 2014 NOFA were announced just six months later, on
October 6, 2014. DHCD and its partner agencies should continue the trend of releasing the NOFAs at
the same time every year and reducing the amount of time between issuing the NOFA and announcing
awardees. They should also address the length of time it takes, once awards have been announced, for
organizations to be able to begin drawing down funds so that the turn-around time is more similar to
the 10 day period typical of conventional banks.
Recommendation 4: Increase predictability and improve transparency of funding
decisions
As stated above, the 2014 NOFA was announced on April 3, 2014, and the 2013 NOFA was announced
on April 2, 2013. DC should continue its recent trend of releasing the NOFA at the same time every
year. In addition, DHCD and its partners should set a time frame for selecting and announcing awardees
and make that time frame public to increase transparency and facilitate developers’ business decisions.
DC should also consider bringing in outside experts to review and recommend specific changes to
agency business policies and practices that would improve the functioning of the award and issuance of
housing assistance and the approval of new housing developments. The focus of these reviews would be
to identify specific steps that cause bottlenecks and roadblocks for developers, such as the timely
issuance of building permits, and actions to improve the transparency of processes. DC agencies should
review specific performance metrics and targets that would be used to track the success of the
processes and measure improvement.
9 8 A F F O R D A B L E H O U S I N G N E E D S A S S E S S M E N T F O R T H E D I S T R I C T O F C O L U M B I A
DC Regulations
Recommendation 5: Speed up permitting and other processes that may be
needlessly lengthening time frames and increasing costs for developing affordable
housing; consider a fast-track permitting for affordable housing projects
In response to an open-ended question about how to improve the development process, 22
respondents stated that a faster, streamlined process of getting permits would help them complete
affordable housing development projects more quickly. Several developers who have experience
working outside of DC made a point of stating that DC has one of—if not the most—difficult
environments for affordable housing development, in part because of the expensive land costs, lack of
available land for development, and the regulatory process. The complexity of permitting and other city
requirements have compelled many developers to hire expeditors to facilitate the process of getting
approvals.
Before a developer can even break ground and begin construction or rehabilitation, the developer
must pay for or negotiate to get financing to pay for holding land and negotiate and apply for other
financing that is contingent on requirements, such as getting site control or building permits. The
developer must work within the time constraints of any financing in place; after a certain deadline, some
funding opportunities expire. Delays and inefficiencies in any part of the development process that
extend the development process can lead to significant cost increases and, in extreme cases,
cancellation of the project. The lack of predictability— that is, not knowing when the developer will get
certain permits—contributes to a more challenging environment because developers have a harder time
calculating their total costs and knowing what funding cycles they should aim for to obtain the gap
financing available to them. DC agencies should identify bottlenecks in the permitting and other
systems that may be contributing to avoidable delays in affordable housing development. One way to
do this, as suggested in interviews, is to follow several projects through the entire development process,
identify the longest hold-ups, and determine ways to reduce the amount of time in those delayed
periods. As noted in recommendation 4, this review could be done with the assistance of outside
experts.
In addition to identifying delays and eliminating inefficiencies, other strategies to help decrease the
length of time a project sits in the permitting and other city approval processes include the following:
A F F O R D A B L E H O U S I N G N E E D S A S S E S S M E N T F O R T H E D I S T R I C T O F C O L U M B I A 9 9
Hold meetings very early in the development process to give developers feedback on their
development plans and to discuss approvals needed.
Have several review and permitting processes occur concurrently rather than sequentially.
Designate one person as a point of contact between all DC agencies and the developer to
guide the project through the development process.
Establish and make public time limits for how long it will take an application to be reviewed
once the city receives all the required documents.
Provide priority status to certain projects meeting important city goals.
Establish an electronic permitting system; technology that does not require paper forms
with carbon copies saves time with submission and facilitates record keeping and
information sharing across agencies.
Similar approaches are being used in other cities. For example, in December 2013 San Francisco
Mayor Edwin Lee issued an Executive Order that projects where at least 20 to 30 percent of the units
are affordable housing be provided concurrent review by the Planning Department, the Department of
Public Works, Mayor’s Office of Disability, Department of Building Inspection, and Fire Department
(Watty 2014).
A fast-track system reduces the amount of development time and, in turn, reduces costs associated
with holding land before construction begins (MITOD 2014). Fast-track permitting also provides
greater certainty so that developers can anticipate how long it takes to get the necessary permits, and
the increased ability to plan can also decrease costs of financing and development. Permits on the fast
track can include building permits, zoning permits, subdivision approvals, rezoning, certification, special
exception, variance, and other regulatory and land use requirements.
CASE STUDIES: CITIES OF SAN DIEGO AND AUSTIN
San Diego, CA, passed its Affordable Housing/In-Fill Housing and Sustainable Buildings Expedite
Program in 2003 “in an effort to produce more affordable housing in the shortest possible time and to
reduce development costs to the greatest extent” (City of San Diego 2003, 1).
Eligible projects: Eligible projects include residential developments with at least 10 percent of the
units set aside for renter households with incomes under 65 percent AMI or for homeowners under 100
percent AMI; residential developments receiving funding from the Comprehensive Affordable Housing
1 0 0 A F F O R D A B L E H O U S I N G N E E D S A S S E S S M E N T F O R T H E D I S T R I C T O F C O L U M B I A
Collaborative, where at least 15 percent of the units are for households with an income at or below 120
percent AMI; residential developments using federal, state, or local funds and have affordable units at
or below 60 percent AMI; in-fill housing developments in urbanized areas where all dwelling units are
affordable to households with an income at or below 150 percent AMI; and other residential properties
meeting specific requirements, such as military housing, sustainable properties meeting LEED
requirements, and mixed-use developments (City of San Diego 2013).
Expedited permits and process: Under the program, projects receive expedited permit process for
ministerial building permits and engineering approvals. Projects must go through a mandatory
preliminary review meeting where developers get early feedback about proposals prior to formal
design and full submittal of the application. The first review cycle must be completed within 20 business
days, and a project review meeting must be held within 10 days after the first review cycle. If applicable,
subsequent review cycles must also be completed within 10 business days. All applicable applicants will
automatically get a faster service than the standard turnaround time. However, for an additional fee
($500 per unit for all units in a project), developers can get even faster service.
Projects that opt out of requirements by paying in lieu fees may not get expedited permit
processing. For situations in which the program is at workload capacity, a list was created to give
priority to certain projects, beginning with affordable housing projects selected by the City Council;
residential developments that are considered both affordable housing and sustainable building;
properties getting 9 percent tax credit or multifamily revenue bonds; and other priorities.
In Austin, TX, the S.M.A.R.T. (Safe, Mixed-Income, Accessible, Reasonable-Priced, Transit-Oriented)
Housing Initiative is meant to foster and encourage housing for low- and moderate-income households
(City of Austin 2008).
Eligible projects: Developments must set aside at least 10 percent of the residential units (rental or
for sale) for households earning at or below 80 percent median family income and who spend no more
than 30 to 35 percent of the family income on housing. Properties must also be within one-quarter to
one-half mile of a bus route or provide approved alternate access to transit, be considered a green
building as defined by the City of Austin, and meet design standards.
Expedited permits and process: The Austin Housing Finance Corporation is responsible for
fostering partnerships with neighborhoods and developers to create projects. The Neighborhood
Housing and Community Development Department serves as the lead agency and single point of
contact that works with other city departments. Developers must have a presubmittal meeting with city
staff to establish a timeline that both city staffers and the development team must meet. The
A F F O R D A B L E H O U S I N G N E E D S A S S E S S M E N T F O R T H E D I S T R I C T O F C O L U M B I A 1 0 1
presubmittal meeting also reviews all aspects of the development, such as site plan, environmental
regulations, and subdivision requirements. The city must return comments to building plan reviews
within seven working days and corrected site plans within two working days. The priority status given
to applicable projects typically results in these projects completing subdivision and site plan reviews in
half the time it takes conventional projects (HUD 2004).
The program offers full or partial fee waivers for up to 1,500 service units based on a sliding scale of
the portion of affordable units in the project; if 40 percent of the rental or for sale units are affordable,
then 100 percent of the fees are waived. Waived fees include zoning, subdivision, site plan, public
works, building review and permit, inspections, traffic impact analysis, impact, and other fees.
Other examples: In Florida, the State Housing Initiatives Partnership program requires all counties
to offer expedited permitting for all affordable housing land use decisions.19
For example, per the Code
of Ordinances for Nassau County, Florida, all affordable housing developments that exceed the normal
permitting time limit must be given priority status over all other residential permits (Nassau County
2013). By state statute Chapter 40B, Massachusetts allows local Zoning Board of Appeals flexibility for
state rules for developments where 20 to 25 percent of the units are long-term affordable.20
To
facilitate affordable housing production, the four housing agencies in Massachusetts that are
authorized to review and approve site eligibility created a Design Handbook for subsidizing agencies.
The handbook provides information and guidance and sets consistent design standards that have been
agreed on by the authorizing agencies. Santa Fe County in New Mexico created a preapplication inquiry
to improve communications, speed up the permitting process, and allow for better tracking
Nonaffordable housing fast-track programs: There are models for fast-track programming for
nonhousing-related issues that DC can consider for their affordable housing goals. DC government
already has an expedited permit review for projects that are LEED certified at the Gold level or higher
whereby for applicable projects completed after October 1, 2008, the District Department of the
Environment must review applications not more than seven days after submission.21
The State of
Maryland also has a program called FastTrack that expedites state review to projects in targeted areas
that promote economic development, job creation, and smart growth.22
This program speeds up the
process by coordinating review by relevant state agencies; reviews also occur concurrently when
possible, further expediting the permitting process. As with Massachusetts’s program, the FastTrack
projects in Maryland also benefit from having a single contact person to walk the development projects
through the permit application process. Local jurisdictions can complement the state’s efforts. For
example, Charles County in Maryland allows projects that create at least 10 high-paying jobs or meet
other goals to receive expedited site plan review, development services, and building permits.23
1 0 2 A F F O R D A B L E H O U S I N G N E E D S A S S E S S M E N T F O R T H E D I S T R I C T O F C O L U M B I A
Recommendation 6: Improve coordination between different DC agencies
Developers must go through multiple agencies to build or preserve affordable housing. DMPED, DHCD,
Department of Consumer and Regulatory Affairs, District Department of the Environment, DC Water,
Office of Planning, Office of Zoning, and potentially more offices, depending on the project, may be
involved with funding, permitting, approval, and oversight of affordable housing projects. Although
working with different departments is an inevitable part of the development process, the experience of
navigating DC’s many requirements has been described as especially challenging by developers who
also develop housing outside of DC. Difficulties in communication between the developers and DC
staffers, as well as lack of interagency communication, have contributed to creating a difficult
development landscape. Many developers say that they must hire expeditors to walk the project
proposals through every department to obtain the necessary approvals.
One key complaint among developers is that, even though requirements from one department
might be dependent on a review or permit from another department, the various departments do not
always seem to coordinate with each other, resulting in an inefficient and time-consuming process. To
address these concerns, we recommend that DC improves the communication and coordination
between agencies, perhaps through the creation of an interagency group focused on specific goals, such
as affordable housing preservation. Another possible solution is to designate a single point of contact
for an affordable housing development project that coordinates all the different agencies and helps
move the project forward.
CASE STUDY: MASSACHUSETTS DEPARTMENT OF ENVIRONMENTAL PLANNING
One element of the Massachusetts Department of Environmental Planning’s fast-track permitting
system is the designation of a single point of contact to walk the project through the entire permitting
process.24
Projects are eligible if they have layers of permitting, promote smart growth and sustainable
development, or have state priority and interest. The program, which must first go through regional
offices, offers eligible projects expedited administrative and technical reviews and negotiated permit
schedules and fees.
A F F O R D A B L E H O U S I N G N E E D S A S S E S S M E N T F O R T H E D I S T R I C T O F C O L U M B I A 1 0 3
Other Recommendations
Recommendation 7: Increase agency capacity
Several developers in the affordable housing survey and in-depth interviews suggested that the
development environment could be improved with changes to staffing in DC agencies. Some developers
recommended that DC agencies hire additional staff to meet all the demands and requests from
developers for reviewing applications, permitting, and answering questions. Other developers were
concerned that departments lacked sufficient numbers of staff with competencies and experience in
finance, real estate, or development. Given the higher level of development activity taking place in DC
compared to a decade ago, the development environment could be improved by hiring additional staff
with appropriate qualifications and by improving staff training for interpretation of requirements,
standards, and tasks.
DC agencies could also consider hiring outside contractors to take over tasks when they have
identified a significant backlog (say, in permit reviews or technical assistance and guidance for
developers) because of a gap in staff capacity. Some cities that cannot or do not want to increase staff
size (e.g., if the surges in workload are temporary) outsource some of the tasks by hiring third-party
examiners. Third-party examiners are private contractors or organizations that often hold industry
certifications and licenses to practice in jurisdictions and that have been educated and trained in the
topic in which they currently work. Apportioning some of the tasks of reviewing applications to
qualified third parties may reduce the workload for DC agencies, avoid backlogs, and prevent delays.
As another option, some jurisdictions, including Chicago, New York City, and Phoenix, accept self-
certification, which allows professionals to certify that the building plans for a development project
they are working on are in compliance with regulations. Self-certification differs from hiring third
parties in that, with self-certification, the hired professional is working for the developer or is part of the
development team. To be eligible for self-certification, the professional may have to attend and pass a
training program.
CASE STUDY: NEW YORK CITY
New York City uses registered architects and professional engineers to certify building applications,
plans, and surveys for compliance. In fact, almost half of all building applications were self-certified in
2006; that is, developers chose to go to professional architects and engineers outside of city agencies to
1 0 4 A F F O R D A B L E H O U S I N G N E E D S A S S E S S M E N T F O R T H E D I S T R I C T O F C O L U M B I A
review building applications, plans, and surveys. These professionals provide the certification needed to
get the building permits approved. The developers chose to hire professional contractors in order to
bypass delays with the Department of Buildings. The Department audits 20 percent of self-
certifications for quality control.25
Recommendation 8: Create more opportunities to engage meaningfully with
developers
In addition to increased access to staff at DC agencies for project development, several key informants
wished for more opportunities for affordable housing developers to engage more meaningfully with DC
agencies, perhaps through public-private partnerships. Such partnerships pool resources, experience,
knowledge, and skills and also have the ability to build and maintain interests and priorities. Meaningful
engagement can take on many forms: goal- or issue-oriented task forces; operating support
collaboratives; city and developer partnerships over specific development projects; or program-based
partnerships (HUD 1996). Through regular, meaningful interactions, developers and DC agencies can
share with each other more feedback about the development process at large, share concerns, and
express goals.
DC already has several forums in which public agencies can solicit feedback from private
organizations. Established in 1990, the HPTF Advisory Board, comprising developers and affordable
housing experts, provides feedback to the mayor and DC agencies on the development, financing, and
operations of the HPTF. Whenever possible, the Advisory Board should be solicited for feedback on
other aspects of housing-related issues, including changes to regulations and administration, ways to
improve performance, and funding priorities. The Coalition for Non-Profit Housing and Economic
Development brings together public, private, and nonprofit entities working on affordable housing in
DC. DC also already partners with community housing development organizations that offer training
and services to DC programs.
DC should consider how it can build on and deepen these existing relationships and also
incorporate a broader community of developers and community-based organizations in its affordable
housing programs and policy discussions. In addition, DC should consider reaching out to and/or
partnering with other public and private organizations, including ones concerning economic
development, health, and education, as these issues are often intertwined with housing needs.
A F F O R D A B L E H O U S I N G N E E D S A S S E S S M E N T F O R T H E D I S T R I C T O F C O L U M B I A 1 0 5
CASE STUDIES: PENNSYLVANIA’S COMMONWEALTH HOUSING FORUM AND THE VERMONT
DEVELOPER CONFERENCE
Pennsylvania’s Housing Financing Agency hosts a biennial forum that brings together all the
stakeholders in Pennsylvania’s housing industry to learn about trends in the industry and meet with one
another. The forum has speakers representing housing development, community development, finance,
government, and business (Pennsylvania Housing Finance Agency 2014). Workshop sessions covering a
variety of topics from mortgage finance to legislation are held, and networking opportunities in the
evening allow for developers, financiers, and government officials to meet with one another informally.
Boston’s Mayor Thomas Menino brought together a group of developers and affordable housing
advocates to look at the city’s linkage program, which required that commercial developments over a
certain size pay fees that fund affordable housing and job creation. The expert input and buy-in
achieved in these gatherings led to a home rule petition that went to the City Council, then the state
legislature, and ultimately increased the affordable housing linkage fee and standardized the rate for
Household composition by age Households with one or more persons under 18 years 20% 15% 7% 16% 27% 23% 17% 30% 38% Households with one or more persons 65 years or older 20% 13% 14% 24% 30% 27% 17% 26% 16%
Households with one or more persons under 18 years 7% 20% 12% 18% 2% 5% 10% 9% 10% 31% 28% 11% 25% Households with one or more persons 65 years or older 11% 13% 15% 22% 22% 7% 11% 13% 23% 33% 31% 23% 32%
65 years and over 12% 8% 8% 10% 10% 18% 17% 11% 9% 8% 24% 6% 6% 14%
Household composition by age
Households with one or more persons under 18 years 6% 12% 25% 23% 28% 26% 24% 21% 29% 24% 19% 19% 17% 18% Households with one or more persons 65 years or older 20% 19% 39% 26% 27% 36% 38% 20% 26% 20% 38% 15% 17% 19%
Households with one or more persons under 18 years 39% 51% 32% 36% 30% 37% 23% 18% 40% 47% 45% 34% 36% Households with one or more persons 65 years or older 18% 26% 19% 29% 24% 25% 28% 29% 11% 16% 13% 17% 19%
Additional sources of household income Households with retirement income 15% 6% 8% 9% 12% 16% 6% 6% 8% 16% 24% 24% 18% 20% Households with Supplemental Security income 5% 2% 4% 3% 0% 0% 1% 3% 4% 6% 3% 2% 1% 1% Households with TANF/welfare income 4% 1% 4% 1% 1% 0% 0% 1% 4% 3% 1% 0% 1% 1% Households with SNAP/food stamp benefits 14% 3% 13% 6% 1% 2% 2% 6% 15% 10% 4% 0% 2% 1%
Geographic mobility over past year by poverty status
Population 1 year and over for whom poverty status is determined 565,127 17,555 45,638 10,774 14,150 9,389 17,241 23,278 12,261 11,680 12,237 11,412 16,395 14,888
Below 100 percent of poverty level 103,979 1,118 7,533 1,673 1,701 2,484 1,988 2,946 2,540 1,499 718 577 1,335 1,492 Moved within DC 16% 18% 14% 14% 18% 19% 18% 7% 19% 6% 9% 15% 25% 18% Moved from different state 9% 11% 6% 12% 19% 38% 30% 16% 17% 2% 9% 19% 18% 27% Moved from abroad 2% 15% 3% 2% 5% 9% 4% 3% 0% 1% 16% 19% 4% 3%
100 to 149 percent of poverty level 41,699 606 4,964 365 487 291 710 1,718 1,100 768 144 244 297 190 Moved within DC 11% 0% 9% 18% 11% 7% 5% 10% 12% 5% 0% 6% 19% 0% Moved from different state 7% 19% 7% 0% 20% 25% 17% 7% 6% 8% 28% 37% 18% 27% Moved from abroad 2% 6% 1% 0% 7% 0% 7% 4% 2% 1% 0% 0% 7% 0%
Additional sources of household income Households with retirement income 13% 14% 29% 20% 18% 30% 37% 11% 18% 15% 27% 11% 16% 10% Households with Supplemental Security income 0% 1% 4% 4% 5% 3% 3% 7% 10% 11% 8% 5% 2% 12% Households with TANF/welfare income 0% 1% 2% 2% 3% 3% 1% 4% 8% 8% 5% 2% 2% 6% Households with SNAP/food stamp benefits 1% 2% 2% 12% 12% 14% 10% 18% 22% 30% 18% 10% 6% 17%
Geographic mobility over past year by poverty status
Population 1 year and over for whom poverty status is determined 10,958 11,934 4,236 19,570 39,209 11,922 8,632 18,032 8,932 14,437 11,317 30,148 17,443 5,886
Below 100 percent of poverty level 1,106 876 155 2,963 6,207 2,056 931 3,457 1,874 4,887 1,668 4,049 1,156 1,832 Moved within DC 19% 14% 0% 7% 21% 7% 8% 18% 5% 13% 11% 14% 17% 4% Moved from different state 37% 25% 11% 8% 3% 9% 3% 12% 4% 7% 2% 9% 11% 12% Moved from abroad 5% 10% 0% 1% 1% 0% 5% 1% 0% 0% 1% 4% 3% 0%
100 to 149 percent of poverty level 225 360 55 2,473 3,346 1,195 726 1,245 626 1,453 1,151 2,057 488 391 Moved within DC 46% 12% 0% 6% 16% 21% 15% 5% 2% 10% 9% 18% 4% 2% Moved from different state 14% 24% 0% 4% 7% 3% 0% 10% 6% 2% 1% 11% 10% 29% Moved from abroad 0% 17% 0% 1% 1% 0% 0% 1% 0% 1% 0% 3% 6% 0%
1 2 6 A P P E N D I X A
TABLE A.12 CONTINUED
Cluster 14
Cluster 15
Cluster 16
Cluster 17
Cluster 18
Cluster 19
Cluster 20
Cluster 21
Cluster 22
Cluster 23
Cluster 24
Cluster 25
Cluster 26
Cluster 27
Above 149 percent of poverty level 9,627 10,697 4,026 14,133 29,656 8,671 6,975 13,330 6,432 8,097 8,498 24,042 15,799 3,663 Moved within DC 11% 5% 1% 5% 8% 6% 4% 8% 6% 13% 4% 11% 8% 18% Moved from different state 6% 10% 2% 5% 4% 3% 2% 6% 5% 6% 7% 10% 7% 10% Moved from abroad 1% 2% 0% 0% 0% 0% 0% 1% 0% 1% 0% 2% 1% 1%
TABLE A. 13
Employment Status by Clusters 14–27, 2008–12
Cluster 14
Cluster 15
Cluster 16
Cluster 17
Cluster 18
Cluster 19
Cluster 20
Cluster 21
Cluster 22
Cluster 23
Cluster 24
Cluster 25
Cluster 26
Cluster 27
Population 16 years and over 10,516 11,362 3,498 16,976 33,064 11,552 7,861 15,919 7,322 12,705 9,913 26,877 18,530 5,150
Extremely low income households (<=30% AMI) 59,090 6,622 6,216 3,578 5,884 8,697 7,349 9,754 11,031 Paying less than 30% of income 19% 17% 11% 7% 16% 20% 27% 21% 21% Paying 30%–50% of income 16% 17% 10% 3% 20% 18% 15% 21% 18% Paying 50% or more of income 57% 56% 62% 73% 55% 56% 54% 52% 55%
Very low income households (>30% and <=50% AMI) 32,300 3,477 2,872 2,504 4,825 4,286 3,435 5,298 5,631 Paying less than 30% of income 37% 29% 20% 12% 36% 45% 43% 46% 40% Paying 30%–50% of income 38% 46% 37% 32% 34% 35% 35% 36% 48% Paying 50% or more of income 25% 25% 43% 55% 30% 20% 21% 17% 11%
Low income households (>50% and <=80% AMI) 21,110 2,619 2,317 2,313 3,008 2,793 2,152 2,902 2,968 Paying less than 30% of income 57% 58% 31% 31% 58% 65% 55% 77% 72% Paying 30%–50% of income 29% 30% 40% 45% 23% 24% 35% 21% 22% Paying 50% or more of income 13% 12% 28% 24% 19% 10% 10% 2% 6%
Middle income households (>80% and <=100% AMI) 22,225 3,049 2,816 3,462 2,340 3,232 2,501 2,896 1,903 Paying less than 30% of income 61% 66% 44% 36% 70% 66% 61% 76% 82% Paying 30%–50% of income 29% 25% 37% 52% 19% 24% 30% 21% 16% Paying 50% or more of income 10% 9% 19% 12% 12% 11% 9% 3% 2%
High income households (>100% AMI) 122,590 16,383 23,146 26,152 13,485 10,787 20,609 6,750 5,266 Paying less than 30% of income 85% 84% 83% 87% 85% 84% 85% 90% 88% Paying 30%–50% of income 13% 15% 14% 11% 12% 15% 14% 9% 11% Paying 50% or more of income 2% 1% 2% 1% 3% 2% 1% 1% 1%
Households experiencing one or more housing problems 104,695 13,074 14,478 12,736 11,986 13,206 12,705 12,603 13,922
Disability Household member has a hearing or vision impairment 7% n/a n/a n/a n/a n/a n/a n/a n/a Household member has an ambulatory limitation 12% n/a n/a n/a n/a n/a n/a n/a n/a Household member has a cognitive limitation 9% n/a n/a n/a n/a n/a n/a n/a n/a Household member has a self-care or independent living limitation 9% n/a n/a n/a n/a n/a n/a n/a n/a
Income <=30% of AMI 42% 38% 31% 22% 37% 50% 41% 58% 59% >30% and <= 50% of AMI 20% 20% 16% 17% 27% 19% 16% 23% 25% >50% and <= 80% of AMI 9% 9% 11% 12% 12% 8% 8% 6% 8% >80% and <= 100% of AMI 9% 10% 12% 17% 7% 9% 8% 6% 3% >100% of AMI 19% 24% 30% 31% 18% 14% 27% 6% 5%
1 3 6 A P P E N D I X A
TABLE A.27
Washington, DC, Housing by Clusters 1–16
City Cluster
1 Cluster
2 Cluster
3 Cluster
4 Cluster
5 Cluster
6 Cluster
7 Cluster
8 Cluster
9 Cluster
10 Cluster
11 Cluster
12 Cluster
13 Cluster
14 Cluster
15 Cluster
16
Total housing units 296,671 11,734 21,327 6,044 7,684 7,981 12,037 14,542 8,586 8,403 5,128 4,937 9,948 7,360 8,235 7,144 1,726
Median ,monthly owner costs (owner with mortgage), 2008–12 ($) 1,596 1,607 2,352 1,649 1,715 1,395 1,665
Gross rent as % of household income in the past 12 months, 2008–12
Renter-occupied housing units 3,298 2,142 2,281 2,423 3,203 8,692 1,764 Less than 10.0 percent 3% 3% 5% 7% 2% 4% 0% 10.0 to 14.9 percent 5% 9% 2% 8% 7% 6% 4% 15.0 to 19.9 percent 12% 19% 8% 10% 8% 9% 9% 20.0 to 24.9 percent 11% 12% 5% 8% 9% 11% 8% 25.0 to 29.9 percent 9% 9% 13% 9% 13% 11% 11% 30.0 to 34.9 percent 7% 5% 8% 14% 5% 8% 5% 35.0 to 39.9 percent 6% 8% 10% 4% 8% 6% 8% 40.0 to 49.9 percent 10% 12% 8% 7% 12% 11% 12% 50.0 percent or more 32% 17% 30% 28% 30% 31% 30% Not computed 6% 6% 11% 5% 6% 5% 14%
TABLE A.40
Owner Costs as % of Household Income in the Past 12 Months (Units with Mortgages), 2008–12
Cluster 34
Cluster 35
Cluster 36
Cluster 37
Cluster 38
Cluster 39
Noncluster area
Owner-occupied housing units with a mortgage 2,405 1,157 367 407 594 2,294 293 Less than 10.0 percent 5% 1% 2% 19% 6% 5% 1% 10.0 to 14.9 percent 12% 11% 8% 5% 6% 11% 4% 15.0 to 19.9 percent 11% 9% 9% 11% 25% 19% 13% 20.0 to 24.9 percent 14% 19% 0% 5% 6% 9% 16% 25.0 to 29.9 percent 14% 15% 6% 7% 6% 9% 28% 30.0 to 34.9 percent 9% 10% 20% 11% 13% 7% 3% 35.0 to 39.9 percent 9% 7% 2% 4% 10% 8% 1% 40.0 to 49.9 percent 8% 8% 13% 6% 11% 9% 2% 50.0 percent or more 19% 21% 41% 32% 17% 21% 27% Not computed 0% 0% 0% 0% 0% 2% 4%
1 5 0 A P P E N D I X A
TABLE A.41
Housing Cost Burden, 2008–10
Cluster 34
Cluster 35
Cluster 36
Cluster 37
Cluster 38
Cluster 39
Noncluster area
Paying 30%–50% of income
Owned 26% 25% 35% 21% 34% 24% 6%
Rented 23% 25% 25 24% 24% 25% 25%
Paying more than 50% of income
Owned 19% 21% 41% 32% 17% 21% 27%
Rented 32% 17% 30% 28% 30% 31% 30%
A P P E N D I X A 1 5 1
TABLE A.42
Housing Cost Burden by Income Band (Renters and Owners), 2006–10
Cluster 34
Cluster 35
Cluster 36
Cluster 37
Cluster 38
Cluster 39
Noncluster area
All households 6,528 3,829 2,595 2,890 3,686 10,879 2,225
Extremely low income households (<=30% AMI) 1,924 950 1,339 1,356 1,646 4,366 553 Paying less than 30% of income 11% 7% 13% 29% 20% 24% 12% Paying 30%–50% of income 11% 33% 25% 20% 12% 21% 11% Paying 50% or more of income 73% 53% 54% 43% 62% 49% 66%
Very low income households (>30% and <=50% AMI) 1,059 660 469 548 876 2,520 390 Paying less than 30% of income 39% 33% 31% 64% 29% 40% 32% Paying 30%–50% of income 48% 33% 58% 28% 62% 49% 33% Paying 50% or more of income 13% 34% 12% 8% 9% 11% 34%
Low income households (>50% and <=80% AMI) 800 365 310 320 310 1,097 288 Paying less than 30% of income 69% 63% 56% 66% 61% 80% 50% Paying 30%–50% of income 26% 37% 27% 25% 39% 16% 41% Paying 50% or more of income 6% 0% 16% 9% 0% 4% 9%
Middle income households (>80% and <=100% AMI) 655 484 173 180 256 771 169 Paying less than 30% of income 74% 70% 69% 86% 92% 84% 64% Paying 30%–50% of income 22% 29% 17% 14% 8% 16% 26% Paying 50% or more of income 4% 1% 14% 0% 0% 1% 11%
High income households (>100% AMI) 2,090 1,370 305 485 599 2,125 824 Paying less than 30% of income 83% 91% 79% 96% 78% 93% 81% Paying 30%–50% of income 16% 7% 15% 4% 22% 6% 19% Paying 50% or more of income 0% 1% 7% 0% 0% 0% 0%
Households experiencing one or more housing problems 3,059 1,675 1,742 1,287 2,229 5,328 1,100
Disability Household member has a hearing or vision impairment n/a n/a n/a n/a n/a n/a n/a Household member has an ambulatory limitation n/a n/a n/a n/a n/a n/a n/a Household member has a cognitive limitation n/a n/a n/a n/a n/a n/a n/a Household member has a self-care or independent living limitation n/a n/a n/a n/a n/a n/a n/a
Income <=30% of AMI 53% 48% 64% 70% 56% 58% 39% >30% and <= 50% of AMI 21% 26% 19% 16% 30% 29% 24% >50% and <= 80% of AMI 9% 8% 10% 9% 6% 7% 14% >80% and <= 100% of AMI 6% 9% 3% 2% 1% 2% 6% >100% of AMI 12% 9% 4% 3% 7% 4% 17%
6. What are your organization’s main programmatic efforts? (Check all that apply)
Develop market-rate housing
Develop affordable housing
Develop affordable housing for special populations (e.g., homeless, elderly, disabled, etc.)
Provide case management and/or supportive services
Advocacy
Other (specify)
Development Portfolio
7. Where are your organization’s affordable housing developments located?
District of Columbia only
Washington DC metropolitan region
Regional (e.g., Mid-Atlantic, east coast)
Nationwide
For Q.8–Q.12, please answer for residential units in developments that your organization has completed within
the last 5 years, meaning the development has received its certificate of occupancy. We recognize that many
developments will fall into multiple categories.
All Developments (skip and go to next column if all
developments are in DC) Developments in Washington, DC 8. How many total residential units are in completed projects?
Less than 50
51-99
100-250
251-800
More than 800
Less than 50
51-99
100-250
251-800
More than 800
9. What percent of the total units in your completed developments were affordable housing?
0%
1-25%
26-50%
51-75%
76-99%
100%
0%
1-25%
26-50%
51-75%
76-99%
100%
A P P E N D I X D 1 7 3
10. Of the affordable housing developments that you have completed within the District of Columbia,
for how many developments have you received federal subsidies? (e.g., LIHTC, CDBG, HOME)
All
More than half
Less than half
None
11. Of the affordable housing developments that you have completed within the District of Columbia, for how many developments have you received local subsidies? (e.g., HPTF, IZ, ADU)
All
More than half
Less than half
None
12. Of the affordable housing developments that you have completed within the District of Columbia, if you applied for local/federal subsidies and were denied, what were the reasons for the denial? (Check all that apply)
Did not meet threshold criteria (e.g., lacked site control, zoning approval, or regulatory
eligibility)
Application incomplete
Project was not economically or financially feasible
Development/management team lacked capacity or expertise
Project did not align with city’s policy objectives
Project did not adequately leverage other funding sources
Other (specify):
For Q.13 Q.18, answer for residential developments currently in your pipeline.
Projects in Pipeline: All the developments in between the stage of having begun spending
predevelopment funds but not having yet received a certificate of occupancy (CO). For example, projects
where you have begun spending predevelopment funds, but have not had had subsidies and no CO, or
projects that have had federal/local subsidies but no CO, would fall in this category. We recognize that
many developments will fall into multiple categories.
How many developments does your organization currently have in its pipeline?
All Developments (skip and go to next column if all
developments are in DC) Developments in Washington,
DC 13. How many developments does your organization currently have in its pipeline?
0 1-3 4-10 More than 10
1-3 4-10 More than 10
13a. How many of these developments will include affordable housing?
0 1-3 4-10 More than 10
0 1-3 4-10 More than 10
1 7 4 A P P E N D I X D
14. What is the total number of planned residential units?
Less than 50 51-99 100-250 251-800 More than 800
Less than 50 51-99 100-250 251-800 More than 800
15. How many of the planned residential units will be affordable housing?
All More than half Less than half None
All More than half Less than half None
16. Of the affordable housing developments in your pipeline within the District of Columbia, for how many developments have you received federal subsidies? (e.g., LIHTC, CDBG, HOME)
a. All
b. More than half
c. Less than half
d. None
17. Of the affordable housing developments in your pipeline within the District of Columbia, for
how many developments have you received local subsidies? (e.g., HPTF,IZ,ADU)
a. All
b. More than half
c. Less than half
d. None
18. Of the affordable housing developments in your pipeline within the District of Columbia, if
you applied for local/federal subsidies and were denied, what were the reasons for the
denial? (Check all that apply)
a. Did not meet threshold criteria (e.g., lacked site control, zoning approval, or
regulatory eligibility)
b. Application incomplete
c. Project was not economically or financially feasible
d. Development/management team lacked capacity or expertise
e. Project did not align with city’s policy objectives
f. Project did not adequately leverage other funding sources
g. Other (specify):
A P P E N D I X D 1 7 5
Challenges
19. In your opinion, what factors limit the production of affordable housing in the District of Columbia? (Check all that apply)
Challenges Does not limit
production
Limits production marginally
Limits production
significantly Don’t know
Costs Acquisition Costs are high
Construction Costs are high
Operating Costs for property management are high
Funding Availability
Insufficient predevelopment funding
Insufficient gap-financing (private)
Insufficient gap-financing (local sources)
Insufficient gap-financing (federal sources)
Insufficient gap-financing (philanthropic)
Insufficient availability of funding for supportive services
Process of Obtaining Funding
Process of accessing private capital is very long/difficult
Process of accessing gap financing is very long/difficult (local sources only)
Process of accessing gap financing is not transparent (local sources only)
Timeliness of receiving funding from local government
Underwriting standards are too high/not transparent
DC Regulations Permitting process is too arduous/ not transparent/ too long
Land Use and Zoning Regulations not supportive
Lack of staff capacity in District of Columbia agencies
1 7 6 A P P E N D I X D
Other Getting site control is too difficult
Neighborhood opposition
Insufficient availability of vouchers and subsidies for tenants
Insufficient availability of supportive services
Other:
20. What is the biggest challenge to financing affordable housing developments in DC?
21. What is the biggest challenge to receiving the necessary permitting and other regulatory requirements for affordable housing developments in DC?
22. What would help you get your DC affordable housing developments completed more quickly?
A P P E N D I X D 1 7 7
23. What part of the affordable housing development process is most difficult to finance without public assistance? (Check one)
a. Acquisition
b. Pre-development
c. Construction d. Permanent financing e. None f. Other:
24. Do any of the following limit your organizations’ capacity to apply for and complete additional affordable housing development? (Check all that apply)
a. Lack of staff
b. Lack of equity to fund predevelopment
c. Lack of equity to invest in projects d. None e. Other:
25. What type of affordable housing construction is most difficult within the District of Columbia? (Check one)
a. New construction is more difficult b. Rehab is more difficult c. Both are equally difficult
d. Not sure
e. Other:
26. [For supportive housing developers only] What do you see as the scarcest resource for PSH in the District of Columbia? (Check one)
a. Funding for development (capital) b. Funding for operations c. Funding for services d. Other:
Good morning/afternoon. This is [interviewer’s name] from the Urban Institute, a non-profit research
organization based in Washington, DC. As part of the Mayor’s affordable housing initiative, we are
conducting an Affordable Housing Assessment for the DC Office of the Deputy Mayor for Planning and
Economic Development (DMPED). The purpose of this study is to help DMPED understand how the city
can better support developers building and preserving affordable housing units. Thank you for taking
the time to speak with me today.
Before we begin, I would like to reassure you that the information you share in this interview will be
kept private. That means your individual answers will not be shared with anyone outside the research
team working on our report, including anyone at DMPED, DHCD or any other city agency. When we
report our findings, we will combine information from everyone we interview and present it in a way
that individual answers cannot be easily identified. Every effort will be made by the research team to
preserve your privacy by not using your name, the name of your program, or any other identifying
information that can be linked to a specific comment in our report.
We want to be sure that you freely consent to participate in this interview and that you understand
there won’t be any consequences to you or your program/office if you choose not to participate or not
answer some of our questions. Do you consent to participate in the interview?
(If yes, note time. If no, address concerns and explore possibility of participation. If will not
participate, ask if there is another person in their organization that they can recommend.)
We will also be taking notes and, with your permission, recording audio. Again, this information is
for evaluation team purposes only, and we will not be sharing these notes or recordings with anyone
outside of the evaluation team. Do we have your permission to record the interview? Do you have any
questions before we begin?
1. How long have you been with the organization and what is your role?
2. a. How long have you been involved in developing or preserving affordable housing within the district?
b. [LIKELY FOR-PROFIT ONLY] How do you decide whether to include affordable housing in your developments?
1 8 0 A P P E N D I X E
3. a. During this time, have any aspects of developing or preserving affordable housing in the District become less difficult? If so, what?
b. Has anything become more difficult? What?
4. Do you typically do projects involving developing new affordable housing units or
preserving existing units or an equal mix of both?
5. In your opinion is new development or preservation more difficult in DC? Why?
6. Do you have experience with affordable housing developments in other areas besides DC?
If yes, what makes working in DC more or less difficult than other areas?
Now, I’d like to refer to some of your responses from the short form survey that you took on the internet.
7. a. In the web survey, you listed [REFER TO SHORT FORM SURVEY] as something that significantly limits affordable housing production in DC. How does it limit production? Please discuss briefly.
b. What could DC government do to improve its process for funding affordable housing?
8. a. In the web survey, you listed [REFER TO SHORT FORM SURVEY] as one of the biggest challenges to receiving the necessary permitting and other regulatory requirements. Why is this a challenge? Please discuss briefly.
b. What can DC do to make this process easier for affordable housing developers?
9. In the web survey, you suggested that [REFER TO SHORT FORM SURVEY] would help to your DC affordable housing developments completed more quickly. How might it help? Please discuss briefly.
10. a. Generally, how do you decide when to partner with another organization or
consultant on a development?
b. Do you ever have difficulty finding a partner with the necessary skills or assets you are looking for?
Now I would like to ask you questions about your organizations’ development goals for the future.
11. You stated in your survey that you have [REFER TO SHORT FORM SURVEY] in your pipeline.
Given your current capacity, do you think you have the capacity to build more affordable
housing in the next 5 years than is currently in your pipeline?
12. What would your organization need to significantly increase its capacity to develop or preserve affordable housing in DC?
13. What would make your organization more likely to develop or preserve additional affordable housing units in the future?
A P P E N D I X E 1 8 1
14. What would make your organization less likely to develop or preserve additional
affordable housing units in the future?
15. Do you have any additional recommendations for how the DC government could make it
easier to build or preserve additional affordable housing units?
1 8 2 A P P E N D I X F
Appendix F
Profile of Respondents to Affordable
Housing Developer Survey
TABLE F.1
Size of Organization
Organization size Number of
respondents % 1 to 10 26 43 11 to 40 14 23 41 to 100 6 10 Over 100 14 23 All 6o 100
Source: DMPED Affordable Housing Survey, 2014. Question text: “How big is your organization?
Note: One respondent chose not to answer this question. This number represents the number of unique organizations
represented in the survey.
TABLE F.2
Main Programmatic Efforts
Main programmatic effort Number of
respondents % Develop affordable housing 47 81 Develop housing for special pops 26 45 Develop market-rate housing 20 35 Provide case mgmt/supportives services 15 26 Advocacy 10 17 Total respondents 58 100
Source: DMPED Affordable Housing Survey, 2014. Question text: “What are your organization’s main programmatic efforts?
Check all that apply.”
Note: One respondent chose not to answer this question. Respondents may select multiple answers. The percentages reflect the
percent of organizations where one or more respondent identified each category as a main programmatic effort.
A P P E N D I X F 1 8 3
TABLE F.3
Location of Affordable Housing Developments
Location Number of
respondents %
DC 33 55
Metro 9 15
Region 10 16.67
Nationwide 8 13.33
All 60 100
Source: DMPED Affordable Housing Survey, 2014. Question text: “Where are your organization’s affordable housing
developments located?”
Note: Respondents must select one answer. This number represents the number of unique organizations represented in the
survey.
TABLE F.4
Total Units Completed in DC in Past 5 Years
Number of units Number of
respondents % Less than 50 18 32
51 to 99 4 7
100 to 250 17 30
251 to 800 9 16 More than 800 8 14
Total 56 100
Source: DMPED Affordable Housing Survey, 2014. Question text: “How many total residential units are in completed projects?”
Note: Not all survey respondents answered the question. This number represents the number of unique organizations
represented in the survey.
1 8 4 A P P E N D I X F
TABLE F.5
Portion of Total Completed Units in Past 5 Years That Is Affordable
Amount of affordable units Number of
respondents %
All 34 62 More than half 8 15
Less than half 9 16
None 4 7 Total 55 100
Source: DMPED Affordable Housing Survey, 2014. Question text: “What percent of the total units in your completed
developments were affordable housing?”
Note: Not all survey respondents answered the question. This number represents the number of unique organizations
represented in the survey.
TABLE F.6
Developments Funded with Federal and Local Subsidies
Portion of total completed
developments that used subsidies
Federal Subsidies Local Subsidies
Number of respondents %
Number of respondents %
All 26 46 24 42
More than Half 16 29 18 32
Less than Half 6 11 7 12
None 8 14 8 14
Total 56 100 57 100
Source: DMPED Affordable Housing Survey, 2014. Question text: “Of the affordable housing developments that you have
completed within the District of Columbia, for how many developments have you received federal subsidies? (e.g., LIHTC, CDBG,
HOME)?” and “Of the affordable housing developments that you have completed within the District of Columbia, for how many
developments have you received local subsidies? (e.g., HPTF, IZ, ADU)”
Note: Not all survey respondents answered the two questions. This number represents the number of unique organizations
represented in the survey.
A P P E N D I X F 1 8 5
TABLE F.7
Pipeline of Developments in DC with Affordable Housing
Number of developments Number of
respondents %
None (0) 4 7
1 to 3 32 58
4 to 10 15 27
More than 10 4 7
Total 55 100
Source: DMPED Affordable Housing Survey, 2014. Question text: “How many developments does your organization currently
have in its pipeline?
Note: Not all survey respondents answered these questions. This number represents the number of unique organizations
represented in the survey.
TABLE F.8
Number of Total Units in DC Pipeline (Market and Affordable Units)
Number of units Number of
respondents %
Less than 50 13 25
51 to 99 8 15
100 to 250 12 23
251 to 800 13 25
More than 800 6 12
Total 52 100
Source: DMPED Affordable Housing Survey, 2014. Question text: “What is the total number of planned residential units?”
Note: Not all survey respondents answered these questions. This number represents the number of unique organizations
represented in the survey.
1 8 6 A P P E N D I X F
TABLE F.9
Portion of Total Units in DC Pipeline That Are Affordable
Amount affordable Number of
respondents %
All 25 50
More than half 13 26
Less than half 11 22
None 1 2
Total 50 100
Source: DMPED Affordable Housing Survey, 2014. Question text: “How many of the planned residential units will be affordable
housing?”
Note: Not all survey respondents answered these questions. This number represents the number of unique organizations
represented in the survey.
N O T E S 1 8 7
Notes Current electronic records of rent control throughout the District are limited, and thus it is not possible to 1.
construct a definitive list of rent control properties. This estimate of units and properties potentially subject to rent control was created using the methodology Tatian and Williams (2014) developed.
By formula, the low-income limit for a four-person household in the Washington, DC, metropolitan area is 2.$85,600. However, by rule, the HUD income limit may not exceed the US median family income level, which was $63,900 for FY 2014. Because the DC metro area qualifies as a high housing-cost area, the HUD low-income limit is adjusted upward from the US median, which leads to an income limit of $68,500. This report uses the HUD low-income limit (i.e., the capped limit) to determine which households are considered low income and what housing units are affordable to them. Some local DC programs, such as inclusionary zoning and affordable dwelling units, use the uncapped limit for determining household income eligibility.
Brigid Schulte, “Winter Homelessness among D.C. Families Called ‘Catastrophic.’” Washington Post, February 3.3, 2014, accessed December 24, 2014, http://www.washingtonpost.com/local/winter-homelessness-among-dc-families-called-catastrophic/2014/02/03/de58a346-8d21-11e3-833c-33098f9e5267_story.html.
Multifamily Assistance and Section 8 Contracts data are updated monthly, and the Insured Multifamily 4.Mortgages database is updated quarterly. Other databases, including Physical Inspection Scores and 202 Direct Loans data, are updated less often. The Preservation Catalog pulls relevant information from these databases including basic property and ownership information, the subsidy’s start and end dates, and the number of assisted and total units. In collaboration with the DC Preservation Network, notes are added to assisted properties in the Preservation Catalog describing further their preservation needs and challenges.
Peter Tatian and Serena Lei, "Housing," Our Changing City, (Urban Institute, 2014), 5.http://datatools.urban.org/features/OurChangingCity/housing/index.html.
These estimates come from Urban Institute analysis of 2009–11 American Community Survey Public Use 6.Microdata from the University of Minnesota Integrated Public Use Microdata Series.
For the most part, tenant-based rental subsidies operate on a sliding scale in which households pay 30 percent 7.of their income toward rent and the DC Housing Authority pays the difference between the household’s rent contribution and the full market rent. Rent subsidies make housing affordable to all income levels, so for the purpose of these projections all available units are assigned to extremely low income households. However, in practice, some rental subsidies go to very low income households.
To estimate the affordability level of affordable units in the pipeline when that information was missing, we 8.imputed based on the proportion of units affordable at each income level for units in the pipeline when that information was known.
For example, developers that receive a Low-Income Housing Tax Credit agree to set aside either 20 percent of 9.their units to households at or below 50 percent of AMI or 40 percent of their units to households at or below 60 percent of AMI.
Aaron Weiner, “Council Passes Bill Requiring Affordable Housing on Public Land, Over Gray’s Objection,” 10.Washington City Paper, October 28, 2014, http://www.washingtoncitypaper.com/blogs/housingcomplex/2014/10/28/council-passes-bill-requiring-affordable-housing-on-public-land-over-grays-objection/.
Because this analysis is based on the 10×20 database, it is possible that it excludes some residential properties 11.on city-owned land that do not include any affordable units.
Because some respondents chose not to answer every question, the number of respondents for each survey 12.question (the “N” value) differs. In some cases, multiple respondents representing the same agency took the survey. For the findings in this section, we only included one survey per unique organization.
The sum of respondents or respondent organizations in each table does not necessarily add up to the sum of 13.total respondents/organizations because respondents had the option of skipping any survey question they did not wish to answer.
1 8 8 N O T E S
Completion was defined as having received a certificate of occupancy. 14.
Projects in Pipeline include all the developments where you have spent pre-development funds but have not 15.yet received a certificate of occupancy. This would include, for example, projects where you have begun spending pre-development funds, but have not had subsidies or a CO, or projects that have had federal/local subsidies but no CO. (This language is reproduced from the survey.)
This number includes several respondents from the same organization. 16.
DCHD, “Spring FY14 Consolidated Request for Proposals and Applications,” accessed March 5, 2015, 17.http://dhcd.dc.gov/page/spring-fy-2014-consolidated-request-proposals-and-applications.
The DHCD spring 2014 RFPs have the following targeted geographic areas for Neighborhood Corridors: Ward 18.1 (Park Road/Mount Pleasant Street/Upper Georgia Avenue); Ward 4 (Upper Georgia Avenue); Ward 5 (wardwide); Ward 7 (Deanwood and wardwide); and Ward 8 (wardwide). New Communities target areas are Ward 1 (Park Morton); Ward 6 (Northwest One); Ward 7 (Lincoln Heights/Richardson Dwellings); and Ward 8 (Barry Farms).
Jaime A. Ross, “Ensuring Expedited Permits for Affordable Housing,” Foresight, Fall 1999, accessed December 19.24, 2014, http://www.1000friendsofflorida.org/building-better-communities/affordable-housing/ensuring-expedited-permits-for-affordable-housing/.
Commonwealth of Massachusetts, “MassDEP Fast Track Permitting,” Executive Office of Energy and 20.Environmental Affairs, accessed December 24, 2014, http://www.mass.gov/eea/agencies/massdep/service/approvals/massdep-fast-track-permitting.html.
“Expedited Permit Review,” DC Municipal Regulations and DC Register Section 20-3512, 2014, 21.http://dc.eregulations.us/rule/20-3512.
Maryland Made Easy, “FastTrack,” State of Maryland, accessed December 24, 2014, 22.http://easy.maryland.gov/fasttrack/.
Charles County Government, “Permit Expedite/Fast Track.” Charles County, Maryland, Economic 23.Development, accessed December 24, 2014, http://www.charlescountymd.gov/ed/permit-expeditefast-track.
Executive Office of Energy and Environmental Affairs, “MassDEP Fast Track Permitting,” Commonwealth of 24.Massachusetts, accessed March 5, 2015, http://www.mass.gov/eea/agencies/massdep/service/approvals/massdep-fast-track-permitting.html.
HousingPolicy.org, "Improve the Speed and Consistency of Local Review Processes," last modified August 7 25.2014, accessed March 11, 2015, http://www.housingpolicy.org/toolbox/strategy/policies/expedite_permitting.html?tierid=29.
References Chapman, Hilary, Sophie Mintier, and Greg Goodwin. 2013. Homelessness in Metropolitan Washington: Results
and Analysis from the 2013 Point-in-Time Count of Homeless Persons in the Metropolitan Washington Region. Washington, DC: Metropolitan Washington Council of Governments. http://www.mwcog.org/uploads/pub-documents/qF5cX1w20130508134424.pdf.
City of Austin. 2008. “S.M.A.R.T. Housing Policy Resource Guide.” Neighborhood Housing and Community Development. http://www.austintexas.gov/sites/default/files/files/Web_version_SMART_Guide_7-1-08.pdf.
City of Boston. 2014. “Neighborhood Housing Trust.” Department of Neighborhood Development. https://dnd.cityofboston.gov/portal/v1/contentRepository/Public/dnd%20pdfs/HousingDevelopment/NHT_Report_2014.pdf.
City of San Diego. 2003. “Council Policy on Affordable/In-Fill Housing and Sustainable Buildings Expedite Program.” Policy Number 600-27. May 20. http://www.sandiego.gov/development-services/pdf/news/cp600-27.pdf.
City of San Diego. 2013. “Affordable/In-Fill Housing & Sustainable Buildings.” City of San Diego Development Services. http://www.sandiego.gov/development-services/pdf/industry/infobulletin/ib538.pdf.
Chapter 22.902 Cooperative Conversion, Seattle Municipal Code, https://www.municode.com/library/wa/seattle/codes/municipal_code?nodeId=13857.
DC Preservation Network. 2014. “Maintaining Economic Diversity and Affordability: A Strategy for Preserving Affordable Housing in the District of Columbia.” Preservation Strategy Working Group.
DHPD (Department of Housing and Preservation Development), “Tenant Interim Lease Apartment Purchase Program,” City of New York, accessed December 24, 2014, http://www.nyc.gov/html/hpd/html/developers/til.shtml.
Hendey, Leah, Peter A. Tatian, Graham MacDonald. 2014. Housing Security in the Washington Region. Washington, DC: Urban Institute. http://www.urban.org/publications/413161.html.
HUD (US Department of Housing and Urban Development). 1996. “Building Public-Private Partnerships to Develop Affordable Housing.” Washington, DC: US Department of Housing and Urban Development. http://portal.hud.gov/hudportal/HUD?src=/program_offices/comm_planning/affordablehousing/library/modelguides/1996/1583.
———. 2004. “S.M.A.R.T. Housing As a Tool to Reduce Regulatory Barriers for Housing, As a Component of Smart
Growth.” Washington, DC: US Department of Housing and Urban Development. http://www.huduser.org/rbc/pdf/AustinSMART.pdf.
———. 2012. “Sheltered Homeless Persons in Washington, DC: October 1, 2011-September 30, 2012.”
Washington, DC: US Department of Housing and Urban Development. http://www.hudhdx.info/PublicReports.aspx.
———. 2014. “Homeless Populations and Subpopulations.” HUD’s 2014 Continuum of Care Homeless Assistance Programs. Washington, DC: US Department of Housing and Urban Development. https://www.hudexchange.info/reports/CoC_PopSub_CoC_DC-500-2014_DC_2014.pdf
Minnesota Housing Research. 2006. Development Costs and Gap Funding for New Construction Assisted by Minnesota Housing, 2003-2005. St. Paul: Minnesota Housing Finance Agency. http://www.mnhousing.gov/idc/groups/secure/documents/admin/mhfa_004269.pdf.
Pennsylvania Housing Finance Agency. 2014. Commonwealth Housing Forum Overview. December 2014, accessed January 20, 2015. http://housingforum.phfa.org/.
Permanent Supportive Housing Production Committee. 2013. Presentation to the DC Interagency Council on Homelessness. April 29. http://ich.dc.gov/node/495512.
Shinn, Marybeth, Andrew L. Greer, Jay Bainbridge, Jonathan Kwon, and Sara Zuiderveen. "Efficient Targeting of Homelessness Prevention Services for Families." American journal of public health 103, no. S2 (2013): S324-S330.
Tatian, Peter A., and Elizabeth Oo. 2014. “Affordable Housing Needs Assessment: Phase 1.” Washington, DC: Urban Institute. http://www.urban.org/publications/2000017.html.
Tatian, Peter A., and Ashley Williams. 2014. A Rent Control Report for the District of Columbia. Washington, DC: Urban Institute. http://www.urban.org/publications/412347.html.
US Census Bureau. 2013. “Annual Estimates of the Population for the United States, Regions, States, and Puerto Rico: April 1, 2010 to July 1, 2013 (NST-EST2013-01).” Washington, DC: US Census Bureau. http://www.census.gov/popest/data/state/totals/2013/index.html.
Virginia Housing Development Authority. 2013. Low-Income Housing Tax Credit Qualified Allocation Plan. Richmond: Virginia Housing Development Authority. http://www.vhda.com/about/Planning-Policy/Pages/LIHTC-QAP.aspx.
Watty, Elizabeth. 2014. "Executive Directive 13-01- Status Update." Memo to Planning Commissioners. San Francisco Planning Department. May 8. Accessed from http://commissions.sfplanning.org/cpcpackets/Executive%20Directive%20Status%20Update.pdf.