29
HOUSING AND LABOR MARKET TRENDS: CALIFORNIA Community Development Research Federal Reserve Bank of San Francisco January 2012
HOUSING AND LABOR MARKET TRENDS: CALIFORNIA
Community Development Research Federal Reserve Bank of San Francisco
January 2012

National Trends
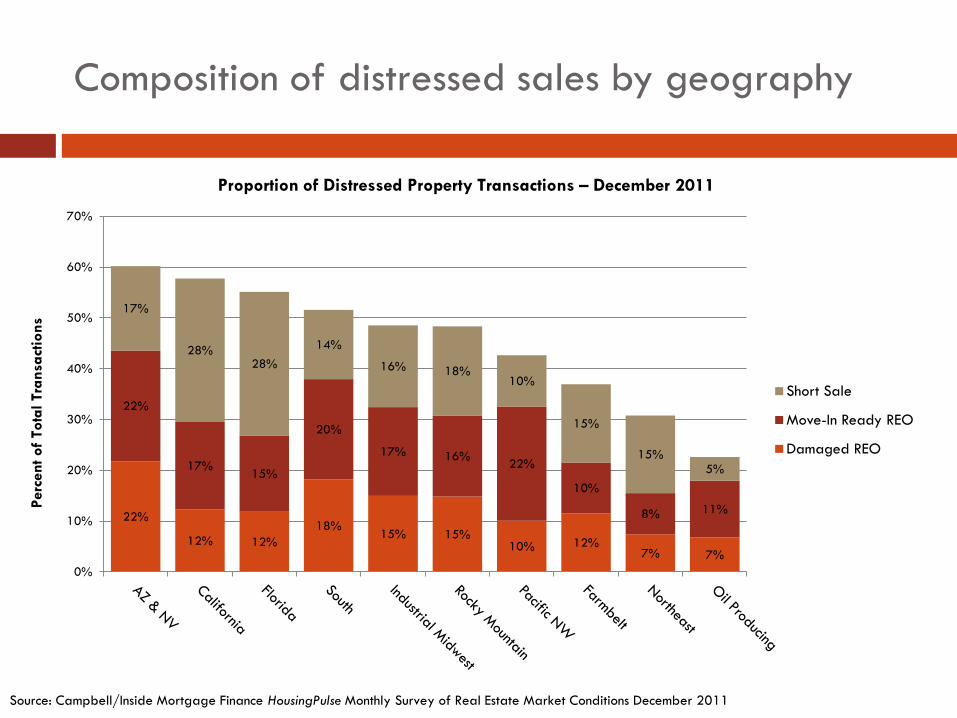
Composition of distressed sales by geography
22%
12% 12% 18%
15% 15% 10% 12%
7% 7%
22%
17% 15%
20%
17% 16% 22%
10%
8% 11%
17%
28% 28%
14%
16% 18% 10%
15%
15% 5%
0%
10%
20%
30%
40%
50%
60%
70%
Short Sale
Move-In Ready REO
Damaged REO
Proportion of Distressed Property Transactions – December 2011
Perc
ent o
f To
tal T
rans
actio
ns
Source: Campbell/Inside Mortgage Finance HousingPulse Monthly Survey of Real Estate Market Conditions December 2011
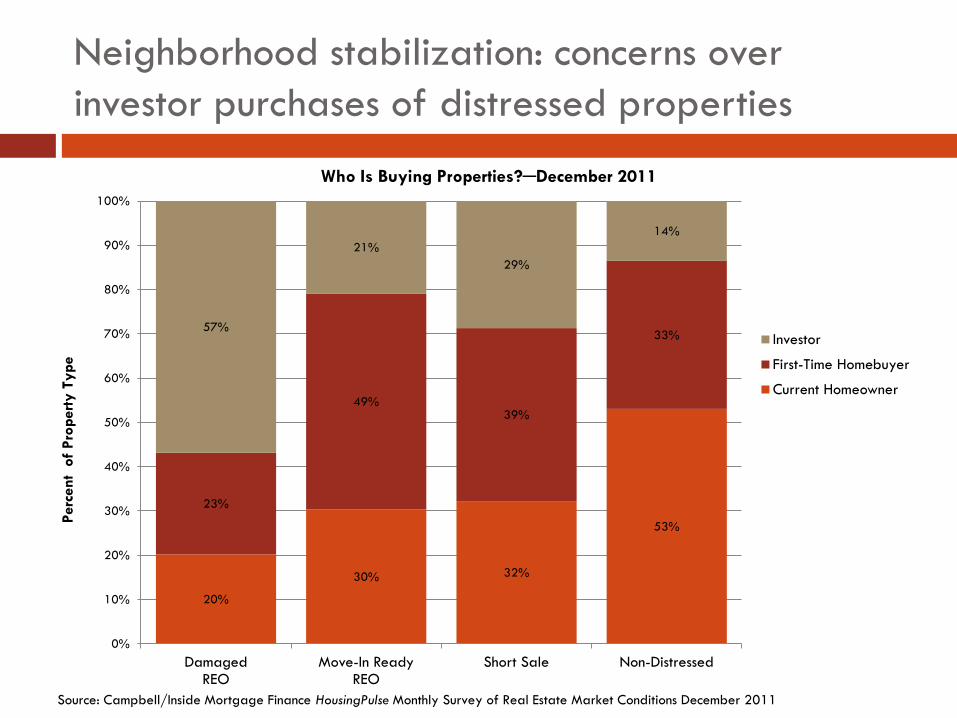
Neighborhood stabilization: concerns over investor purchases of distressed properties
20%
30% 32%
53%
23%
49% 39%
33% 57%
21% 29%
14%
0%
10%
20%
30%
40%
50%
60%
70%
80%
90%
100%
Damaged REO
Move-In Ready REO
Short Sale Non-Distressed
Investor
First-Time Homebuyer
Current Homeowner
Perc
ent
of P
rope
rty T
ype
Who Is Buying Properties?─December 2011
Source: Campbell/Inside Mortgage Finance HousingPulse Monthly Survey of Real Estate Market Conditions December 2011
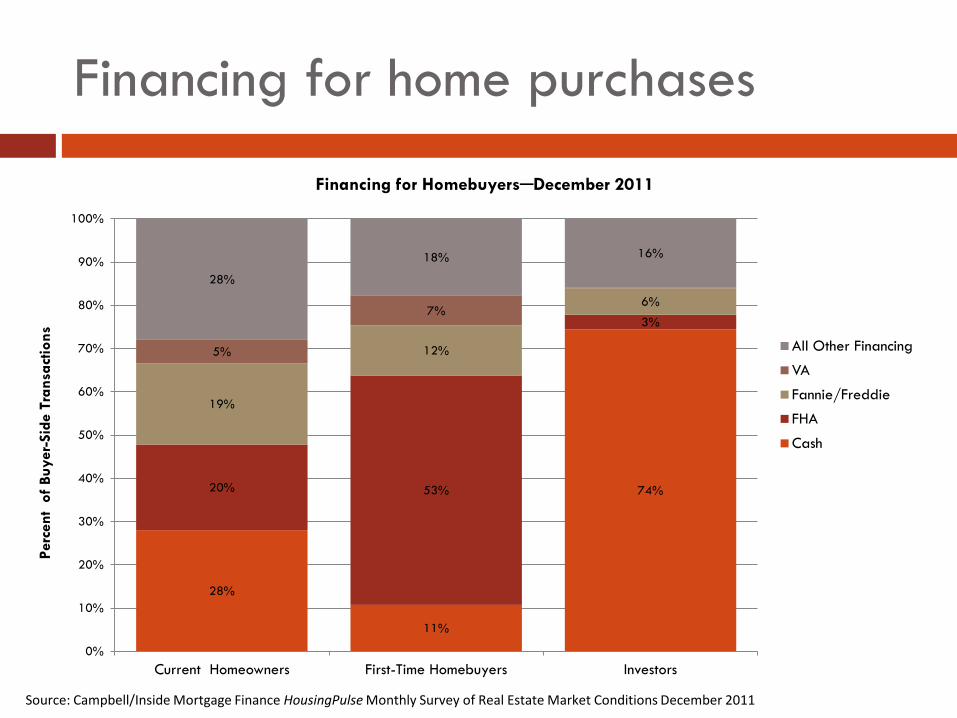
Financing for home purchases
28%
11%
74% 20% 53%
3%
19%
12%
6%
5%
7%
28%
18% 16%
0%
10%
20%
30%
40%
50%
60%
70%
80%
90%
100%
Current Homeowners First-Time Homebuyers Investors
All Other Financing
VA
Fannie/Freddie
FHA
Cash
Perc
ent
of B
uyer
-Sid
e Tr
ansa
ctio
ns
Financing for Homebuyers─December 2011
Source: Campbell/Inside Mortgage Finance HousingPulse Monthly Survey of Real Estate Market Conditions December 2011
California Trends
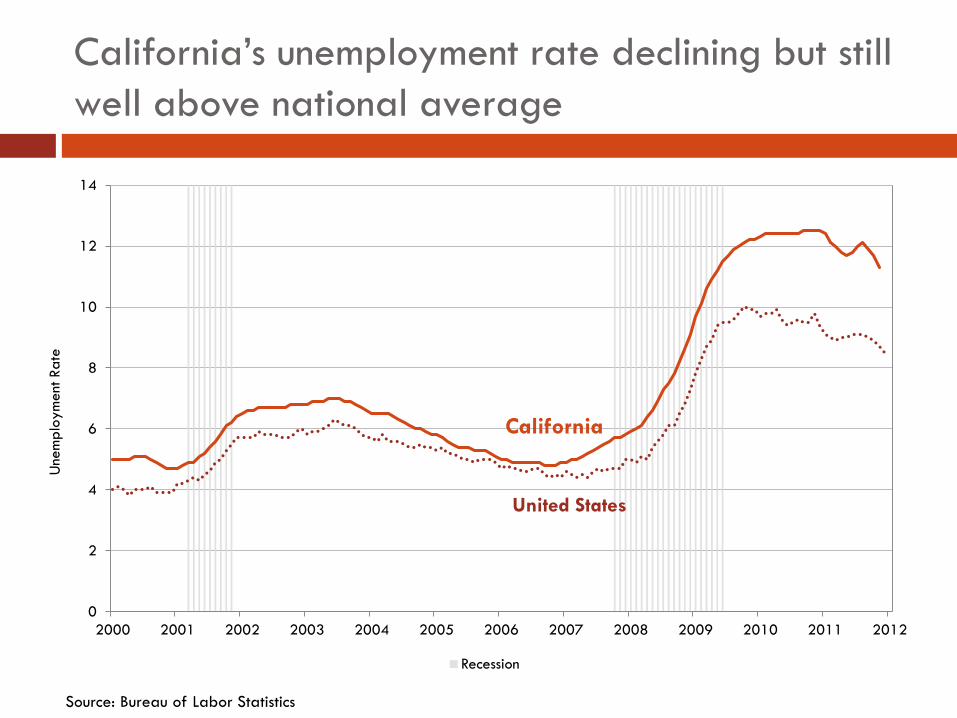
California’s unemployment rate declining but still well above national average
Source: Bureau of Labor Statistics
0
2
4
6
8
10
12
14
2000 2001 2002 2003 2004 2005 2006 2007 2008 2009 2010 2011 2012
Recession
Une
mpl
oym
ent R
ate
United States
California
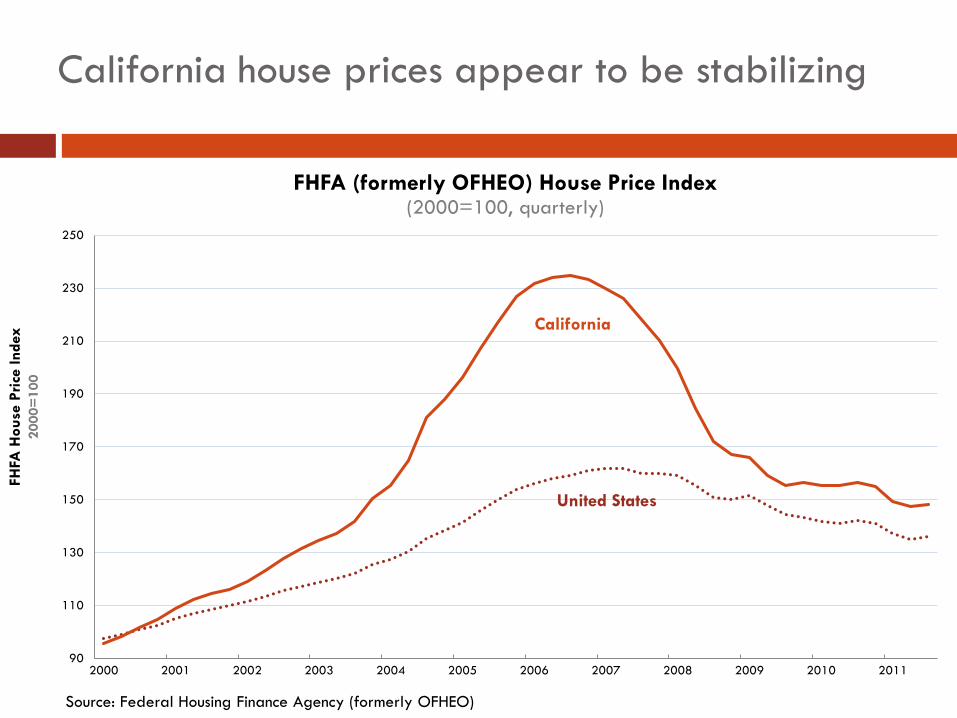
California house prices appear to be stabilizing
Source: Federal Housing Finance Agency (formerly OFHEO)
FHFA
Hou
se P
rice
Inde
x 20
00=
100
90
110
130
150
170
190
210
230
250
2000 2001 2002 2003 2004 2005 2006 2007 2008 2009 2010 2011
FHFA (formerly OFHEO) House Price Index (2000=100, quarterly)
California
United States
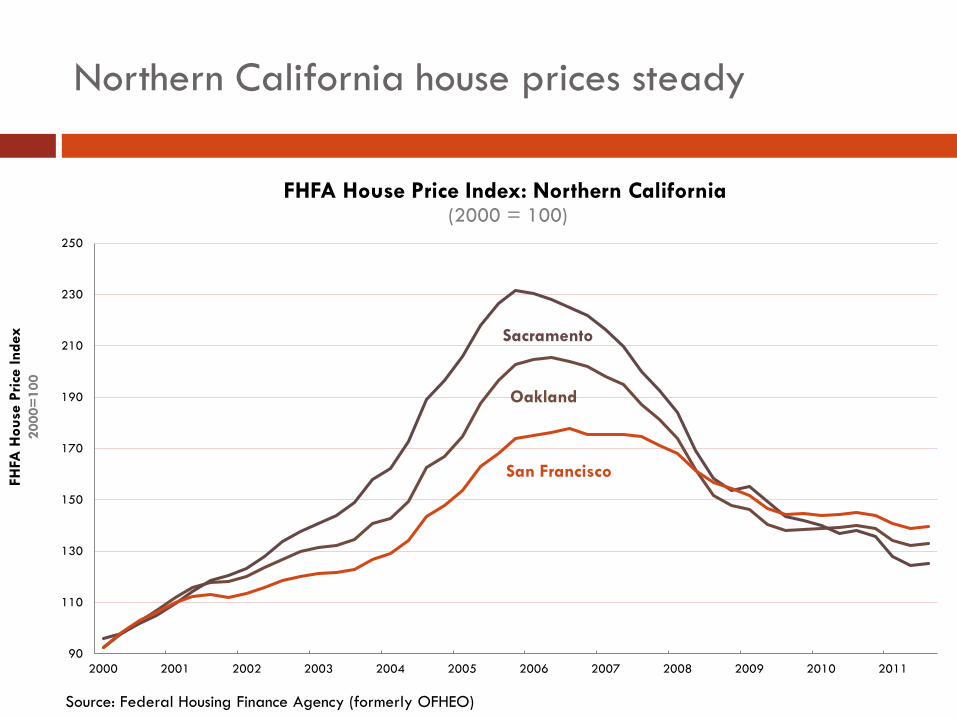
Northern California house prices steady
Source: Federal Housing Finance Agency (formerly OFHEO)
FHFA
Hou
se P
rice
Inde
x 20
00=
100
90
110
130
150
170
190
210
230
250
2000 2001 2002 2003 2004 2005 2006 2007 2008 2009 2010 2011
FHFA House Price Index: Northern California (2000 = 100)
Oakland
Sacramento
San Francisco
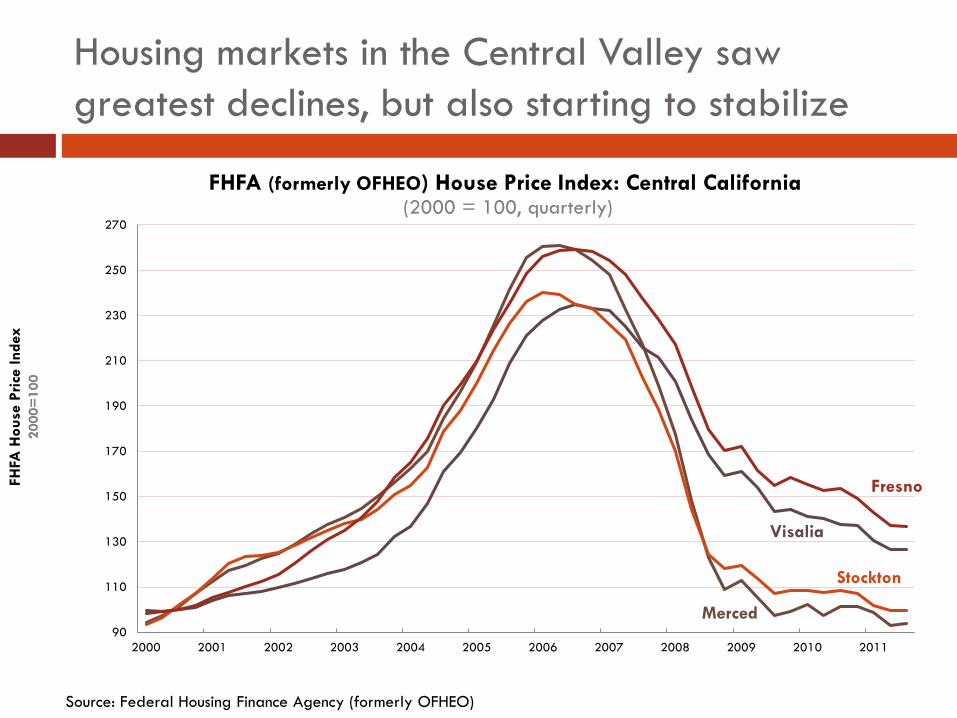
Housing markets in the Central Valley saw greatest declines, but also starting to stabilize
Source: Federal Housing Finance Agency (formerly OFHEO)
FHFA
Hou
se P
rice
Inde
x 20
00=
100
90
110
130
150
170
190
210
230
250
270
2000 2001 2002 2003 2004 2005 2006 2007 2008 2009 2010 2011
FHFA (formerly OFHEO) House Price Index: Central California (2000 = 100, quarterly)
Fresno
Merced
Stockton
Visalia
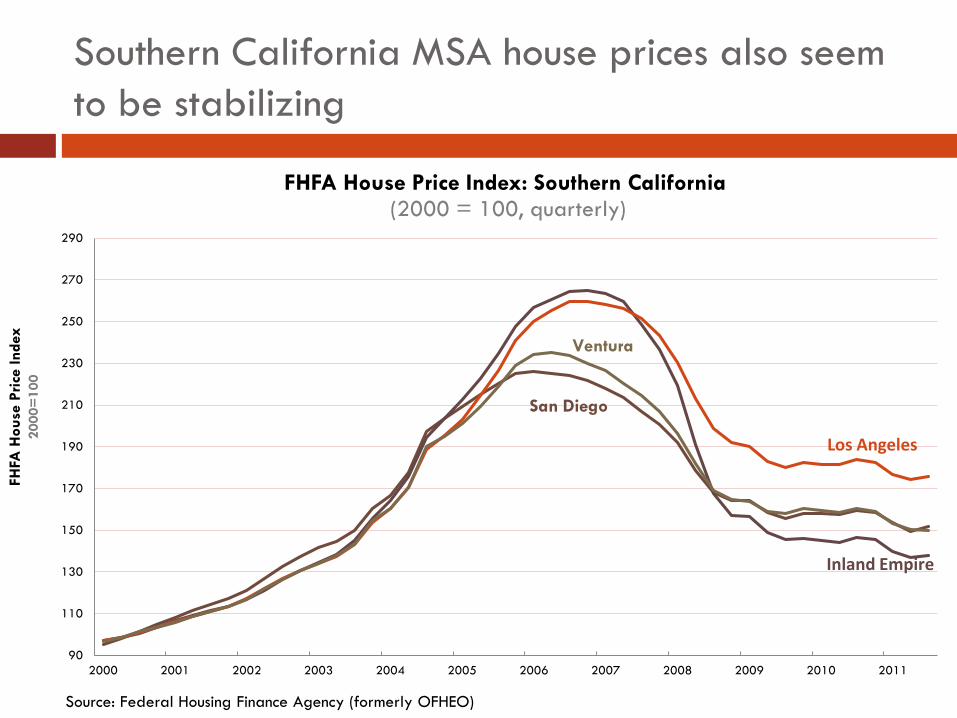
Source: Federal Housing Finance Agency (formerly OFHEO)
FHFA
Hou
se P
rice
Inde
x 20
00=
100
Southern California MSA house prices also seem to be stabilizing
90
110
130
150
170
190
210
230
250
270
290
2000 2001 2002 2003 2004 2005 2006 2007 2008 2009 2010 2011
FHFA House Price Index: Southern California (2000 = 100, quarterly)
San Diego
Inland Empire
Los Angeles
Ventura

Number of properties in foreclosure increased slightly at the end of 2011
Source: Mortgage Bankers Association, National Delinquency Survey
0
100,000
200,000
300,000
400,000
500,000
600,000
700,000
800,000
2005 2006 2007 2008 2009 2010 2011
Num
ber o
f M
ortg
ages
Loans in Foreclosure All Mortgages Past Due
State & Local Data Maps
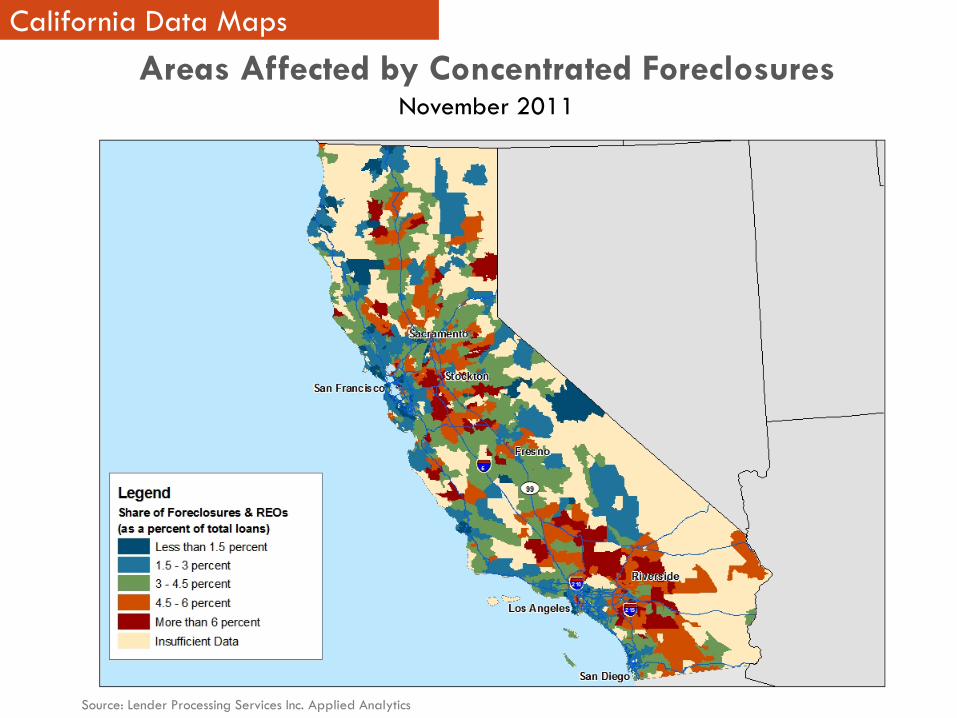
California Data Maps
Source: Lender Processing Services Inc. Applied Analytics
Areas Affected by Concentrated Foreclosures November 2011
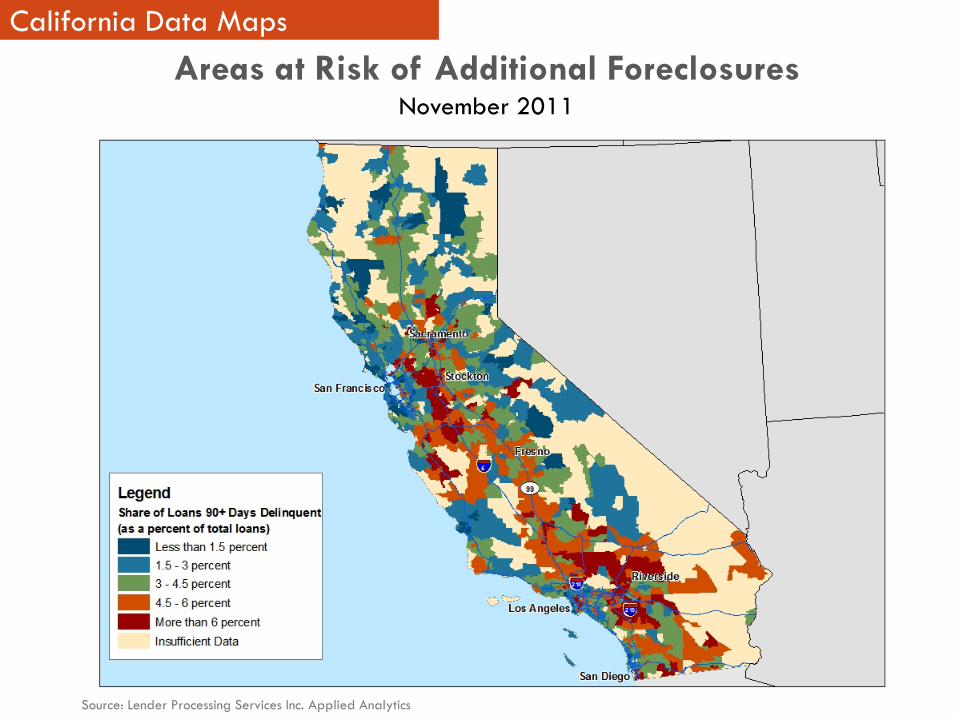
California Data Maps
Source: Lender Processing Services Inc. Applied Analytics
Areas at Risk of Additional Foreclosures November 2011
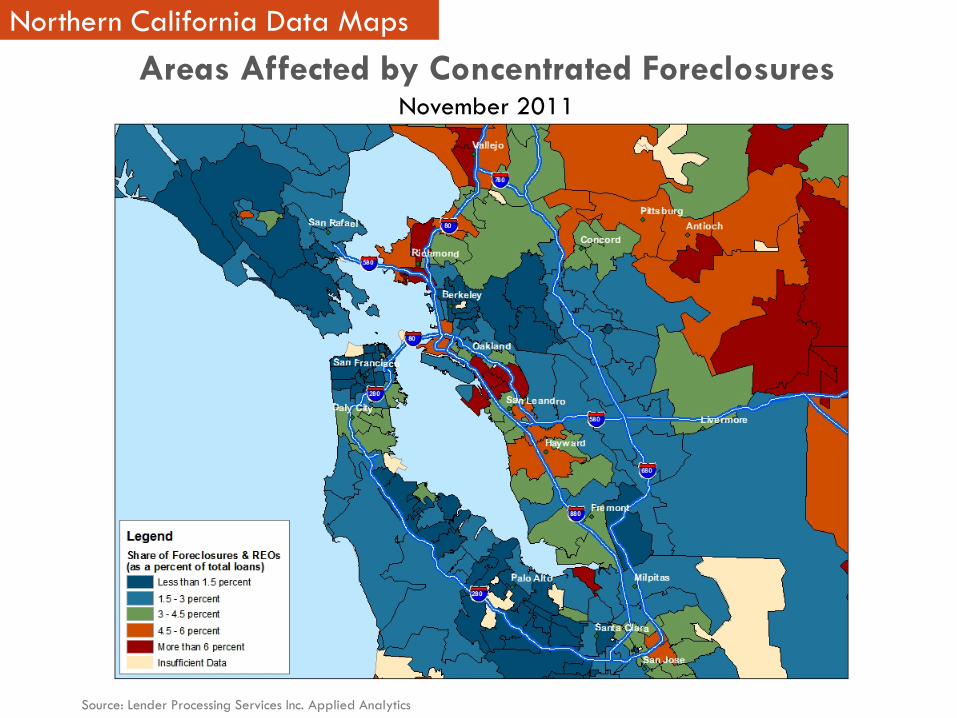
Northern California Data Maps
Source: Lender Processing Services Inc. Applied Analytics
Areas Affected by Concentrated Foreclosures November 2011
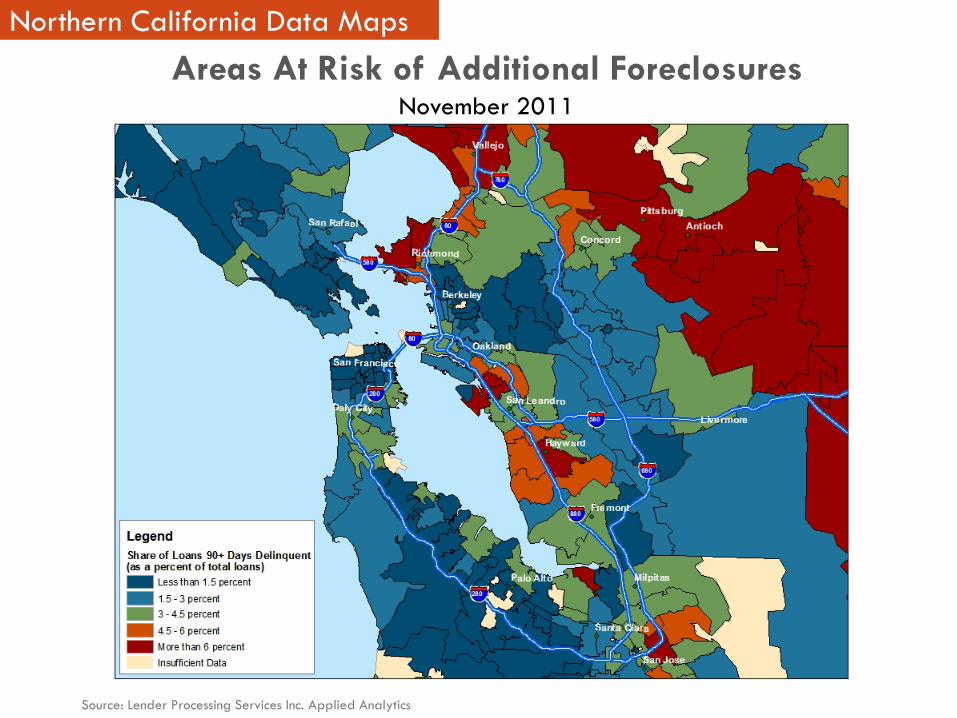
Northern California Data Maps
Source: Lender Processing Services Inc. Applied Analytics
Areas At Risk of Additional Foreclosures November 2011
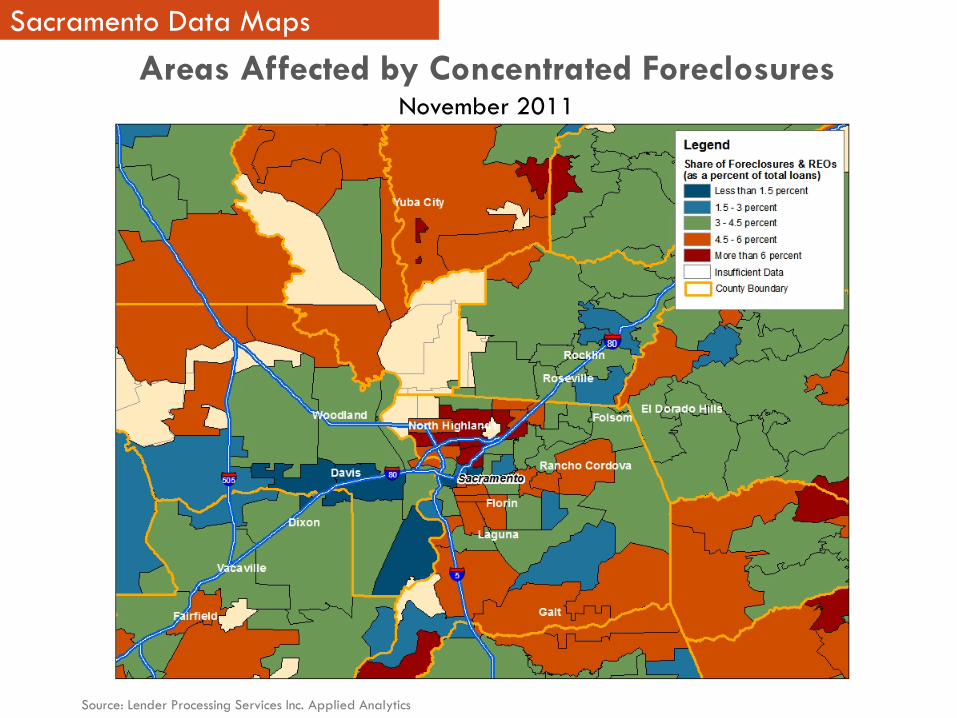
Sacramento Data Maps
Source: Lender Processing Services Inc. Applied Analytics
Areas Affected by Concentrated Foreclosures November 2011
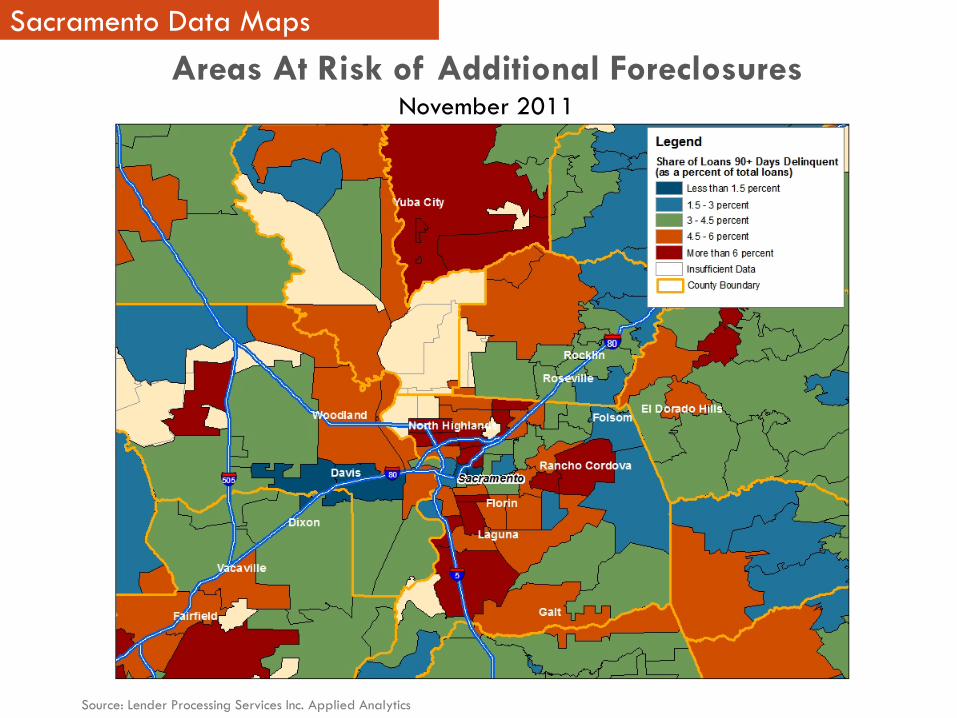
Sacramento Data Maps
Source: Lender Processing Services Inc. Applied Analytics
Areas At Risk of Additional Foreclosures November 2011
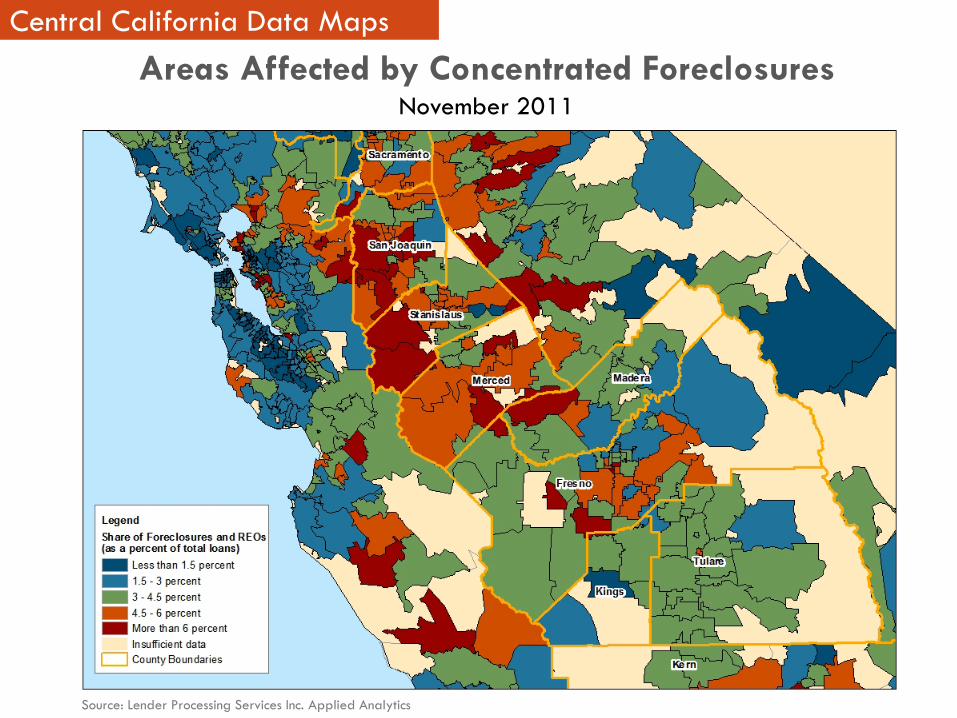
Central California Data Maps
Source: Lender Processing Services Inc. Applied Analytics
Areas Affected by Concentrated Foreclosures November 2011
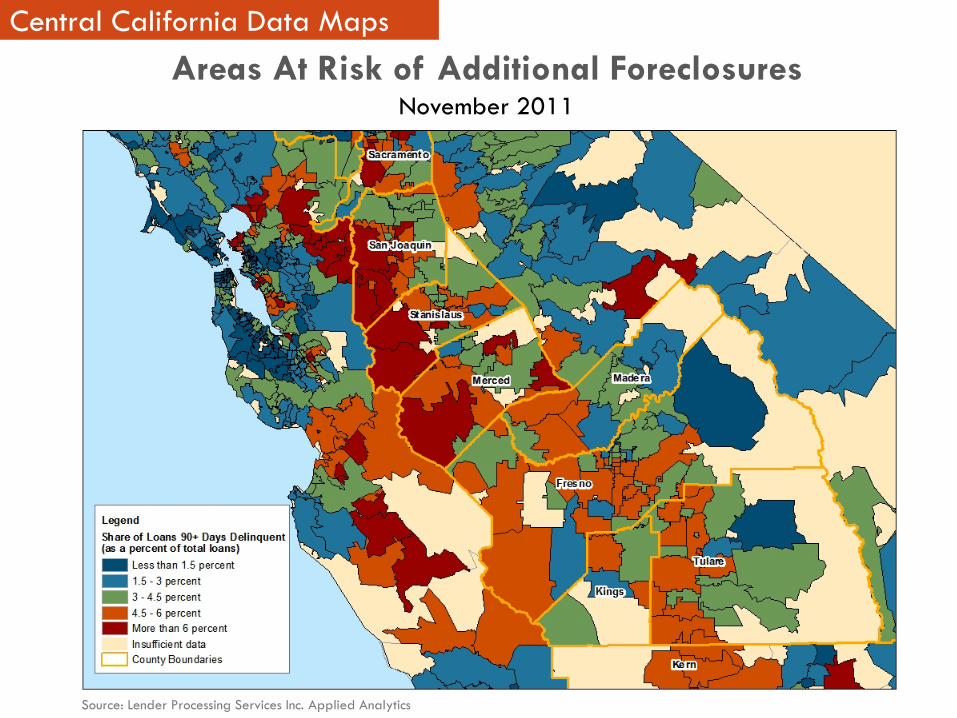
Central California Data Maps
Source: Lender Processing Services Inc. Applied Analytics
Areas At Risk of Additional Foreclosures November 2011

Southern California Data Maps
Source: Lender Processing Services Inc. Applied Analytics
Areas Affected by Concentrated Foreclosures November 2011

Southern California Data Maps
Source: Lender Processing Services Inc. Applied Analytics
Areas At Risk of Additional Foreclosures November 2011
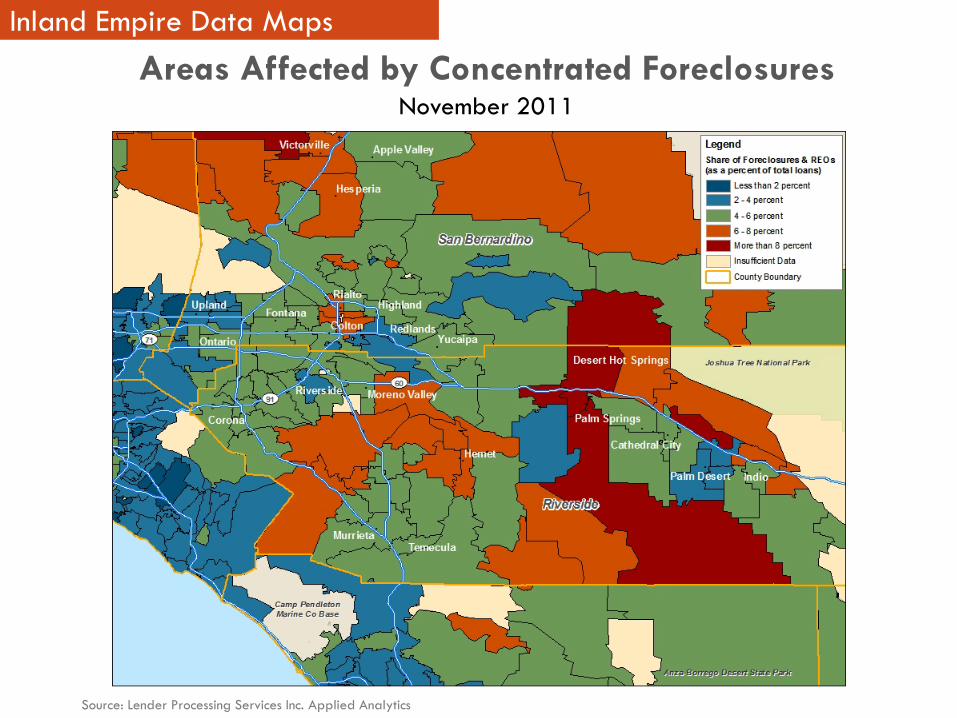
Inland Empire Data Maps
Source: Lender Processing Services Inc. Applied Analytics
Areas Affected by Concentrated Foreclosures November 2011
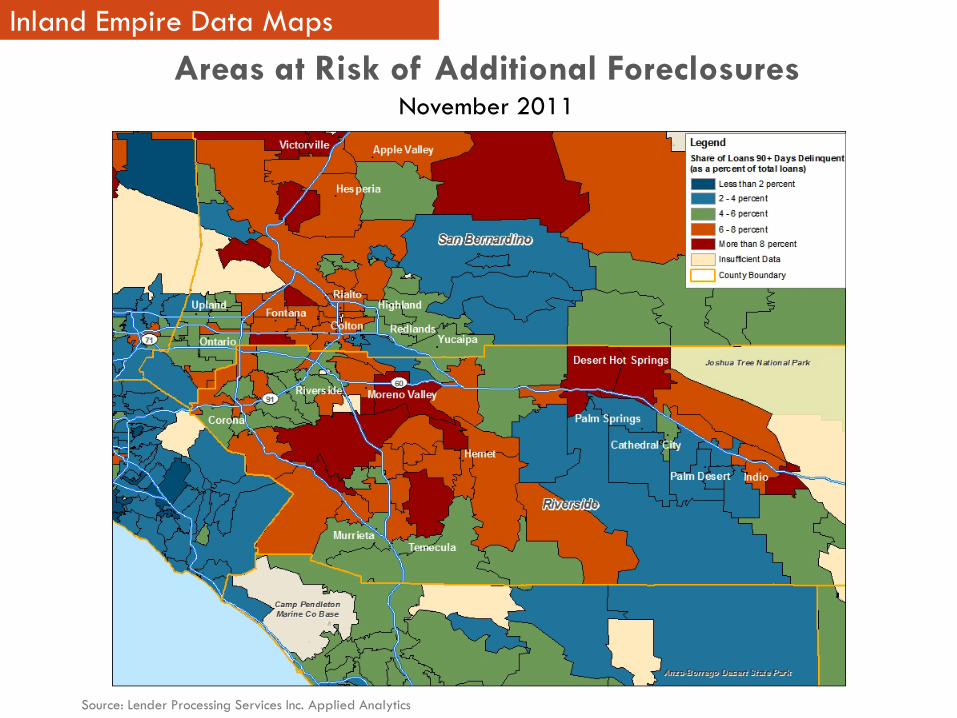
Inland Empire Data Maps
Source: Lender Processing Services Inc. Applied Analytics
Areas at Risk of Additional Foreclosures November 2011
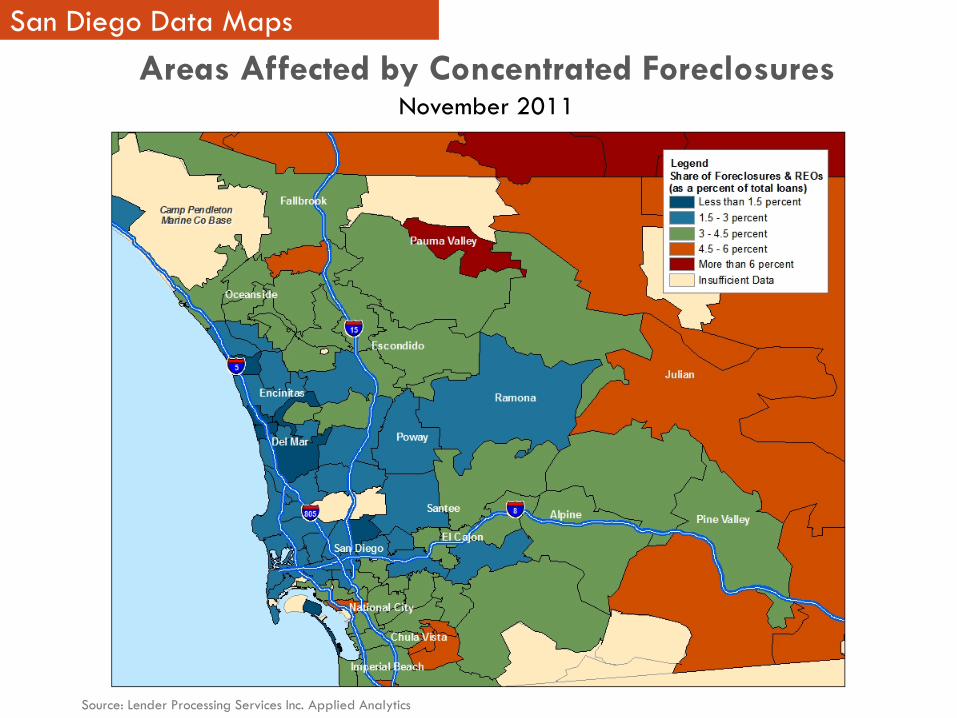
San Diego Data Maps
Source: Lender Processing Services Inc. Applied Analytics
Areas Affected by Concentrated Foreclosures November 2011
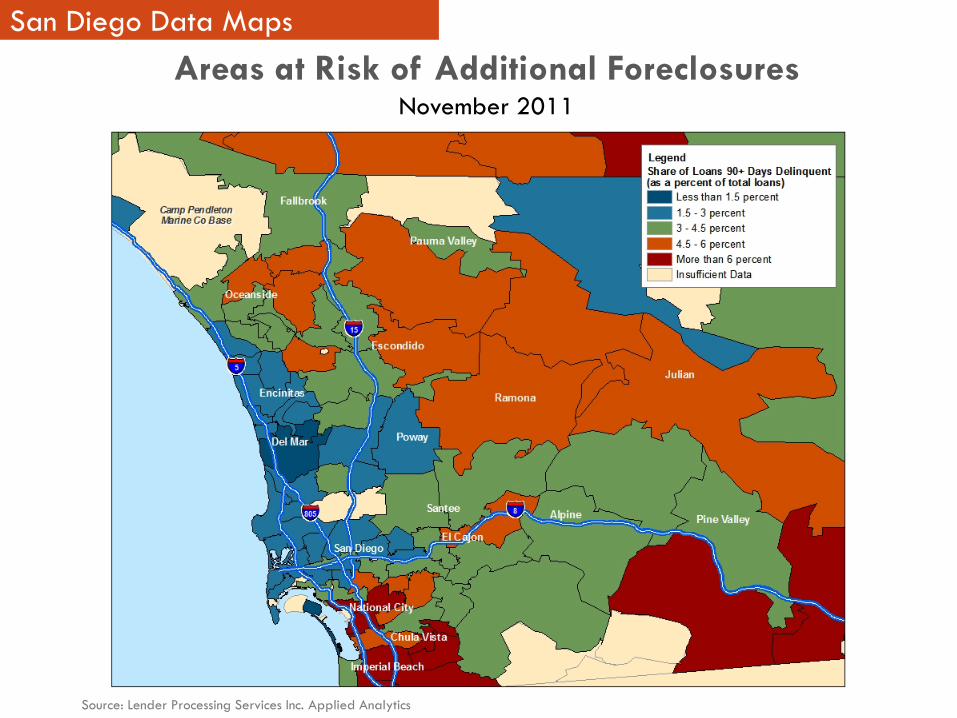
San Diego Data Maps
Source: Lender Processing Services Inc. Applied Analytics
Areas at Risk of Additional Foreclosures November 2011
Conclusions

For More Information: FRBSF Community Development Website
Links to other resources and research on foreclosure trends and mitigation strategies
All publications, presentations available on our website
Conference materials also posted shortly after events
http://www.frbsf.org/community/


