Housing and Redevelopment Authority of the City of Saint Paul, Minnesota AComponentUnitoftheCityofSaintPaul,MinnesotaComprehensive Annual Financial Report For the Fiscal Year Ending December 31, 2017
Transcript
Housing and Redevelopment Authority
of the City of Saint Paul, Minnesota
A Component Unit of the City of Saint Paul, Minnesota
Comprehensive Annual Financial Report
For the Fiscal Year Ending December 31, 2017
- This page intentionally left blank -
HOUSING AND REDEVELOPMENT AUTHORITY OF THE CITY OF SAINT PAUL, MINNESOTA
A Component Unit of the City of Saint Paul
COMPREHENSIVE ANNUAL FINANCIAL REPORT For the Fiscal Year Ended December 31, 2017
Chris Tolbert, Chairperson Melvin Carter, Mayor of the City of Saint Paul
Dr. Bruce Corrie, Executive Director
HRA Board of Commissioners: Daniel Bostrom
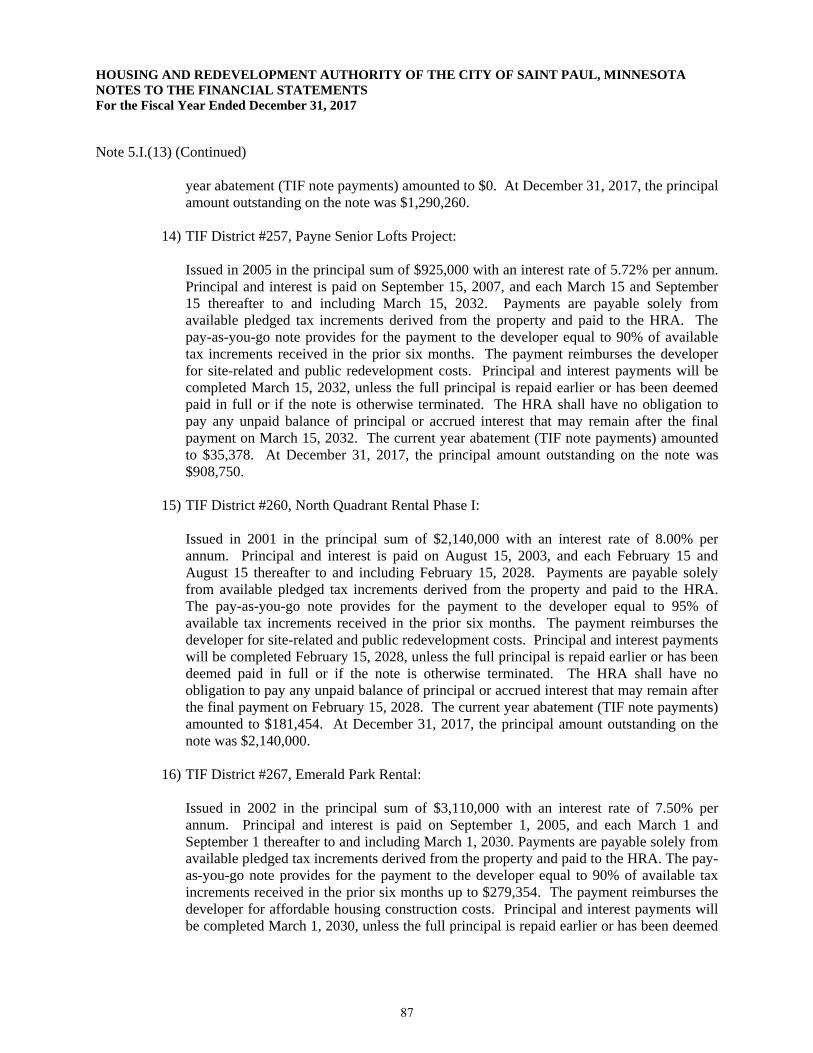
Amy Brendmoen Samantha Henningson
Rebecca Noecker Jane Prince
Dai Thao Chris Tolbert
Prepared by: City of Saint Paul -
Department of Planning & Economic Development
- This page intentionally left blank -
HOUSING AND REDEVELOPMENT AUTHORITY OF THE CITY OF SAINT PAUL, MINNESOTA
COMPREHENSIVE ANNUAL FINANCIAL REPORT For the Fiscal Year Ended December 31, 2017
TABLE OF CONTENTS
PageINTRODUCTORY SECTION
Letter of Transmittal 1-10
City of Saint Paul Organization Chart 11
Principal Officials 12
Certificate of Achievement for Excellence in Financial Reporting 13
FINANCIAL SECTION
Independent Auditor's Report 15-17
Management's Discussion and Analysis 19-32
Basic Financial Statements and Notes
Government-Wide Financial Statements:
Statement of Net Position 33-34
Statement of Activities 35
Fund Financial Statements
Balance Sheet - Governmental Funds 36
Statement of Revenues, Expenditures and Changes in FundBalances - Governmental Funds 37
Statement of Revenues, Expenditures and Changes in FundBalances - Budget and Actual - HRA General Fund 38
Statement of Net Position - Proprietary Funds 39-40
Statement of Revenues, Expenses and Changes in Fund NetPosition - Proprietary Funds 41
Statement of Cash Flows - Proprietary Funds 42-43
Notes to the Financial Statements 46-102
Supplementary Schedules
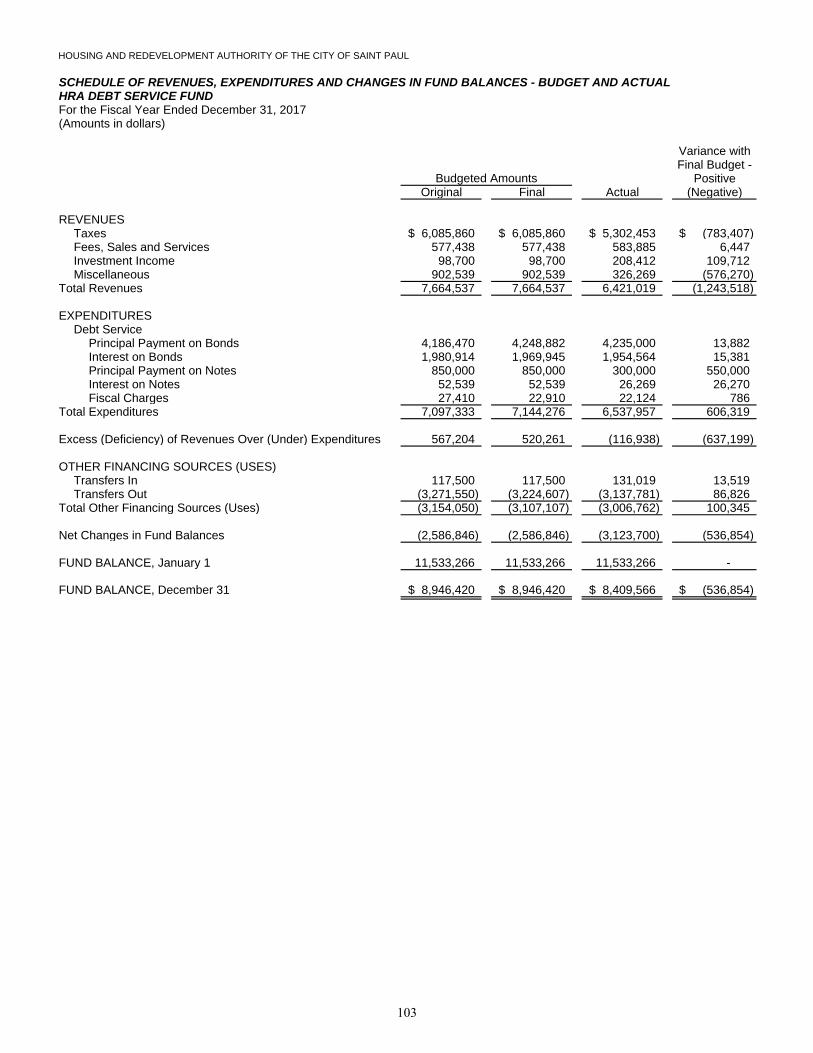
Schedule of Revenues, Expenditures, and Changes in FundBalances - Budget and Actual - HRA Debt Service Fund 103
Schedule of Deposits and Investments - All Funds 104
Schedule of Loans Receivable - All Funds 105
Schedule of Bonds, Notes, and Advances 106-109
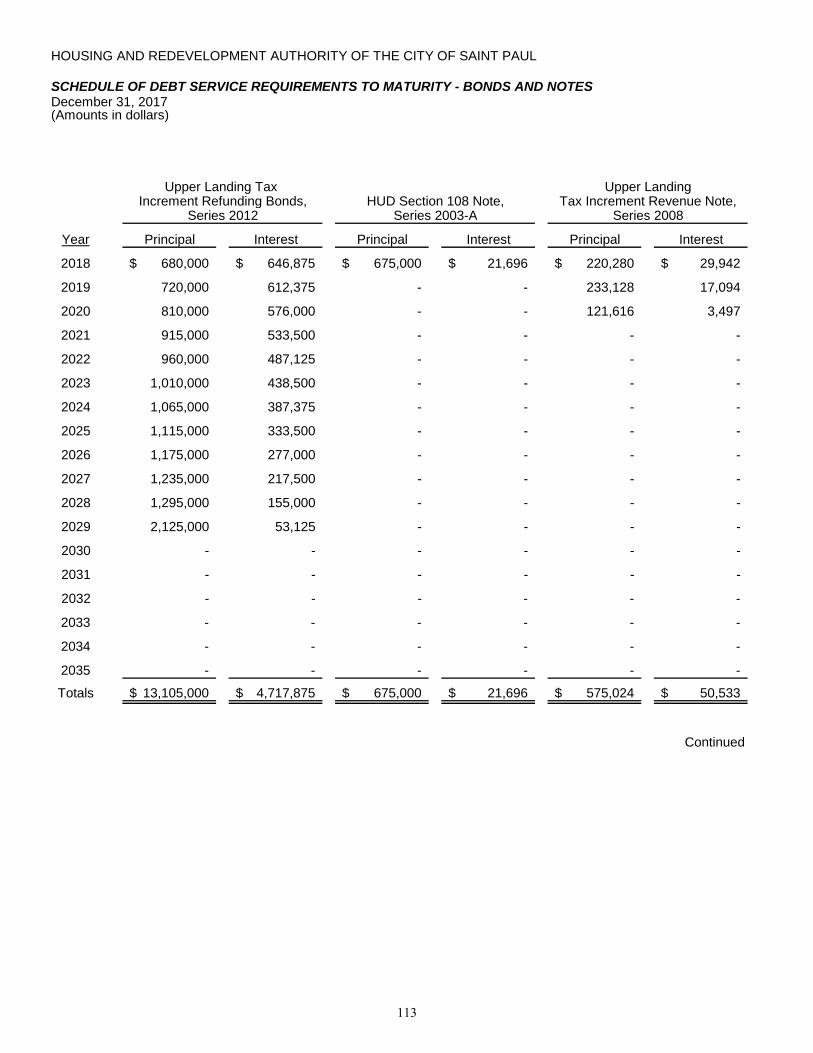
Schedule of Debt Service Requirements to Maturity - Bonds and Notes 110-116
Schedule of Intergovernmental Revenue, Operating Grants,and Capital Grants - All Funds 117
Schedule of Intergovernmental Expenditures and Expenses - All Funds 118
HOUSING AND REDEVELOPMENT AUTHORITY OF THE CITY OF SAINT PAUL, MINNESOTA
COMPREHENSIVE ANNUAL FINANCIAL REPORT For the Fiscal Year Ended December 31, 2017
TABLE OF CONTENTS
Page
STATISTICAL SECTION
Financial Trends
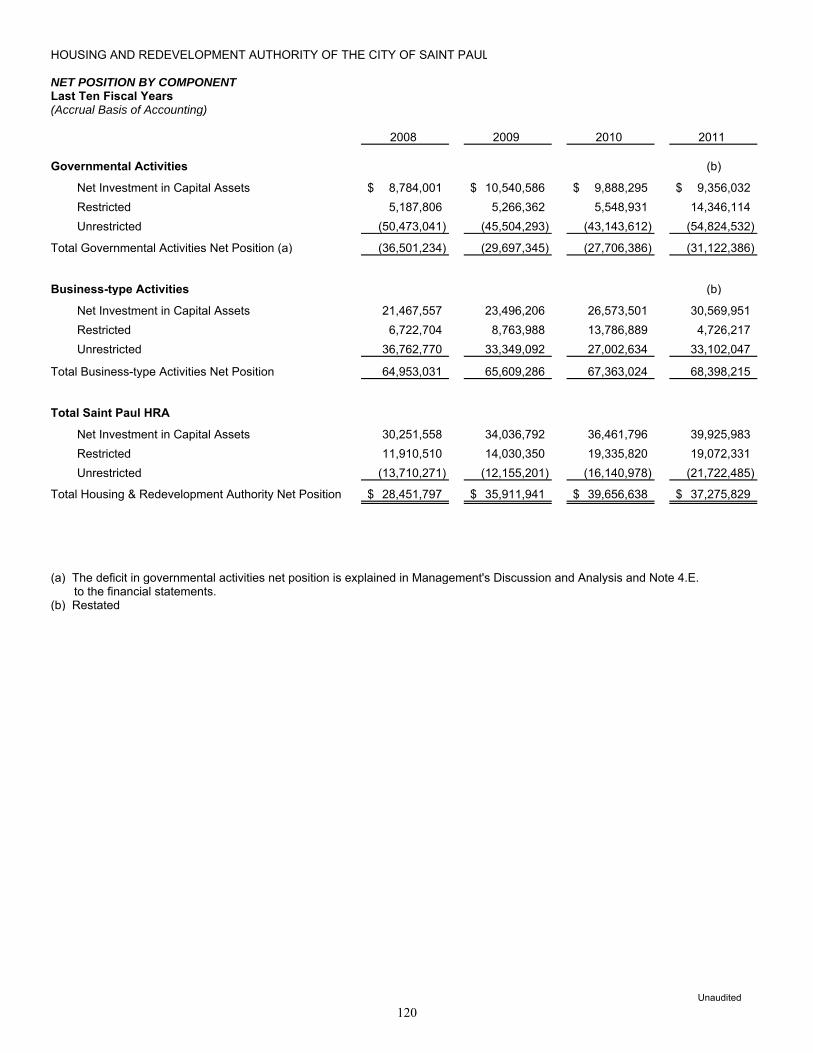
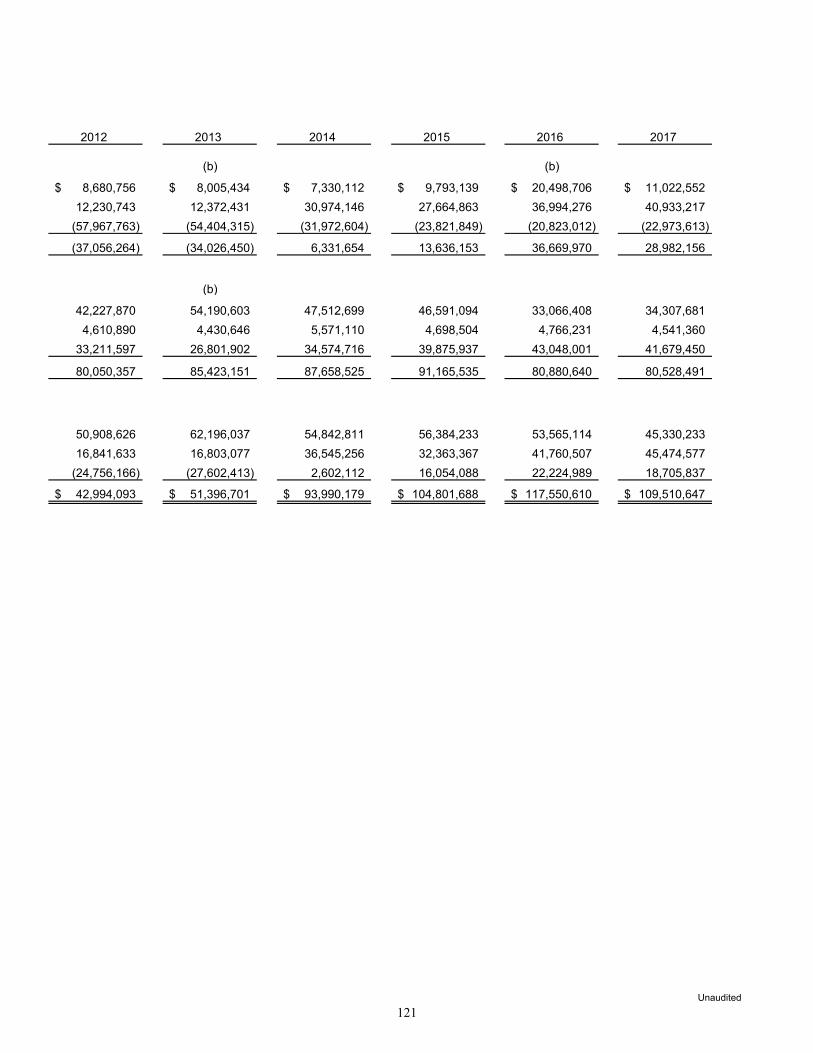
Net Position by Component 120-121
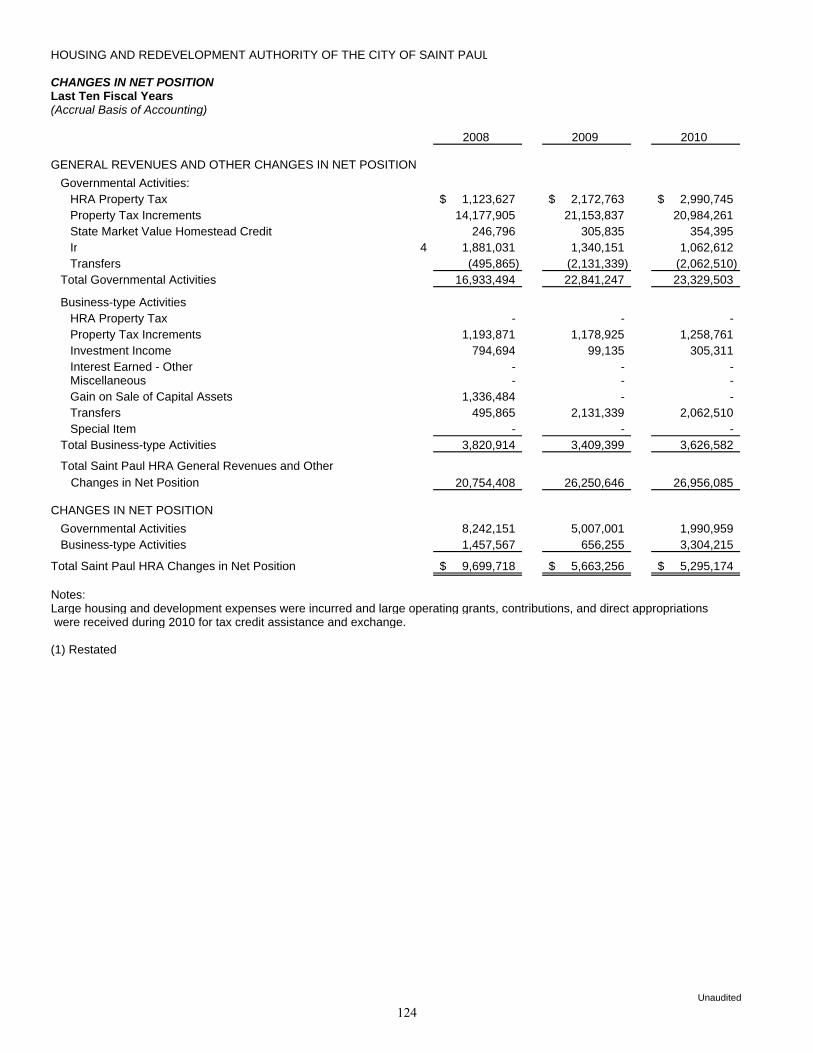
Changes in Net Position 122-125
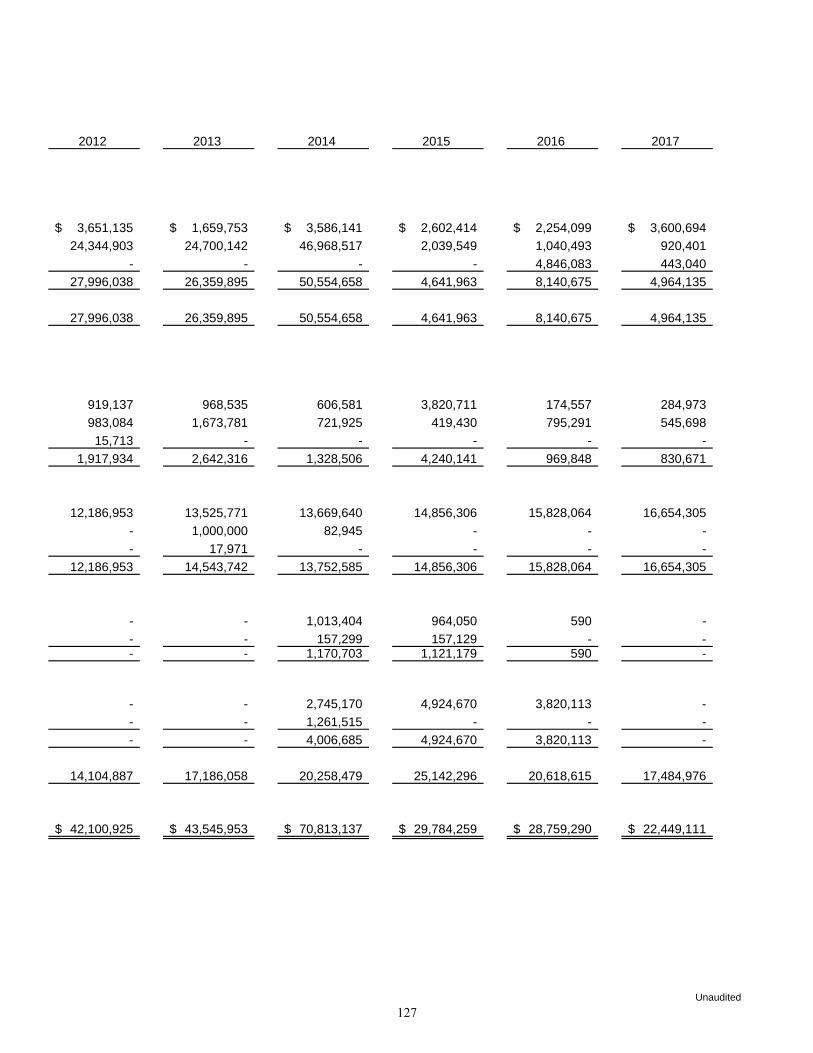
Program Revenues by Functions / Programs 126-127
Fund Balances - Governmental Funds 128-129
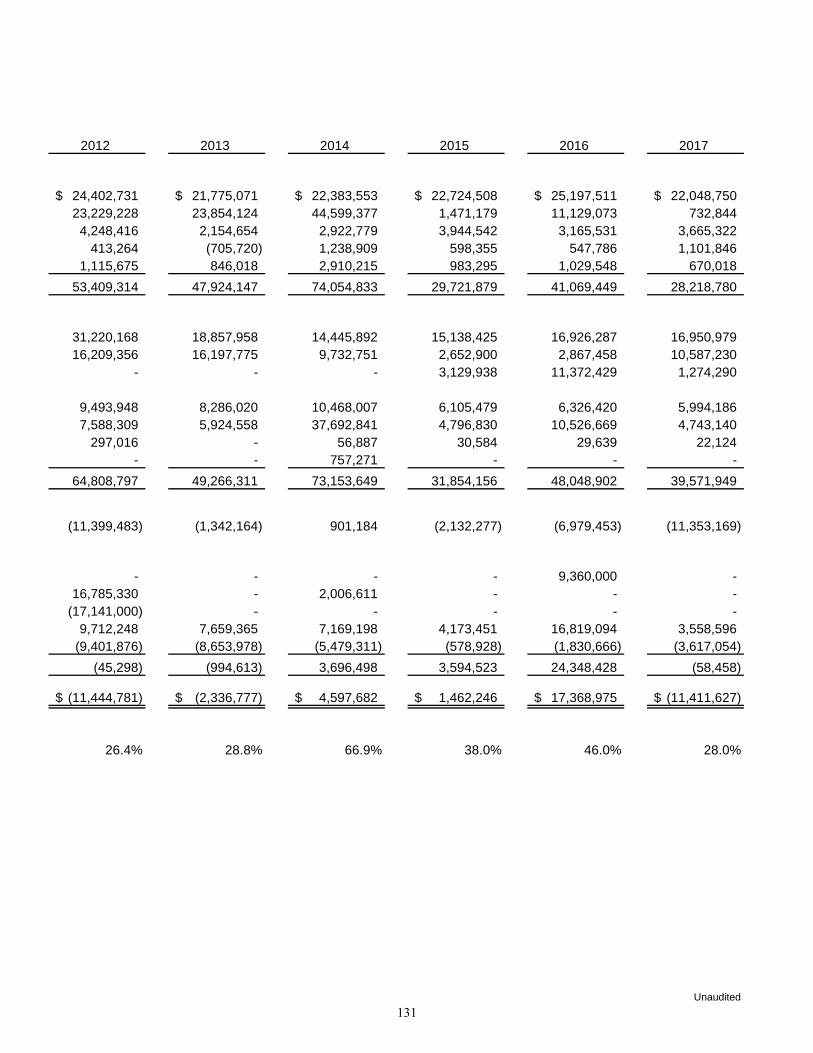
Changes in Fund Balances - Governmental Funds 130-131
Net Position - Proprietary Funds 132-133
Changes in Net Position - Proprietary Funds 134-135
Revenue Capacity
Tax Revenues by Source - Governmental Funds 137
HRA Property Tax Levies, Property Values, and Rates 138-139
HRA Property Tax Levies and Collections 140-141
Property Tax Increment Levies and Collections 142-143
Principal Property Taxpayers 145
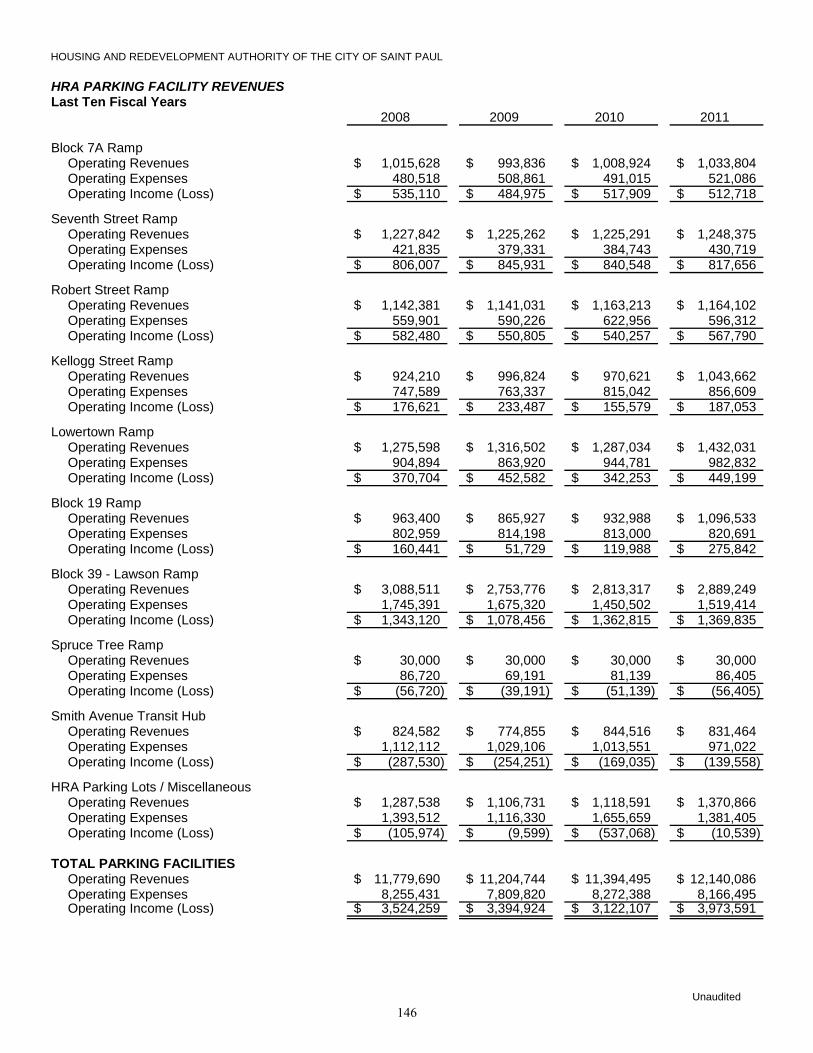
HRA Parking Facility Revenues 146-147
Debt Capacity
Ratios of Outstanding Debt by Type 148-147
Schedule of Bond Coverage 150-163
Demographic and Economic Information
Demographic and Economic Statistics 164
Principal Employers 165
Operating Information
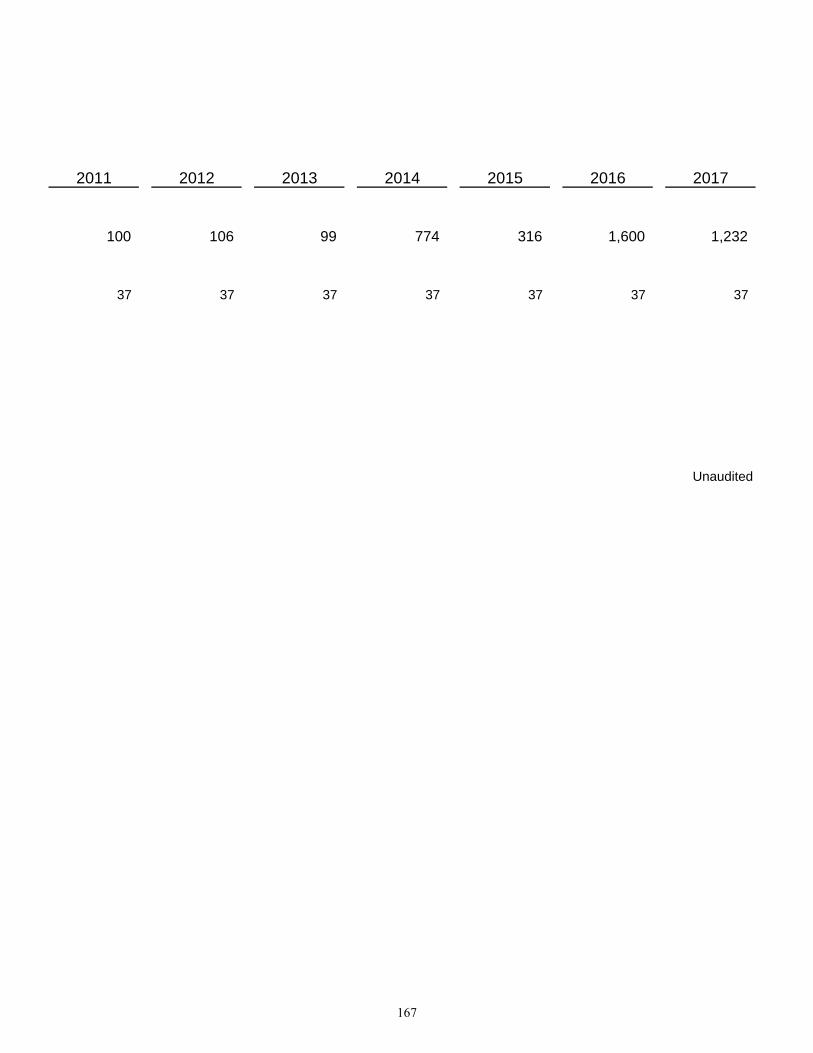
Operating Indicators 166-167
Capital Asset Statistics 168-169
INTRODUCTORY SECTION
1
2
3
4
5
6
7
8
9
10
11
Term of OfficeFrom To
Commissioners
Daniel Bostrom January 1, 1996 December 31, 2019
Amy Brendmoen January 11, 2012 December 31, 2019
Rebecca Noecker January 13, 2016 December 31, 2019
Commissioners of the Housing and Redevelopment Authority of the City of Saint Paul Saint Paul, Minnesota Report on the Financial Statements We have audited the accompanying financial statements of the governmental activities, the business-type activities, and each major fund of the Housing and Redevelopment Authority (HRA) of the City of Saint Paul, a component unit of the City of Saint Paul, Minnesota, as of and for the year ended December 31, 2017, and the related notes to the financial statements, which collectively comprise the HRA’s basic financial statements, as listed in the table of contents. Management’s Responsibility for the Financial Statements Management is responsible for the preparation and fair presentation of these financial statements in accordance with accounting principles generally accepted in the United States of America; this includes the design, implementation, and maintenance of internal control relevant to the preparation and fair presentation of financial statements that are free from material misstatement, whether due to fraud or error. Auditor’s Responsibility Our responsibility is to express opinions on these financial statements based on our audit. We conducted our audit in accordance with auditing standards generally accepted in the United States of America and the standards applicable to financial audits contained in Government Auditing Standards, issued by the Comptroller General of the United States. Those standards require that we plan and perform the audit to obtain reasonable assurance about whether the financial statements are free from material misstatement. An audit involves performing procedures to obtain audit evidence about the amounts and disclosures in the financial statements. The procedures selected depend on the auditor’s judgment, including the assessment of the risks of material misstatement of the financial statements, whether due to fraud or error. In making those risk assessments, the auditor considers internal control relevant to the HRA’s preparation and fair presentation of the financial statements in order to design audit procedures that are appropriate in the circumstances, but not for the purpose of
15
expressing an opinion on the effectiveness of the HRA’s internal control. Accordingly, we express no such opinion. An audit also includes evaluating the appropriateness of accounting policies used and the reasonableness of significant accounting estimates made by management, as well as evaluating the overall presentation of the financial statements. We believe that the audit evidence we have obtained is sufficient and appropriate to provide a basis for our audit opinions. Opinions In our opinion, the financial statements referred to above present fairly, in all material respects, the respective financial position of the governmental activities, the business-type activities, and each major fund of the HRA of the City of Saint Paul as of December 31, 2017, and the respective changes in financial position and, where applicable, cash flows thereof and the budgetary comparison for the General Fund for the year then ended in accordance with accounting principles generally accepted in the United States of America. Other Matters Required Supplementary Information Accounting principles generally accepted in the United States of America require that the Management’s Discussion and Analysis be presented to supplement the basic financial statements. Such information, although not part of the basic financial statements, is required by the Governmental Accounting Standards Board, who considers it to be an essential part of financial reporting for placing the basic financial statements in an appropriate operational, economic, or historical context. We have applied certain limited procedures to the required supplementary information in accordance with auditing standards generally accepted in the United States of America, which consisted of inquiries of management about the methods of preparing the information and comparing the information for consistency with management’s responses to our inquiries, the basic financial statements, and other knowledge we obtained during our audit of the basic financial statements. We do not express an opinion or provide any assurance on the information because the limited procedures do not provide us with sufficient evidence to express an opinion or provide any assurance. Supplementary and Other Information Our audit was conducted for the purpose of forming opinions on the financial statements that collectively comprise the HRA of the City of Saint Paul’s basic financial statements. The introductory section, the supplementary schedules, and the statistical section as listed in the table of contents are presented for purposes of additional analysis and are not a required part of the basic financial statements. The supplementary schedules are the responsibility of management and were derived from and relate directly to the underlying accounting and other records used to prepare the basic financial statements. Such information has been subjected to the auditing procedures applied in the audit of the basic financial statements and certain additional procedures, including comparing and reconciling such information directly to the underlying accounting and other records used to
16
prepare the basic financial statements or to the basic financial statements themselves, and other additional procedures in accordance with auditing standards generally accepted in the United States of America. In our opinion, the information is fairly stated, in all material respects, in relation to the basic financial statements as a whole. The introductory and statistical sections have not been subjected to the auditing procedures applied in the audit of the basic financial statements and, accordingly, we do not express an opinion or provide any assurance on them. Other Reporting Required by Government Auditing Standards In accordance with Government Auditing Standards, we have also issued our report dated June 8, 2018, on our consideration of the HRA of the City of Saint Paul’s internal control over financial reporting and on our tests of its compliance with certain provisions of laws, regulations, contracts, and grant agreements and other matters. The purpose of that report is to describe the scope of our testing of internal control over financial reporting and compliance and the results of that testing, and not to provide an opinion on the effectiveness of the HRA of the City of Saint Paul’s internal control over financial reporting or on compliance. That report is an integral part of an audit performed in accordance with Government Auditing Standards in considering the HRA of the City of Saint Paul’s internal control over financial reporting and compliance.
REBECCA OTTO GREG HIERLINGER, CPA STATE AUDITOR DEPUTY STATE AUDITOR June 8, 2018
17
- This page intentionally left blank -
18
HOUSING AND REDEVELOPMENT AUTHORITY OF THE CITY OF SAINT PAUL, MINNESOTA MANAGEMENT’S DISCUSSION AND ANALYSIS For the Fiscal Year Ended December 31, 2017
As management of the Housing and Redevelopment Authority of the City of Saint Paul (HRA), we provide readers of these financial statements this overview and analysis of the financial activities of the HRA for the fiscal year ended December 31, 2017. We encourage readers to consider the information presented here in conjunction with the financial statements which are found on pages 33-102. Financial Highlights The assets and deferred outflows of resources of the HRA exceeded its liabilities and
deferred inflows of resources at the end of 2017 by $109.5 million (net position). Net position decreased by $5.9 million during 2017. This net decrease included a decrease in governmental activity net position by $5.5 million and a decrease in business-type activity net position by $0.4 million. The business-type activities are the HRA Loan Enterprise Fund, the HRA Parking Enterprise Fund, and the HRA Penfield Enterprise Fund.
The HRA’s governmental funds reported combined fund balances of $53.3 million. An
amount of $42.8 million is restricted, primarily for future debt service on existing long-term debt and tax increment financing.
The total principal amount of long-term debt decreased during 2017 by $9.7 million to a total of $108.0 million, an 8.2% decrease from 2016. Total interest expense on long-term debt in 2017 was $7.6 million, a decrease of $1.8 million from 2016.
The assets of loans receivable and accrued interest receivable on loans, net of allowances,
increased by $0.1 million to a total of $6.0 million at December 31, 2017. The allowances for uncollectible loans decreased by $4.9 million to a total of $42.6 million at December 31, 2017.
One HRA administered tax increment financing district ended in 2017. Three HRA
administered tax increment financing districts were created in 2017. Total tax increment revenue for HRA Districts was $19.6 million in 2017, a decrease of $3.4 million from 2016. The captured tax capacity of all Saint Paul tax increment financing districts including the Port Authority is 9.8% of Saint Paul’s total tax capacity. This represents an increase of 0.6 percentage points from 2016.
The major housing development initiative continued in 2017 with 1,232 new or substantially rehabilitated single- and multi-family housing units completed in Saint Paul.
19
HOUSING AND REDEVELOPMENT AUTHORITY OF THE CITY OF SAINT PAUL, MINNESOTA MANAGEMENT’S DISCUSSION AND ANALYSIS For the Fiscal Year Ended December 31, 2017
Overview of the Financial Statements This discussion and analysis is intended to serve as an introduction to the HRA’s basic financial statements. The HRA’s basic financial statements are comprised of three components: 1) government-wide financial statements, 2) fund financial statements, and 3) notes to the financial statements. This report also contains other supplementary schedules and statistical tables, in addition to the basic financial statements themselves. Government-Wide Financial Statements The government-wide financial statements are designed to provide readers with a broad view of the HRA’s finances, in a manner similar to a private-sector business. These are found on pages 33-35 of this report. Both of the government-wide financial statements distinguish functions that are principally supported by taxes and intergovernmental revenues (governmental activities) from other functions that are intended to recover all or a significant portion of their costs through user fees (business-type activities). The HRA’s governmental activities include:
Development in the tax increment financing districts and other redevelopment areas
Federal, state and local grant programs Debt service on tax supported debt General operations financed through the HRA General Fund Multi-year development projects that are locally funded
The HRA’s business-type activities are:
Development loan programs Parking operations Penfield
The statement of net position presents financial information on all of the HRA’s assets, deferred outflows of resources, liabilities, and deferred inflows of resources, at December 31, 2017, with the difference reported as net position. Over time, increases or decreases in net position may serve as a useful indicator of whether the HRA’s financial position is improving or deteriorating.
20
HOUSING AND REDEVELOPMENT AUTHORITY OF THE CITY OF SAINT PAUL, MINNESOTA MANAGEMENT’S DISCUSSION AND ANALYSIS For the Fiscal Year Ended December 31, 2017
The statement of activities presents information showing how the HRA’s net position changed during 2017. All changes in net position are reported as soon as the underlying event giving rise to the change occurs, regardless of the timing of the related cash flows. Thus, revenues and expenses are reported in this statement for some items that will result in cash flows in future periods. Fund Financial Statements A fund is a grouping of related accounts that is used to maintain control over resources that have been segregated for specific activities or objectives. The HRA, like other state and local governments, uses fund accounting to ensure and demonstrate compliance with finance-related legal requirements. All of the funds of the HRA can be divided into two categories: governmental funds and proprietary funds. The governmental fund and proprietary fund financial statements are found on pages 36-38 and pages 39-43 of this report. Governmental funds are used to account for the same functions reported as governmental activities in the government-wide financial statements. However, unlike the government-wide financial statements, governmental fund financial statements focus on near-term inflows and outflows of spendable resources, as well as on balances of spendable resources available at the end of the fiscal year. Such information may be useful in evaluating near-term financing requirements. Because the focus of governmental funds is narrower than that of the government-wide financial statements, it is useful to compare the information presented for governmental funds with similar information presented for governmental activities in the government-wide financial statements. By doing so, readers may better understand the long-term impact of the HRA’s near-term financing decisions. Both the governmental fund balance sheet and the governmental fund statement of revenues, expenditures, and changes in fund balances provide a reconciliation to facilitate this comparison between governmental funds and governmental activities. The HRA maintains the following five governmental funds: HRA General Fund, HRA Grants Fund, HRA Debt Service Fund, HRA Tax Increment Capital Projects Fund, and the HRA Development Capital Projects Fund. Information is presented separately in the governmental fund balance sheet and the governmental fund statement of revenues, expenditures, and changes in fund balances for each of these five funds. The HRA adopts an annual appropriated budget for its general fund and its debt service fund. Multi-year budgets are adopted for the special revenue fund and the capital projects funds. A budgetary comparison statement has been provided in the basic financial statements for the HRA General Fund. The HRA’s governmental funds reflected positive variances for total expenditures and other financing uses compared to the final 2017 budgets.
21
HOUSING AND REDEVELOPMENT AUTHORITY OF THE CITY OF SAINT PAUL, MINNESOTA MANAGEMENT’S DISCUSSION AND ANALYSIS For the Fiscal Year Ended December 31, 2017
Proprietary funds are used to account for the same functions reported as business-type activities in the government-wide financial statements. The HRA maintains three proprietary funds: HRA Loan Enterprise Fund, HRA Parking Enterprise Fund, and the HRA Penfield Enterprise Fund. Information is presented separately in the proprietary fund financial statements for each of these funds. The HRA sold the Penfield Apartments in 2016. Under the purchase agreement, the HRA was to receive the water remediation escrows back within twelve months after completion of the work. When the full costs were known the HRA is to receive a release of $1.0 million less 125% of the total cost. Then, once the work is completed, the HRA is to receive 25% of the total cost. The full costs of the water remediation were known in 2017 and the HRA received a refund of $741,211 from the water remediation escrow. HRA fund accounting policies are included in Note 2.A. Notes to the Financial Statements The notes provide additional information that is essential to a full understanding of the data provided in the government-wide and fund financial statements. The notes to the financial statements are found on pages 46-102 of this report.
(Remainder of this page left intentionally blank)
22
HOUSING AND REDEVELOPMENT AUTHORITY OF THE CITY OF SAINT PAUL, MINNESOTA MANAGEMENT’S DISCUSSION AND ANALYSIS For the Fiscal Year Ended December 31, 2017
Financial Analysis of the HRA as a Whole
Net Position. The following chart shows components of the HRA’s assets, deferred outflows of resources, liabilities, deferred inflows of resources, and net position and compares 2017 with 2016 at December 31.
Total Net Position 28,982,156$ 34,527,116$ 80,528,491$ 80,880,640$ 109,510,647$ 115,407,756$ -5.1%
SAINT PAUL HRA'S ASSETS, DEFERRED OUTFLOWS OF RESOURCES, LIABILITIES, DEFERRED INFLOWS OF RESOURCES, AND NET POSITION
Assets and deferred outflows of resources of the HRA exceeded liabilities and deferred inflows of resources resulting in an overall surplus of $109.5 million at December 31, 2017. Net position of the business-type activities are $80.5 million at December 31, 2017. In governmental activities, the HRA issues long-term debt for housing and economic development purposes and, in many cases, does not acquire or construct HRA-owned capital assets with the debt proceeds. This is common for housing and redevelopment authorities. For the Saint Paul HRA, this has been the case with the tax increment bonds. The debt is to be retired with future revenues, namely property tax increments. In past years financing has been sufficient for all governmental activity long-term debt service payments and other debt service requirements. Likewise, it is projected that future revenues will adequately finance all existing debt service requirements.
23
HOUSING AND REDEVELOPMENT AUTHORITY OF THE CITY OF SAINT PAUL, MINNESOTA MANAGEMENT’S DISCUSSION AND ANALYSIS For the Fiscal Year Ended December 31, 2017
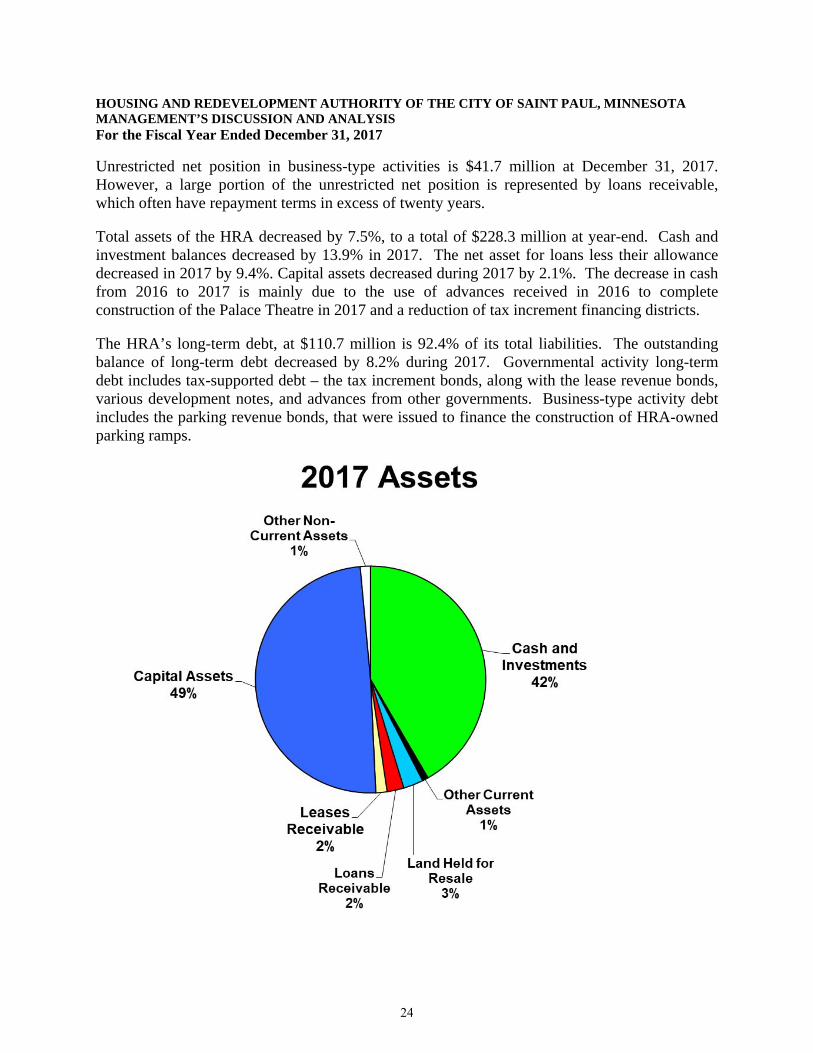
Unrestricted net position in business-type activities is $41.7 million at December 31, 2017. However, a large portion of the unrestricted net position is represented by loans receivable, which often have repayment terms in excess of twenty years. Total assets of the HRA decreased by 7.5%, to a total of $228.3 million at year-end. Cash and investment balances decreased by 13.9% in 2017. The net asset for loans less their allowance decreased in 2017 by 9.4%. Capital assets decreased during 2017 by 2.1%. The decrease in cash from 2016 to 2017 is mainly due to the use of advances received in 2016 to complete construction of the Palace Theatre in 2017 and a reduction of tax increment financing districts. The HRA’s long-term debt, at $110.7 million is 92.4% of its total liabilities. The outstanding balance of long-term debt decreased by 8.2% during 2017. Governmental activity long-term debt includes tax-supported debt – the tax increment bonds, along with the lease revenue bonds, various development notes, and advances from other governments. Business-type activity debt includes the parking revenue bonds, that were issued to finance the construction of HRA-owned parking ramps.
24
HOUSING AND REDEVELOPMENT AUTHORITY OF THE CITY OF SAINT PAUL, MINNESOTA MANAGEMENT’S DISCUSSION AND ANALYSIS For the Fiscal Year Ended December 31, 2017
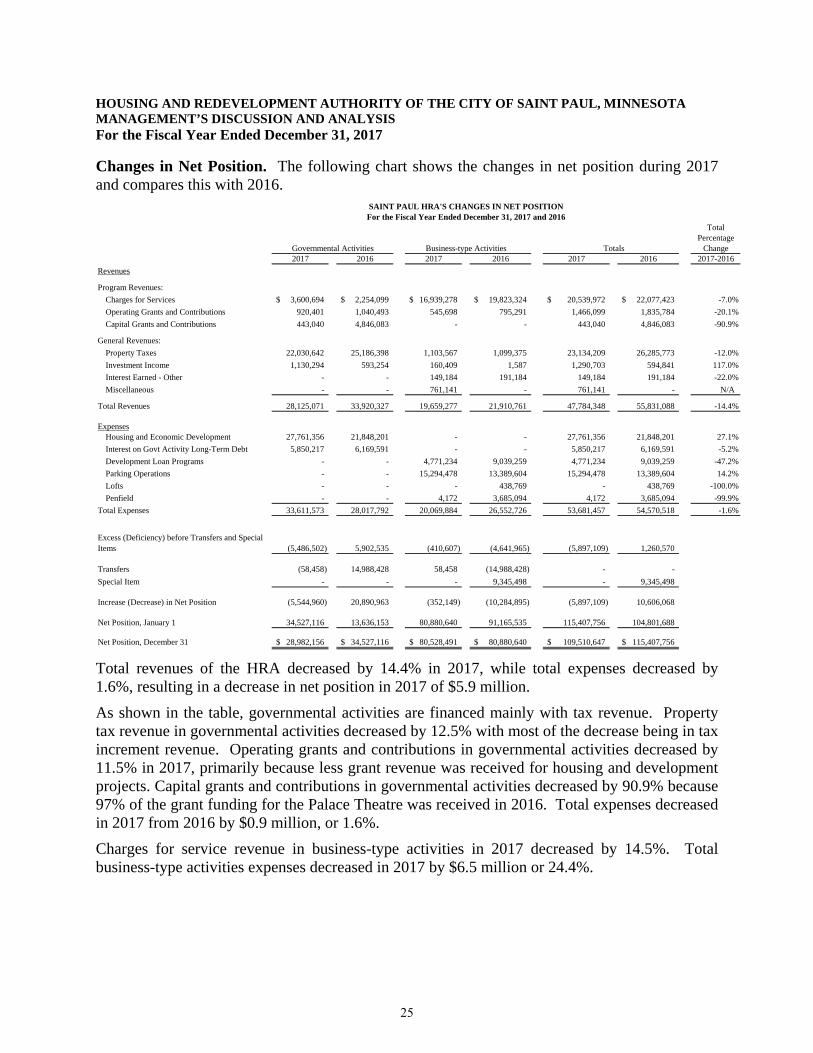
Changes in Net Position. The following chart shows the changes in net position during 2017 and compares this with 2016.
SAINT PAUL HRA'S CHANGES IN NET POSITIONFor the Fiscal Year Ended December 31, 2017 and 2016
Increase (Decrease) in Net Position (5,544,960) 20,890,963 (352,149) (10,284,895) (5,897,109) 10,606,068
Net Position, January 1 34,527,116 13,636,153 80,880,640 91,165,535 115,407,756 104,801,688
Net Position, December 31 28,982,156$ 34,527,116$ 80,528,491$ 80,880,640$ 109,510,647$ 115,407,756$
Excess (Deficiency) before Transfers and Special Items
Total revenues of the HRA decreased by 14.4% in 2017, while total expenses decreased by 1.6%, resulting in a decrease in net position in 2017 of $5.9 million.
As shown in the table, governmental activities are financed mainly with tax revenue. Property tax revenue in governmental activities decreased by 12.5% with most of the decrease being in tax increment revenue. Operating grants and contributions in governmental activities decreased by 11.5% in 2017, primarily because less grant revenue was received for housing and development projects. Capital grants and contributions in governmental activities decreased by 90.9% because 97% of the grant funding for the Palace Theatre was received in 2016. Total expenses decreased in 2017 from 2016 by $0.9 million, or 1.6%.
Charges for service revenue in business-type activities in 2017 decreased by 14.5%. Total business-type activities expenses decreased in 2017 by $6.5 million or 24.4%.
25
HOUSING AND REDEVELOPMENT AUTHORITY OF THE CITY OF SAINT PAUL, MINNESOTA MANAGEMENT’S DISCUSSION AND ANALYSIS For the Fiscal Year Ended December 31, 2017
-
5,000,000
10,000,000
15,000,000
20,000,000
25,000,000
30,000,000
35,000,000
40,000,000
Governmental Activities Business-type Activities
2017Revenue and Expenses
Program Revenues:
General Revenues:
Expenses
26
HOUSING AND REDEVELOPMENT AUTHORITY OF THE CITY OF SAINT PAUL, MINNESOTA MANAGEMENT’S DISCUSSION AND ANALYSIS For the Fiscal Year Ended December 31, 2017
27
HOUSING AND REDEVELOPMENT AUTHORITY OF THE CITY OF SAINT PAUL, MINNESOTA MANAGEMENT’S DISCUSSION AND ANALYSIS For the Fiscal Year Ended December 31, 2017
Financial Analysis of the HRA’s Funds
As noted earlier, the HRA uses fund accounting to maintain control over resources and to ensure and demonstrate compliance with financial-related legal requirements.
Governmental Funds
The focus of the HRA’s governmental funds is to provide information on near-term inflows, outflows, and balances of spendable resources. Such information is useful in assessing the HRA’s financing requirements.
At December 31, 2017, the HRA’s governmental funds reported total fund balances of $53.3 million. 80.2% of this is restricted and 0.6% of this is nonspendable to indicate that it is not available for new spending. $8.4 million of this restricted amount is for future debt service on existing bonds, notes, and advances. Committed, assigned, and unassigned balances total $10.2 million. Of the committed, assigned, and unassigned fund balances, $6.0 million has been committed in the HRA General Fund for support of HRA operations.
The HRA General Fund is the chief operating fund of the HRA. Revenues include the HRA property tax levy, fees from conduit revenue bond issues, property rentals, and investment earnings. The major spending activities are for staff administration of HRA programs, maintenance of HRA properties, and professional services for HRA programs and projects. The fund balance in the HRA General Fund decreased during 2017 by $0.9 million to a total of $10.5 million at December 31, 2017, due to an increase in administration costs.
The HRA Grants Fund accounts for intergovernmental revenues provided primarily by the Federal and State governments for housing grant programs and projects. Grant revenues are recognized as eligible grant expenditures are incurred, resulting in little or no fund balance. No grant revenue was received in 2017.
The HRA Debt Service Fund accumulates resources and pays debt service for the HRA’s debt that is not financed by the enterprise funds. Debt service on the bonds is financed by property tax increments, lease payments from the City, and investment earnings. At December 31, 2017, the fund balance is $8.4 million, which is entirely restricted for future debt service. Total debt spending during 2017 was $6.5 million.
The HRA Tax Increment Capital Projects Fund accounts for HRA major development projects and capital projects in Saint Paul tax increment districts and other redevelopment areas. The total fund balance of $24.5 million at December 31, 2017, is restricted for unspent balances of previously approved projects. Total 2017 spending from this Fund was $21.7 million. All of these projects are financed with tax increment bond proceeds. The HRA Development Capital Projects Fund accounts for HRA multi-year development projects. These projects are locally funded through transfers from other funds and bonds sold for
28
HOUSING AND REDEVELOPMENT AUTHORITY OF THE CITY OF SAINT PAUL, MINNESOTA MANAGEMENT’S DISCUSSION AND ANALYSIS For the Fiscal Year Ended December 31, 2017
development purposes. The fund balance was $9.8 million at December 31, 2017. The HRA acquired the Palace Theatre and began construction on the theater in 2015 which was completed in 2017. See Note 5.K. Proprietary Funds The proprietary fund financial statements provide the same information found in the business-type activities column of the government-wide statements, but in more detail. The proprietary funds use the economic resources measurement focus and the full accrual basis of accounting, which are the same as those used for private sector business enterprises. The HRA’s proprietary funds are the HRA Loan Enterprise Fund, the HRA Parking Enterprise Fund, and the HRA Penfield Enterprise Fund. The HRA Loan Enterprise Fund accounts for loans issued and related servicing for various housing and economic development programs and projects. The Fund has unrestricted net position totaling $19.3 million and restricted net position totaling $0.8 million at December 31, 2017. The assets of the Fund include loans receivable and accrued interest on these loans which are reported at $4.3 million (net of allowance) and in many cases have long repayment terms before there will be liquidation to cash. Cash and investments are reported at $15.3 million at December 31, 2017. The Fund had an overall decrease in net position of $3.6 million for 2017, primarily due to uses of the Penfield Apartments net sales proceeds that were transferred in from the Penfield Enterprise Fund in 2016. The HRA Parking Enterprise Fund accounts for the operation of HRA-owned parking facilities in Saint Paul. The Fund has unrestricted net position of $21.5 million at December 31, 2017. Assets in the Fund include capital assets for parking facilities reported at the depreciated amount of $81.5 million. Long-term debt used for financing the construction of the parking facilities is $45.3 million in principal outstanding at December 31, 2017. The Fund had operating income of $6.3 million during 2017. The HRA Penfield Enterprise Fund accounts for the Penfield Apartments. Cash and investments are reported at $0.9 million at December 31, 2017. The Fund had an overall net position of $0.9 million at December 31, 2017, all of which was unrestricted. The Penfield Apartments were sold on September 22, 2016.
29
HOUSING AND REDEVELOPMENT AUTHORITY OF THE CITY OF SAINT PAUL, MINNESOTA MANAGEMENT’S DISCUSSION AND ANALYSIS For the Fiscal Year Ended December 31, 2017
HRA General Fund Budgetary Highlights
The final amended budget for the HRA General Fund includes the original adopted budget plus any previously appropriated funds set aside for the purpose of honoring legally incurred obligations (prior year encumbrances), plus any additional supplemental appropriations that were legislated by the Board of Commissioners during the year. Actual 2017 spending was 10.8% lower than the final spending budget. Actual revenues were 26.5% higher than the final financing budget.
Long-Term Debt
At December 31, 2017, the HRA had total long-term debt outstanding of $110.7 million as shown in the following chart.
SAINT PAUL HRA'S LONG-TERM DEBTAt December 31, 2017 and 2016
All of the debt has specified revenue sources that are pledged for its retirement. In addition, the City of Saint Paul has issued a general obligation pledge on certain tax increment bonds that have a total of $25.9 million outstanding at year-end 2017. The City’s G.O. pledge provides a secondary source of repayment if tax increments are not sufficient to service the related bonds. For the RiverCentre Facility Lease Revenue Bonds, the City has pledged City sources and RiverCentre revenues to make lease payments to the HRA. Non-payment of the lease by the City may create credit rating implications to the City, which is currently rated AAA by Standard & Poor’s. For the Parking Revenue Bonds, in addition to net parking ramp revenues, the City has pledged the first $3.0 million collected annually in parking meter and parking fine revenues.
On September 28, 2017, the HRA issued Parking Revenue Refunding Bonds, Series 2017A in the amount of $26,315,000, and Parking Revenue Refunding Bonds, Taxable Series 2017B in the amount of $2,630,000. The proceeds were used to current refund the Parking Revenue Refunding Bonds, Series 2010B and advance refund the Parking Revenue Refunding Bonds, Series 2010A. See Note 5.F.(1).
All 2017 scheduled principal and interest payments were made in accordance with the terms of the bonds and notes.
30
HOUSING AND REDEVELOPMENT AUTHORITY OF THE CITY OF SAINT PAUL, MINNESOTA MANAGEMENT’S DISCUSSION AND ANALYSIS For the Fiscal Year Ended December 31, 2017
Additional information on the HRA’s long-term debt can be found in Note 5.F. on pages 72-79 of this report. The schedule of bond coverage in the Statistical Section of this report shows the history and reliability of debt service financing sources.
Capital Assets
The HRA’s investment in capital assets for its governmental and business-type activities as of December 31, 2017 is $112.5 million (net of accumulated depreciation) as shown in the following chart.
Saint Paul HRA's Capital Assets(Net of Depreciation)
Total depreciation expense for governmental and business-type activities during 2017 was $4.3 million.
31
HOUSING AND REDEVELOPMENT AUTHORITY OF THE CITY OF SAINT PAUL, MINNESOTA MANAGEMENT’S DISCUSSION AND ANALYSIS For the Fiscal Year Ended December 31, 2017
The decrease in construction in progress in the governmental activities is due to the capitalization of the Palace Theatre construction costs in 2017. The increase in buildings is primarily from the capitalization of the Palace Theatre in 2017. Additional information on the HRA’s capital assets can be found in Note 5.E. on 71-72 of this report. A chart of the HRA’s capital assets is shown below.
Land27%
Construction in Progress
0%
Parking Ramps46%
Buildings24%
Equipment1%Pedestrian
Skyway Bridges2%
2017 Capital Assets
Requests for Information This financial report is designed to provide a general overview of the Saint Paul HRA’s finances. Questions concerning any of the information provided in this report or requests for additional information should be addressed to the City of Saint Paul, Department of Planning and Economic Development, 25 West Fourth Street, Saint Paul, MN, 55102.
32
BASIC FINANCIAL STATEMENTS AND NOTES
HOUSING AND REDEVELOPMENT AUTHORITY OF THE CITY OF SAINT PAUL
STATEMENT OF NET POSITION
(Amounts in dollars)Governmental Business-type
Activities Activities TotalASSETS
Cash and Investments with Treasurer $50,668,331 $34,375,699 $85,044,030
Cash with Fiscal Agents - 1,059,965 1,059,965
Cash and Investments with Trustees 3,807,654 808,570 4,616,224
Accrued Interest Receivable on Investments 360,227 70,606 430,833
Property Taxes Receivable 761,044 34,763 795,807
Accounts Receivable (Net of Allowance) 73,958 613,066 687,024
Assessments Receivable 13,951 13,951
Internal Balances (2,886,795) 2,886,795 -
Land Held for Resale 2,273,531 4,125,142 6,398,673
Restricted Cash and Investments for:
General Obligation Bond Debt Service - 2,020,700 2,020,700
Revenue Bond Debt Service - 2,183,249 2,183,249
Revenue Bond Operations and Maintenance - 27,218 27,218
Note Debt Service 250,300 - 250,300
Note Receivable 100,000 - 100,000
Loans Receivable (Net of Allowance) 1,258,653 4,125,959 5,384,612
Accrued Interest Receivable on Loans (Net of Allowance) 54,053 518,844 572,897
Advances to Other Governmental Units 2,310,006 312,727 2,622,733
Direct Financing Leases Receivable 3,605,000 - 3,605,000
Capital Assets Not Being Depreciated:
Land 3,042,169 27,247,487 30,289,656
Construction in Process - 197,547 197,547
Capital Assets Net of Accumulated Depreciation:
Parking Ramps - 51,751,441 51,751,441
Buildings 25,338,945 1,113,707 26,452,652
Equipment - 1,217,241 1,217,241
Pedestrian Skyway Bridges 2,601,290 - 2,601,290
TOTAL ASSETS $93,618,366 $134,704,677 $228,323,043
DEFERRED OUTFLOWS OF RESOURCES $ - $979,919 $979,919
Continued
December 31, 2017
The accompanying notes are an integral part of these financial statements.
33
HOUSING AND REDEVELOPMENT AUTHORITY OF THE CITY OF SAINT PAUL
STATEMENT OF NET POSITION
(Amounts in dollars)Governmental Business-type
Activities Activities Total
December 31, 2017
LIABILITIES
Accounts Payable 1,071,743 1,151,816 2,223,559
Contracts Payable 216,059 51,192 267,251
Due to Other Governmental Units 1,564,484 1,053 1,565,537
Accrued Interest Payable on Long-Term Debt 659,105 - 659,105
Unearned Revenue 1,095,186 2,359,903 3,455,089
Liabilities Payable from Restricted Assets:
Accrued Interest on General Obligation Bonds Payable - 232,326 232,326
Accrued Interest on Revenue Bonds Payable - 260,073 260,073
General Obligation Bonds Payable - Due within One Year - 1,850,000 1,850,000
Revenue Bonds Payable - Due within One Year - 1,325,000 1,325,000
General Obligation Bonds Payable - Due in more than One Year - 14,885,108 14,885,108
Revenue Bonds Payable - Due in more than One Year - 29,159,634 29,159,634
Long-Term Liabilities:
General Obligation Bonds Payable - Due within One Year 710,000 - 710,000
Revenue Bonds Payable - Due within One Year 1,578,000 - 1,578,000
Notes Payable - Due within One Year 895,280 93,856 989,136
Advance from Other Governmental Units - Due in more than One Year 9,360,000 - 9,360,000
General Obligation Bonds Payable - Due in more than One Year 8,986,967 - 8,986,967
Revenue Bonds Payable - Due in more than One Year 27,144,790 - 27,144,790
Notes Payable - Due in more than One Year 10,954,596 3,786,144 14,740,740
Total Fund Balances 10,538,150 64,531 8,409,566 24,483,413 9,845,599 53,341,259
TOTAL LIABILITIES, DIR, AND FUND BALANCES $10,867,010 $64,531 $12,113,513 $33,935,911 $11,675,159 $68,656,124
(1) The individual items in the summary total of deferred inflows of resources are shown in Note 5.L, page 96.
Amounts reported for governmental activities in the Statement of Net Position (pages 33-34) are different because:
1. Capital assets used in governmental activities are not financial resources and, therefore, are not reported $30,982,404
in the funds.
2. Other long-term resources are not available to pay for current period expenditures and, therefore, are 5,297,231
unavailable revenue in the funds.
3. Long-term liabilities, including bonds, notes and advances payable, are not due and payable in the current (60,288,738) period and, therefore, are not reported in the funds.
4. Pollution remediation obligation is not due and payable in the current period and, therefore, is not reported
in the funds. (350,000)
Total Reconciling Items (24,359,103)
Fund Balances per Balance Sheet - Governmental Funds, December 31, 2017 53,341,259
Net Position per Statement of Net Position - Governmental Activities column, December 31, 2017 $28,982,156
Nonspendable
Restricted
Committed
The accompanying notes are an integral part of these financial statements.
36
HOUSING AND REDEVELOPMENT AUTHORITY OF THE CITY OF SAINT PAUL
STATEMENT OF REVENUES, EXPENDITURES AND CHANGES IN FUND BALANCESGOVERNMENTAL FUNDSFor the Fiscal Year Ended December 31, 2017(Amounts in dollars)
HRA Tax HRAHRA Increment Development Total
HRA HRA Debt Capital Capital GovernmentalGeneral Grants Service Projects Projects Funds
Intergovernmental - - - 1,922 730,922 732,844Fees, Sales and Services
Revenue Bond Fees 2,753,303 - - - - 2,753,303Other Fees and Services 181,071 - - - - 181,071Sales of Land 77,550 - - - - 77,550Rentals of Property - - 583,885 - - 583,885Interest on Loans - - - 23,608 1,683 25,291Loan Repayments - - - 24,742 19,480 44,222
Investment IncomeInterest Earned on Investments 265,649 - 240,532 547,159 - 1,053,340Increase (Decrease) in the Fair Value of Investments 31,396 - (32,120) 49,230 - 48,506
Total Revenues 6,815,310 - 6,421,019 13,886,617 1,095,834 28,218,780
EXPENDITURESCurrent
Housing and Economic Development 7,184,987 - - 7,896,711 1,869,281 16,950,979Intergovernmental - City 580,438 - - 9,624,783 382,009 10,587,230Capital Outlay - - - - 1,274,290 1,274,290Debt Service
Principal Payment on Bonds - - 4,235,000 - - 4,235,000Interest on Bonds - - 1,954,564 - - 1,954,564Principal Payment on Notes - - 300,000 208,140 - 508,140Interest on Notes - - 26,269 3,864,169 - 3,890,438Interest on Advances - - - 149,184 - 149,184Fiscal Charges - - 22,124 - - 22,124
Total Expenditures 7,765,425 - 6,537,957 21,742,987 3,525,580 39,571,949
Excess (Deficiency) of Revenues Over (Under) Expenditures (950,115) - (116,938) (7,856,370) (2,429,746) (11,353,169)
OTHER FINANCING SOURCES (USES)Transfers In 76,486 - 131,019 3,139,842 211,249 3,558,596Transfers Out (2,061) (262,249) (3,137,781) (214,963) - (3,617,054)
Total Other Financing Sources (Uses) 74,425 (262,249) (3,006,762) 2,924,879 211,249 (58,458)
Net Changes in Fund Balances (875,690) (262,249) (3,123,700) (4,931,491) (2,218,497) (11,411,627)
FUND BALANCES, January 1-as restated (Note 2.R.) 11,413,840 326,780 11,533,266 29,414,904 12,064,096 64,752,886
FUND BALANCES, December 31 $10,538,150 $64,531 $8,409,566 $24,483,413 $9,845,599 $53,341,259
Amounts reported for governmental activities in the Statement of Activities (page 35) are different because:
Net change in fund balances - total governmental funds (above) ($11,411,627)
1. Governmental funds report capital outlays as expenditures. However, in the Statement of Activities, the cost of those assets is allocated over their estimated useful lives and reported as depreciation expense. Capital outlay 1,274,290Prior year capital outlay moved to City capital outlay (295,140) Current year depreciation (1,095,304) (116,154)
2. Revenues in the Statement of Activities that do not provide current financial resources are not reported as revenues in the governmental funds. (54,288)
3. The issuance of long-term debt provides current financial resources to governmental funds, while the repayment of principal on long-term debt consumes the current financial resources of governmental funds. Neither transaction has any effect on net position. Also, governmental funds report the effect of premiums and discounts when debt is issued, whereas, these amounts are amortized in the Statement of Activities. This amount is the net effect of these differences in the treatment of long-term debt and related items. 4,828,706
4. Some expenses reported in the Statement of Activities do not require the use of current financial resources and, therefore, are not reported as expenditures in governmental funds. 1,208,403
Total Reconciling Items 5,866,667
Change in Net Position of Governmental Activities - Statement of Activities ($5,544,960)
The accompanying notes are an integral part of these financial statements.
37
HOUSING AND REDEVELOPMENT AUTHORITY OF THE CITY OF SAINT PAUL
SCHEDULE OF REVENUES, EXPENDITURES AND CHANGES IN FUND BALANCES - BUDGET AND ACTUALHRA GENERAL FUNDFor the Fiscal Year Ended December 31, 2017(Amounts in dollars)
Variance withBudgeted Amounts Final Budget -
PositiveOriginal Final Actual (Negative)
REVENUESTaxes 3,475,665$ 3,475,665$ $3,506,341 $30,676Fees, Sales and Services 1,632,149 1,632,149 3,011,924 1,379,775Investment Income 280,000 280,000 297,045 17,045
Total Revenues 5,387,814 5,387,814 6,815,310 1,427,496
EXPENDITURESCurrent
Housing and Economic Development 5,878,192 8,098,192 7,184,987 913,205Intergovernmental - City 2,823,959 603,959 580,438 23,521
Total Expenditures 8,702,151 8,702,151 7,765,425 936,726
Excess (Deficiency) of Revenues Over (Under) Expenditures (3,314,337) (3,314,337) (950,115) 2,364,222
OTHER FINANCING SOURCES (USES)Transfers In - - 76,486 76,486Transfers Out - - (2,061) (2,061)
Total Other Financing Sources (Uses) - - 74,425 74,425
Net Changes in Fund Balances (3,314,337) (3,314,337) (875,690) 2,438,647
FUND BALANCE, January 1, Restated (Note 2.R.) 11,413,840 11,413,840 11,413,840 -
FUND BALANCE, December 31 8,099,503$ 8,099,503$ $10,538,150 $2,438,647
The accompanying notes are an integral part of these financial statements.
38
HOUSING AND REDEVELOPMENT AUTHORITY OF THE CITY OF SAINT PAUL
STATEMENT OF NET POSITIONPROPRIETARY FUNDSAt December 31, 2017(Amounts in dollars)
TotalHRA Loan HRA Parking HRA Penfield ProprietaryEnterprise Enterprise Enterprise Funds
ASSETS
Current Assets:
Cash and Investments with Treasurer $14,503,961 $18,959,445 $912,293 $34,375,699
Cash with Fiscal Agents - 1,059,965 - 1,059,965Cash and Investments with Trustees 808,570 - - 808,570
Accrued Interest Receivable on Investments 34,506 36,100 - 70,606
Property Taxes Receivable - 34,763 - 34,763
Accounts Receivable (Net of Allowance) 14,500 598,566 - 613,066
Assessments Receivable 13,951 - - 13,951
Land Held for Resale 4,125,142 - - 4,125,142Restricted Cash and Investments for:
General Obligation Bond Debt Service - 2,020,700 - 2,020,700
Revenue Bond Debt Service - 2,183,249 - 2,183,249
Revenue Bond Operations and Maintenance - 27,218 - 27,218
Total Current Assets 19,500,630 24,920,006 912,293 45,332,929
Noncurrent Assets:
Loans Receivable (Net of Allowance) 3,889,709 236,250 - 4,125,959
Accrued Interest Receivable on Loans (Net of Allowance) 407,181 111,663 - 518,844
Advances to Other Governmental Units 312,727 - - 312,727
Advances to Other Funds 3,136,795 564,744 - 3,701,539
Total Operating Expenses 852,407 10,309,759 - 11,162,166
OPERATING INCOME (LOSS) (567,434) 6,344,546 - 5,777,112
NONOPERATING REVENUES (EXPENSES)Property Tax Increments and Levy - 1,103,567 - 1,103,567Operating Grants 215,202 - - 215,202Investment Income:
Interest Earnings 148,131 73,465 - 221,596Increase (Decrease) in Fair Value of Investments (39,030) (22,157) - (61,187)Interest Earned - Other 149,184 - - 149,184
Interest on Notes (40,719) - - (40,719)Interest on Bonds - (1,742,642) - (1,742,642)Debt Issuance Costs - (433,684) - (433,684)Intergovernmental Revenue 330,496 - - 330,496Intergovernmental Expense (3,869,540) (2,557,946) - (6,427,486)Miscellaneous Other Revenues - - 761,141 761,141Miscellaneous Other Expenses (8,568) (8,420) (4,172) (21,160)Loss on Retirement of Assets - (242,027) - (242,027)
Total Nonoperating Revenues (Expenses) (3,114,844) (3,829,844) 756,969 (6,187,719)
Income (Loss) Before Transfers (3,682,278) 2,514,702 756,969 (410,607)
Transfers In 58,458 2,230,970 - 2,289,428Transfers Out - - (2,230,970) (2,230,970)Total Transfers 58,458 2,230,970 (2,230,970) 58,458
CHANGE IN NET POSITION (3,623,820) 4,745,672 (1,474,001) (352,149)
TOTAL NET POSITION, January 1 23,716,310 54,778,196 2,386,134 80,880,640
TOTAL NET POSITION, December 31 $20,092,490 $59,523,868 $912,133 $80,528,491
STATEMENT OF REVENUES, EXPENSES AND CHANGES IN FUND NET POSITION
For the Year Ended December 31, 2017
Business-type Activities - Enterprise Funds
The accompanying notes are an integral part of these financial statements.
41
HOUSING AND REDEVELOPMENT AUTHORITY OF THE CITY OF SAINT PAUL
STATEMENT OF CASH FLOWSPROPRIETARY FUNDSFor the Year Ended December 31, 2017(Amounts in dollars)
TotalHRA Loan HRA Parking HRA Penfield ProprietaryEnterprise Enterprise Enterprise Funds
CASH FLOWS FROM OPERATING ACTIVITIESReceipts from Customers/Borrowers $549,183 $16,600,583 $ - $17,149,766Payments to Suppliers (819,314) (7,003,234) (539,168) (8,361,716)
Net Cash Provided (Used) for Operating Activities (270,131) 9,597,349 (539,168) 8,788,050
CASH FLOWS FROM NONCAPITAL FINANCING ACTIVITIESProperty Taxes - 1,110,290 - 1,110,290Operating Grants Received 215,202 - - 215,202Repayment of Advance Made to Other Governments 78,182 - - 78,182Repayment of Advance Made to Other Funds 500,815 - - 500,815Intergovernmental Revenue 330,496 - - 330,496Intergovernmental Expense (3,869,540) (2,557,946) - (6,427,486)Non-Operating Revenue Received - - 761,141 761,141Transfers In from Other Funds 58,458 2,230,970 - 2,289,428Transfers Out to Other Funds - - (2,230,970) (2,230,970)
Net Cash Provided (Used) for Noncapital Financing Activities (2,686,387) 783,314 (1,469,829) (3,372,902)
CASH FLOWS FROM CAPITAL AND RELATED FINANCING ACTIVITIESPayments for Acquisition and Construction of Capital Assets:
Construction in Process - (197,547) - (197,547)Parking Ramps - (619,866) - (619,866)Buildings - (5,316) - (5,316)Equipment - (398,148) - (398,148)
Proceeds from Issuance of Long-Term Debt - 28,945,000 - 28,945,000Principal Paid on Debt Maturities:
Payments of Debt Service Issuance Costs - (433,684) - (433,684)
Net Cash Provided (Used) for Capital and Related Financing Activities (40,719) (8,253,312) - (8,294,031)
CASH FLOWS FROM INVESTING ACTIVITIESInterest and Dividends Received 116,416 41,375 - 157,791Investment Service Fee Paid (8,568) (8,420) (4,172) (21,160)Increase (Decrease) in the Fair Value of Investments (39,030) (22,157) - (61,187)Interest Earned - Other 149,184 - - 149,184
Net Cash Provided (Used) for Investing Activities 218,002 10,798 (4,172) 224,628
NET INCREASE (DECREASE) IN CASH AND CASH EQUIVALENTS (2,779,235) 2,138,149 (2,013,169) (2,654,255)
CASH AND CASH EQUIVALENTS, January 1 18,091,766 22,112,428 2,925,462 43,129,656
CASH AND CASH EQUIVALENTS, December 31 $15,312,531 $24,250,577 $912,293 $40,475,401
Continued
Business-type Activities - Enterprise Funds
The accompanying notes are an integral part of these financial statements.
42
HOUSING AND REDEVELOPMENT AUTHORITY OF THE CITY OF SAINT PAUL
STATEMENT OF CASH FLOWSPROPRIETARY FUNDSFor the Year Ended December 31, 2017(Amounts in dollars)
TotalHRA Loan HRA Parking HRA Penfield ProprietaryEnterprise Enterprise Enterprise Funds
Business-type Activities - Enterprise Funds
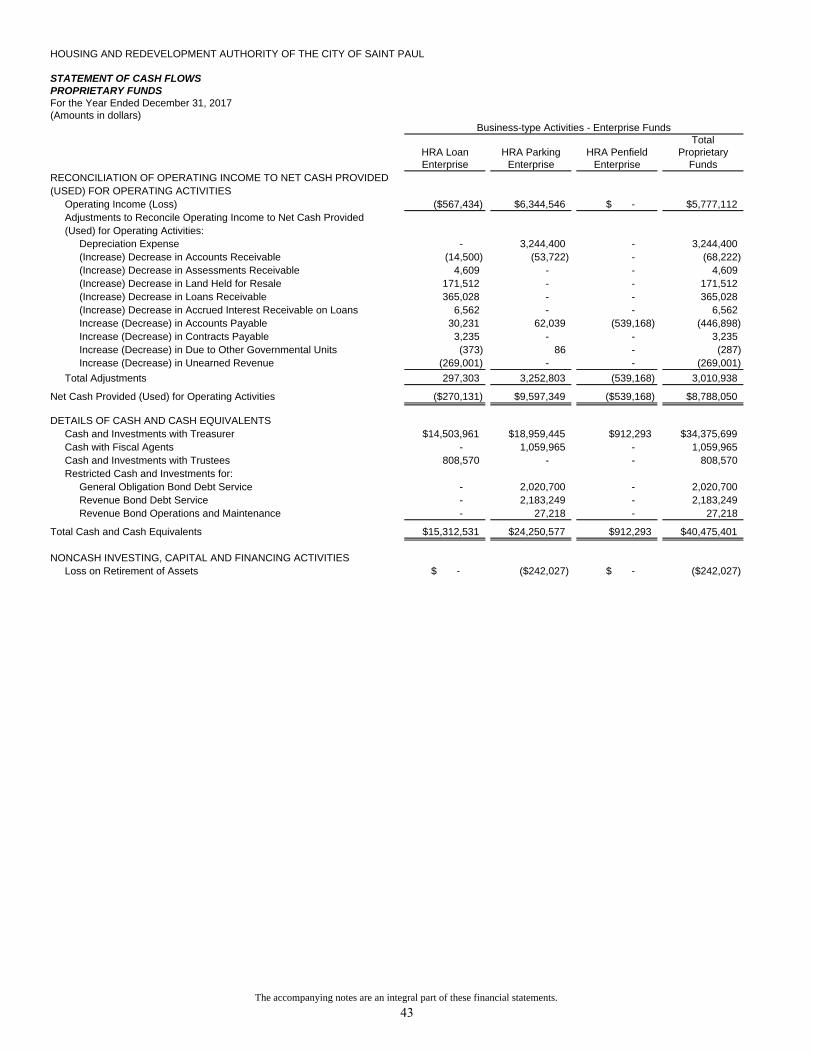
RECONCILIATION OF OPERATING INCOME TO NET CASH PROVIDED(USED) FOR OPERATING ACTIVITIES
Operating Income (Loss) ($567,434) $6,344,546 $ - $5,777,112Adjustments to Reconcile Operating Income to Net Cash Provided(Used) for Operating Activities:
Depreciation Expense - 3,244,400 - 3,244,400(Increase) Decrease in Accounts Receivable (14,500) (53,722) - (68,222)(Increase) Decrease in Assessments Receivable 4,609 - - 4,609(Increase) Decrease in Land Held for Resale 171,512 - - 171,512(Increase) Decrease in Loans Receivable 365,028 - - 365,028(Increase) Decrease in Accrued Interest Receivable on Loans 6,562 - - 6,562Increase (Decrease) in Accounts Payable 30,231 62,039 (539,168) (446,898)Increase (Decrease) in Contracts Payable 3,235 - - 3,235Increase (Decrease) in Due to Other Governmental Units (373) 86 - (287)Increase (Decrease) in Unearned Revenue (269,001) - - (269,001)( )
Total Adjustments 297,303 3,252,803 (539,168) 3,010,938
Net Cash Provided (Used) for Operating Activities ($270,131) $9,597,349 ($539,168) $8,788,050
DETAILS OF CASH AND CASH EQUIVALENTSCash and Investments with Treasurer $14,503,961 $18,959,445 $912,293 $34,375,699Cash with Fiscal Agents - 1,059,965 - 1,059,965Cash and Investments with Trustees 808,570 - - 808,570Restricted Cash and Investments for:
General Obligation Bond Debt Service - 2,020,700 - 2,020,700Revenue Bond Debt Service - 2,183,249 - 2,183,249Revenue Bond Operations and Maintenance - 27,218 - 27,218
Total Cash and Cash Equivalents $15,312,531 $24,250,577 $912,293 $40,475,401
NONCASH INVESTING, CAPITAL AND FINANCING ACTIVITIESLoss on Retirement of Assets $ - ($242,027) $ - ($242,027)
The accompanying notes are an integral part of these financial statements.
43
HOUSING AND REDEVELOPMENT AUTHORITY OF THE CITY OF SAINT PAUL SAINT PAUL, MINNESOTA
NOTES TO THE FINANCIAL STATEMENTS FOR THE FISCAL YEAR ENDED DECEMBER 31, 2017
INDEX
1. Reporting Entity
2. Summary of Significant Accounting Policies
A. Fund AccountingB. Government-Wide and Fund Financial StatementsC. Measurement Focus and Basis of AccountingD. Proprietary Fund Financial Statement PresentationE. Cash and InvestmentsF. Property TaxesG. Restricted AssetsH. Loans ReceivableI. Land Held for ResaleJ. Leases ReceivableK. Capital AssetsL. Unearned RevenuesM. Long-Term LiabilitiesN. Deferred Outflows/Inflows of ResourcesO. Net PositionP. Fund Balances – Governmental Fund Financial StatementsQ. Interfund TransactionsR. Restatement of Fund Balance
3. Reconciliation of Government-Wide and Fund Financial Statements
A. Explanation of Certain Differences Between the Governmental Fund Balance Sheet andthe Government-Wide Statement of Net Position
B. Explanation of Certain Differences Between the Governmental Fund Statement ofRevenues, Expenditures and Changes in Fund Balances and the Government-Wide Statement of Activities
4. Stewardship, Compliance and Accountability
A. Budgets and Budgetary AccountingB. General Obligation Bonds Issued by the City of Saint Paul for HRA ProgramsC. Tax Increment Financing DistrictsD. Conduit Debt ObligationsE. Deficit - Net Position of Governmental Activities
(Continued)
44
HOUSING AND REDEVELOPMENT AUTHORITY OF THE CITY OF SAINT PAUL SAINT PAUL, MINNESOTA
NOTES TO THE FINANCIAL STATEMENTS FOR THE FISCAL YEAR ENDED DECEMBER 31, 2017
INDEX
5. Detailed Notes on All Funds
A. Deposits and Investments (1) Deposits (2) Investments (3) Reconciliation (4) Net Increase (Decrease) in the Fair Value of Investments (5) Fair Value Measurement
B. Loans Receivable C. Land Held for Resale D. Leases Receivable E. Capital Assets F. Long-Term Debt
(1) Changes in Long-Term Debt (2) Description of Bonds, Notes, Advances, and Sources for Retirement (3) Annual Requirements - Principal and Interest on Long-Term Debt
G. Employee Benefits, Pension Plan Obligations H. Risk Management I. Pay-As-You-Go Tax Increment Notes J. Loan Guaranty Commitments K. Construction and Other Significant Commitments L. Deferred Outflows/Inflows of Resources M. Interfund Transactions
(1) Interfund Receivables and Payables (2) Interfund Transfers
N. Net Position/Fund Balances (1) Net Position - Governmental Activities (2) Net Position - Business-type Activities (3) Fund Balances - Governmental Funds
6. Contingent Liabilities
7. Subsequent Events
45
HOUSING AND REDEVELOPMENT AUTHORITY OF THE CITY OF SAINT PAUL, MINNESOTA NOTES TO THE FINANCIAL STATEMENTS For the Fiscal Year Ended December 31, 2017
1. Reporting Entity
The Housing and Redevelopment Authority of the City of Saint Paul, Minnesota, (HRA) is a public agency established pursuant to Minn. Laws 1947, Ch. 487, as codified at Minn. Stat. Ch. 469, to undertake urban renewal programs. These programs strive to redevelop the residential, commercial, and industrial areas of the City of Saint Paul (City) and to provide adequate jobs, a sound fiscal base, and a variety of affordable housing for City residents. The HRA is governed by a seven-member Board of Commissioners consisting of the members of the City Council.
The HRA was reorganized during 1978 and 1979. This reorganization consisted of the following:
A. The HRA employees became employees of the City (Note 5.G.). B. The Public Housing Agency was spun off and became a separate governmental entity. C. The HRA and the City entered into an agreement, effective January 1, 1979, whereby the
City agreed to perform administrative and accounting services for the HRA.
The HRA, for financial reporting purposes, includes all funds for which the HRA is financially accountable. Financial accountability was determined on the basis of selection of the governing body, ability to impose will, a financial benefit/burden relationship, and fiscal dependency including approval of budgets, tax levies, and bonded debt issuance. In applying the above financial accountability criteria, it has been determined that there is a component unit of the HRA.
Also, in applying the financial accountability criteria, it has been determined that the HRA is a component unit of the City of Saint Paul and is, therefore, included in the City’s Comprehensive Annual Financial Report for the fiscal year ended December 31, 2017. The HRA’s Board of Commissioners consists of the members of the City Council. The City also has the ability to impose its will on the HRA since City staff are responsible for the day-to-day management of the HRA. The City gives final substantive approval to HRA budgets and HRA tax levies. The financial data of the HRA is blended into the City’s Comprehensive Annual Financial Report. Copies of the City’s Comprehensive Annual Financial Report for the fiscal year ended December 31, 2017, can be obtained from the Financial Services Office, Accounting Section, 110 City Hall, Saint Paul, Minnesota 55102.
Blended Component Unit
The following component unit has been presented as a blended component unit because the component unit’s governing body is the same as the governing body of the Housing and Redevelopment Authority of the City of Saint Paul (HRA) and the HRA has operational responsibility for the component unit.
Penfield Apartments, LLC
Penfield Apartments, LLC is the developer and owner of a 253-unit market rate apartment complex, with structured parking and a grocery store located in the complex. It is a special purpose entity LLC, financed primarily by a HUD guaranteed mortgage, and is wholly owned by a single entity, the HRA. The City of Saint Paul’s HRA Board of Commissioners act as the Penfield Apartments, LLC board. The Penfield Apartments were sold on September 22, 2016, and the sales proceeds
46
HOUSING AND REDEVELOPMENT AUTHORITY OF THE CITY OF SAINT PAUL, MINNESOTA NOTES TO THE FINANCIAL STATEMENTS For the Fiscal Year Ended December 31, 2017
Note 1. (Continued) paid off the mortgages. Separate financial statements since then are not available.
Joint Venture
The Minneapolis/Saint Paul Housing Finance Board (the Board) was established in accordance with a Joint Powers Agreement entered into between the HRA and the former Minneapolis Community Development Agency (MCDA), and accepted by the cities of Minneapolis and Saint Paul under State of Minnesota laws. The governing bodies of the HRA and the City of Minneapolis each appoint three of the six members of the Board. The Board was created for the public purpose of providing decent, safe, sanitary, and affordable housing to the residents of the City of Saint Paul and the City of Minneapolis. The powers exercised by the Board include the power to undertake financing programs to implement individual components of the housing plan for each city and to issue revenue bonds to finance such programs. All bonds are special limited obligations of the Board and shall be payable only out of funds specifically pledged for each issue. Total net position at December 31, 2017, was $8,547,925. The 2017 operations resulted in a decrease of $372,924 to net position. During 2017, there were no distributions made from the Board to Minneapolis/Saint Paul.
Upon dissolution of the Board, all properties acquired by the Board and any surplus monies shall be distributed to the HRA and the City of Minneapolis in the proportion and otherwise pursuant to directions provided in the related indenture of trust or other bond documents. If properties acquired by the Board and any surplus monies are not traceable to a particular bond issue or the indenture is silent as to distribution of the assets upon discharge of the issue, the assets shall be distributed on the basis of the amount of funds each entity has contributed that would affect those assets. The respective percentage shares of the HRA and the City of Minneapolis in the Board’s assets, liabilities, and equity were not determined at December 31, 2017. There has been no investment made by the HRA in the joint venture. Thus, the financial statements do not reflect an equity interest in the joint venture. Complete financial statements of the Board can be obtained from the City of Saint Paul, Department of Planning and Economic Development, 1400 City Hall Annex, 25 West Fourth Street, Saint Paul, Minnesota 55102.
2. Summary of Significant Accounting Policies
The Governmental Accounting Standards Board (GASB) is the accepted standard-setting body for establishing generally accepted accounting principles (GAAP) for government units through its pronouncements (statements and interpretations). The financial statements of the HRA have been prepared in conformity with GAAP in the United States of America as applied to government units.
47
HOUSING AND REDEVELOPMENT AUTHORITY OF THE CITY OF SAINT PAUL, MINNESOTA NOTES TO THE FINANCIAL STATEMENTS For the Fiscal Year Ended December 31, 2017
Note 2. (Continued) A summary of the significant accounting policies follows:
A. Fund Accounting
The HRA’s accounting is organized on the basis of funds. Fund accounting is designed to demonstrate legal compliance and to aid financial management by segregating transactions related to certain government functions or activities. Each fund is a separate accounting entity having its own assets, liabilities, equities, revenues, and expenditures or expenses, as appropriate. Government financial resources are allocated to and accounted for in individual funds based upon the purposes for which they are to be spent and the means by which spending activities are controlled. All HRA funds are reported as major funds. A description of the funds follows:
Governmental Funds
HRA General Fund - accounts for all financial resources of the HRA, except those accounted for in another fund.
HRA Grants Special Revenue Fund - accounts for specific revenue sources, primarily federal and state grants, which are restricted or committed to expenditure for specified purposes.
HRA Debt Service Fund - accounts for the financing and payments made on the HRA’s long-term general debt.
HRA Tax Increment Capital Projects Fund - accounts for the resources segregated for the purpose of financing capital projects, primarily in Saint Paul’s tax increment financing districts.
HRA Development Capital Projects Fund - accounts for multi-year development projects that are locally financed.
Proprietary Funds
HRA Loan Enterprise Fund - accounts for loans issued and services related to housing and business assistance. HRA Parking Enterprise Fund - accounts for the HRA’s parking facility operations that are financed primarily by parking fees.
HRA Penfield Enterprise Fund - accounts for the operations and debt service for the Penfield Apartments. The Penfield Apartments were sold in 2016.
48
HOUSING AND REDEVELOPMENT AUTHORITY OF THE CITY OF SAINT PAUL, MINNESOTA NOTES TO THE FINANCIAL STATEMENTS For the Fiscal Year Ended December 31, 2017
Note 2. (Continued) B. Government-Wide and Fund Financial Statements
The government-wide financial statements (Statement of Net Position and Statement of Activities) report information on all of the activities of the HRA. Governmental activities, which are normally supported by taxes and intergovernmental revenues, are reported separately from business-type activities, which rely to a significant extent on fees and user charges. Interfund transactions within governmental activities and interfund transactions within business-type activities have been removed from these statements. Any residual balances outstanding between the governmental activities and business-type activities are reported in the government-wide financial statements as “internal balances”.
The Statement of Activities demonstrates the degree to which the direct expenses of a given function are offset by program revenues. Direct expenses are those that are clearly identifiable with a specific function. Program revenues include: (1) charges to customers who use services provided by a given function and (2) grants and contributions that are restricted to meeting the operational or capital requirements of a particular function. Taxes and other revenues not properly included among program revenues are reported as general revenues.
Separate financial statements are provided for governmental funds and proprietary funds. All HRA funds are considered major funds and are reported as separate columns in the fund financial statements section of the basic financial statements.
C. Measurement Focus and Basis of Accounting
The government-wide financial statements are reported using the economic resources measurement focus and the full accrual basis of accounting, as are the proprietary fund financial statements. Revenues are recognized when earned and expenses are recognized when a liability is incurred, regardless of the timing of related cash flows. Property taxes are recognized in the year for which they are levied. Grants and contributions are recognized as revenue when eligibility requirements imposed by the provider have been met.
Governmental fund financial statements are reported using the current financial resources measurement focus and the modified accrual basis of accounting. Revenues
Governmental fund revenues are recognized in the accounting period in which they become susceptible to accrual - that is, when they become both measurable and available to finance the expenditures of the fiscal period. “Available” means collectible within the current period or soon enough thereafter to be used to pay liabilities of the current period. Revenues for nonexchange transactions are recognized based on the principal characteristics of the revenue. Exchange transactions are recognized as revenue when the exchange occurs.
49
HOUSING AND REDEVELOPMENT AUTHORITY OF THE CITY OF SAINT PAUL, MINNESOTA NOTES TO THE FINANCIAL STATEMENTS For the Fiscal Year Ended December 31, 2017
Note 2.C. (Continued) Nonexchange Transactions
Derived tax revenue transactions result from assessments imposed by governments on exchange transactions.
Imposed nonexchange transactions result from assessments by governments on nongovernmental entities and individuals. Property taxes are imposed nonexchange transactions. Revenues from property taxes are recognized in the period for which they were levied to the extent they are collected in the current period or soon enough thereafter to be used to pay liabilities of the current period. Property taxes receivable but not available are reported as deferred inflows of resources and will be recognized as revenue in the fiscal year that they become available. The HRA considers these revenues as available if they are collected within 60 days after year-end.
Government-mandated nonexchange transactions occur when a government at one level provides resources to a government at another level and requires that government to use them for a specific purpose. The provider government establishes purpose restrictions and may also establish time requirements. Federal and state grants mandating the HRA perform particular programs are government-mandated nonexchange transactions. Revenues are recognized when the eligibility and time requirements are met, usually when the corresponding HRA expenditure is incurred, using the guidelines of the legal and contractual requirements of the individual programs.
Voluntary nonexchange transactions result from legislative or contractual agreements, such as entitlements and donations. The provider may establish purpose restrictions and eligibility requirements. Revenues are recognized in the year to which they apply according to statute or contract. Contributions from individuals and miscellaneous revenues are also considered voluntary nonexchange transactions and are generally recognized when received in cash because they are usually not measurable until received. Tax credits paid by the state (included in intergovernmental revenue) are recognized as revenue in the fiscal year that they become available. The HRA considers revenues from tax credits paid by the state as available if they are collected within 60 days after year-end. Exchange Transactions
Exchange transactions include revenues such as interest earned and fees, sales, and services. Interest earned is reported as revenue when it becomes both measurable and available to finance expenditures of the fiscal period. The HRA considers this revenue as available if it is collected within 60 days after year-end. Fees, sales, and services are reported as revenue when received in cash because they are usually not measurable until received.
50
HOUSING AND REDEVELOPMENT AUTHORITY OF THE CITY OF SAINT PAUL, MINNESOTA NOTES TO THE FINANCIAL STATEMENTS For the Fiscal Year Ended December 31, 2017
Note 2.C. (Continued)
Expenditures
Expenditures are recorded under the modified accrual method in the accounting period in which the fund liability is incurred, with the exception of principal and interest on general long-term debt, which is recognized when due, and claims and judgments, which are recognized when the obligations are due and payable.
D. Proprietary Fund Financial Statement Presentation
Proprietary funds distinguish operating revenues and operating expenses from nonoperating items. Operating revenues and expenses generally result from providing services in connection with a proprietary fund’s principal ongoing operations. The principal operating revenue of the HRA Loan Enterprise Fund is the payment of interest from loan recipients and fee revenue from customers who have received loans or grants from the HRA, while the principal operating expenses are administration, bad debts, and loans. The principal operating revenue of the HRA Parking Enterprise Fund is parking fees from parking ramp customers, while the principal operating expenses are parking operation costs, administration, and depreciation on capital assets. All revenues and expenses not meeting these criteria in each fund are reported as non-operating revenues and expenses. The Penfield Apartments were sold in 2016; thus there are no operating activities reported in 2017.
E. Cash and Investments
The City maintains a cash and investments pool which is available for use by all HRA funds. Each fund’s portion of this pool is displayed in the financial statements within “Cash and Investments with Treasurer.” Cash and investments are also maintained by trustees of the HRA under certain revenue bond indentures.
Investments are reported at fair value using a market approach with the exception of non-negotiable investment contracts, certain external investment pools, and money market investments, including commercial paper, banker’s acceptances, and U.S. Treasury and agency obligations that have a remaining maturity at time of purchase of one year or less.
Other than certain external investment pools, these exceptions are reported at amortized cost provided that the fair value of these investments is not significantly affected by the impairment of the credit standing of the issuer. Investments in certain external investment pools are measured at the net asset value per share provided by the pool. All investment income, including changes in the fair value of investments, is reported as revenue.
51
HOUSING AND REDEVELOPMENT AUTHORITY OF THE CITY OF SAINT PAUL, MINNESOTA NOTES TO THE FINANCIAL STATEMENTS For the Fiscal Year Ended December 31, 2017
Note 2.E. (Continued) For purposes of the Statement of Cash Flows, the proprietary fund’s cash equivalents are cash on hand, cash in banks, and highly liquid investments having original maturities (time span from purchase date to maturity date) of three months or less. Included in the classification of cash equivalents are cash and investments with treasurer, cash with fiscal agent, cash and investments with trustees, and restricted cash.
F. Property Taxes
Property tax levies are set by the HRA Board of Commissioners and approved by the City Council in December of each year and certified to Ramsey County for collection in the following year. In Minnesota, counties act as collection agents for all property taxes. The County spreads all levies over taxable assessed property. Taxable assessed property values are established by Ramsey County and reviewed by the State of Minnesota. In determining property taxes, estimated market values are converted to tax capacities based on a statutory rate for each class of property. Property taxes become a lien on taxable property on January 1 in the year of collection and are recorded as receivable by the HRA on that date. Property taxes may be paid by taxpayers in two equal installments on May 15 and October 15. Property tax revenue is recognized in the year for which it is levied. Property taxes which remain unpaid at December 31 are classified as delinquent taxes receivable. In the governmental funds balance sheet, the delinquent taxes receivable are offset by deferred inflows of resources, if not collected within 60 days after year-end, because they are not known to be available to finance current expenditures. In the government-wide financial statements, delinquent taxes receivable are recognized as revenue. Property tax increments from the tax increment districts listed in Note 4.C. to the financial statements are levied by the City but deposited to HRA funds.
G. Restricted Assets
Certain proceeds of HRA Parking Enterprise Fund revenue and general obligation bonds, as well as certain resources set aside for their repayment, are classified as restricted assets on the Statement of Net Position because their use is limited by applicable bond covenants. The revenue bond, and general obligation bond accounts are used to segregate resources accumulated for debt service payments over the next 12 months. The revenue bond operations and maintenance account is used to segregate resources set aside to subsidize potential deficiencies from the parking operations that could adversely affect debt service payments. Program income for the HUD Rental Rehab Program is restricted in the HRA Loan Enterprise Fund because it may only be used for affordable housing in accordance with applicable HOME program rules.
52
HOUSING AND REDEVELOPMENT AUTHORITY OF THE CITY OF SAINT PAUL, MINNESOTA NOTES TO THE FINANCIAL STATEMENTS For the Fiscal Year Ended December 31, 2017
Note 2. (Continued) H. Loans Receivable
Loans have been issued by the HRA to financially assist private developers in various Saint Paul development projects or to provide housing or commercial rehabilitation financing for Saint Paul property owners. The loans are secured by property mortgages. Loans receivable are reported as an asset in the amount of loan proceeds, less collections on principal. An allowance for uncollectible loans, which offsets the total gross loans receivable, is recognized for the amount of loans receivable for which collection is doubtful or questionable. This allowance is based on an analysis of credit risk and payment delinquency. Interest earned on the loans is recognized as revenue. In governmental funds, the revenue from net loans receivable is not currently available and is reported as deferred inflows of resources, and revenues are recognized when principal payments are received. Unavailable revenue is eliminated when converting the governmental funds balance sheet to the governmental activities column on the Statement of Net Position. In the HRA Loan Enterprise Fund, unearned revenue is reported on the proprietary funds Statement of Net Position for grant-funded net loans receivable, and revenues are recognized when principal payments are received. In the HRA Parking Enterprise Fund, there is no unearned revenue reported on the proprietary funds Statement of Net Position and revenues are recognized when loans are receivable and allowances are recorded.
I. Land Held for Resale
Land is acquired by the HRA for subsequent resale for redevelopment purposes and not as an investment program. In order to entice development, the land is often resold at prices substantially lower than the HRA’s cost. Land Held for Resale is reported as an asset at the net realizable value for all assets acquired before 2009 and at cost of purchase for all assets purchased after 2009 in the fund which acquired it. In governmental funds, land acquired is reported as an expenditure in the amount of the acquisition cost and as revenue for the same amount. When the land is subsequently sold, revenue is recognized for the sale amount. In the government-wide financial statements, a write-down of the land to market value is reported as an expense.
J. Leases Receivable
The HRA, as the lessor, entered into a lease agreement with the City of Saint Paul during the year ended December 31, 2009, through which the HRA is leasing certain improvements made to the RiverCentre Parking Ramp. The cost of the improvements was financed by the HRA through the issuance of the RiverCentre Parking Facility Lease Revenue Bonds, Note Series 2009. The lease is reported as a direct financing lease since the HRA has transferred substantially all of the risks and benefits of ownership of the improvements to the City, and the HRA is financing an in-substance purchase of the improvements by the City. Under the lease, the City has an option to purchase the improvements at any time prior to the expiration of the lease for the amount of any remaining outstanding bonds plus $1.
53
HOUSING AND REDEVELOPMENT AUTHORITY OF THE CITY OF SAINT PAUL, MINNESOTA NOTES TO THE FINANCIAL STATEMENTS For the Fiscal Year Ended December 31, 2017
Note 2.J. (Continued) The present value of the total lease payments to be received under the lease agreement is recognized as leases receivable in the HRA Debt Service Fund. Deferred inflows of resources in an amount equal to the leases receivable is also reported in the HRA Debt Service Fund since none of the receivable is considered to be available to finance expenditures of the current period. In the government-wide financial statements, this deferred inflows of resources is eliminated when converting the governmental funds balance sheet to the governmental activities column on the Statement of Net Position.
K. Capital Assets
Capital assets, which include land, buildings, pedestrian skyway bridges, parking ramp structures and parking lots, equipment, and construction in progress are reported in the applicable governmental or business-type activities column in the government-wide financial statements and in the applicable proprietary fund financial statements. Capital assets are not reported on the governmental funds balance sheet. All capital assets are reported at cost if purchased or constructed, or at acquisition value if received as a gift or contribution. The reported amount of the capital assets is not reflective of the current value. The cost of normal maintenance and repairs that do not add to the value of the asset or materially extend asset lives are not capitalized. Interest incurred during the construction phase of capital assets of business-type activities is included as part of the capitalized value of the assets constructed. Land and construction in progress is not depreciated. The equipment is depreciated over a ten-year useful life. The parking lots are depreciated over a 15-year useful life. Buildings, parking ramps, and pedestrian skyway bridges are depreciated over a 30-year or 40-year useful life. The depreciation method used is straight-line. Capital assets are defined by the HRA as assets with an estimated useful life in excess of two years and individual cost exceeding the following thresholds:
Land any amount Equipment $ 5,000 Buildings 50,000 Parking ramps 20,000 Pedestrian skyway bridges 20,000
L. Unearned Revenues
Unearned revenue arises when resources are received by the HRA before it has a legal claim to them, as when grant monies are received prior to the incurrence of qualifying expenditures. In subsequent periods, when revenue recognition criteria are met, or when the HRA has a legal claim to the resources, the liability for unearned revenue is removed and revenue is recognized. This is true for both the government-wide and the fund financial statements.
54
HOUSING AND REDEVELOPMENT AUTHORITY OF THE CITY OF SAINT PAUL, MINNESOTA NOTES TO THE FINANCIAL STATEMENTS For the Fiscal Year Ended December 31, 2017
Note 2. (Continued)
M. Long-Term Liabilities
In the government-wide financial statements and proprietary funds in the fund financial statements, long-term debt is reported as a liability in the applicable governmental activities, business-type activities, or proprietary fund Statements of Net Position. Bond discounts and premiums, are deferred and amortized over the life of the bonds using the straight-line interest method. Bonds payable are reported net of the applicable bond premium or discount. In the fund financial statements, governmental fund types recognize bond discounts and premiums during the current period. The face amount of debt is reported as other financing sources for governmental funds. Premiums received on debt issuances are reported as other financing sources while discounts on debt issuances are reported as other financing uses. Issuance costs, whether or not withheld from the actual debt proceeds received, are reported as debt service expenditures.
N. Deferred Outflows/Inflows of Resources In addition to assets, the statement of financial position will sometimes report a separate
section for deferred outflows of resources. This separate financial statement element, deferred outflows of resources, represents a consumption of net position that applies to future period(s) and so will not be recognized as an outflow of resources (expense/ expenditure) until then. The HRA has deferred outflows for refundings of debt that qualify for reporting in this category in the business-type activities and proprietary fund Statement of Net Position. This deferred charge on bond refunding results from the difference in the carrying value of refunded debt and its reacquisition price. This amount is deferred and amortized over the shorter of the life of the refunded or refunding debt.
In addition to liabilities, the statement of financial position will sometimes report a separate section for deferred inflows of resources. This separate financial statement element, deferred inflows of resources, represents an acquisition of net position that applies to a future period(s) and so will not be recognized as an inflow of resources (revenue) until that time. The HRA has the following items, which arise only under a modified accrual basis of accounting, that qualify for reporting in this category. Accordingly, these items, various unavailable revenues, are reported only in the governmental funds balance sheet. The governmental funds report unavailable revenues from six sources: property tax levy and increments, investment interest receivable, accounts receivable, note and loans receivable, and lease receivable. These amounts are recognized as an inflow of resources in the period that the amounts become available.
O. Net Position
In the government-wide financial statements and the proprietary fund financial statements, net position includes three components. First is the amount for Net Investment in Capital Assets. Second, restricted net position reports amounts that have restrictions imposed by parties outside the HRA (such as creditors, grantors, or federal or state laws). Finally, the difference between total net position and the first two components is unrestricted net position.
55
HOUSING AND REDEVELOPMENT AUTHORITY OF THE CITY OF SAINT PAUL, MINNESOTA NOTES TO THE FINANCIAL STATEMENTS For the Fiscal Year Ended December 31, 2017
Note 2.O. (Continued) When both restricted and unrestricted resources are available for use, it is the HRA’s policy to use restricted resources first, if legally permissible, then unrestricted resources as they are needed.
P. Fund Balances - Governmental Fund Financial Statements
In the fund financial statements, governmental funds report components of fund balance to provide information about fund balance availability for appropriation. Nonspendable fund balance represents amounts that cannot be spent because they are not in spendable form, or are legally or contractually required to be maintained intact. Restricted fund balance represents amounts to be spent for specific purposes as determined by enabling legislation or imposed by grantors or debt covenants; used before unrestricted fund balance when an expenditure is incurred for which both restricted and unrestricted fund balance is available.
Committed fund balance classification includes amounts that can be used only for the specific purposes determined by a board resolution of the HRA Board of Commissioners. Once the resolution is passed, the limitation imposed by the resolution remains in place until the HRA Board of Commissioners passes a resolution removing or revising the limitation, or the specific fund balance amount is spent. The HRA Board of Commissioners is the highest level of decision-making authority for the HRA.
Amounts in the assigned fund balance classification are intended to be used by the HRA for HRA spending purposes but do not meet the criteria to be classified as committed. The HRA Board of Commissioners has assigned fund balance when appropriating fund balance to cover a gap between estimated revenue and appropriations in the subsequent year’s appropriated budget. Assignments may be removed without an additional resolution being passed.
Unassigned fund balance is the residual classification for the General Fund and includes all spendable amounts not contained in the other classifications. When any combination of committed, assigned, and unassigned resources are available for use, it is the HRA’s policy to use committed resources first, then assigned, then unassigned resources as needed.
Q. Interfund Transactions
Interfund services provided and used are accounted for as revenues and expenditures or expenses. Transactions that constitute reimbursements to a fund for expenditures/expenses initially made from it that are properly applicable to another fund, are recorded as expenditures/expenses in the reimbursing fund and as reductions of expenditures/expenses in the fund that is reimbursed. All other interfund transactions are reported as transfers. Transfers between governmental funds and transfers between proprietary funds are eliminated in the government-wide financial statements.
56
HOUSING AND REDEVELOPMENT AUTHORITY OF THE CITY OF SAINT PAUL, MINNESOTA NOTES TO THE FINANCIAL STATEMENTS For the Fiscal Year Ended December 31, 2017
Note 2. (Continued) R. Restatement of Fund Balance
The January 1, 2017 fund balances for various governmental funds were corrected to eliminate certain components of deferred inflows and include them as a component of fund balance and classify them accordingly. The details of these changes are as follows:
HRA Tax HRAIncrement Development Total
HRA General HRA Grants HRA Debt Capital Capital GovernmentalFund Fund Service Fund Projects Fund Projects Fund Funds
Fund Balances, January 1, 2017
as Previously Reported 11,085,847$ 326,780$ 11,533,266$ 28,432,576$ 11,231,563$ 62,610,032$
Eliminate Deferred Inflows - Land Held for Resale 327,993 - - 982,328 832,533 2,142,854
Fund Balances, January 1, 2017
as Restated 11,413,840$ 326,780$ 11,533,266$ 29,414,904$ 12,064,096$ 64,752,886$
3. Reconciliation of Government-Wide and Fund Financial Statements A. Explanation of Certain Differences Between the Governmental Fund Balance Sheet and the Government-Wide Statement of Net Position
The Governmental Fund Balance Sheet includes a reconciliation between fund balances - total governmental funds and net position - governmental activities as reported in the Government-wide Statement of Net Position.
The third element of that reconciliation explains that “long-term liabilities, including bonds, notes, and advances payable, are not due and payable in the current period and, therefore, are not reported in the funds”. The details of this ($60,288,738) difference are as follows:
Governmental activities premium on bonds payable $ (835,757)Governmental activities net bonds payable (37,584,000)Governmental activities notes payable (11,849,876)Governmental activities advances from other governments (9,360,000)Accrued interest payable (659,105)
Net Adjustment to Decrease Fund Balance - Total
Governmental Funds to Arrive at Net Position -
Governmental Activities $ (60,288,738)
57
HOUSING AND REDEVELOPMENT AUTHORITY OF THE CITY OF SAINT PAUL, MINNESOTA NOTES TO THE FINANCIAL STATEMENTS For the Fiscal Year Ended December 31, 2017
Note 3. (Continued)
B. Explanation of Certain Differences between the Governmental Fund Statement of Revenues, Expenditures and Changes in Fund Balances and the Government-Wide Statement of Activities
The Governmental Fund Statement of Revenues, Expenditures and Changes in Fund Balances includes a reconciliation between net changes in fund balances - total governmental funds and changes in net position of governmental activities as reported in the Government-wide Statement of Activities.
The third element of that reconciliation explains that “the issuance of long-term debt provides current financial resources to governmental funds, while the repayment of principal on long-term debt consumes the current financial resources of governmental funds. Neither transaction has any effect on net position. Also, governmental funds report the effect of premiums and discounts when debt is issued, whereas, these amounts are amortized in the Statement of Activities”. The details of this $4,828,706 difference are as follows:
2017 amortization of premium $ 85,566 2017 principal payments on bonds 4,235,000 2017 principal payments on notes 508,140
Net Adjustment to Increase Net Changes in Fund Balances -
Total Governmental Funds to Arrive at Changes in Net
Position of Governmental Activities $ 4,828,706
The fourth element of that reconciliation explains that “some expenses reported in the Statement of Activities do not require the use of current financial resources and, therefore, are not reported as expenditures in governmental funds”. The details of this $1,208,403 difference are as follows:
Accrued interest on bonds:
At December 31, 2016 $ 680,606
At December 31, 2017 (632,806)
Accrued interest on notes:
At December 31, 2016 36,902
At December 31, 2017 (26,299)
Pollution remediation obligation 1,150,000
Net Adjustment to Decrease Net Changes in Fund Balances -
Total Governmental Funds to Arrive at Changes in Net
Position of Governmental Activities $ 1,208,403
58
HOUSING AND REDEVELOPMENT AUTHORITY OF THE CITY OF SAINT PAUL, MINNESOTA NOTES TO THE FINANCIAL STATEMENTS For the Fiscal Year Ended December 31, 2017
4. Stewardship, Compliance and Accountability A. Budgets and Budgetary Accounting
The HRA followed these procedures in establishing the 2017 budget:
The Executive Director presented a proposed budget to the HRA Board of Commissioners for the fiscal year commencing the following January 1, 2017. This budget included proposed expenditures and other uses and the means of financing them. Upon approval by the HRA Board, the Executive Director submitted the budget to the Mayor of the City of Saint Paul who submitted this budget to the City Council for consideration, approval, and certification. All budget amendments that authorize an increase in total fund spending require approval by the HRA Board of Commissioners. Amendments transferring budgeted amounts between cost centers within the same fund require administrative approval by the HRA Executive Director and the City Office of Financial Services Director. On May 24, 2017, the HRA Board revised the policy for HRA budget amendments, requiring HRA Board approval for budget amendments transferring greater than $100,000 of budget amounts between cost centers in the HRA Development Capital Projects Fund.
All annual governmental fund budgets are adopted on a basis consistent with GAAP. Multi- year governmental fund budgets are utilized in the grants special revenue fund and the capital projects funds. Unexpended appropriation balances lapse at the end of the fiscal year in the annual operating budgets. Unexpended appropriation balances do not lapse at the end of the fiscal year in the multi-year budgets. Encumbrance accounting, under which purchase orders are recorded, is used. Encumbrances outstanding at year-end represent the estimated amount of the expenditures ultimately to result if unperformed contracts in process at year-end are completed. Encumbrances outstanding at year-end were not reported as expenditures or liabilities in the financial statements. The encumbrances are reappropriated and honored in the subsequent year. Formal automated budgetary integration is employed as a management control device during the year. The legal level of budgetary control (that is, the level at which expenditures and other financing uses cannot legally exceed the appropriated amount) is at the fund level. Appropriations are controlled administratively at the project/activity level within multi-year budgeted funds. Governmental and proprietary funds with annually adopted budgets are controlled administratively at the accounting unit level and within the following major object levels of expenditure: debt service, services and supplies, equipment, and transfers out. Management is authorized to spend within the above stated administration limits without an HRA Board approved budget amendment or a budget amendment approved by the HRA Executive Director and the City Office of Financial Services Director.
59
HOUSING AND REDEVELOPMENT AUTHORITY OF THE CITY OF SAINT PAUL, MINNESOTA NOTES TO THE FINANCIAL STATEMENTS For the Fiscal Year Ended December 31, 2017
Note 4.A. (Continued)
Spending budgets are controlled by encumbering requisitions and purchase orders. Encumbering instruments which exceed available appropriations are not authorized until additional appropriations are made available. There were no significant encumbrances for the annually budgeted funds at the end of 2017.
B. General Obligation Bonds Issued by the City of Saint Paul for HRA Programs
During 1995, the City of Saint Paul issued Midway Marketplace Tax Increment General Obligation Bonds, Series 1995A, in the amount of $7,660,000. Proceeds from the Series 1995A bonds were used to provide financing for certain public redevelopment costs in an area referred to as Midway Marketplace. During 2005, the City issued the Snelling-University Tax Increment Refunding Bonds, Series 2005C in the amount of $5,130,000 which refunded the 1995 Bonds. During 2014, the City issued Snelling-University Taxable General Obligation Refunding Bonds, Series 2014D in the amount of $1,995,000 which refunded the 2005 bonds. The bonds have a City general obligation pledge but are to be retired using tax increments from the HRA’s Snelling-University District and certain shortfall payments from the project developers as defined in the development agreements. The final scheduled debt service payments were made in 2017 for the Series 2014D bonds (Note 5.F.).
During 1998, the City of Saint Paul issued Block 39 Tax Increment General Obligation Bonds, Series 1998A and Series 1998B, in the amount of $21,255,000 and $18,745,000, respectively. Proceeds from the Series 1998A and Series 1998B were used to finance the acquisition of Block 39 properties in the downtown area and to construct a parking facility and retail space. During 2009, the City issued the Block 39 Tax Increment Refunding Bonds, Series 2009G and 2009H, in the amount of $20,695,000 and $8,655,000, respectively, which refunded the 1998 Bonds. The bonds have a City general obligation pledge but are to be retired using tax increments from the HRA’s Block 39 Lawson/Arena District and revenues from the parking facility. The outstanding Series 2009G bonds are reported as a liability in the HRA Parking Enterprise Fund and in the business-type activities column of the HRA’s Government-wide Statement of Net Position (Note 5.F.).
In March 2010, the City of Saint Paul issued Koch Mobil Tax Increment Refunding Bonds, Series 2010A, in the amount of $2,670,000. The proceeds of the 2010 bonds were used to currently refund Koch Mobil Tax Increment Bonds, Series 2007B. The bonds are to be retired using HRA tax increment revenue from the Koch Mobil Tax Increment District. The City has issued a general obligation pledge on the 2010 bonds. The outstanding Series 2010A bonds are reported as a liability in the governmental activities column of the HRA’s Government-wide Statement of Net Position (Note 5.F.).
In August 2011, the City of Saint Paul issued US Bank Tax Increment Refunding Bonds, Series 2011F and 2011G, in the amount of $3,060,000 and $8,870,000, respectively, which refunded the 2001 bonds. The bonds have a City general obligation pledge but are to be retired using tax increments from the HRA’s US Bank Riverfront Renaissance District. The outstanding Series 2011G bonds are reported as a liability in the governmental activities column of the HRA’s Government-wide Statement of Net Position (Note 5.F).
60
HOUSING AND REDEVELOPMENT AUTHORITY OF THE CITY OF SAINT PAUL, MINNESOTA NOTES TO THE FINANCIAL STATEMENTS For the Fiscal Year Ended December 31, 2017
Note 4. (Continued) C. Tax Increment Financing Districts
Pursuant to state law, the following tax increment financing districts have been established in Saint Paul and are administered by the HRA.
Outstanding Long-Term
District YearDuration
of Debt
(Including Number District Established District Advances)
83 Spruce Tree Centre/Metz Bakery Area 1987 26 years $ - 87 Riverfront 1987 26 years -
100 Neighborhood Business Development - Scattered Sites
1988 26 years -
135 Snelling - University 1990 26 years - 193 Hubbard Site 1997 26 years - 194 1919 University 1997 26 years - 212 Block 4 Minnesota Mutual 1997 26 years 1,153,056 213 Block 39 Lawson/Arena 1997 26 years 16,350,000 215 Superior Street Cottages 1998 26 years - 224 North Quadrant Phase 1 - Essex 2000 26 years 805,000 225 Riverfront Renaissance-Upper Landing 2001 26 years 14,361,819 228 Emerald Park – Emerald Gardens 2002 26 years 5,075,000 232 Straus Building 2002 26 years - 233 North Quadrant Expansion 1 - Dakota 2003 26 years 946,000 234 Phalen Village 2001 26 years - 236 J. J. Hill 2001 26 years 2,639,000 237 Osceola Park 2002 26 years - 240 Bridgecreek Senior Place 2003 26 years - 241 North Quadrant Phase 2 2004 26 years 963,000 243 Shepard - Davern Owner Occupied 2003 26 years - 245 Shepard - Davern Senior Rental 2003 26 years - 248 Koch Mobil 2004 26 years 4,023,384 257 Payne Phalen 2005 26 years 9,340 260 North Quadrant - Sibley 2006 26 years -
61
HOUSING AND REDEVELOPMENT AUTHORITY OF THE CITY OF SAINT PAUL, MINNESOTA NOTES TO THE FINANCIAL STATEMENTS For the Fiscal Year Ended December 31, 2017
Note 4.C. (Continued)
Outstanding Long-Term
District YearDuration
of Debt
(Including Number District Established District Advances)
261 Riverfront Renaissance - US Bank 2006 26 years 8,025,793 262 Riverfront Renaissance - Drake Marble 2006 26 years 811,000 263 Riverfront Renaissance - Uncommitted 2006 26 years 1,695,446 264 Riverfront Renaissance - Llewellyn 2006 26 years 30,692 265 Riverfront Renaissance - HRA 2006 26 years - 266 Emerald Park - Metro 2006 26 years - 267 Emerald Park - Berry 2006 26 years - 268 North Quadrant Expansion 1 - Sibley 2006 26 years - 269 Phalen - Rose Hill 2006 26 years - 271 Carlton Lofts 2007 26 years 6,603 278 Highland Pointe Lofts 2007 26 years - 279 Minnesota Building 2010 26 years - 281 2700 The Avenue 2008 26 years - 282 Minnesota Events District 2009 26 years - 291 Carondelet Village 2011 26 years - 299 Cossetta Project 2011 9 years - 301 Penfield 2012 26 years - 302 Pioneer – Endicott 2012 26 years - 304 Schmidt Brewery 2012 26 years 45,259 305 West Side Flats 2014 26 years - 313 Hamline Station East 2014 26 years 22,192 314 Hamline Station West 2014 26 years 44,842 317 Custom House/Post Office 2014 26 years 58,982 318 East 7th Bates Senior Housing 2014 26 years 77,058
319 2700 University at Gateway Station 2014 26 years 74,686 321 Schmidt Keg House 2015 26 years 47,200 322 Ford Site 2016 26 years 9,245 324 Wilson II Housing Project 2016 26 years 50,643
Total Outstanding at December 31, 2017 $ 57,325,240
Total tax capacity amounts and tax increment revenue for these districts in 2017 are as follows. Current tax capacity (assessed in 2016, payable in 2017) $ 20,845,463
Captured tax capacity retained by the HRA 17,933,595
Total tax increment revenue in 2017 (includes developer shortfall if any) 19,645,976
Total delinquent tax increment receivable at December 31, 2017 133,285
62
HOUSING AND REDEVELOPMENT AUTHORITY OF THE CITY OF SAINT PAUL, MINNESOTA NOTES TO THE FINANCIAL STATEMENTS For the Fiscal Year Ended December 31, 2017
Note 4. (Continued) D. Conduit Debt Obligations
The HRA has issued Commercial/Industrial Development, Homeownership Mortgage, and Rental Housing Revenue Bonds to assist developers, businesses, and low-to moderate-income homeowners in projects which improve the economic and housing conditions of the City. The bonds are secured by the financed property and are payable solely from the revenues of the individual commercial/industrial or housing projects. The bonds do not constitute a charge, lien, or encumbrance, legal or equitable, upon any property or funds of the HRA, nor is the HRA subject to any liability thereon. Accordingly, the bonds are not reported as liabilities in the accompanying financial statements. Conduit bonds issued subsequent to January 1, 1996, have an outstanding principal balance of $2.0 billion at December 31, 2017. The aggregate principal amount payable for conduit bonds issued prior to January 1, 1996, could not be determined; however, their original issue amounts totaled $2.9 billion. There were 185 conduit bonds issued prior to January 1, 1996, and 160 conduit bonds issued subsequent to January 1, 1996.
E. Deficit - Net Position of Governmental Activities
On the Government-wide Statement of Net Position, the HRA is reporting a negative unrestricted net position of $22,973,613 but is reporting an overall positive net position of $28,982,156. The individual governmental funds which form a part of the governmental activities all have positive fund balances. The deficit was created with the addition of long-term debt to the government-wide governmental activities. The HRA issues long-term debt for development purposes and, in many cases, does not acquire or construct HRA-owned capital assets with the debt proceeds. The debt is to be retired with future revenues, such as property tax increments or sales taxes. (See Notes 3.A. and 5.F.)
5. Detailed Notes on All Funds A. Deposits and Investments
Through agreement with the City, the HRA deposit and investment functions are managed by the City’s Office of Financial Services, Treasury Section. City policies are applied to the HRA’s portfolio of deposits and investments. (1) Deposits
Minn. Stat. § 118A.02 and 118A.04 authorize the City to designate a depository for public funds and to invest in certificates of deposit. Minn. Stat. § 118A.03 requires that all City deposits be protected by insurance, surety bond, or collateral. The market value of collateral pledged shall be at least ten percent more than the amount on deposit at the close of the financial institution’s banking day, not covered by insurance or bonds.
63
HOUSING AND REDEVELOPMENT AUTHORITY OF THE CITY OF SAINT PAUL, MINNESOTA NOTES TO THE FINANCIAL STATEMENTS For the Fiscal Year Ended December 31, 2017
Note 5.A.(1) (Continued)
Authorized collateral includes treasury bills, notes and bonds; issues of U.S. government agencies; general obligations rated “A” or better, revenue obligations rated “AA” or better, irrevocable standby letters of credit issued by the Federal Home Loan Bank; and certificates of deposit. Minnesota statutes require that securities pledged as collateral be held in safekeeping in a restricted account at the Federal Reserve Bank or in an account at a trust department of a commercial bank or other financial institution that is not owned or controlled by the financial institution furnishing the collateral. All pledged collateral is held in the City’s name at third party institutions. The following table represents the HRA’s deposits balances at December 31, 2017:
Deposits:City cash and investment pool 89,494,255$ Parking ramp 1,059,965Cash with Trustees 912
Total Deposits: 90,555,132$
Custodial Credit Risk - Deposits Custodial credit risk is the risk that in the event of a financial institution failure, the HRA’s deposits may not be returned to it. The City is authorized to use only those financial institutions that have been approved by the City Council. The HRA’s deposits at December 31, 2017 consist of parking ramp checking and money market accounts, and trustee cash. The HRA deposits also consist of the City cash and investment pool.
(2) Investments
Minn. Stat. § 118A.04 and 118A.05 generally authorize the following types of investments as available to the HRA: (1) securities which are direct obligations or are guaranteed or insured issues of the
United States, its agencies, its instrumentalities, or organizations created by an act of Congress, except mortgage-backed securities defined as “high risk” by Minn. Stat. § 118A.04, sub. 6;
(2) mutual funds through shares of registered investment companies provided the mutual fund receives certain ratings depending on its investments;
(3) general obligations of the State of Minnesota and its municipalities, and in certain state agency and local obligations of Minnesota and other states provided such obligations have certain specified bond ratings by national bond rating service;
(4) bankers’ acceptances of United States banks;
64
HOUSING AND REDEVELOPMENT AUTHORITY OF THE CITY OF SAINT PAUL, MINNESOTA NOTES TO THE FINANCIAL STATEMENTS For the Fiscal Year Ended December 31, 2017
Note 5.A.(2) (Continued)
(5) commercial paper issued by United States corporations or their Canadian subsidiaries that is rated in the highest quality category by two nationally recognized rating agencies and matures in 270 days or less; and
(6) with certain restrictions, in repurchase agreements, securities lending agreements, joint powers investment trusts, and guaranteed investment contracts.
In addition, under Minn. Stat. § 469.012, the HRA can invest funds in properties or securities in which savings banks may legally invest funds which provides broad investment authority. The City Council has adopted an investment policy, dated July 9, 2003, which provides requirements and guidelines for the following:
- Authority and responsibility; - Administrative and review procedures; - Credit risk, interest rate risk, liquidity return, and avoidance of loss; - Investments in special programs and projects; - Short term and longer term investments; and - Investment manager selection and termination.
Interest Rate Risk - Investments
Interest rate risk is the risk that changes in the market interest rates will adversely affect the fair value of an investment. The City minimizes its exposure to interest rate risk by investing in both shorter term and longer term investments and by timing cash flows from maturities so that a portion of the portfolio is maturing or coming close to maturity evenly over time as necessary to provide the cash flow and liquidity needed for operations. The City has established maximum guidelines for investment duration.
Credit Risk - Investments Generally, credit risk is the risk that an issuer of an investment will not fulfill its obligation to the holder of the investment. This is measured by the assignment of a rating by a nationally recognized statistical rating organization. The City’s investment policy is that each portfolio must be invested in compliance with State of Minnesota Statute 118A. This statute governs which securities and with what credit ratings the City can hold in its portfolio and requires a broker certification annually from all brokers stating that they have read the City policy and will remain compliant with the statute.
Custodial Credit Risk - Investments
The custodial credit risk is the risk that, in the event of the failure of the counterparty to a transaction, a government will not be able to recover the value of an investment or collateral securities that are in possession of an outside party. According to City
65
HOUSING AND REDEVELOPMENT AUTHORITY OF THE CITY OF SAINT PAUL, MINNESOTA NOTES TO THE FINANCIAL STATEMENTS For the Fiscal Year Ended December 31, 2017
Note 5.A.(2) (Continued) policy, all securities purchased are held by a third-party safekeeping agent appointed as custodian (US Bank) who is also the lending agent/counterparty. Certificates of Deposit and select securities purchased from the City of St. Paul may be kept in the City’s safe. The securities lending agreement, although the program is suspended, is still in place between the City and its custodian. The City has no custodial credit risk for investments at December 31, 2017.
Concentration of Credit Risk The concentration of credit risk is the risk that an issuer or other counterparty to an investment will not fulfill its obligations. The City minimizes its credit risk by investing primarily in U.S. government backed securities. In accordance with the City's investment policy, the taxable municipal general obligation bonds are rated A or higher and the taxable municipal revenue bonds are rated AA or higher.
The following table represents the HRA's investment balances at December 31, 2017, and information relating to potential investment risks:
Investment Carrying Percentage ofCredit Maturities Amount at Fair ValueRating Rating Agency in Years Fair Value Per Issuer
Negotiable Certificates of Deposit:Highland Bank Certificate of Deposit N/R N/A 2-5 606,288$ 0.6%
Money Market Mutual Funds:First American Government Obligations Fund Class D AAAm Standard & Poor's less than 1 1,729,224 1.8%First American Government Treasury Obligations Fund Class Y AAAm Standard & Poor's less than 1 681,992 0.7%US Bank Money Market Account 5-ct A-1+ Standard & Poor's less than 1 820,480 0.9%Wells Fargo Advantage 100% Treasuries Fund AAAm Standard & Poor's less than 1 808,570 0.9%
Total Investments Held Outside the City 4,646,554$
HRA funds invested with the City's investment pool 89,494,255 95.1%
HOUSING AND REDEVELOPMENT AUTHORITY OF THE CITY OF SAINT PAUL, MINNESOTA NOTES TO THE FINANCIAL STATEMENTS For the Fiscal Year Ended December 31, 2017
Note 5.A.(Continued) (3) Reconciliation
The above amounts of deposits and investments in Note 5.A.(1) and Note 5.A.(2), respectively, reconcile to the Government-wide Statement of Net Position as follows: Cash and Investments with Treasurer $ 85,044,030 Cash with Fiscal Agents 1,059,965 Cash and Investments with Trustees 4,616,224 Restricted Cash and Investments for General Obligation Bond Debt Service 2,020,700 Restricted Cash and Investments for Revenue Bond Debt Service 2,183,249 Restricted Cash and Investments for Revenue Bond Operations and Maintenance 27,218 Restricted Cash and Investments for Note Debt Service 250,300
Total Deposits and Investments $ 95,201,686
(4) Net Increase (Decrease) in the Fair Value of Investments
All investment income, including changes in the fair value of investments, is reported as revenue on the operating statements of both governmental and proprietary funds. The calculation of realized gains and losses from the sale of investments is independent of the calculation of the net change in the fair value of investments. Realized gains and losses on investments that have been held in more than one fiscal year and sold in the current year may have been recognized as an increase or decrease in the fair value of investments reported in the prior year. The decrease in the fair value of investments during 2017 was $12,681. This amount takes into account all changes in fair value (including purchases and sales) that occurred during the year. The unrealized loss on investments held at December 31, 2017, was $450,079.
(5) Fair Value Measurement
The HRA categorizes its fair value measurements within the fair value hierarchy established by generally accepted accounting principles. The hierarchy is based on the valuation inputs used to measure the fair value of the asset. The hierarchy has three levels. Level 1 investments are valued using inputs that are based on quoted prices in active markets for identical assets. Level 2 investments are valued using inputs that are based on quoted prices for similar assets or inputs that are observable, either directly or indirectly. Level 3 investments are valued using inputs that are not observable. The HRA's investments at year-end are all valued at the Net Asset Value (NAV) rather than at the defined level. The HRA invests in money market funds for the benefit of liquid investments that can be readily re-invested. Money market funds held by the HRA seek a constant NAV of $1.00 per share. The investments are used primarily for debt service. The HRA also has a money market fund for homeownership loans issued through the joint venture with the Minneapolis/Saint Paul Housing Finance Agency.
67
HOUSING AND REDEVELOPMENT AUTHORITY OF THE CITY OF SAINT PAUL, MINNESOTA NOTES TO THE FINANCIAL STATEMENTS For the Fiscal Year Ended December 31, 2017
Note 5.A.(5) (Continued) The HRA invests funds in the City of Saint Paul investment pool. The fair value of the
investment is the fair value per share of the underlying portfolio. The HRA invests in this pool for the purpose of joint investment with the City in order to enhance investment earnings. There are no redemption limitations.
B. Loans Receivable
Loans receivable are reported as assets in the following funds at December 31, 2017 (net of allowances):
HRA General FundHRA Tax Increment Capital Projects FundHRA Development Capital Projects FundHRA Loan Enterprise FundHRA Parking Enterprise Fund
Total All Funds $ 5,384,612
1,055,754 192,290
236,250 3,889,709
$ 10,609
Allowances for uncollectible loans have been established for loans for which collection is doubtful or questionable in the total amount of $42,627,502 at December 31, 2017. During 2017, loans determined to be uncollectible or forgiven were written-off the books in the amount of $24,486, net of allowance. Changes in total gross loans receivable, allowances for uncollectible loans, and accrued interest receivable on loans for 2017 are shown below. Total gross loans receivable - January 1, 2017 $ 52,880,181 Loans issued 2,591,375 Principal payments received (834,123)Loans forgiven and written-off (6,625,319)
Total Gross Loans Receivable - December 31, 2017 $ 48,012,114
Less: allowance for uncollectible loans - January 1, 2017 47,526,747 Loans issued allowance 2,465,839 Allowances adjusted for principal payments received (467,723)Allowances adjusted for valuation (296,528)Loans forgiven and written-off (6,600,833)
Total Allowance for Uncollectible Loans - December 31, 2017 42,627,502
Net Loans Receivable - December 31, 2017 $ 5,384,612
Accrued Interest Receivable on Loans - December 31, 2017 $ 572,897
(Net of Allowance)
68
HOUSING AND REDEVELOPMENT AUTHORITY OF THE CITY OF SAINT PAUL, MINNESOTA NOTES TO THE FINANCIAL STATEMENTS For the Fiscal Year Ended December 31, 2017
Note 5.B. (Continued) At December 31, 2017, future minimum principal and interest payments to be received under the loan agreements for the next ten years are as follows:
During 2006, the HRA entered into an agreement with the City to sell a loan receivable from The Science Museum of Minnesota (SM). The SM loan was sold for $2,400,000 and had a principal balance of $4,000,000 at the time of sale which resulted in a loss on the sale of $1,600,000. The $2,400,000 in sale proceeds was used by the HRA to repay Ramsey County relating to the final closeout of the West Midway Tax Increment Financing District. Also, as part of the loan sale agreement, the HRA was obligated to advance to the City an amount of $860,000 in installments from 2006 through 2010. The City is to repay this advance, together with 5% interest, in installments from 2011 through 2021. In 2011, the City began repayment of the advance, with a payment of $87,475 including interest.
C. Land Held for Resale
Land held for resale is reported in the following funds as an asset at December 31, 2017.
Balance BalanceJanuary 1, December 31,
2017 Additions Deductions 2017
HRA General Fund $ 327,993 $ - $ 2,757 $ 325,236 HRA Tax Increment Capital Projects Fund 982,328 - - 982,328 HRA Development Capital Projects Fund 832,533 133,434 - 965,967 HRA Loan Enterprise Fund 4,296,654 - 171,512 4,125,142
Total All Funds $ 6,439,508 $ 133,434 $ 174,269 $ 6,398,673
69
HOUSING AND REDEVELOPMENT AUTHORITY OF THE CITY OF SAINT PAUL, MINNESOTA NOTES TO THE FINANCIAL STATEMENTS For the Fiscal Year Ended December 31, 2017
Note 5. (Continued) D. Leases Receivable
As described in Note 2.J., the HRA entered into direct financing leases with the City during the year ended December 31, 2009. The City is obligated under the RiverCentre Parking Facility Improvement Lease to make lease payments through 2024, which are to be used by the HRA to finance debt service payments on its RiverCentre Parking Facility Lease Revenue Bonds, Series 2009. The City of Saint Paul has approved a debt capital management plan which includes the amounts needed to make the lease payments through 2024.
The following is a summary of the leases receivable for the year ended December 31, 2017.
Total accumulated depreciation (13,849,750) (1,095,304) (78,939) (14,866,115)
Total Governmental Activities Capital Assets – Net 31,098,558$ 15,666,521$ 15,782,675$ 30,982,404$
The Construction in progress decrease in the Governmental Activities includes $289,122 for the City Soccer Stadium which is included with the City's Construction in Progress and the capitalization of the Palace Theatre construction costs.
Balance Balance
January 1, December 31,Business-type Activities 2017 Increase Decrease 2017
Long-term debt consists of bonds payable, notes payable, and advances from other governments. This debt has been issued for both governmental and business-type activities. Governmental activity debt has been issued to provide financing for housing and economic development programs and projects. Business-type debt was issued to finance the construction of parking facilities.
72
HOUSING AND REDEVELOPMENT AUTHORITY OF THE CITY OF SAINT PAUL, MINNESOTA NOTES TO THE FINANCIAL STATEMENTS For the Fiscal Year Ended December 31, 2017
Note 5.F. (Continued)
(1) Changes in Long-Term Debt
Long-term debt activity for the year ended December 31, 2017, was as follows:
Balance Balance DueJanuary 1, December 31, Within
Governmental Activities 2017 Increase Decrease 2017 One Year
Total notes payable 3,880,000 - - 3,880,000 93,856
Total Business-type Activities Long-Term Debt 54,606,565$ 30,586,189$ 34,093,012$ 51,099,742$ 3,268,856$
73
HOUSING AND REDEVELOPMENT AUTHORITY OF THE CITY OF SAINT PAUL, MINNESOTA NOTES TO THE FINANCIAL STATEMENTS For the Fiscal Year Ended December 31, 2017
Note 5.F.(1) (Continued)
A long-term advance of $9,360,000 was received from the City in 2016 for construction of the Palace Theatre. Interest at 3% per annum commences on the beginning of the 3rd year of the operating use agreement. The HRA is to repay the advance only from and to the extent that operating revenues are collected by the HRA, with payments applied to interest first. Annual operating revenues to be received are unknown and therefore, future payments for this advance are not included with the annual requirements schedule for governmental activity. All 2017 scheduled principal and interest payments were made in accordance with the terms of the bonds and notes. In November 2013, a loan agreement, with a revolving line of credit, was executed between the Saint Paul Foundation (Foundation) and the HRA whereby the Foundation has made available funds in the amount of $2,500,000 to the HRA for use in its major housing initiative, the Housing 5000 Program. Any of the funds advanced under the loan agreement to the HRA by the Foundation are to be used solely for developer loans on approved housing projects. The agreement was amended in March 2016 to provide up to $2,300,000 in loans for the Model Cities Brownstone project. The HRA is to repay the principal amount of the advances to the Foundation as the developer loans are repaid to the HRA. Simple interest of 1% on the outstanding Foundation advances is payable on each December 31 starting with 2016. December 1, 2026, is the final maturity date under the loan agreement.
On September 28, 2017, the HRA issued Parking Revenue Refunding bonds, Series 2017A in the amount of $26,315,000, and Parking Revenue Refunding Bonds, Taxable Series 2017B in the amount of $2,630,000. The proceeds were used to current refund the Parking Revenue Refunding Bonds, Series 2010B and advance refund the Parking Revenue Refunding Bonds, Series 2010A. The difference between the reacquisition price and the net carrying amount of the refunded debt was $999,606, resulting in deferred outflows of resources. The net present value cash flow savings of refunding the Series 2010A and Series 2010B bonds was $3,995,897. The refunding resulted in an economic gain of $5,901,663 over the life of the Series 2017A and Series 2017B bonds.
74
HOUSING AND REDEVELOPMENT AUTHORITY OF THE CITY OF SAINT PAUL, MINNESOTA NOTES TO THE FINANCIAL STATEMENTS For the Fiscal Year Ended December 31, 2017
Note 5.F. (Continued)
(2) Description of Bonds, Notes, Advances, and Sources for Retirement Governmental Activities
The governmental activity long-term debt, represented by the Tax Increment Bonds, Lease Revenue Bonds, long-term notes, and advances from other governments, are not general obligations of the HRA, are not backed by the full faith and credit of the HRA, and are to be retired through specific revenue sources. Under Minn. Stat. § 469.034, the HRA is not authorized to issue bonds which constitute an indebtedness within the meaning of any constitutional or statutory debt limitation or restriction. Tax increments, lease payments, and advances are pledged under the respective bond covenants. Debt service payments have been made on the bonds, notes, and advances using the designated financing sources. The City has issued a general obligation pledge on the Koch Mobil Tax Increment Refunding Bonds, Series 2010A; the US Bank Tax Increment Bonds, Series 2011F and 2011G, and the Snelling-University Taxable Refunding Bonds Series, 2014D. The governmental activity bonds and notes are serviced by the HRA Debt Service Fund. The governmental activity advances are serviced by the fund that received the advance. A listing of the governmental activity bonds and notes at December 31, 2017, follows on the next page:
75
HOUSING AND REDEVELOPMENT AUTHORITY OF THE CITY OF SAINT PAUL, MINNESOTA NOTES TO THE FINANCIAL STATEMENTS For the Fiscal Year Ended December 31, 2017
Note 5.F.(2) (Continued)
Interest Rate Original Debt Amount PayableDebt Issue Sources for Retirement (%) Issue Amount December 31, 2017
North Quadrant Tax Increment North Quadrant District 7.50 1,089,000$ 805,000$ Refunding Bonds, Series 2002 Tax Increments
North Quadrant Phase II Tax Increment North Quadrant District 7.00 1,140,000 946,000 Bonds, Series 2002 Tax Increments
Drake Marble Tax Increment Bonds, Riverfront Renaissance 6.75 1,800,000 811,000 Series 2002 District Tax Increments
9th Street Lofts Tax Increment Bonds, 9th Street Lofts District 6.375 1,335,000 963,000 Series 2004 Tax Increments
Great Northern Lofts (JJ Hill) JJ Hill District Tax 6.25 3,660,000 2,639,000 Tax Increment Bonds, Series 2004 Increments
Neighborhood Scattered Site Tax Neighborhood Scattered 4.24 - 5.45 7,515,000 - Increment Bonds, Series 2005 Site District Tax
Increments
RiverCentre Parking Facility Lease Lease Payments from the 3.00 - 4.50 6,790,000 3,605,000 Revenue Bonds, Series 2009 City of Saint Paul
Koch Mobil Tax Increment Refunding Koch Mobil District 2.00 - 4.00 2,670,000 1,915,000 Bonds, Series 2010A Tax Increments
Emerald Gardens Tax-Exempt Tax Emerald Gardens 5.00 - 6.50 6,595,000 5,075,000 Increment Revenue Bonds, Series 2010 District Tax Increments
US Bank Tax Increment Refunding Riverfront Renaissance 2.00 - 4.00 8,870,000 7,720,000 Bonds, Series 2011G District Tax Increments
Upper Landing Tax Increment Refunding Riverfront Renaissance 5.00 15,790,000 13,105,000 Bonds, Series 2012 District Tax Increments
Snelling-University General Obligation Snelling-University 1.00 - 1.25 1,995,000 - Taxable Refunding Bonds, Series 2014D Site District Tax
Increments
HUD Section 108 Note, Series 2003-A EDI Grant, Port Authority 5.20 3,300,000 675,000
Catholic Charities Midway Residence Forgiven after 20 years 0.00 10,599,852 10,599,852 POPSHP Loan of compliance
Upper Landing Tax Increment Upper Landing District 5.75 2,019,087 575,024 Revenue Note, Series 2008 Tax Increments
Palace Theatre Revenue Advance Palace Theatre operating 3.00 9,360,000 9,360,000 revenue received bythe HRA
Total Governmental Activities Long-Term Debt 84,527,939$ 58,793,876$
76
HOUSING AND REDEVELOPMENT AUTHORITY OF THE CITY OF SAINT PAUL, MINNESOTA NOTES TO THE FINANCIAL STATEMENTS For the Fiscal Year Ended December 31, 2017
Note 5.F.(2) (Continued)
Business-type Activities
The business-type activity long-term debt is reported in the HRA Parking Enterprise Fund and the HRA Loan Enterprise Fund where specific fund revenues are used to service the debt. The City has issued a general obligation pledge on the Block 39 Tax Increment Bonds, Series 2009G. A listing of the business-type bonds and notes at December 31, 2017, follows:
Interest Rate Original Debt Amount Payable
Debt Issue Sources for Retirement (%) Issue Amount December 31, 2017
Parking Revenue Bonds, Series 7th Street Ramp Parking 6.75 11,305,000$ -$
1997A, (7th Street Ramp) Revenues
Block 39 Tax Increment Refunding Block 39 District Tax 3.00 - 4.00 20,695,000 16,350,000 Bonds, Series 2009G Increments Block 39
Parking Revenues
Parking Revenue Refunding Bonds, HRA Parking Revenues 3.00 - 5.00 24,135,000 - Series 2010A
Parking Revenue Refunding Bonds, HRA Parking Revenues 3.00 - 5.00 12,820,000 - Series 2010B
Parking Revenue Refunding Bonds, HRA Parking Revenues 3.00 - 5.00 26,315,000 26,315,000 Series 2017A (Tax Exempt)
Parking Revenue Refunding Bonds, HRA Parking Revenues 1.68 - 2.08 2,630,000 2,630,000 Series 2017B (Taxable)
LAAND Initiative Loan Land Sales Proceeds 0.00 1,000,000 1,000,000
LAAND Initiative Loan Land Sales Proceeds 0.00 580,000 580,000
Housing 5000 Program Loan Model Cities Brownstone 1.00 2,300,000 2,300,000
Total Business-type Activities Long-Term Debt 101,780,000$ 49,175,000$
77
HOUSING AND REDEVELOPMENT AUTHORITY OF THE CITY OF SAINT PAUL, MINNESOTA NOTES TO THE FINANCIAL STATEMENTS For the Fiscal Year Ended December 31, 2017
Note 5.F. (Continued) (3) Annual Requirements – Principal and Interest on Long-Term Debt
Annual principal and interest debt service requirements for governmental activity long-term debt are as follows:
Year EndingDecember 31 Principal Interest Principal Interest
Housing 5000 Program TotalHRA Loan Enterprise Fund Business-type Activity
G. Employee Benefits, Pension Plan Obligations
As part of the reorganization discussed in Note 1, the HRA employees became employees of the City in 1978. The HRA has no employees. Services are provided by the City in administering HRA programs. All pension costs, vacation, and sick leave benefits are paid and accounted for by the City.
H. Risk Management
The HRA is exposed to various risks of losses related to torts; theft of, damage to, and destruction of assets; errors and omissions; and natural disasters. The City of Saint Paul administers the HRA’s risk management activities. The HRA’s risk management activities are reported in the HRA General Fund. Claim expenditures and liabilities are reported when it is probable that a loss has occurred and the amount of the loss can be reasonably estimated. These losses include an estimate of claims that have been incurred but not reported (IBNRs). The liability for claims and judgments is recognized when amounts are due and payable. The HRA had no January 1, 2016, liability for claims and judgments; nor were there any fiscal year 2016 or 2017 claims or claims payments, which resulted in any end of fiscal year 2016 or 2017 claims liabilities.
79
HOUSING AND REDEVELOPMENT AUTHORITY OF THE CITY OF SAINT PAUL, MINNESOTA NOTES TO THE FINANCIAL STATEMENTS For the Fiscal Year Ended December 31, 2017
Note 5.H. (Continued) The HRA acquired in 2009 a site with existing pollution which required remediation. To address its exposure to risk of loss related to pollution liability torts, the HRA has purchased a Premises Pollution Liability Insurance Policy. The limits of this liability coverage is $20,000,000 and the policy expires in December 23, 2019. The City has purchased all risk property insurance coverage for its real and personal property throughout the City. The deductible for each occurrence of damage or loss of property is $250,000. Each City department participating in the insurance program is charged a yearly amount based upon pro rata shares of the property insurance coverage, and contributions are made to a risk retention pool to address potential losses due to the higher deductible. The HRA is responsible for the first $10,000 of each loss. The risk retention pool reimburses losses that exceed $10,000 that are not covered by insurance. The HRA General Fund pays the insurance premium for HRA-related property coverage. The HRA General Fund reimburses the City for deductible amounts paid each year based on its share of the property insurance coverage. There were no significant reductions in insurance for the previous year or settlements in excess of insurance coverage for any of the past three fiscal years. A complete audit and actuarial analysis is conducted by the City’s Risk Management Division to insure proper premium, retention, and administrative charges. Tort liability is administered by the City with professional claim managers and attorneys. Because the HRA has no employees, there is no risk for workers’ compensation and unemployment compensation (Note 5.G.).
I. Pay-As-You-Go Tax Increment Notes
The HRA provides tax abatements pursuant to Minnesota Statutes 469.174 to 469.1794 (Tax Increment Financing) through a pay-as-you-go note program. Tax increment financing (TIF) can be used to encourage private development, redevelopment, renovation and renewal, growth in low-to-moderate-income housing, and economic development within Saint Paul. TIF captures the increase in tax capacity and property taxes from development or redevelopment to provide funding for the related project.
80
HOUSING AND REDEVELOPMENT AUTHORITY OF THE CITY OF SAINT PAUL, MINNESOTA NOTES TO THE FINANCIAL STATEMENTS For the Fiscal Year Ended December 31, 2017
Note 5.I. (Continued)
The HRA has issued pay-as-you-go tax increment notes to finance development in the following tax increment financing districts as of December 31, 2017.
318 East 7th-Bates Senior Housing 6/2/2015 2,291,000 2,291,000 2,291,000 66,107
319 2700 University at Westgate Station 6/29/2015 7,865,000 7,865,000 7,865,000 64,152
321 Schmidt Keg House 3/8/2017 1,700,000 - 1,700,000 -
324 Wilson II Housing Project 10/31/2016 1,720,000 1,720,000 1,720,000 -
Total 87,137,006$ 76,272,113$ 77,567,225$ 6,237,451$
*The developer received escrowed proceeds and has acknowledged that the North Quadrant Shortfall TIR, Note II has been cancelled.
81
HOUSING AND REDEVELOPMENT AUTHORITY OF THE CITY OF SAINT PAUL, MINNESOTA NOTES TO THE FINANCIAL STATEMENTS For the Fiscal Year Ended December 31, 2017
Note 5.I. (Continued)
The notes are payable only after the HRA has received tax increment revenue from the above districts and can only be paid using that tax increment as the financing source. No liability is recognized at December 31, 2017, since all scheduled note payments have been made from the available tax increment. All expenditures under the notes are reported in the HRA Tax Increment Capital Projects Fund. During 2017, the HRA had 33 tax increment pay-as-you-go agreements and one subordinate loan agreement in place or executed. The agreements are not a general obligation of the HRA and are payable solely from available tax increment revenues. Accordingly, these agreements are not reflected in the financial statements of the HRA. Details of the pay-as-you-go notes are as follows:
1) TIF District #194, 1919 University:
Issued in 1997 in the principal sum of $1,357,000 with an interest rate of 9.75% per annum. Principal and interest is paid on August 1, 1999, and each February 1 and August 1 thereafter to and including February 1, 2025. Payments are payable solely from available pledged tax increments derived from the property and paid to the HRA. The pay-as-you-go note provides for the payment to the developer equal to 95% of available tax increments received in the prior six months. The payment reimburses the developer for land acquisition and other public redevelopment costs. Principal and interest payments will be completed February 1, 2025, unless the full principal is repaid earlier or has been deemed paid in full or if the note is otherwise terminated. The HRA shall have no obligation to pay any unpaid balance of principal or accrued interest that may remain after the final payment on February 1, 2025. The current year abatement (TIF note payments) amounted to $0. At December 31, 2017, the principal amount outstanding on the note was $1,357,000.
2) TIF District #212, Block 4 – TIR Note, Series 2004: Issued in 2004 in the principal sum of $17,800,000 with an interest rate of 5.75% per annum. Principal and interest is paid on August 1, 2013 and each February 1 and August 1 thereafter to and including February 1, 2027. Payments are payable solely from available pledged tax increments derived from the property and paid to the HRA. The pay-as-you-go note provides for the payment to the developer equal to 90% declining to 87.5% on August 1, 2016, and to 85% on August 1, 2021 of available tax increments received in the prior six months. The payment reimburses the developer for land acquisition, site assembly and other public redevelopment costs including parking. Principal and interest payments will be completed February 1, 2027, unless the full principal is repaid earlier or has been deemed paid in full or if the note is otherwise terminated. The HRA shall have no obligation to pay any unpaid balance of principal or accrued interest that may remain after the final payment on February 1, 2027. The current year abatement (TIF note payments) amounted to $1,881,965. At December 31, 2017, the principal amount outstanding on the note was $13,609,908.
82
HOUSING AND REDEVELOPMENT AUTHORITY OF THE CITY OF SAINT PAUL, MINNESOTA NOTES TO THE FINANCIAL STATEMENTS For the Fiscal Year Ended December 31, 2017
Note 5.I. (Continued)
3) TIF District #215, Superior Street Cottages Series 2016: Issued in 1998 in the original principal sum of $311,341 with an interest rate of 6.00% per annum. Principal and interest is paid on March 15, 1999, and each September 15 and March 15 thereafter to and including March 15, 2016. A new note was issued in 2016 in the principal sum of $205,000 with an interest rate of 4.00% per annum. Payments are payable solely from available pledged tax increments derived from the property and paid to the HRA. The pay-as-you-go note provides for the payment to the developer equal to 90% of available tax increments received in the prior six months, provided that the total payments made under the new note do not exceed $236,000. The payment reimburses the project owner for affordable housing construction costs. Principal and interest payments will be completed March 15, 2026, or earlier if the total payments equal $236,000, the full principal is repaid earlier or has been deemed paid in full, or if the note is otherwise terminated. The Taxable Tax Increment Revenue Note, Series 2016 (dated May 6, 2016) replaces the tax increment revenue portion of the Multi-Family Housing Revenue Note (Superior Street Cottages Project) Series 1998 dated as of July 16, 1998 (the original note) which is hereby deemed cancelled and the HRA has no further obligation to make any payments under the original note. The HRA shall have no obligation to pay any unpaid balance of principal or accrued interest that may remain after the final payment on March 15, 2026. The current year abatement (TIF note payments) amounted to $39,031. At December 31, 2017, the principal amount outstanding on this note was $159,305.
4) TIF District #232, Straus Building: Issued in 2002 in the principal sum of $600,000 with an interest rate of 6.25% per annum. Principal and interest is paid on March 1, 2004, and each September 1 and March 1 thereafter to and including March 1, 2029. Payments are payable solely from available pledged tax increments derived from the property and paid to the HRA. The pay-as-you-go note provides for the payment to the developer equal to 90% of available tax increments received in the prior six months up to $23,800. The payment reimburses the developer for affordable housing construction costs. Principal and interest payments will be completed March 1, 2029, unless the full principal is repaid earlier or has been deemed paid in full or if the note is otherwise terminated. The HRA shall have no obligation to pay any unpaid balance of principal or accrued interest that may remain after the final payment on March 1, 2029. The current year abatement (TIF note payments) amounted to $42,344. At December 31, 2017, the principal amount outstanding on the note was $596,964.
5) TIF District #234, Phalen Village – Cub Foods Project: Issued in 2008 in the principal sum of $3,100,000 with an interest rate of 6.00% per annum. Principal and interest is paid on August 1, 2010, and each February 1 and August 1 thereafter to and including February 1, 2029. Payments are payable solely from available pledged tax increments derived from the property and paid to the HRA. The
83
HOUSING AND REDEVELOPMENT AUTHORITY OF THE CITY OF SAINT PAUL, MINNESOTA NOTES TO THE FINANCIAL STATEMENTS For the Fiscal Year Ended December 31, 2017
Note 5.I.(5) (Continued)
pay-as-you-go note provides for the payment to the developer equal to 90% of the Cub Foods tax increment plus 90% of the balance of available tax increment from the TIF district up to $47,100 received in the prior six months. The payment reimburses the developer for land acquisition, site assembly and other public redevelopment costs. Principal and interest payments will be completed February 1, 2029, unless the full principal is repaid earlier or has been deemed paid in full or if the note is otherwise terminated. The HRA shall have no obligation to pay any unpaid balance of principal or accrued interest that may remain after the final payment on February 1, 2029. The current year abatement (TIF note payments) amounted to $318,078. At December 31, 2017, the principal amount outstanding on the note was $2,416,770.
6) TIF District #236, JJ Hill Subordinate Loan: Issued in 2002 in the principal sum of $260,000 without a set interest rate. The principal and interest shall be due in a single payment at such time as a supplemental reserve account is fully funded in the amount of $260,000. Payments are payable solely from available pledged tax increments derived from the property and paid to the HRA. The payment reimburses the developer for monies used to fund a debt service reserve established under the bond indenture and pledged to the holders of the HRA’s JJ Hill Tax Increment Bonds, Series 2004. The HRA shall have no obligation to pay any unpaid balance of principal or accrued interest that may remain after the TIF district expires on December 31, 2028. The current year abatement (TIF note payments) amounted to $0. At December 31, 2017, the principal amount outstanding on the loan was $260,000.
7) TIF District #237, Osceola Park Senior Housing: Issued in 2002 in the principal sum of $950,000 with an interest rate of 6.35% per annum. Principal and interest is paid on March 1, 2005, and each September 1 and March 1 thereafter to and including March 1, 2030. Payments are payable solely from available pledged tax increments derived from the property and paid to the HRA. The pay-as-you-go note provides for the payment to the developer equal to 90% of available tax increments received in the prior six months. The payment reimburses the developer for affordable housing construction costs. Principal and interest payments will be completed March 1, 2030, unless the full principal is repaid earlier or has been deemed paid in full or if the note is otherwise terminated. The HRA shall have no obligation to pay any unpaid balance of principal or accrued interest that may remain after the final payment on March 1, 2030. The current year abatement (TIF note payments) amounted to $80,298. At December 31, 2017, the principal amount outstanding on the note was $950,000.
8) TIF District #240, Bridgecreek Senior Place Project: Issued in 2004 in the principal sum of $2,398,952 with an interest rate of 6.00% per annum. Principal and interest is paid on September 1, 2004, and each March 1 and September 1 thereafter to and including March 1, 2030. Payments are payable solely from available pledged tax increments derived from the property and paid to the HRA. The pay-
84
HOUSING AND REDEVELOPMENT AUTHORITY OF THE CITY OF SAINT PAUL, MINNESOTA NOTES TO THE FINANCIAL STATEMENTS For the Fiscal Year Ended December 31, 2017
Note 5.I.(8) (Continued) as-you-go note provides for the payment to the developer equal to 90% of available tax increments received in the prior six months. The payment reimburses the developer for affordable housing construction costs. Principal and interest payments will be completed March 1, 2030, unless the full principal is repaid earlier or has been deemed paid in full or if the note is otherwise terminated. The HRA shall have no obligation to pay any unpaid balance of principal or accrued interest that may remain after the final payment on March 1, 2030. The current year abatement (TIF note payments) amounted to $130,689. At December 31, 2017, the principal amount outstanding on the note was $2,398,952.
9) TIF District #241, Lyons Court Rental Project: Issued in 2004 in the principal sum of $682,000 with an interest rate of 5.80% per annum. Principal and interest is paid on September 15, 2006, and each March 15 and September 15 thereafter to and including March 15, 2028. Payments are payable solely from available pledged tax increments derived from the property and paid to the HRA. The pay-as-you-go note provides for the payment to the developer equal to 90% of available tax increments received in the prior six months up to $30,500. The payment reimburses the developer for affordable housing construction costs. Principal and interest payments will be completed March 15, 2028, unless the full principal is repaid earlier or has been deemed paid in full or if the note is otherwise terminated. The HRA shall have no obligation to pay any unpaid balance of principal or accrued interest that may remain after the final payment on March 15, 2028. The current year abatement (TIF note payments) amounted to $40,576. At December 31, 2017, the principal amount outstanding on the note was $682,000.
10) TIF District #243, Shepard-Davern Ownership Housing: Issued in 2006 in the principal sum of $3,257,067 with an interest rate of 6.50% per annum. Principal and interest is paid on March 1, 2007, and each September 1 and March 1 thereafter to and including March 1, 2032. Payments are payable solely from available pledged tax increments derived from the property and paid to the HRA. The pay-as-you-go note provides for the payment to the developer equal to 90% of available tax increments received in the prior six months. The payment reimburses the developer for land acquisition, site assembly, and other public redevelopment costs. Principal and interest payments will be completed March 1, 2032, unless the full principal is repaid earlier or has been deemed paid in full or if the note is otherwise terminated. The HRA shall have no obligation to pay any unpaid balance of principal or accrued interest that may remain after the final payment on March 1, 2032. The current year abatement (TIF note payments) amounted to $231,427. At December 31, 2017, the principal amount outstanding on the note was $2,593,317.
11) TIF District #244, Shepard-Davern Rental Housing Issued in 2006 in the principal sum of $4,820,000 with an interest rate of 5.09% per annum. Principal and interest is paid on October 1, 2006, and each April 1 and
85
HOUSING AND REDEVELOPMENT AUTHORITY OF THE CITY OF SAINT PAUL, MINNESOTA NOTES TO THE FINANCIAL STATEMENTS For the Fiscal Year Ended December 31, 2017
Note 5.I.(11) (Continued) October 1 thereafter to and including April 1, 2032. Payments are payable solely from available pledged tax increments derived from the property and paid to the HRA. The pay-as-you-go note provides for the payment to the developer equal to 90% of available tax increments received in the prior six months. The payment reimburses the developer for land acquisition, site assembly and other public redevelopment costs. Principal and interest payments will be completed April 1, 2032, unless the full principal is repaid earlier or has been deemed paid in full or if the note is otherwise terminated. The HRA shall have no obligation to pay any unpaid balance of principal or accrued interest that may remain after the final payment on April 1, 2032. The current year abatement (TIF note payments) amounted to $599,797. At December 31, 2017, the principal amount outstanding on the note was $2,581,616.
12) TIF District #245, Shepard-Davern Gateway Senior: Issued in 2003 in the principal sum of $1,353,286 with an interest rate of 5.00% per annum. Principal and interest is paid on September 1, 2006, and each March 1 and September 1 thereafter to and including March 1, 2032. Payments are payable solely from available pledged tax increments derived from the property and paid to the HRA. The pay-as-you-go note provides for the payment to the developer equal to 90% of available tax increments received in the prior six months. The payment reimburses the developer for land acquisition, site assembly, and other public redevelopment costs. Principal and interest payments will be completed March 1, 2032, unless the full principal is repaid earlier or has been deemed paid in full or if the note is otherwise terminated. The HRA shall have no obligation to pay any unpaid balance of principal or accrued interest that may remain after the final payment on March 1, 2032. The current year abatement (TIF note payments) amounted to $111,393. At December 31, 2017, the principal amount outstanding on the note was $1,303,148.
13) TIF District #248, Koch Mobil-Schmidt Rathskeller: Issued in 2017 in the principal sum of $1,290,260 with an interest rate of 4.50% per annum. Principal and interest is paid each September 1 and March 1 following an initial payment after the project is completed and conditions are satisfied, and continuing until the earlier of the following: a) the date immediately following the final collection of pledged tax increments received prior to the date the Koch Mobil TIF District is decertified by the HRA, or b) March 1, 2031. Payments are payable solely from available pledged tax increments derived from the Koch Mobil TIF District and paid to the HRA. The pay-as-you-go note provides for the payment to the developer equal to 20% of available tax increments received by the HRA. The payment reimburses the developer for qualifying redevelopment expenses related to the renovation of the Schmidt Rathskeller building. Principal and interest payments will be completed March 1, 2031, unless the full principal is repaid earlier or has been deemed paid in full or if the note is otherwise terminated. The HRA shall have no obligation to pay any unpaid balance of principal or accrued interest that may remain after the final payment on March 1, 2031. The current
86
HOUSING AND REDEVELOPMENT AUTHORITY OF THE CITY OF SAINT PAUL, MINNESOTA NOTES TO THE FINANCIAL STATEMENTS For the Fiscal Year Ended December 31, 2017
Note 5.I.(13) (Continued) year abatement (TIF note payments) amounted to $0. At December 31, 2017, the principal amount outstanding on the note was $1,290,260.
14) TIF District #257, Payne Senior Lofts Project: Issued in 2005 in the principal sum of $925,000 with an interest rate of 5.72% per annum. Principal and interest is paid on September 15, 2007, and each March 15 and September 15 thereafter to and including March 15, 2032. Payments are payable solely from available pledged tax increments derived from the property and paid to the HRA. The pay-as-you-go note provides for the payment to the developer equal to 90% of available tax increments received in the prior six months. The payment reimburses the developer for site-related and public redevelopment costs. Principal and interest payments will be completed March 15, 2032, unless the full principal is repaid earlier or has been deemed paid in full or if the note is otherwise terminated. The HRA shall have no obligation to pay any unpaid balance of principal or accrued interest that may remain after the final payment on March 15, 2032. The current year abatement (TIF note payments) amounted to $35,378. At December 31, 2017, the principal amount outstanding on the note was $908,750.
15) TIF District #260, North Quadrant Rental Phase I: Issued in 2001 in the principal sum of $2,140,000 with an interest rate of 8.00% per annum. Principal and interest is paid on August 15, 2003, and each February 15 and August 15 thereafter to and including February 15, 2028. Payments are payable solely from available pledged tax increments derived from the property and paid to the HRA. The pay-as-you-go note provides for the payment to the developer equal to 95% of available tax increments received in the prior six months. The payment reimburses the developer for site-related and public redevelopment costs. Principal and interest payments will be completed February 15, 2028, unless the full principal is repaid earlier or has been deemed paid in full or if the note is otherwise terminated. The HRA shall have no obligation to pay any unpaid balance of principal or accrued interest that may remain after the final payment on February 15, 2028. The current year abatement (TIF note payments) amounted to $181,454. At December 31, 2017, the principal amount outstanding on the note was $2,140,000.
16) TIF District #267, Emerald Park Rental: Issued in 2002 in the principal sum of $3,110,000 with an interest rate of 7.50% per annum. Principal and interest is paid on September 1, 2005, and each March 1 and September 1 thereafter to and including March 1, 2030. Payments are payable solely from available pledged tax increments derived from the property and paid to the HRA. The pay-as-you-go note provides for the payment to the developer equal to 90% of available tax increments received in the prior six months up to $279,354. The payment reimburses the developer for affordable housing construction costs. Principal and interest payments will be completed March 1, 2030, unless the full principal is repaid earlier or has been deemed
87
HOUSING AND REDEVELOPMENT AUTHORITY OF THE CITY OF SAINT PAUL, MINNESOTA NOTES TO THE FINANCIAL STATEMENTS For the Fiscal Year Ended December 31, 2017
Note 5.I.(16) (Continued) paid in full or if the note is otherwise terminated. The HRA shall have no obligation to pay any unpaid balance of principal or accrued interest that may remain after the final payment on March 1, 2030. The current year abatement (TIF note payments) amounted to $523,232. At December 31, 2017, the principal amount outstanding on the note was $2,352,522.
17) TIF District #268, North Quadrant Rental Phase II and North Quadrant Shortfall TIR, Note II: Issued in 2002 in the principal sum of $1,500,000 with an interest rate of 8.00% per annum. Principal and interest is paid on August 15, 2003, and each February 15 and August 15 thereafter to and including February 15, 2028. Payments are payable solely from available pledged tax increments derived from the property and paid to the HRA. The pay-as-you-go note provides for the payment to the developer equal to 90% of available tax increments received in the prior six months. The payment reimburses the developer for public redevelopment costs. Principal and interest payments will be completed February 15, 2028, unless the full principal is repaid earlier or has been deemed paid in full or if the note is otherwise terminated. The HRA shall have no obligation to pay any unpaid balance of principal or accrued interest that may remain after the final payment on February 15, 2028. The current year abatement (TIF note payments) amounted to $155,641. At December 31, 2017, the principal amount outstanding on the note was $1,500,000. Issued in 2002 in the principal sum of $179,781 with an interest rate of 7.00% per annum. Principal and interest is paid on each August 15 and February 15 commencing on the first August 15 or February 15 after the HRA’s North Quadrant Phase II – Dakota TI Refunding Bonds, Series 2002 have been paid in full, through and including February 15, 2028. Payments are payable solely from available pledged tax increments derived from the property and paid to the HRA. The pay-as-you-go note provides for the payment to the developer equal to 90% of available tax increments received in the prior six months following the repayment in full of the HRA’s North Quadrant Phase II – Dakota TI Refunding Bonds. The payment reimburses the developer for public redevelopment costs. Principal and interest payments will be completed February 15, 2028, unless the full principal is repaid earlier or has been deemed paid in full or if the note is otherwise terminated. The HRA shall have no obligation to pay any unpaid balance of principal or accrued interest that may remain after the final payment on February 15, 2028. The developer received escrowed proceeds and has acknowledged that the note has been cancelled. The current year abatement (TIF note payments) amounted to $0. At December 31, 2017, the principal amount outstanding on the note was $0.
18) TIF District #269, Phalen Village Ames Lake: Issued in 2003 in the principal sum of $418,000 with an interest rate of 8.50% per annum. Principal and interest is paid on February 15, 2004, and each August 15 and February 15 thereafter to and including February 15, 2029. Payments are payable solely from available
88
HOUSING AND REDEVELOPMENT AUTHORITY OF THE CITY OF SAINT PAUL, MINNESOTA NOTES TO THE FINANCIAL STATEMENTS For the Fiscal Year Ended December 31, 2017
Note 5.I.(18) (Continued) pledged tax increments derived from the property and paid to the HRA. The pay-as-you-go note provides for the payment to the developer equal to 90% of available tax increments received in the prior six months. The payment reimburses the developer for site assembly and land acquisition costs. Principal and interest payments will be completed February 15, 2029, unless the full principal is repaid earlier or has been deemed paid in full or if the note is otherwise terminated. The HRA shall have no obligation to pay any unpaid balance of principal or accrued interest that may remain after the final payment on February 15, 2029. The current year abatement (TIF note payments) amounted to $13,857. At December 31, 2017, the principal amount outstanding on the note was $418,000.
19) TIF District #271, Carleton Lofts: Issued in 2005 in the principal sum of $2,358,660 with an interest rate of 6.00% per annum. Principal and interest is paid on September 1, 2008, and each March 1 and September 1 thereafter to and including March 1, 2033. Payments are payable solely from available pledged tax increments derived from the property and paid to the HRA. The pay-as-you-go note provides for the payment to the developer equal to 90% of available tax increments received in the prior six months. The payment reimburses the developer for affordable housing construction costs. Principal and interest payments will be completed March 1, 2033, unless the full principal is repaid earlier or has been deemed paid in full or if the note is otherwise terminated. The HRA shall have no obligation to pay any unpaid balance of principal or accrued interest that may remain after the final payment on March 1, 2033. The current year abatement (TIF note payments) amounted to $137,372. At December 31, 2017, the principal amount outstanding on the note was $2,358,660.
20) TIF District #278, River Pointe Lofts Project: Issued in 2007 in the principal sum of $1,829,000 with an interest rate of 5.25% per annum. Principal and interest is paid on February 1, 2009, and each August 1 and February 1 thereafter to and including February 1, 2035. Payments are payable solely from available pledged tax increments derived from the property and paid to the HRA. The pay-as-you-go note provides for the payment to the developer equal to 90% of available tax increments received in the prior six months. The payment reimburses the developer for affordable housing construction costs. Principal and interest payments will be completed February 1, 2035, unless the full principal is repaid earlier or has been deemed paid in full or if the note is otherwise terminated. The HRA shall have no obligation to pay any unpaid balance of principal or accrued interest that may remain after the final payment on February 1, 2035. The current year abatement (TIF note payments) amounted to $213,314. At December 31, 2017, the principal amount outstanding on the note was $1,294,399.
89
HOUSING AND REDEVELOPMENT AUTHORITY OF THE CITY OF SAINT PAUL, MINNESOTA NOTES TO THE FINANCIAL STATEMENTS For the Fiscal Year Ended December 31, 2017
Note 5.I. (Continued)
21) TIF District #279, Minnesota Building: Issued in 2010 in the principal sum of $936,000 with an interest rate of 5.94% per annum. Principal and interest is paid on September 15, 2012, and each March 15 and September 15 thereafter to and including March 15, 2037. Payments are payable solely from available pledged tax increments derived from the property and paid to the HRA. The pay-as-you-go note provides for the payment to the developer equal to 90% of available tax increments received in the prior six months. The payment reimburses the developer for affordable housing construction costs. Principal and interest payments will be completed March 15, 2037, unless the full principal is repaid earlier or has been deemed paid in full or if the note is otherwise terminated. The HRA shall have no obligation to pay any unpaid balance of principal or accrued interest that may remain after the final payment on March 15, 2037. The current year abatement (TIF note payments) amounted to $64,234. At December 31, 2017, the principal amount outstanding on the note was $936,000.
22) TIF District #291, Carondelet Village: Issued in 2010 in the principal sum of $3,104,000 with an interest rate of 6.00% per annum. Principal and interest is paid on September 15, 2013, and each March 15 and September 15 thereafter to and including March 15, 2039. Payments are payable solely from available pledged tax increments derived from the property and paid to the HRA. The pay-as-you-go note provides for the payment to the developer equal to 90% of the available tax increment received in the prior six months for payments ending March 15, 2016, and 62.55% for payments beginning September 15, 2016. The payment reimburses the developer for site assembly and other public redevelopment costs. Principal and interest payments will be completed March 15, 2039, unless the full principal is repaid earlier or has been deemed paid in full or if the note is otherwise terminated (there is a provision in the note that may reduce the outstanding principal of the note with surplus revenue on each September 15, commencing September 15, 2015, and will likely result in earlier termination). The HRA shall have no obligation to pay any unpaid balance of principal or accrued interest that may remain after the final payment on March 15, 2039. The current year abatement (TIF note payments) amounted to $222,619. At December 31, 2017, the principal amount outstanding on the note was $3,104,000.
23) TIF District #299, Cossetta: Issued in 2011 in the principal sum of $388,000 with an interest rate of 6.50% per annum. Principal and interest is paid on September 15, 2013, and each March 15 and September 15 thereafter to and including March 15, 2021. Payments are payable solely from available pledged tax increments derived from the property and paid to the HRA. The pay-as-you-go note provides for the payment to the developer equal to 90% of available tax increments received in the prior six months. The payment reimburses the developer for site-related parking and other public redevelopment costs. Principal and interest payments will be completed March 15, 2021, unless the full principal is repaid earlier or has been deemed paid in full or if the note is otherwise terminated. The HRA shall have no
90
chlee
Sticky Note
Marked set by chlee
HOUSING AND REDEVELOPMENT AUTHORITY OF THE CITY OF SAINT PAUL, MINNESOTA NOTES TO THE FINANCIAL STATEMENTS For the Fiscal Year Ended December 31, 2017
Note 5.I.(23) (Continued) obligation to pay any unpaid balance of principal or accrued interest that may remain after the final payment on March 15, 2021. The current year abatement (TIF note payments) amounted to $72,860. At December 31, 2017, the principal amount outstanding on the note was $285,023.
24) TIF District #302, Pioneer Endicott Note #1: Issued in 2012 in the principal sum of $2,500,000 with an interest rate of 6.50% per annum. Principal and interest is paid on September 1, 2015, and each March 1 and September 1 thereafter to and including March 1, 2041. Payments are payable solely from available pledged tax increments derived from the property and paid to the HRA. The pay-as-you-go note provides for the payment to the developer equal to 65% of available tax increments received in the prior six months. The payment reimburses the developer for acquisition, site-related, and other public redevelopment costs. Principal and interest payments will be completed March 1, 2041, unless the full principal is repaid earlier or has been deemed paid in full or if the note is otherwise terminated. The HRA shall have no obligation to pay any unpaid balance of principal or accrued interest that may remain after the final payment on March 1, 2041. The current year abatement (TIF note payments) amounted to $344,053. At December 31, 2017, the principal amount outstanding on the note was $2,500,000.
25) TIF District #302, Pioneer Endicott Note #2: Issued in 2017 in the principal sum of $900,000 with an initial interest rate of 5.25% per annum. Principal and interest is paid each September 1 and March 1 following an initial payment after the project is completed and conditions are satisfied, and continuing until the March 1 which follows 2 collection years from the final collection year for the TIF District #302, Pioneer Endicott (TIF Note #1) listed above. Payments are payable solely from available pledged tax increments derived from the Pioneer Endicott TIF District and paid to the HRA. The pay-as-you-go note provides for the payment to the developer equal to 12% of available tax increments received by the HRA until the TIF District #302, Pioneer Endicott (TIF Note #1) listed above is paid and then equal to 40% for the following two years. The payment reimburses the developer (Minnesota Museum of American Art) for qualifying redevelopment expenses related to the renovation of the Pioneer Endicott building related to their specific project. Principal and interest payments will be completed two years following the repayment of the TIF District #302, Pioneer Endicott (TIF Note #1) listed above (but in no event any later than March 1, 2041), unless the full principal is repaid earlier or has been deemed paid in full or if the note is otherwise terminated. The HRA shall have no obligation to pay any unpaid balance of principal or accrued interest that may remain after the final payment following the two collection years detailed above. The current year abatement (TIF note payments) amounted to $0. At December 31, 2017, the principal amount outstanding on the note was $900,000.
91
HOUSING AND REDEVELOPMENT AUTHORITY OF THE CITY OF SAINT PAUL, MINNESOTA NOTES TO THE FINANCIAL STATEMENTS For the Fiscal Year Ended December 31, 2017
Note 5.I. (Continued)
26) TIF District #304, Schmidt Brewery: Issued in 2012 in the principal sum of $3,770,000 with an interest rate of 4.45% per annum. Principal and interest is paid on September 1, 2015, and each March 1 and September 1 thereafter to and including March 1, 2041. Payments are payable solely from available pledged tax increments derived from the property and paid to the HRA. The pay-as-you-go note provides for the payment to the developer equal to 90% of available tax increments received in the prior six months. The payment reimburses the developer for acquisition and affordable housing construction costs. Principal and interest payments will be completed March 1, 2041, unless the full principal is repaid earlier or has been deemed paid in full or if the note is otherwise terminated. The HRA shall have no obligation to pay any unpaid balance of principal or accrued interest that may remain after the final payment on March 1, 2041. The current year abatement (TIF note payments) amounted to $194,290. At December 31, 2017, the principal amount outstanding on the note was $3,770,000.
27) TIF District #305, West Side Flats: Issued in 2012 in the principal sum of $3,800,000 with an interest rate of 3.15% per annum. Principal and interest is paid on September 15, 2016, and each September 15 and March 15 thereafter to and including March 15, 2041. Payments are payable solely from available pledged tax increments derived from the property and paid to the HRA. The pay-as-you-go note provides for the payment to the developer equal to 90% of available tax increments received in the prior six months. The payment reimburses the developer for acquisition and affordable housing construction costs. Principal and interest payments will be completed March 15, 2041, unless the full principal is repaid earlier or has been deemed paid in full or if the note is otherwise terminated. The HRA shall have no obligation to pay any unpaid balance of principal or accrued interest that may remain after the final payment on March 15, 2041. The current year abatement (TIF note payments) amounted to $336,650. At December 31, 2017, the principal amount outstanding on the note was $3,695,631.
28) TIF District #313, Hamline Station East: Issued in 2014 in the principal sum of $530,000 with an interest rate of 5.82% per annum. Principal and interest is paid on September 1, 2017, and each March 1 and September 1 thereafter to and including March 1, 2043. Payments are payable solely from available pledged tax increments derived from the property and paid to the HRA. The pay-as-you-go note provides for the payment to the developer equal to 90% of available tax increments received in the prior six months. The payment reimburses the developer for acquisition and affordable housing construction costs. Principal and interest payments will be completed March 1, 2043, unless the full principal is repaid earlier or has been deemed paid in full or if the note is otherwise terminated. The HRA shall have no obligation to pay any unpaid balance of principal or accrued interest that may remain after the final payment on March 1, 2043. The current year abatement (TIF note payments)
92
chlee
Sticky Note
Marked set by chlee
HOUSING AND REDEVELOPMENT AUTHORITY OF THE CITY OF SAINT PAUL, MINNESOTA NOTES TO THE FINANCIAL STATEMENTS For the Fiscal Year Ended December 31, 2017
Note 5.I.(28) (Continued) amounted to $21,008. At December 31, 2017, the principal amount outstanding on the note was $530,000.
29) TIF District #314, Hamline Station West: Issued in 2014 in the principal sum of $1,559,000 with an interest rate of 5.50% per annum. Principal and interest is paid on September 1, 2017, and each March 1 and September 1 thereafter to and including March 1, 2043. Payments are payable solely from available pledged tax increments derived from the property and paid to the HRA. The pay-as-you-go note provides for the payment to the developer equal to 90% of available tax increments received in the prior six months. The payment reimburses the developer for acquisition and affordable housing construction costs. Principal and interest payments will be completed March 1, 2043, unless the full principal is repaid earlier or has been deemed paid in full or if the note is otherwise terminated. The HRA shall have no obligation to pay any unpaid balance of principal or accrued interest that may remain after the final payment on March 1, 2043. The current year abatement (TIF note payments) amounted to $33,033. At December 31, 2017, the principal amount outstanding on the note was $1,559,000.
30) TIF District #317, Custom House/Post Office: Issued in 2014 in the principal sum of $5,800,000 with an initial interest rate of 4.00% per annum, to be adjusted up to 6.00%. Principal and interest is paid on September 1, 2017, and each March 1 and September 1 thereafter to and including March 1, 2043. Payments are payable solely from available pledged tax increments derived from the property and paid to the HRA. The pay-as-you-go note provides for the payment to the developer equal to 65% of available tax increments received in the prior six months. The payment reimburses the developer for acquisition, site related and other public redevelopment costs. Principal and interest payments will be completed March 1, 2043, unless the full principal is repaid earlier or has been deemed paid in full or if the note is otherwise terminated. The HRA shall have no obligation to pay any unpaid balance of principal or accrued interest that may remain after the final payment on March 1, 2043. The current year abatement (TIF note payments) amounted to $82,599. At December 31, 2017, the principal amount outstanding on the note was $5,800,000.
31) TIF District #318, East - Bates Senior Housing: Issued in 2015 in the principal sum of $2,291,000 with an interest rate of 3.84% per annum. Principal and interest is paid on September 1, 2017, and each March 1 and September 1 thereafter to and including March 1, 2043. Payments are payable solely from available pledged tax increments derived from the property and paid to the HRA. The pay-as-you-go note provides for the payment to the developer equal to 90% of available tax increments received in the prior six months. The payment reimburses the developer for affordable housing construction costs. Principal and interest payments will be completed March 1, 2043, unless the full principal is repaid earlier or has been deemed paid in full or
93
HOUSING AND REDEVELOPMENT AUTHORITY OF THE CITY OF SAINT PAUL, MINNESOTA NOTES TO THE FINANCIAL STATEMENTS For the Fiscal Year Ended December 31, 2017
Note 5.I.(31) (Continued) if the note is otherwise terminated. The HRA shall have no obligation to pay any unpaid balance of principal or accrued interest that may remain after the final payment on March 1, 2043. The current year abatement (TIF note payments) amounted to $66,107. At December 31, 2017, the principal amount outstanding on the note was $2,291,000.
32) TIF District #319, 2700 University at Westgate Station: Issued in 2015 in the principal sum of $7,865,000 with an interest rate of 5.16% per annum. Principal and interest is paid on September 1, 2017, and each March 1 and September 1 thereafter to and including March 1, 2043. Payments are payable solely from available pledged tax increments derived from the property and paid to the HRA. The pay-as-you-go note provides for the payment to the developer equal to 90% of available tax increments received in the prior six months. The payment reimburses the developer for acquisition and affordable housing construction costs. Principal and interest payments will be completed March 1, 2043, unless the full principal is repaid earlier or has been deemed paid in full or if the note is otherwise terminated. The HRA shall have no obligation to pay any unpaid balance of principal or accrued interest that may remain after the final payment on March 1, 2043. The current year abatement (TIF note payments) amounted to $64,152. At December 31, 2017, the principal amount outstanding on the note was $7,865,000.
33) TIF District #321, Schmidt Keg House Project: Issued in 2017 in the principal sum of $1,700,000 with an interest rate of 4.95% per annum. Principal and interest is paid on September 1, 2018, and each March 1 and September 1 thereafter to and including March 1, 2044. Payments are payable solely from available pledged tax increments derived from the property and paid to the HRA. The pay-as-you-go note provides for the payment to the developer equal to 90% of available tax increments received in the prior six months. The payment reimburses the developer for qualifying redevelopment expenses related to the renovation of the Schmidt Keg House building. Principal and interest payments will be completed March 1, 2044, unless the full principal is repaid earlier or has been deemed paid in full or if the note is otherwise terminated. The HRA shall have no obligation to pay any unpaid balance of principal or accrued interest that may remain after the final payment on March 1, 2044. The current year abatement (TIF note payments) amounted to $0. At December 31, 2017, the principal amount outstanding on the note was $1,700,000.
34) TIF District #324, Wilson II Housing Project: Issued in 2016 in the principal sum of $1,720,000 with an interest rate of 4.25% per annum. Principal and interest is paid on September 1, 2019, and each March 1 and September 1 thereafter to and including March 1, 2045. Payments are payable solely from available pledged tax increments derived from the property and paid to the HRA. The pay-as-you-go note provides for the payment to the developer equal to 90% of available tax increments received in the prior six months. The payment reimburses the developer for
94
HOUSING AND REDEVELOPMENT AUTHORITY OF THE CITY OF SAINT PAUL, MINNESOTA NOTES TO THE FINANCIAL STATEMENTS For the Fiscal Year Ended December 31, 2017
Note 5.I.(34) (Continued) affordable housing construction costs. Principal and interest payments will be completed March 1, 2045, unless the full principal is repaid earlier or has been deemed paid in full or if the note is otherwise terminated. The HRA shall have no obligation to pay any unpaid balance of principal or accrued interest that may remain after the final payment on March 1, 2045. The current year abatement (TIF note payments) amounted to $0. At December 31, 2017, the principal amount outstanding on the note was $1,720,000.
J. Loan Guaranty Commitments
The HRA has entered into agreements with lending institutions and various Saint Paul businesses to guaranty the repayment of a portion of loans issued by the lending institutions to the businesses. The primary repayment source of these loans is the business. The HRA would be required to repay a portion of the loans in the event of default by the business. There are no private loans issued where a HRA guaranty exists at December 31, 2017.
K. Construction and Other Significant Commitments
The HRA purchased the Palace Theatre and began construction on the building in 2015. The project was financed by a loan from the City and a Minnesota Department of Employment and Economic Development (DEED) grant. The City loan is to be repaid solely from the revenues collected by the HRA from the operations of the Palace Theatre and any sales proceeds in accordance with the DEED grant agreement. Total capital construction costs were $15,487,535 and the theatre was placed into service on March 10, 2017. The Palace Theatre is included with the Buildings Capital Assets, Net of Related Depreciation, on the Governmental Activities on the Government-Wide Statement of Net Position. In March 2016, the HRA entered into an agreement with the City whereby the HRA will provide up to $18.3 million in funding for remediation, infrastructure, and other costs for a soccer stadium site located at Snelling and University Avenues. Included in this amount was $1,500,000 for the payment of remediation costs, which has been paid and is no longer included with the Pollution Remediation Obligation in the Governmental Activities on the Government-Wide Statement of Net Position. The developer, MUSC Holdings, LLC, entered into an agreement with the City in April 2016, and is exclusively responsible for all costs associated with the soccer stadium. The City will own the soccer stadium per the agreement with MUSC. Therefore, the soccer stadium infrastructure construction in progress will be included with the City’s Governmental Activities on the Government -Wide Statement of Net Position. The HRA is constructing a parking lot to support new development on Saint Paul property the HRA acquired from Hamm’s Brewing Co. Construction in progress for this parking lot was $197,547 on December 31, 2017. This construction in progress is included with the HRA Parking Enterprise Fund Statement of Net Position and the Business-type Activities Statement of Net Position.
95
HOUSING AND REDEVELOPMENT AUTHORITY OF THE CITY OF SAINT PAUL, MINNESOTA NOTES TO THE FINANCIAL STATEMENTS For the Fiscal Year Ended December 31, 2017
Note 5. (Continued)
L. Deferred Outflows/Inflows of Resources The amounts reported as Deferred Outflows of Resources in the Business-type Activities and on the Statement of Net Position – Proprietary Funds in the HRA Parking Enterprise Fund include $979,919 from debt refunding. The amounts reported as Deferred Inflows of Resources on the Balance Sheet – Governmental Funds in the HRA General Fund, HRA Debt Service Fund, HRA Tax Increment Capital Projects Fund, and HRA Development Capital Projects Fund include $90,044, $3,703,015, $1,211,799, and $292,373, respectively, are from the following unavailable revenue sources:
HRA Tax HRA
HRA General HRA Debt Increment Capital
Development Capital
HRA Total Governmental
Fund Service Fund Projects Fund Projects Fund Funds
Total Deferred Inflows of Resources 90,044$ 3,703,015$ 1,211,799$ 292,373$ 5,297,231$
M. Interfund Transactions (1) Interfund Receivables and Payables
During the course of its operations, the HRA has transactions between funds to finance operations and provide services. To the extent that certain transactions between funds had not been paid or received as of December 31, 2017, individual fund interfund receivable and payable balances were as follows:
Interfund InterfundReceivable Payable
HRA General Fund 774,983$ -$ HRA Tax Increment Capital Projects Fund - 5,720,162 HRA Development Capital Projects Fund 2,358,384 300,000 HRA Loan Enterprise Fund 3,136,795 814,744 HRA Parking Enterprise Fund 564,744 -
Total Interfund Receivables and Payables - All Funds 6,834,906$ 6,834,906$
Fund
Note: All advances are noncurrent.
96
HOUSING AND REDEVELOPMENT AUTHORITY OF THE CITY OF SAINT PAUL, MINNESOTA NOTES TO THE FINANCIAL STATEMENTS For the Fiscal Year Ended December 31, 2017
Note 5.M.(1) (Continued) The interfund receivables in the HRA General Fund, the HRA Development Capital Projects Fund, and the HRA Loan Enterprise Fund include $774,983, $2,108,384, and $2,836,795, respectively, which were advanced to the HRA Tax Increment Capital Projects Fund for the purpose of financing development expenditures in various tax increment financing districts prior to the receipt of tax increment revenues in these districts. The advances are to be repaid with interest when future available tax increment revenues are received in these districts. The interfund receivables in the HRA Loan Enterprise Fund includes $300,000 due from the HRA Development Capital Projects Fund for construction of the Palace Theatre. The interfund receivables in the HRA Development Capital Projects Fund and the HRA Parking Enterprise Fund include $250,000 and $564,744, respectively, which were advanced to the HRA Loan Enterprise Fund for the purchase of land held for resale, and to hold a loan to a ballpark project.
(2) Interfund Transfers
Individual fund interfund transfers during the fiscal year ended December 31, 2017, were as follows:
Transfers In Transfers OutFrom Other To Other
Funds Funds
HRA General Fund 76,486$ 2,061$ HRA Grants Fund - 262,249 HRA Debt Service Fund 131,019 3,137,781 HRA Tax Increment Capital Projects Fund 3,139,842 214,963 HRA Development Capital Projects Fund 211,249 - HRA Loan Enterprise Fund 58,458 - HRA Parking Enterprise Fund 2,230,970 - HRA Penfield Enterprise Fund - 2,230,970
Total Interfund Transfers - All Funds 5,848,024$ 5,848,024$
Transfers
Generally, transfers are used to (1) move revenues from the fund that collects them to the fund that the budget requires to expend them or (2) move unrestricted revenues from the fund that collects them to programs and projects accounted in another fund in accordance with budgetary authorizations.
97
HOUSING AND REDEVELOPMENT AUTHORITY OF THE CITY OF SAINT PAUL, MINNESOTA NOTES TO THE FINANCIAL STATEMENTS For the Fiscal Year Ended December 31, 2017
Note 5. (Continued)
N. Net Position/Fund Balances (1) Net Position - Governmental Activities
The amount reported as “Net Investment in Capital Assets” on the government-wide Statement of Net Position for the governmental activities as of December 31, 2017, is determined as follows:
Capital assets $ 45,848,519 Less: accumulated depreciation (14,866,115)Less: outstanding principal of related debt (19,959,852)
Net Investment in Capital Assets $ 11,022,552
The amount reported as “Restricted for Debt Service” on the government-wide Statement of Net Position for the governmental activities is based on required balances per bond indentures. This amount is $7,974,116 at December 31, 2017.
(2) Net Position - Business-type Activities
The amount reported as “Net Investment in Capital Assets” on the government-wide Statement of Net Position for the business-type activities and on the Statement of Net Position for the Proprietary Funds as of December 31, 2017, is determined as follows: Capital assets 139,608,218$ Less: accumulated depreciation (58,080,795) Less: outstanding principal of HRA Parking Enterprise Fund debt (47,219,742)
Net Investment in Capital Assets 34,307,681$
98
HOUSING AND REDEVELOPMENT AUTHORITY OF THE CITY OF SAINT PAUL, MINNESOTA NOTES TO THE FINANCIAL STATEMENTS For the Fiscal Year Ended December 31, 2017
Note 5.N.(2) (Continued) The amount reported as “Restricted for Debt Service” is based on required balances per bond indentures. The amount reported as “Restricted for Debt Service” on the government-wide Statement of Net Position for the business-type activities and on the Statement of Net Position for Proprietary Funds as of December 31, 2017, as follows:
HRA ParkingEnterprise
FundRestricted Assets Cash for general obligation bond debt service 2,020,700$ Cash for revenue bond debt service 2,183,249 Less: liabilities payable from restricted assets accrued interest on bonds (492,399)
Restricted for Debt Service 3,711,550$
The amount reported as “Restricted for Operations and Maintenance” on the government-wide Statement of Net Position for the business-type activities and on the Statement of Net Position for Proprietary Funds as of December 31, 2017, as follows: Restricted assets - cash for revenue bond operations and maintenance 27,218$
Restricted for Operations and Maintenance 27,218$
The amount reported as “Restricted for Grantors” is based on restrictions from granting agencies. The amount reported as “Restricted for Grantors” on the government-wide Statement of Net Position for the business-type activities and on the Statement of Net Position for Proprietary Funds as of December 31, 2017, as follows: Restricted assets – program income cash balance for grants 802,592$
Restricted for Grantors 802,592$
99
HOUSING AND REDEVELOPMENT AUTHORITY OF THE CITY OF SAINT PAUL, MINNESOTA NOTES TO THE FINANCIAL STATEMENTS For the Fiscal Year Ended December 31, 2017
Note 5.N. (Continued) (3) Fund Balances – Governmental Funds
Portions of the HRA’s fund balance are nonspendable, restricted due to legal restrictions, committed by HRA action, assigned by HRA management, or unassigned. At December 31, 2017, fund balance classifications were reported in the following governmental funds:
HRAHRA Tax Development Total
HRA General HRA Grants HRA Debt Increment Capital Capital Projects GovernmentalFund Fund Service Fund Projects Fund Fund Funds
NonspendableLand Held for Resale 325,236$ -$ -$ -$ -$ 325,236$
Total Restricted -$ 64,531$ 8,409,566$ 24,483,413$ 9,845,599$ 42,803,109$
CommittedEconomic Development 6,001,576$ -$ -$ -$ -$ 6,001,576$
AssignedEconomic Development 4,211,338$ -$ -$ -$ -$ 4,211,338$
Total Fund Balance 10,538,150$ 64,531$ 8,409,566$ 24,483,413$ 9,845,599$ 53,341,259$
100
HOUSING AND REDEVELOPMENT AUTHORITY OF THE CITY OF SAINT PAUL, MINNESOTA NOTES TO THE FINANCIAL STATEMENTS For the Fiscal Year Ended December 31, 2017
6. Contingent Liabilities Litigation
The HRA, in connection with the normal conduct of its affairs, is involved in various judgments, claims, and litigation; it is expected that the final settlement of these matters will not materially affect the financial statements of the HRA. Regions Hospital Parking Ramp Contingent Lease During 2006, the Port Authority of the City of Saint Paul (Port) issued revenue bonds to finance construction of a parking ramp at the Regions Hospital complex. The bonds are 30 year bonds with final scheduled retirement in 2036. The Port will lease the ramp for years 2008 through 2030 to Regions Hospital after construction is completed. The HRA agreed to a lease commitment in an amount equal to the annual debt service on the Port bonds for the years 2031 through 2036. The scheduled principal balance on the bonds is $6,045,000 in 2031 prior to the 2031 through 2036 debt payments. This HRA lease is not triggered and no payments are made by the HRA if any one of the following takes place:
1. Regions Hospital continues to need the ramp for their business and extends the lease with the Port from 2031 through 2036.
2. Sometime during the period of 2008 through 2030, Regions Hospital elects to purchase the ramp for the greater of the outstanding debt or fair market value of the ramp.
3. Regions Hospital defaults on the Port lease and the bond trustee determines on behalf of the bondholders to sell the ramp to a third party and cancels the HRA lease commitment.
Cleanup of Hazardous Materials Properties owned by the HRA may have certain contingent liabilities associated with them due to potential contamination from hazardous materials or difficulty in securing vacant structures located on them. It is not expected that these contingencies will have a material effect on the financial statements of the HRA. The following properties have been identified as possible sites of pollution or contamination: 1. Capp Road (Catholic Charities) - Possible pollution or contamination 2. Koch/Mobil - Remediation has already been completed 3. Rivoli Street Properties - Remediation has already been completed by the original polluter 4. Willow Reserve Property – Contamination
In 2009, the Exxon-Mobil property site was purchased which was polluted and required pollution remediation. This site was a former petroleum storage tank farm, built in the 1950’s which had suffered some leakage of petroleum. The purchase agreement requires the HRA to remediate the pollution and restricts the future use of the land to specific uses. The land was purchased for $1, and in addition, the seller donated $5,000,000 to the HRA for pollution
101
HOUSING AND REDEVELOPMENT AUTHORITY OF THE CITY OF SAINT PAUL, MINNESOTA NOTES TO THE FINANCIAL STATEMENTS For the Fiscal Year Ended December 31, 2017
Note 6. (Continued)
remediation and park features. This donation is identified as unearned revenue in the Governmental Funds Balance Sheet, in the HRA Development Capital Projects Fund. Because the land had no fair market value before remediation, it is valued at its purchase price in the Governmental Activities Capital Assets. On March 27, 2017, the HRA received a letter from the Minnesota Pollution Control Agency stating that the HRA has adequately addressed the petroleum tank release for the Exxon Mobil site and that such case file has been closed. In response to the letter received on March 27, 2017, from the Minnesota Pollution Control Agency the estimated maximum future cost of $50,000 is included with the Pollution Remediation Obligation identified on the Government-Wide Statement of Net Position. This pollution remediation obligation is an estimate and subject to changes resulting from price increases or reductions, technology, or changes in applicable laws or regulations. The Willow Reserve property is comprised of 11 single family homes, to be constructed by Habitat for Humanity, a public alley, and public space. The public alley and space is in the HRA’s possession. During excavation in 2017, construction debris was discovered and excavation stopped. The former use of the site included a greenhouse/garden center, out buildings and one or more residential structures. Several additional borings were conducted by Habitat for Humanity in 2017 and contaminants discovered include asbestos containing waste materials, buried debris and solid waste, arsenic, lead and benzo(a)pyrene (a carcinogen). Habitat for Humanity conducted the site investigation, development of a Phase I and Phase II report, and Response Action Plan. The method of investigation and the proposed course of action have been approved by the Minnesota Pollution Control Agency (MPCA). The investigation covers the entire site and has been done, in part, on behalf of the HRA. The estimated costs for cleanup for the homes, public alley, and public space are $700,000. The HRA portion of the costs is estimated to be $350,000 and is included with the Pollution Remediation Obligation identified on the Government-Wide Statement of Net Position. This pollution remediation obligation is an estimate and subject to changes resulting from price increases or reductions, cleanup grants awarded, technology, or changes in applicable laws or regulations.
7. Subsequent Events
On May 16, 2018, the City issued General Obligation Tax Increment Refunding Bonds, Series 2018C in the amount of $13,175,000. The proceeds will be used to current refund the HRA Parking Enterprise Fund General Obligation Tax Increment Refunding Bonds, Series 2009G. The HRA pledge agreement with the City outlines the explicit pledge of the HRA to remit 100% of the tax increments from the Block 39/Lawson TIF district and net parking revenue of the Lawson Parking Ramp to pay the scheduled principal and interest on the Series 2018C bonds.
102
SUPPLEMENTARY SCHEDULES
Supplementary schedules are presented to provide useful additional financial data to readers of this report.
HOUSING AND REDEVELOPMENT AUTHORITY OF THE CITY OF SAINT PAUL
SCHEDULE OF REVENUES, EXPENDITURES AND CHANGES IN FUND BALANCES - BUDGET AND ACTUALHRA DEBT SERVICE FUNDFor the Fiscal Year Ended December 31, 2017(Amounts in dollars)
Total Revenues 7,664,537 7,664,537 6,421,019 (1,243,518)
EXPENDITURESDebt Service
Principal Payment on Bonds 4,186,470 4,248,882 4,235,000 13,882Interest on Bonds 1,980,914 1,969,945 1,954,564 15,381Principal Payment on Notes 850,000 850,000 300,000 550,000Interest on Notes 52,539 52,539 26,269 26,270Fiscal Charges 27,410 22,910 22,124 786
Total Expenditures 7,097,333 7,144,276 6,537,957 606,319
Excess (Deficiency) of Revenues Over (Under) Expenditures 567,204 520,261 (116,938) (637,199)
OTHER FINANCING SOURCES (USES)Transfers In 117,500 117,500 131,019 13,519Transfers Out (3,271,550) (3,224,607) (3,137,781) 86,826
Total Other Financing Sources (Uses) (3,154,050) (3,107,107) (3,006,762) 100,345
Net Changes in Fund Balances (2,586,846) (2,586,846) (3,123,700) (536,854)
FUND BALANCE, January 1 11,533,266 11,533,266 11,533,266 -
FUND BALANCE, December 31 8,946,420$ 8,946,420$ 8,409,566$ (536,854)$
Budgeted Amounts
103
HOUSING AND REDEVELOPMENT AUTHORITY OF THE CITY OF SAINT PAUL
SCHEDULE OF DEPOSITS AND INVESTMENTSALL FUNDSAt December 31, 2017(Amounts in dollars at cost)
Maturity InterestInvestment Description Date Rate Amount
Parking Ramp Checking and Money Market Accounts at St. Paul Banks $1,059,965Money Market Mutual Funds:
First American Government Obligations Fund Class D 0.02% 1,729,224 First American Treasury Obligations Fund Class Y 0.00% 681,992 US Bank Money Market 5 - Ct Accounts 0.04% 820,480 Wells Fargo Advantage Money Market Fund Accounts 0.01% 808,570
Highland Bank Certificate of Deposit 3/30/2019 3.75% 606,288 Trustee Cash 0.00% 912 City Cash and Investments Pool 89,494,255
TOTAL DEPOSITS AND INVESTMENTS $95,201,686
Summary by Statement of Net Position Account
Cash and Investments with Treasurer $85,044,030Cash with Fiscal Agents 1,059,965 Cash and Investments with Trustees 4,616,224 Restricted Cash and Investments for General Obligation Bond Debt Service 2,020,700 Restricted Cash and Investments for Revenue Bond Debt Service 2,183,249 Restricted Cash and Investments for Revenue Bond Operations and Maintenance 27,218Restricted Cash and Investments for Note Debt Service 250,300
TOTAL DEPOSITS AND INVESTMENTS $95,201,686
104
HOUSING AND REDEVELOPMENT AUTHORITY OF THE CITY OF SAINT PAUL
SCHEDULE OF LOANS RECEIVABLEALL FUNDSAt December 31, 2017(Amounts in dollars)
Numberof Loans
Fund - Program Outstanding
HRA GENERAL FUNDEscrow Account for Taxes and Insurance 1 $ 42,435 $ 31,826 $ 10,609
Total HRA General Fund 1 $ 42,435 $ 31,826 $ 10,609
HRA GRANTS SPECIAL REVENUE FUNDReady for Rail Program 103 $ 395,736 $ 395,736 $ -
Total HRA Grants Special Revenue Fund 103 $ 395,736 $ 395,736 $ -
HRA TAX INCREMENT CAPITAL PROJECTS FUNDJobs Bill Loan Program 46 $ 2,724,520 $ 1,831,266 $ 893,254 Scattered Site TIF Bonds 14 5,681,693 5,519,193 162,500
Total HRA Tax Increment Capital Projects Fund 60 $ 8,406,213 $ 7,350,459 $ 1,055,754
HRA DEVELOPMENT CAPITAL PROJECTS FUNDHRA Funded 1 $ 1,389,063 $ 1,389,063 $ -Inspiring Communities 80 2,203,847 2,203,847 -ISP Programs 14 575,453 383,163 192,290
Total HRA Development Capital Projects Fund 95 $ 4,168,363 $ 3,976,073 $ 192,290
HRA LOAN ENTERPRISE FUNDSection 108 Loan Repayments 1 $ 675,000 $ 33,750 $ 641,250 Tax Credit Assistance Program (TCAP) 2 3,166,171 3,166,171 - Section 1602 Tax Credit Exchange (TCE) 3 11,302,314 11,302,314 - Rental Rehab 2 37,335 28,001 9,334 Enterprise Leverage 4 289,398 237,342 52,056 Commercial Real Estate 5 738,133 726,883 11,250 Home Purchase and Rehab 25 291,780 219,717 72,063 Home Ownership Opportunities 5 186,165 186,165 - Housing Real Estate 12 6,468,667 5,953,167 515,500 Mixed Income Housing 11 1,046,528 776,150 270,378 Business Assistance 1 39,000 19,500 19,500 Strategic Investment Program 5 204,190 204,190 - Business - UDAG 2 27,598 13,798 13,800 Housing - UDAG 2 256,000 253,500 2,500 Downtown Tax Increment 1 406,176 304,632 101,544 Neighborhood Development Tax Increment 2 474,000 451,200 22,800 HUD Rental Rehab 11 2,168,418 2,092,049 76,369 Home Mortgage Loan Origination Program 135 1,328,481 1,160,622 167,859 Mortgage Foreclosure Prevention 9 34,024 25,518 8,506 New Housing and Blighted Land Tax Increment 1 360,000 180,000 180,000 Affordable Housing 5 4,973,864 3,248,864 1,725,000 Ramsey County Rehab 5 96,125 96,125 -
Total HRA Loan Enterprise Fund 249 $ 34,569,367 $ 30,679,658 $ 3,889,709
Homeowner Loan Program - State Administered - 189,209 - - 189,209
Mortgage Foreclosure Prevention Assistance
Program - State Administered - - - 840 840
Total HRA Loan Enterprise Fund $ 25,153 $ 189,209 $ 330,496 $ 840 $ 545,698
TOTAL INTERGOVERNMENTAL REVENUE, OPERATING GRANTS,AND CAPITAL GRANTS $ 25,153 $ 631,008 $ 621,541 $ 840 $ 1,278,542
Federal State City Other Total
117
HOUSING AND REDEVELOPMENT AUTHORITY OF THE CITY OF SAINT PAUL
SCHEDULE OF INTERGOVERNMENTAL EXPENDITURES AND EXPENSESALL FUNDSFor the Fiscal Year Ended December 31, 2017(Amounts in dollars)
City
HRA GENERAL FUND
Financing for Planning and Economic Development Operating Costs 227,960$ Financing for HRA Board Salaries and Expenses 183,233 Financing for Policy Analyst 84,322 Financing for Right Track Program 66,437 Financing for Citizen Participation Program 18,486
Total HRA General Fund 580,438
HRA TAX INCREMENT CAPITAL PROJECTS FUNDFinancing for Sanitary Sewer Study at West Side Flats Site 3,300 Financing for RiverCentre Arena Revenue Bonds 2,787,264 Financing for Jackson Street Improvements 2,135,000 Financing for Soccer Stadium Site Infrastructure 4,699,219
Total HRA Tax Increment Capital Projects Fund 9,624,783
HRA DEVELOPMENT CAPITAL PROJECTS FUNDFinancing for Soccer Stadium Site Infrastructure 285,314 Financing for Demolitions 96,695
Total HRA Development Capital Projects Fund 382,009
HRA LOAN ENTERPRISE FUNDFinancing for Minority Business Development 819,540 Financing for Community Revitalization 120,000 Financing for Mayor's Technology Cabinet 50,000 Financing for Right Track Program 125,000 Financing for Soccer Stadium Site Infrastructure 50,000 Financing for Street Maintenance 2,705,000
Total HRA Loan Enterprise Fund 3,869,540
HRA PARKING ENTERPRISE FUNDFinancing for Parking Meter Operations 345,000 Financing for Parking Meter Improvements 621,000 Financing for Farmers Market Parking Operations 12,560 Financing for Lawson Retail Operations 10,950 Financing for Street Maintenance 1,568,436
Total HRA Parking Enterprise Fund 2,557,946
TOTAL INTERGOVERNMENTAL EXPENDITURES AND EXPENSES 17,014,716$
118
STATISTICAL SECTION
This part of the HRA's Comprehensive Annual Financial Report presents detailed information as a contextfor understanding what the information in the financial statements and note disclosures says about theHRA's overall financial health.
Page
Financial TrendsThese schedules contain trend information to help the reader understand how the HRA'sfinancial performance and well-being have changed over time. 120-135
Revenue CapacityThese schedules contain trend information to help the reader assess the HRA's most significant local revenue sources. 137-147
Debt CapacityThese schedules present information to help the reader assess the affordability of theHRA's current levels of outstanding debt and the HRA's ability to issue additional debt inthe future. 148-163
Demographic and Economic InformationThese schedules offer demographic and economic indicators to help the readerunderstand the environment within which the HRA's activities take place. 164-165
Operating InformationThese schedules contain service and capital asset data to help the reader understandhow the information in the HRA's financial report relates to the services the HRA providesand the activities it performs. 166-169
Sources: Unless otherwise noted, the information in these schedules is derived from the comprehensiveannual financial reports for the relevant year.
- This page intentionally left blank -
119
HOUSING AND REDEVELOPMENT AUTHORITY OF THE CITY OF SAINT PAUL
NET POSITION BY COMPONENTLast Ten Fiscal Years(Accrual Basis of Accounting)
2008 2009 2010 2011
Governmental Activities (b)
Net Investment in Capital Assets 8,784,001$ 10,540,586$ 9,888,295$ 9,356,032$
Total Housing & Redevelopment Authority Net Position 28,451,797$ 35,911,941$ 39,656,638$ 37,275,829$
(a) The deficit in governmental activities net position is explained in Management's Discussion and Analysis and Note 4.E. to the financial statements.(b) Restated
HOUSING AND REDEVELOPMENT AUTHORITY OF THE CITY OF SAINT PAUL
CHANGES IN NET POSITIONLast Ten Fiscal Years(Accrual Basis of Accounting)
2008 2009 2010
EXPENSES
Governmental Activities:Housing and Economic Development 24,163,156$ 30,430,746$ 53,868,777$ Interest on Long-Term Debt 10,945,951 10,264,402 10,132,800
Total Governmental Activities Expenses 35,109,107 40,695,148 64,001,577
Total Business-type Activities Expenses 19,073,516 17,059,086 13,073,081
Total Saint Paul HRA Expenses 54,182,623 57,754,234 77,074,658
PROGRAM REVENUES
Governmental Activities:Charges for Services:
Housing and Economic Development 2,811,075 1,715,578 5,104,319 Operating Grants and Contributions 21,744,714 20,874,019 37,531,003 Capital Grants and Contributions 1,861,975 271,305 27,711
Total Governmental Activities Program Revenues 26,417,764 22,860,902 42,663,033
Total Saint Paul HRA Changes in Net Position 9,699,718$ 5,663,256$ 5,295,174$
Notes:Large housing and development expenses were incurred and large operating grants, contributions, and direct appropriations were received during 2010 for tax credit assistance and exchange.
HOUSING AND REDEVELOPMENT AUTHORITY OF THE CITY OF SAINT PAUL
FUND BALANCES - GOVERNMENTAL FUNDSLast Ten Fiscal Years(Modified Accrual Basis of Accounting)
2008 2009 2010 2011(1)
HRA General Fund
Nonspendable -$ -$ -$ 717,599$
Committed - - - 4,448,812
Assigned - - - 1,414,495
Unassigned - - - 4,242,795
Reserved 801,534 742,647 731,031 -
Unreserved 10,881,369 9,614,435 9,133,372 -
Total HRA General Fund 11,682,903$ 10,357,082$ 9,864,403$ 10,823,701$
All Other HRA Funds
Nonspendable -$ -$ -$ -$
Restricted - - - 44,696,696
Assigned - - - 562,349
Reserved 22,956,178 25,366,854 31,047,251 -
Unreserved 31,037,525 28,496,659 21,230,536 -
Total All Other HRA Funds 53,993,703$ 53,863,513$ 52,277,787$ 45,259,045$
TOTAL - ALL HRA FUNDS
Nonspendable -$ -$ -$ 717,599$
Restricted - - - 44,696,696
Committed - - - 4,448,812
Assigned - - - 1,976,844
Unassigned - - - 4,242,795
Reserved 23,757,712 26,109,501 31,778,282 -
Unreserved 41,918,894 38,111,094 30,363,908 - Total All HRA Funds 65,676,606$ 64,220,595$ 62,142,190$ 56,082,746$
RestatementTotal All HRA Funds, Restated
(1) The implementation of Governmental Accounting Standards Board Statement No. 54 in 2011 resulted in a significant change in the Authority's fund balance classifications.(2) The implementation of a new fund structure related to the City's implementation of the new finance system on January 1, 2014 resulted in a significant change in the Authority's fund balance classifications.(3) On January 1, 2017, the fund balances for governmental funds were adjusted to eliminate deferred
Total Net Position - All Proprietary Funds 64,953,031$ 65,609,286$ 67,363,024$ 68,398,215$ 2013 Restatements (2)Total Net Position - All Proprietary Funds, Restated
(1) Restated(2) The implementation of a new fund structure related to the City's implementation of the new finance system on January 1, 2014 resulted in a significant change in the Authority's net position classifications.
Total Operating Revenues 12,944,361 12,953,132 11,898,783 14,618,528
OPERATING EXPENSESDevelopment Loan Programs 3,581,561 2,970,167 710,321 2,929,465 Costs of Parking and Apartment Facility Operation 5,497,193 5,043,784 5,425,658 5,229,275 Depreciation 2,758,238 2,766,036 2,846,729 2,937,220 Bad Debt Expense on Loans 365,486 187,588 309,257 5,994 Forgivable Loan Expense 1,920,551 1,708,022 161,365 609,833
Total Operating Expenses 14,123,029 12,675,597 9,453,330 11,711,787
OPERATING INCOME (LOSS) (1,178,668) 277,535 2,445,453 2,906,741
NONOPERATING REVENUES (EXPENSES)Property Tax Increments 1,193,871 1,178,925 1,258,761 1,242,838 Operating Grants 84,539 427,828 294,329 519,025 Gain on Sale of Capital Assets 1,336,484 - - - Noncapital Contributions 3,681,269 924,982 23,011 128,762 Investment Income 794,694 99,134 305,311 733,407 Interest Earned - Other - - - - Revaluation of Land Held for Resale (270,345) - - - Interest on Long-Term Debt (4,493,159) (3,909,476) (3,162,276) (3,313,774) Debt Service Issuance Costs - - - - Intergovernmental Revenues - - - - Intergovernmental Expenses (76,483) (357,244) (312,089) (467,116) Miscellaneous Other Revenue - - - - Miscellaneous Other Expense - - - - Loss on Retirement of Assets - - - (405,036) Litigation Mediation - Noncash Advance - - (412,753) - Amortization of Debt Issuance Costs (1) (110,500) (116,768) (145,386) (2,090,223)
Total Non-operating Revenues (Expenses) 2,140,370 (1,752,619) (2,151,092) (3,652,117)
Capital Contributions - - 947,344 1,592,480 Transfers In 600,316 2,528,208 2,078,822 195,190 Transfers Out (104,451) (396,869) (16,312) (7,103) Special Item - - - -
Change in Net Position 1,457,567$ 656,255$ 3,304,215$ 1,035,191$ 2013 Restatements (3)Change in Net Position, Restated
(1) In 2012, with adoption of GASB 65, total debt issuance cost for the year is expensed, not amortized.
(2) Restated
(3) The implementation of a new fund structure related to the City's implementation of the new finance system on January 1, 2014 resulted in a significant change in the Authority's net position classifications.
State Law Maximum 0.0144% 0.0185% 0.0185% 0.0185%Levy Rate(% of Taxable Market Value)
Maximum Tax Levy 3,322,282$ 4,213,703$ 3,987,099$ 3,712,072$ per State Law
Actual Tax Levy 1,215,903$ 2,278,148$ 3,178,148$ 3,178,148$ Certified
Actual Levy under 2,106,379$ 1,935,555$ 808,951$ 533,924$ Maximum
% of Actual Levy to 36.60% 54.07% 79.71% 85.62%Maximum
Data for this table is obtained from the City of Saint Paul Comprehensive Annual Financial Report, the Housing and Redevelopment Authority of the City of Saint Paul Comprehensive Annual Financial Report, and the City of Saint Paul Office of Financial Services.
Data for Real Property, Personal Property, and Fiscal Disparities prior to 2009 is not available.
* Amounts are in Dollars. Real and Personal Property, Fiscal Disparity, and Taxable Market Value. Beginning in 2013,
market value but applies to the current year's net tax capacity.Taxable Market Value is replaced by Estimated Market Value. The levy is based on the prior year's estimated
HOUSING AND REDEVELOPMENT AUTHORITY OF THE CITY OF SAINT PAUL
HRA PROPERTY TAX LEVIES AND COLLECTIONSLast Ten Fiscal Years
2008 2009 2010 2011
Total Taxes Levied for 1,215,903$ 2,278,148$ 3,178,148$ 3,178,148$ Current Fiscal Year
Collection of Current Year Tax Levy From Taxpayers 953,678$ 1,874,829$ 2,259,765$ 2,470,269$ Fiscal Disparity Aid 183,574 223,759 493,367 693,746 State Credits and Aids 44,437 87,974 115,779 108,652 Closed TIF District Adj. - - 194,065 -
Total Current Year Tax Levy Collection 1,181,689$ 2,186,562$ 3,062,976$ 3,272,667$ (1)
Actual Percent of Current Year Levy 97.19% 95.98% 96.38% 102.97%
Collection of Delinquent Taxes for Subsequent Years 1st Year Delinquent 28,026$ 41,495$ 14,489$ 21,851$ 2nd Year Delinquent 2,991 9,941 (8,660) (4,284) 3rd Year Delinquent (4,334) (654) (1,867) (3,642) 4th Year Delinquent 349 276 1,259 (2,854) 5th Year Delinquent 353 1,095 (1,904) 932 6th Year & Prior Delinquent 492 (8,768) 1,693 1,902
Total Delinquent Taxes Collection 27,877$ 43,385$ 5,010$ 13,905$
Total Tax Collections 1,209,566$ 2,229,947$ 3,067,986$ 3,286,572$
Total Percent of Levy Collected 99.48% 97.88% 96.53% 103.41%
(1) Revaluation downward of property in a closed Tax Increment Finance District reduced net levy collected by HRA by 6.11%
Note: Collections do not include Tax Increment Districts.
Delinquent Tax Increment Receivableat December 31 $399,845 $746,588 $696,706
Percentage of Delinquent Tax IncrementReceivable to Tax Increment Spread 1.41% 2.74% 2.43%
Percentage of Captured Tax Capacity toSaint Paul Total Tax Capacity 9.22% 8.52% 8.67%
Note: This table includes data from both Saint Paul Housing and Redevelopment Authority and Saint Paul Port Authority administered tax increment financing districts. The percentage of Total Captured Tax Capacity to Saint Paul Total Tax Capacity was adjusted for 2011.
Ford Motor Company 1)692,090 8 0.26% 1,947,330 3 0.71%
Court International LLC 685,194 9 0.26%
US REIF Upper Landing MN LLC 657,308 10 0.25%
St. Paul Fire & Marine Insurance Company 1,559,180 6 0.57%
CSM Corporation & Investors 976,710 8 0.35%
Griffin Capital LLC 805,250 10 0.29%
17,105,352$ 6.38% 18,631,857$ 6.76%
1) Ford Motor Company closed its Highland Park plant in December 2011 and is in the process of completing the environmental cleanup of the site for future
redevelopment.Source: Ramsey County Auditor
2017 2008
Unaudited
145
HOUSING AND REDEVELOPMENT AUTHORITY OF THE CITY OF SAINT PAUL
HRA PARKING FACILITY REVENUESLast Ten Fiscal Years
Details regarding the HRA's outstanding debt can be found in the notes to the financial statements.
(1) See the "Demographic and Economic Statistics" Table for population data. Beginning in 2016, the ratio is calculated using population for the current calendar year. Prior to 2016, the ratio is calculated using population for the prior calendar year.
(2) See the "Demographic and Economic Statistics" Table for personal income data. Beginning in 2016, the ratio is calculated using personal income for the current year. Prior to 2016, the ratio is calculated using personal income for the prior calendar year.
Business-type ActivitiesGovernmental Activities
Unaudited
148
Housing 5000 Limited Percent ofLand Assembly Tax Revenue Total Saint Household
Bonds Bonds Notes Mortgages Paul HRA Per Capita (1) Personal Income (2)
MIDWAY MARKETPLACE TAX INCREMENT BONDS, SERIES 1995A / SNELLING-UNIVERSITY TAX INCREMENT BONDS, SERIES 2005C AND 2014DFund Servicing Debt - HRA Debt Service Fund
Revenues Available for Debt ServiceTax Increments 1,427,457$ 1,563,981$ 1,197,542$ 1,175,554$ Net Investment Earnings 151,489 127,478 133,263 121,825
Total Revenues Available for Debt Service 1,578,946$ 1,691,459$ 1,330,805$ 1,297,379$
* Tax increment from prior year was used to make final debt service payment in 2017 (final maturity was 3/1/2017).
SALES TAX REVENUE BONDS, SERIES 1993 AND 1996Fund Servicing Debt - HRA Debt Service FundNote: In 2014 the bonds were refunded and upon funding of the escrow and defeasance of the bonds in August 2014, sales tax revenue was no longer available for debt service.
Revenues Available for Debt ServiceCity Sales Tax Revenues 15,393,811$ 17,153,570$ 18,652,765$ 20,125,431$ Net Investment Earnings 47,160 (2,940) (3,252) (3,379)
Total Revenues Available for Debt Service 15,440,971$ 17,150,630$ 18,649,513$ 20,122,052$
Note: For TIF or levy supported debt issues, revenues available for debt service reflect taxes received in July and December of the fiscal year and debt service requirements reflect obligations during the fiscal year. Since the second half taxes are not received until December, they are used for the first debt payments of the following fiscal year; and second half taxes received in December of the prior fiscal year are used for the first debt payments of the current fiscal year.
HOUSING AND REDEVELOPMENT AUTHORITY OF THE CITY OF SAINT PAUL
SCHEDULE OF BOND COVERAGELast Ten Fiscal Years
2008 2009 2010 2011
Note: For TIF or levy supported debt issues, revenues available for debt service reflect taxes received in July and December of the fiscal year and debt service requirements reflect obligations during the fiscal year. Since the second half taxes are not received until December, they are used for the first debt payments of the following fiscal year; and second half taxes received in December of the prior fiscal year are used for the first debt payments of the current fiscal year.
DOWNTOWN TAX INCREMENT BONDS, SERIES 1993 AND 1998Fund Servicing Debt - HRA Debt Service Fund
RIVERCENTRE PARKING FACILITY LEASE REVENUE BONDS, SERIES 2000 AND SERIES 2009Fund Servicing Debt - HRA Debt Service Fund
Revenues Available for Debt ServiceLease Payments from the City 835,943$ 1,098,963$ 580,367$ 586,422$ Net Investment Earnings 5,022 27,744 19,761 19,596
Total Revenues Available for Debt Service 840,965$ 1,126,707$ 600,128$ 606,018$
HOUSING AND REDEVELOPMENT AUTHORITY OF THE CITY OF SAINT PAUL
SCHEDULE OF BOND COVERAGELast Ten Fiscal Years
2008 2009 2010 2011
Note: For TIF or levy supported debt issues, revenues available for debt service reflect taxes received in July and December of the fiscal year and debt service requirements reflect obligations during the fiscal year. Since the second half taxes are not received until December, they are used for the first debt payments of the following fiscal year; and second half taxes received in December of the prior fiscal year are used for the first debt payments of the current fiscal year.
US BANK TAX INCREMENT BONDS, SERIES 2001, 2011F, AND 2011GFund Servicing Debt - HRA Debt Service Fund
Revenues Available for Debt ServiceTax Increments 1,175,602$ 1,223,585$ 1,388,596$ 1,497,416$ Net Investment Earnings 15,594 10,052 16,670 19,255
Total Revenues Available for Debt Service 1,191,196$ 1,233,637$ 1,405,266$ 1,516,671$
NORTH QUADRANT TAX INCREMENT BONDS, SERIES 2000 AND 2002, AND 9TH STREET LOFTS TAX INCREMENT BONDS, SERIES 2004Fund Servicing Debt - HRA Debt Service Fund
Revenues Available for Debt ServiceTax Increments 314,364$ 248,218$ 309,134$ 316,996$ Net Investment Earnings 2,989 143 (956) 1,590
Total Revenues Available for Debt Service 317,353$ 248,361$ 308,178$ 318,586$
HOUSING AND REDEVELOPMENT AUTHORITY OF THE CITY OF SAINT PAUL
SCHEDULE OF BOND COVERAGELast Ten Fiscal Years
2008 2009 2010 2011
Note: For TIF or levy supported debt issues, revenues available for debt service reflect taxes received in July and December of the fiscal year and debt service requirements reflect obligations during the fiscal year. Since the second half taxes are not received until December, they are used for the first debt payments of the following fiscal year; and second half taxes received in December of the prior fiscal year are used for the first debt payments of the current fiscal year.
DRAKE MARBLE TAX INCREMENT BONDS, SERIES 2002Fund Servicing Debt - HRA Debt Service FundNote: trustee redeemed $28,000 in 2014 for 2013 debt service.
Revenues Available for Debt ServiceTax Increments 180,044$ 236,731$ 177,334$ 219,640$ Net Investment Earnings 1,737 1,373 183 (739)
Total Revenues Available for Debt Service 181,781$ 238,104$ 177,517$ 218,901$
* Tax increments from prior years used to redeem add'l principal
KOCH MOBIL TAX INCREMENT BONDS, SERIES 2004C, 2007B, AND 2010AFund Servicing Debt - HRA Debt Service Fund
Revenues Available for Debt ServiceTax Increments 275,936$ 202,986$ 299,002$ 269,163$ Developer Shortfall Payments - 237,190 - - Net Investment Earnings 4,589 8,114 2,649 5,005 Total Revenues Available for Debt Service 280,525$ 448,290$ 301,651$ 274,168$
HOUSING AND REDEVELOPMENT AUTHORITY OF THE CITY OF SAINT PAUL
SCHEDULE OF BOND COVERAGELast Ten Fiscal Years
2008 2009 2010 2011
Note: For TIF or levy supported debt issues, revenues available for debt service reflect taxes received in July and December of the fiscal year and debt service requirements reflect obligations during the fiscal year. Since the second half taxes are not received until December, they are used for the first debt payments of the following fiscal year; and second half taxes received in December of the prior fiscal year are used for the first debt payments of the current fiscal year.
NEIGHBORHOOD SCATTERED SITE TAX INCREMENT BONDS, SERIES 2005Fund Servicing Debt - HRA Debt Service Fund
Revenues Available for Debt ServiceTax Increments 2,170,482$ 2,352,017$ 2,252,256$ 2,044,411$ Reserve Funds - - - - Net Investment Earnings 139,301 166,523 189,872 191,976
Total Revenues Available for Debt Service 2,309,783$ 2,518,540$ 2,442,128$ 2,236,387$
* Tax incr from prior year was used to make final debt serv pmnt in 2017 (final maturity was 3/1/2017)
JIMMY LEE RECREATION FACILITY LEASE BONDS, SERIES 2008Fund Servicing Debt - HRA Debt Service Fund
Revenues Available for Debt ServiceLease Payments from the City 222,980$ 538,560$ 521,579$ 529,575$ Net Investment Earnings 72,671 (7,622) 69,224 24,500
Total Revenues Available for Debt Service 295,651$ 530,938$ 590,803$ 554,075$
EMERALD GARDENS TAX INCREMENT BONDS, SERIES 2010Fund Servicing Debt - HRA TI Capital Projects FundNote: A portion of the listed tax increments are not pledged (10% of the Emerald-Metro).
Revenues Available for Debt ServiceTax Increments -$ -$ -$ 610,362$ Net Investment Earnings - - - 40,194
Total Revenues Available for Debt Service -$ -$ -$ 650,556$
HOUSING AND REDEVELOPMENT AUTHORITY OF THE CITY OF SAINT PAUL
SCHEDULE OF BOND COVERAGELast Ten Fiscal Years
2008 2009 2010 2011
Note: For TIF or levy supported debt issues, revenues available for debt service reflect taxes received in July and December of the fiscal year and debt service requirements reflect obligations during the fiscal year. Since the second half taxes are not received until December, they are used for the first debt payments of the following fiscal year; and second half taxes received in December of the prior fiscal year are used for the first debt payments of the current fiscal year.
HOUSING 5000 LAND ASSEMBLY BONDS, SERIES 2004Fund Servicing Debt - HRA Loan Enterprise Fund
Revenues Available for Debt ServiceLand Sales 2,477,716$ 2,358,000$ -$ 1,404,760$ Net Investment Earnings 314,168 5,594 24,642 2,033
Total Revenues Available for Debt Service 2,791,884$ 2,363,594$ 24,642$ 1,406,793$
HOUSING AND REDEVELOPMENT AUTHORITY OF THE CITY OF SAINT PAUL
SCHEDULE OF BOND COVERAGELast Ten Fiscal Years
2008 2009 2010 2011
Note: For TIF or levy supported debt issues, revenues available for debt service reflect taxes received in July and December of the fiscal year and debt service requirements reflect obligations during the fiscal year. Since the second half taxes are not received until December, they are used for the first debt payments of the following fiscal year; and second half taxes received in December of the prior fiscal year are used for the first debt payments of the current fiscal year.
PARKING REVENUE BONDS, SERIES 1992A, 1995A, 1995B, 2001A, 2002A, 2002B, 2005A, AND 2010AFund Servicing Debt - HRA Parking Enterprise FundNote: Revenues are pledged in aggregate for Parking Revenue Bonds, Series 2010A and 2010B, and have been adjusted for the Smith Avenue Transit Center bonds.
Revenues Available for Debt ServiceParking Facility Net Revenues 3,124,631$ 3,084,230$ 3,043,611$ 3,492,539$ Parking Meter and Parking Fine Revenues 2,000,000 2,000,000 2,000,000 3,000,000 Net Investment Earnings - - - -
Total Revenues Available for Debt Service 5,124,631$ 5,084,230$ 5,043,611$ 6,492,539$
PARKING REVENUE BONDS (SMITH AVENUE TRANSIT CENTER), SERIES 2005 AND 2010BFund Servicing Debt - HRA Parking Enterprise FundNote: Revenues are pledged in aggregate and have been adjusted for the Smith Avenue Transit Center bonds.
Revenues Available for Debt ServiceParking & Transit Center Net Revenues 220,990$ 226,406$ 290,945$ 320,922$ Parking Meter and Parking Fine Revenues - - - - Net Investment Earnings 125,279 19,463 9,924 49,559
Total Revenues Available for Debt Service 346,269$ 245,869$ 300,869$ 370,481$
LOFTS AT FARMERS MARKET LIMITED TAX BONDS, SERIES 2010A AND 2010BFund Servicing Debt - HRA Lofts Enterprise FundNote: The bonds were defeased in 2015 using sales proceeds from the 12/14/2015 sale of the Lofts at Farmers Market Apartments.
Revenues Available for Debt ServiceHRA Tax Levy -$ -$ -$ -$ Bond Proceeds - Capitalized Interest - - 569,786 - Net Investment Earnings - - - 16,249
Total Revenues Available for Debt Service -$ -$ 569,786$ 16,249$
Sources:(1) 2008-2009, 2011-2012, 2016, 2017 data is based on Metropolitan Council estimates. 2010, 2013-2015 data is based onU.S. Census Bureau information.(2) 2008-2015 data provided by U.S. Census Bureau's Annual American Community Survey. 2016-2017 data is provided by Minnesota Department of Employment and Economic Development (DEED).(3) Annual average - not seasonally adjusted. Data provided by Minnesota DEED.
Unaudited
DEMOGRAPHIC AND ECONOMIC STATISTICS
164
City of Saint Paul, Minnesota
PRINCIPAL EMPLOYERS
Current Year and Nine Years Ago
Percentage Percentage Number of of Total Number of of Total
Employers Employees Rank City Employment Employees Rank City Employment
University of Minnesota 1)18,000 1 11.41%
State of Minnesota 1)14,173 2 8.99% 13,200 1 7.29%
3M Company 10,500 3 6.66%
Health East 1) 2)7,500 4 4.76% 3,078 7 1.70%
Saint Paul Public Schools 5,966 5 3.78% 5,737 2 3.17%
Regions Hospital 1)5,309 6 3.37% 4,554 4 2.52%
Ramsey County 4,427 7 2.81% 2,686 9 1.48%
United Hospital 1)3,600 8 2.28% 3,791 6 2.09%
City of Saint Paul 1)2,913 9 1.85% 3,010 8 1.68%
Securian Financial Group 2,750 10 1.74%
U.S. Bancorp 4,700 3 2.60%
United States Federal Government 4,184 5 2.31%
St. Paul Traveler's Insurance 2,550 10 1.40%
Total 75,138 47.65% 47,490 26.24%
1) Includes full- and part-time employees.2) Includes all home care clinics in its network
Sources: Minnesota DEED and City Capital Partnership for 2008 data; 2017 data compiled by Springsted Inc. based on February 2018telephone survey of individual employers.
20082017
Unaudited165
HOUSING AND REDEVELOPMENT AUTHORITY OF THE CITY OF SAINT PAUL
OPERATING INDICATORSLast Ten Fiscal Years
2008 2009 2010
New and Substantially Rehabilitated 10 100 96 Single- and Multi-Family Housing Units
Number of Pedestrian Skyway Bridges 37 37 37
Source: City of Saint Paul, Department of Planning and Economic Development.
166
2011 2012 2013 2014 2015 2016 2017
100 106 99 774 316 1,600 1,232
37 37 37 37 37 37 37
Unaudited
167
HOUSING AND REDEVELOPMENT AUTHORITY OF THE CITY OF SAINT PAUL
CAPITAL ASSET STATISTICSLast Ten Fiscal Years
2008 2009 2010 2011
Number of Parking Ramps 9 9 9 9
Number of Parking Lots 8 8 8 8
Number of Parking Spaces 7,958 7,958 7,958 7,958
Depreciated Cost of ParkingRamps, Lots, and Buildings 101,652,375$ 99,337,412$ 97,997,999$ 93,596,580$
Number of Apartment Houses - - - -
Depreciated Cost of Apartment Houses and Land - - - -
Source: City of Saint Paul, Department of Planning and Economic Development.