15
Housing Audit June 2020

Housing Audit June 2020

Housing Audit
2
Contents
Background 3
Housing at June 2020 5
Building and dwelling stock 5 Dwelling location, totals and net change, year to June 2020 5 Building structure 8 Dwelling structure 8 Dwelling tenure 9 Location of net dwelling change, year to June 2020 10 Additional information 11
Further information 14
List of Tables Table 1. Private dwellings at 30 June 2020 by village .......................................................... 5
Table 2. Non-private dwellings at 30 June 2020 by village. .................................................. 6
Table 3. Total dwellings (private and non-private) at 30 June 2020 by village. ..................... 7
List of Figures Figure 1. Distribution of net dwelling change between June 2019 and June 2020. ............. 10
Figure 2. Estimated resident population and annual growth. Source: ABS Category No. 3218.0 11
Figure 3. Median sale price, City of Sydney. Source: NSW Department of Communities and Justice, Rent and Sales Report (Issues 86-129) ............................................................................. 12
Figure 4.Median weekly rent, City of Sydney. Source: NSW Department of Communities and Justice, Rent and Sales Report (Issues 85-128) ............................................................................. 12
Figure 5. Median total household income. Source: ABS Census of Population and Housing 2001, 2006, 2011, 2016. .............................................................................................................. 13

Housing Audit
3
Background The City of Sydney Housing Data Collection Framework provides a comprehensive method for the audit of all housing (building) and dwelling stock in the local area. This provides an estimate of all types of residential buildings, dwelling structure, and dwelling tenure (type). The audit of the housing and dwelling stock in the City of Sydney local area will be reported annually at the end of each financial year.
The City’s Community Strategic Plan (Sustainable Sydney 2030) contains 10 strategic directions aimed at delivering a city the community wants by 2030. Strategic Direction 8 – Housing for a Diverse Population – aims for “a wider range of housing so people who provide vital city services can afford to live in the city”.
The City of Sydney local area has undergone a rapid increase in dwelling stock over the past decade, with more new dwellings due for completion in both the near and medium terms. According to the Department of Planning & Environment, the population of the city is projected to reach 292,350 by 2031, and over 315,000 by 2036. The Australian Bureau of Statistics (ABS) Estimated Resident Population (ERP) for the City of Sydney local area at June 2019 was 246,343 (ABS, 3218.0 - Regional Population Growth, Australia, updated 25 March 2020).
In the City’s Community Strategic Plan (2017), Target 3 states that by 2030:
“There will be at least 138,000 dwellings in the city (including 48,000 additional dwellings compared to the June 2007 baseline) for increased diversity of household types, including greater share of families (page 23).”
The figures quoted in the Community Strategic Plan relates to private dwellings as defined by the ABS. The term private dwellings applies to all housing except for boarding houses (Class 1B and Class 3), student accommodation and residential care services (such as aged-care facilities). Private housing includes social (including public) housing, affordable rental housing and privately owned or rented housing.
The baseline (June 2007) figure for these dwellings was 89,749 private dwellings, sourced from the 2006 ABS Census of Population and Housing and the 2007 Floor Space and Employment Survey.
The Housing Audit’s data is sourced from the City of Sydney Floor Space and Employment Survey (the most recent Survey was completed undertaken in 2017). Annual updates are augmented by information collected from monitoring of development statistics and changes to ownership patterns, and data gathered from housing providers. The data takes into account both additions (new dwellings) and subtractions (demolished dwellings, change of use) to obtain net increase and end of year totals for housing and dwellings.
The June 2020 Housing Audit provides a comprehensive data set for the assessment of all housing stock and housing types in the city.

Housing Audit
4
The Housing Audits report annually on the following:
– The city’s current dwelling stock (buildings and dwellings)
• private dwellings
• non-private dwellings
– number of dwellings by Village area
– building structure
– dwelling structure including net annual increase
– dwelling tenure (type) including net annual increase.
The 2020 Housing Audit also includes information on median income for city residents (Census data) and median rents (Department of Communities and Justice (formerly Housing) data).

Housing Audit
5
Housing at June 2020 Building and dwelling stock As of June 2020, it is estimated that there were 21,950 buildings in the City of Sydney local area that contain residential dwellings (either private or non-private dwellings).
Within these buildings there were a total of 133,676 residential dwellings counted.
There were 119,019 private dwellings (private ownership and rental dwellings, social (including public) housing, affordable rental housing).
There were 14,657 non-private dwellings (boarding house rooms, student accommodation rooms, residential care services).
Dwelling location, totals and net change, year to June 2020 The following tables show the numbers of private, non-private and total dwellings at June 2019 and June 2020, with net change in dwellings and percentage change in dwellings over the financial year.
Table 1. Private dwellings at 30 June 2020 by village
Village Private Dwellings
(private ownership and rental dwellings, social (including public) housing, affordable and rental housing)
Jun-19 Jun-20 Change % Change
CBD and Harbour 5,651 5,776 125 2.2%
Chinatown & CBD South 9,038 9,038 0 0.0%
Crown & Baptist Streets 12,928 13,041 113 0.9%
Glebe Point Road 11,987 12,411 424 3.5%
Green Square and City South 20,139 21,344 1,205 6.0%
Harris Street 8,892 9,138 246 2.8%
King Street 9,959 10,255 296 3.0%
Macleay St & Woolloomooloo 13,057 13,064 7 0.1%
Oxford Street 10,925 10,940 15 0.1%
Redfern Street 13,968 14,012 44 0.3%
City of Sydney local area 116,544 119,019 2,475 2.1%

Housing Audit
6
Table 2. Non-private dwellings at 30 June 2020 by village.
Village Non-private Dwellings
(boarding house rooms, student accommodation rooms, residential care services)
Jun-19 Jun-20 Change % Change
CBD and Harbour 0 7 0 n/a
Chinatown & CBD South 1,477 1,477 0 0.0%
Crown & Baptist Streets 1,070 1,103 33 3.1%
Glebe Point Road 1,867 1,867 0 0.0%
Green Square and City South 19 19 0 0.0%
Harris Street 851 851 0 0.0%
King Street 3,547 3,678 131 3.7%
Macleay St & Woolloomooloo 454 454 0 0.0%
Oxford Street 1,072 1,114 42 3.9%
Redfern Street 4,087 4,087 0 0.0%
City of Sydney local area 14,425 14,657 213 1.5%

Housing Audit
7
Table 3. Total dwellings (private and non-private) at 30 June 2020 by village.
Village Total Dwellings
Jun-19 Jun-20 Change % Change
CBD and Harbour 5,651 5,783 132 2.3%
Chinatown & CBD South 10,515 10,515 0 0.0%
Crown & Baptist Streets 13,998 14,144 146 1.0%
Glebe Point Road 13,854 14,278 424 3.1%
Green Square and City South 20,158 21,363 1,205 6.0%
Harris Street 9,743 9,989 246 2.5%
King Street 13,506 13,993 427 3.2%
Macleay St & Woolloomooloo 13,511 13,518 7 0.1%
Oxford Street 11,997 12,054 57 0.5%
Redfern Street 18,055 18,099 44 0.2%
City of Sydney local area 130,988 133,676 2,688 2.1%
Net increase includes the addition of completed dwellings and the subtraction of demolished or replacement dwellings. The net dwelling stock has increased in nine of the 10 village areas in the past year, with the highest proportional growth in Green Square and City South, where the net increase in total dwellings was 6.0%. The highest net growth was in Green Square and City South, with an additional 1,205 dwellings added. The dwelling target for the Community Strategic Plan is for the city to have at least 138,000 (private) dwellings by 2030. This does not include non-private dwellings (boarding house accommodation, student accommodation or residential care services). The baseline figure (June 2007) was 89,749 private dwellings, or 65.0% of the dwelling target for 2030. By June 2020 there were 119,019 private dwellings in the City of Sydney local area, or 86.2% of the dwelling target for 2030. There was a net increase of 2,475 private dwellings between June 2019 and June 2020. To reach the desired target by 2030, an additional 1,898 dwellings need to be completed annually. By June 2020, 60.7% of target dwellings had been added, after 56.5% of the timeframe (13 of 23 years). The highest number of private dwellings was located in the Green Square and City South village (21,344). 48.7% of the net private dwelling increase for 2019/20 occurred in the Green Square and City South village. Redfern Street village had the highest number of non-private dwellings (4,087). Non-private dwellings in the local area increased by 1.5% between June 2019 and June 2020, up to 14,657.

Housing Audit
8
Building structure Approximately 97.7% of the building stock (21,950 buildings) in the City of Sydney local area falls into four main types:
– terrace, town house and semi-detached buildings (78.1%)
– multi-storey apartment buildings (9.7%)
– separate (detached) houses (6.5%), and
– buildings with dwellings above shops (3.5%).
The other 2.3% of building stock comprises a mix of buildings containing residential care services, boarding house accommodation, student accommodation, or other dwelling types.
Dwelling structure Of the 119,019 private dwellings in the City of Sydney local area at June 2020, 19,909 dwellings were terrace houses, comprising 16.7% of all private dwellings. A further 95,935 dwellings were in multi-storey apartment buildings, comprising 80.6% of all private dwellings. 97.7% of the net annual growth in private dwellings was in multi-storey apartment building flats (2,418 of 2,475 dwellings).
There were also 1,482 separate (detached) dwellings and 1,369 dwellings located above shops in the City of Sydney local area. These comprised 1.3% and 1.2% of total private dwellings respectively.
The other 324 private dwellings include caretaker’s and manager’s flats, converted flats or other dwellings.
Additionally, there were 14,657 non-private dwellings in the City of Sydney local area, including 3,350 boarding house rooms (22.8% of non-private dwellings), 10,688 student accommodation rooms (72.8% of non-private dwellings), and 639 other dwellings (4.4% of non-private dwellings). In 2019/20, an additional 131 student accommodation rooms and 40 boarding house rooms were added to the city’s non-private dwelling stock.
During the 2019/20 financial year, there was a net increase of 2,688 (2.1%) total dwellings across the local area. The net dwelling stock increased by 2,475 private dwellings (2.1%) and 213 non-private dwellings (1.5%).
The major locations of net dwelling increases were the Green Square and City South village with 1,205 private dwellings (6.0% increase), and Glebe Point Road village with 424 private dwellings (3.5% increase).

Housing Audit
9
Dwelling tenure The Housing Data Collection Framework classifies each individual residential unit or residential accommodation room by its tenure type or use. The main purpose of this section is to monitor the amount of social (including public) housing, affordable rental housing, boarding house accommodation and student accommodation in the City of Sydney.
As of June 2020, there were:
– 9,630 social (including public) housing dwellings
– 1,028 affordable rental housing dwellings
– 3,350 boarding house rooms, and
– 10,668 student accommodation rooms.
The baseline figures (June 2007) were
– 9,397 social (including public) housing dwellings
– 447 affordable rental housing dwellings, and
– 2,814 student accommodation rooms.
It is estimated that the number of boarding house rooms in 2007 was approximately 1,900.
During the 2019/20 financial year, there was no net increase in the total number of social (including public) housing dwellings.
At June 2020 social (including public) housing dwellings comprised 8.1% of private dwellings in the city.
There was an increase of 174 affordable rental housing dwellings in the City of Sydney local area in 2019/20 due to completion of two developments in Glebe Point Road village.
At June 2020 affordable rental housing dwellings comprised 0.9% of private dwellings in the city.

Housing Audit
10
Location of net dwelling change, year to June 2020 The figure below shows the distribution of net dwelling change between June 2019 and June 2020. Significant growth areas included the eastern edge of Glebe Point Road village and the north and eastern areas of Green Square and City South village.
Figure 1. Distribution of net dwelling change between June 2019 and June 2020
Housing Audit
11
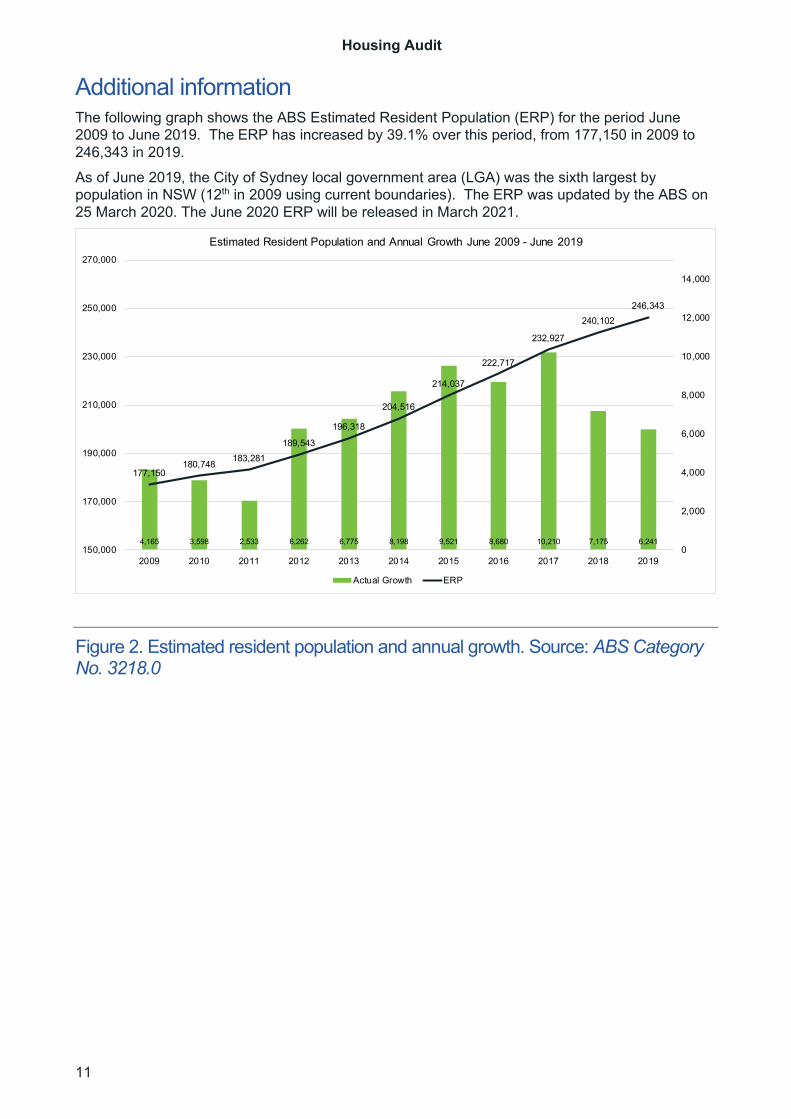
Additional information The following graph shows the ABS Estimated Resident Population (ERP) for the period June 2009 to June 2019. The ERP has increased by 39.1% over this period, from 177,150 in 2009 to 246,343 in 2019.
As of June 2019, the City of Sydney local government area (LGA) was the sixth largest by population in NSW (12th in 2009 using current boundaries). The ERP was updated by the ABS on 25 March 2020. The June 2020 ERP will be released in March 2021.
Figure 2. Estimated resident population and annual growth. Source: ABS Category No. 3218.0
4,165 3,598 2,533 6,262 6,775 8,198 9,521 8,680 10,210 7,175 6,241
177,150180,748 183,281
189,543
196,318
204,516
214,037
222,717
232,927
240,102246,343
0
2,000
4,000
6,000
8,000
10,000
12,000
14,000
150,000
170,000
190,000
210,000
230,000
250,000
270,000
2009 2010 2011 2012 2013 2014 2015 2016 2017 2018 2019
Estimated Resident Population and Annual Growth June 2009 - June 2019
Actual Growth ERP

Housing Audit
12
The following graph shows the median sale price (in $,000s) of strata and non-strata properties for the financial years between 2009 and 2019. Over this period, the median sale prices of strata properties (predominantly units) increased by 83.8%. Non-strata properties (predominantly terrace houses or separate dwellings) increased by 99.3%.
Figure 3. Median sale price, City of Sydney. Source: NSW Department of Communities and Justice, Rent and Sales Report (Issues 86-129) The following graph shows the median rental price for new rental bonds of (two-bedroom) units and townhouses for the financial years between 2009 and 2019. Over this period, the median rental price of (two-bedroom) units increased by 34.8%. Rental prices for (two-bedroom) townhouses increased by 51.0%.
Figure 4. Median weekly rent, City of Sydney. Source: NSW Department of Communities and Justice, Rent and Sales Report (Issues 85-128)
$475$575 $585 $599 $653
$727 $755$828
$889 $899 $861$710
$866 $883 $890$960
$1,190$1,285
$1,519
$1,673 $1,646
$1,453
$0
$200
$400
$600
$800
$1,000
$1,200
$1,400
$1,600
$1,800
Jun-09 Jun-10 Jun-11 Jun-12 Jun-13 Jun-14 Jun-15 Jun-16 Jun-17 Jun-18 Jun-19
Median Sales - City of Sydney Annual FY, 2008/09 - 2018/19
Strata Non-strata
$571 $590$638
$673 $689 $703 $716 $745 $771 $768 $770
$495$536
$575 $598$635 $659 $688 $708 $715 $735 $748
$0
$100
$200
$300
$400
$500
$600
$700
$800
$900
Jun-09 Jun-10 Jun-11 Jun-12 Jun-13 Jun-14 Jun-15 Jun-16 Jun-17 Jun-18 Jun-19
Median Weekly Rent - City of Sydney Annual FY, 2008/09 - 2018/19
Units Townhouses
Housing Audit
13
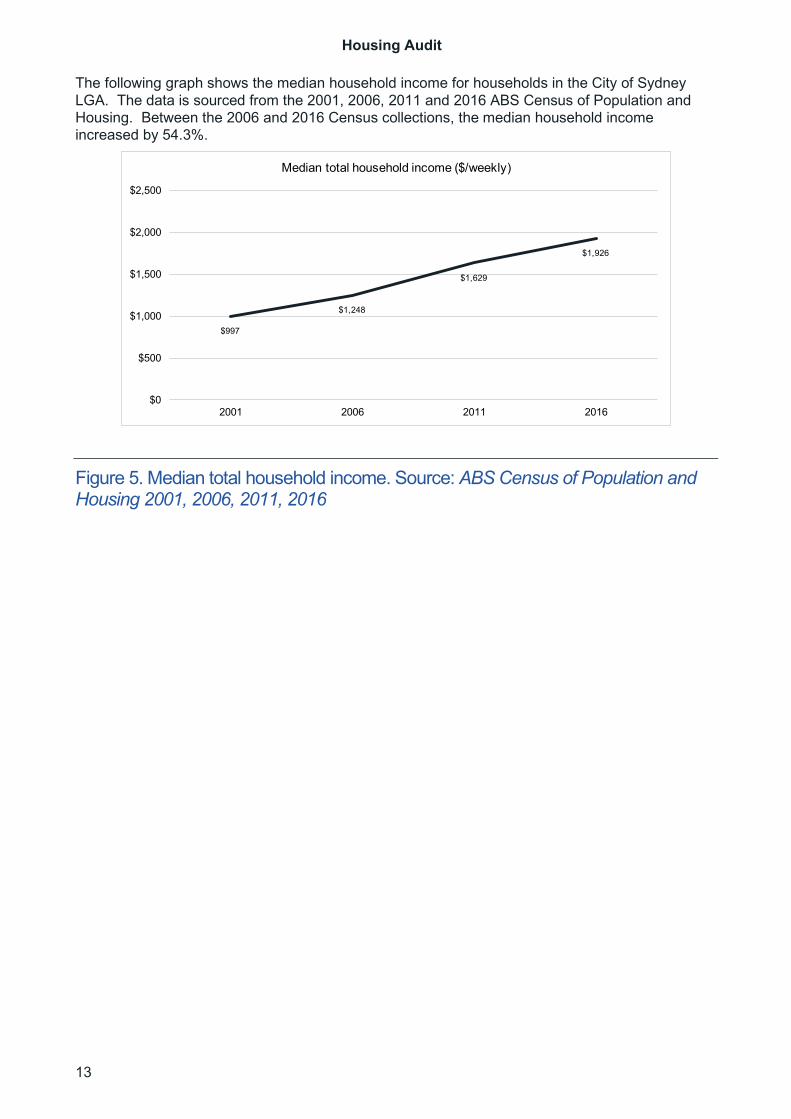
The following graph shows the median household income for households in the City of Sydney LGA. The data is sourced from the 2001, 2006, 2011 and 2016 ABS Census of Population and Housing. Between the 2006 and 2016 Census collections, the median household income increased by 54.3%.
Figure 5. Median total household income. Source: ABS Census of Population and Housing 2001, 2006, 2011, 2016
$997
$1,248
$1,629
$1,926
$0
$500
$1,000
$1,500
$2,000
$2,500
2001 2006 2011 2016
Median total household income ($/weekly)

Housing Audit
14
Further information Additional information relating to residential activity in the City of Sydney local area can be found in the Residential Monitor at:
https://www.cityofsydney.nsw.gov.au/surveys-case-studies-reports/city-monitor-reports
Information relating to City of Sydney local area residents from the 2016 Census and forecasts of future residential growth can be found at the following link:
https://www.cityofsydney.nsw.gov.au/council-governance-administration/community-profile
Last updated: 4 November 2020

Housing Audit
15
f
Disclaimer
Any data, representation, statement, opinion or advice expressed or implied in this publication is made in good faith but on a basis that the City of Sydney, its agents and employees are not liable (whether by reason of negligence, lack of care or otherwise) to any person for any damage or loss whatsoever which has occurred or may occur in relation to that person taking or not taking (as the case may be) action in respect of data representation, statement or advice referred to above. The City of Sydney reserves the right to revise previously published entries or totals without notice.
All rights reserved. No part of this work will be reproduced, translated, modified, transmitted or stored in any form or by any means without the prior permission of the City of Sydney.
Enquiries regarding this document should be made to:
Steven Hillier, Manager Urban Analytics
p. 02 9265 9333
Town Hall House – 456 Kent Street or GPO Box 1591, Sydney NSW 2000
Council document reference: 2020/xxxxxx-01


