35
Discussion Paper Housing for Minnesota’s Aging Population Research and Evaluation Unit Jennifer Schuller Graduate Student University of Minnesota, Humphrey Institute of Public Affairs
Discussion Paper
Housing for Minnesota’s Aging Population
Research and Evaluation Unit
Jennifer SchullerGraduate StudentUniversity of Minnesota, Humphrey Institute of Public Affairs
ii
Housing for Minnesota’s Aging Population: Discussion Paper
Author
Jennifer Schuller Candidate, Master of Urban and Regional Planning University of Minnesota, Humphrey Institute of Public Affairs
Date
August 2010
Acknowledgements
The following individuals provided feedback and perspective to guide development of this report. Thank you!
Andrew Schlack, Greater Minnesota Housing Fund
Annette Sandler, Jewish Family and Children’s Service of Minneapolis
Ben Winchester, University of Minnesota Extension Services, Center for Small Towns
Diane Sprague, Lifetime Homes
Gail Gilman Waldner, Minnesota River Area Agency on Aging
John Patterson, Minnesota Housing Finance Agency
LaRhae Knatterud and Peter Spuit, Minnesota Department of Human Services
Marilyn Bruin, University of Minnesota Housing Studies Program
Tom DeCrans, Karen Thompson, and Terry Louwagie, USDA Rural Development, Minnesota Office
Tom Gillaspy, Minnesota State Demographer’s Office
iii
Housing for Minnesota’s Aging Population
Discussion Paper
Table of Contents
Introduction & Summary ............................................................................................................................................... 1
I. Minnesota’s Aging Population .................................................................................................................................... 2
II. Seniors’ and Boomers’ Homes ................................................................................................................................... 8
Housing types: ................................................................................................................................................... 8
Satisfaction with housing ................................................................................................................................... 9
Moving and future housing preferences ......................................................................................................... 10
III. Meeting Seniors’ Housing Needs ............................................................................................................................ 13
Housing and disablement ................................................................................................................................ 13
Housing design for healthy living and healthy aging ....................................................................................... 14
Senior and boomer preferences in housing design ......................................................................................... 16
Comparing modifications with other housing and care options ..................................................................... 17
IV. Applications to the Minnesota Market .................................................................................................................. 20
Special considerations for the low- to moderate- income housing market .................................................... 20
Conclusions .................................................................................................................................................................. 22
References ................................................................................................................................................................... 23
Appendices .................................................................................................................................................................. 25
Appendix A: County Indicators ................................................................................................................................ 26
Appendix B: Select Universal Design Elements for All Housing ............................................................................... 30

iv
Housing for Minnesota’s Aging Population – Discussion Paper September 2010
1
Introduction & Summary
Baby boomer retirement over the next twenty years will usher in a major demographic shift in
Minnesota, with adults at least age 65 increasing from 12% to 20% of the state’s population.
Boomers have dominated the housing market throughout their adult lives, and will likely
continue to do so as they begin to retire this year.
Traditional forms of senior housing, however, do not match the preferences of most baby
boomers and younger seniors. Older adults primarily own single-family homes and desire to
remain there as they age. Nevertheless, health and activity limitations generally increase with
age, and the current housing stock is not equipped to enable an aging population to remain in
their homes and communities. Very few single-family homes units are built to be accessible, but
an estimated 60% of these units will house at least one person with a disability over the unit’s
lifetime. Over 300,000 older Minnesotans now report a need for housing repair or modification
to remain in their homes.
At the same time, the State is seeking community-based alternatives to senior housing and care
in an effort to control burgeoning long-term care costs. This juncture presents an opportunity
for the Minnesota Housing Finance Agency to support a new paradigm of senior housing, one
which both meets the desires of seniors and boomers to remain in the communities and social
networks they’ve chosen and aids the state creating a more cost-effective housing and care
system for seniors. Core universal design components can underpin an effort to design and
build homes that enable all types of households—seniors, families with children, people with
disabilities—to live with ease in their communities.
Housing for Minnesota’s Aging Population – Discussion Paper September 2010
2
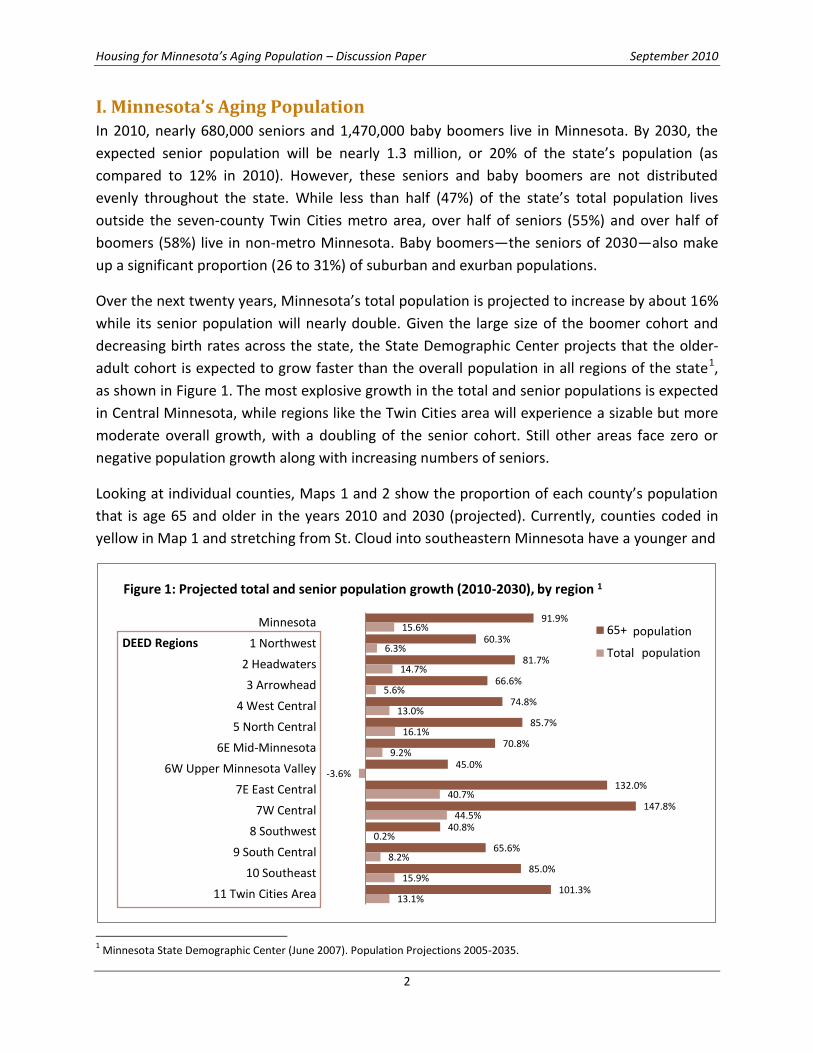
I. Minnesota’s Aging Population In 2010, nearly 680,000 seniors and 1,470,000 baby boomers live in Minnesota. By 2030, the
expected senior population will be nearly 1.3 million, or 20% of the state’s population (as
compared to 12% in 2010). However, these seniors and baby boomers are not distributed
evenly throughout the state. While less than half (47%) of the state’s total population lives
outside the seven-county Twin Cities metro area, over half of seniors (55%) and over half of
boomers (58%) live in non-metro Minnesota. Baby boomers—the seniors of 2030—also make
up a significant proportion (26 to 31%) of suburban and exurban populations.
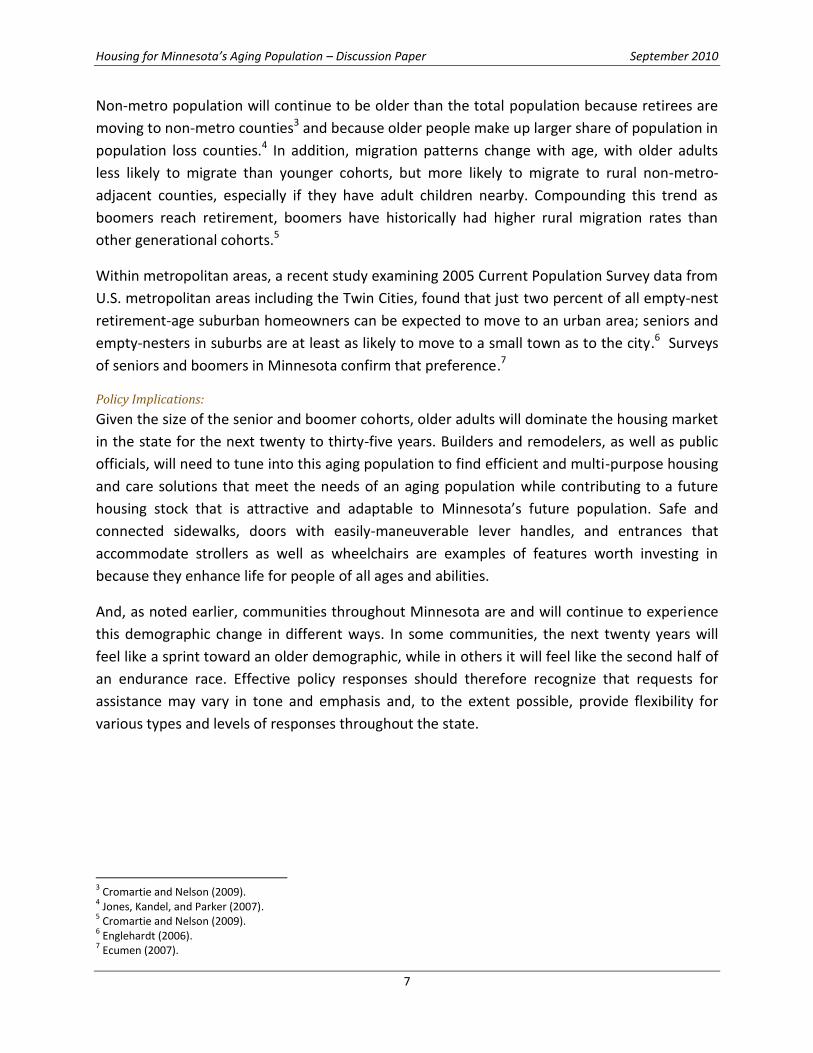
Over the next twenty years, Minnesota’s total population is projected to increase by about 16%
while its senior population will nearly double. Given the large size of the boomer cohort and
decreasing birth rates across the state, the State Demographic Center projects that the older-
adult cohort is expected to grow faster than the overall population in all regions of the state1,
as shown in Figure 1. The most explosive growth in the total and senior populations is expected
in Central Minnesota, while regions like the Twin Cities area will experience a sizable but more
moderate overall growth, with a doubling of the senior cohort. Still other areas face zero or
negative population growth along with increasing numbers of seniors.
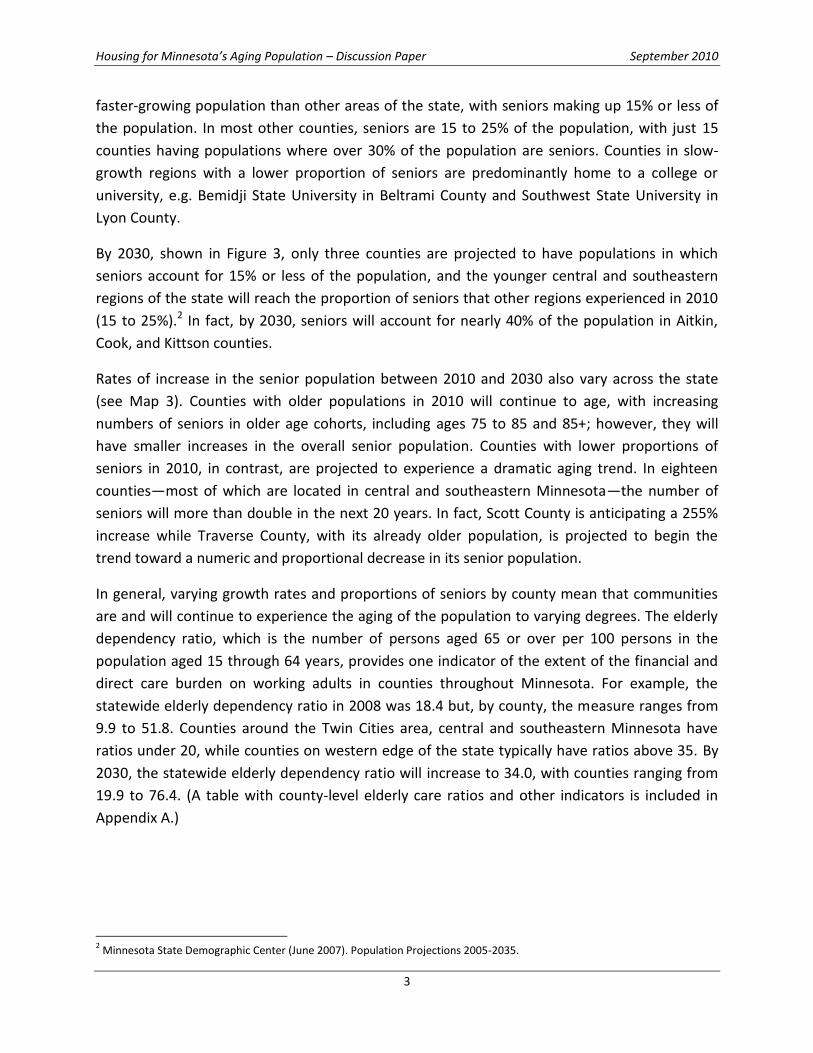
Looking at individual counties, Maps 1 and 2 show the proportion of each county’s population
that is age 65 and older in the years 2010 and 2030 (projected). Currently, counties coded in
yellow in Map 1 and stretching from St. Cloud into southeastern Minnesota have a younger and
1 Minnesota State Demographic Center (June 2007). Population Projections 2005-2035.
91.9%
60.3%
81.7%
66.6%
74.8%
85.7%
70.8%
45.0%
132.0%
147.8%
40.8%
65.6%
85.0%
101.3%
15.6%
6.3%
14.7%
5.6%
13.0%
16.1%
9.2%
-3.6%
40.7%
44.5%
0.2%
8.2%
15.9%
13.1%
Minnesota
1 Northwest
2 Headwaters
3 Arrowhead
4 West Central
5 North Central
6E Mid-Minnesota
6W Upper Minnesota Valley
7E East Central
7W Central
8 Southwest
9 South Central
10 Southeast
11 Twin Cities Area
Figure 1: Projected total and senior population growth (2010-2030), by region 1
65+
Total
population
populationDEED Regions
Housing for Minnesota’s Aging Population – Discussion Paper September 2010
3
faster-growing population than other areas of the state, with seniors making up 15% or less of
the population. In most other counties, seniors are 15 to 25% of the population, with just 15
counties having populations where over 30% of the population are seniors. Counties in slow-
growth regions with a lower proportion of seniors are predominantly home to a college or
university, e.g. Bemidji State University in Beltrami County and Southwest State University in
Lyon County.
By 2030, shown in Figure 3, only three counties are projected to have populations in which
seniors account for 15% or less of the population, and the younger central and southeastern
regions of the state will reach the proportion of seniors that other regions experienced in 2010
(15 to 25%).2 In fact, by 2030, seniors will account for nearly 40% of the population in Aitkin,
Cook, and Kittson counties.
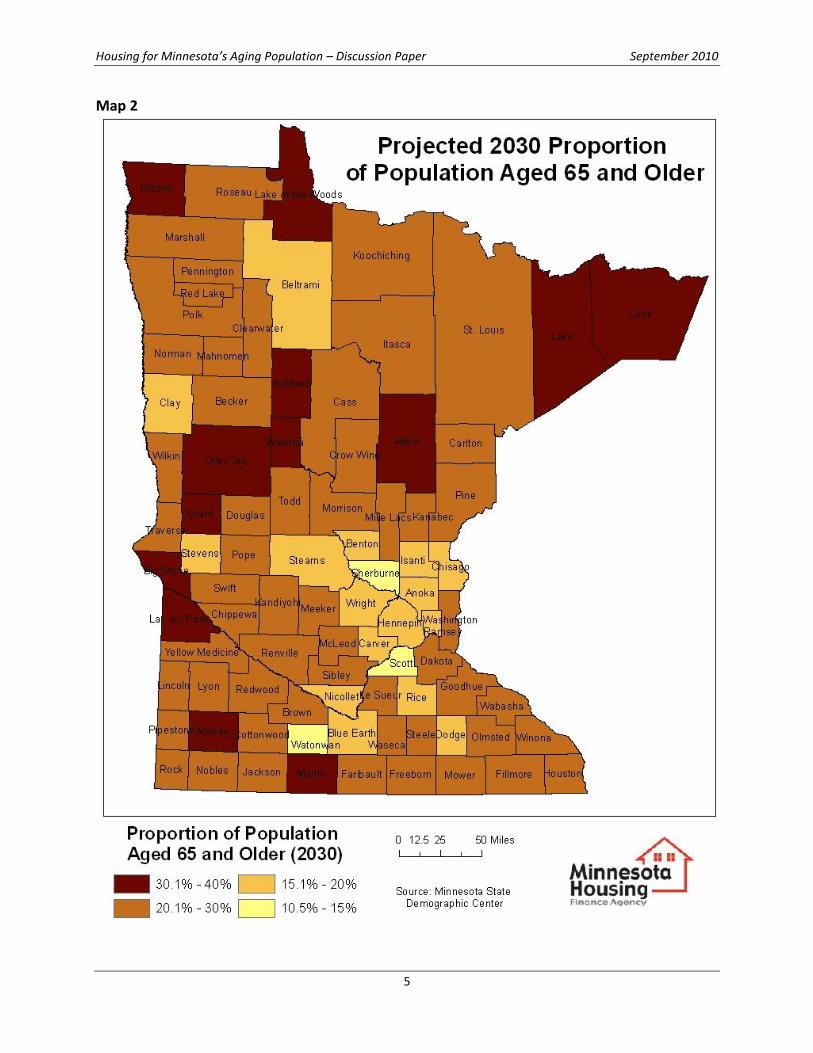
Rates of increase in the senior population between 2010 and 2030 also vary across the state
(see Map 3). Counties with older populations in 2010 will continue to age, with increasing
numbers of seniors in older age cohorts, including ages 75 to 85 and 85+; however, they will
have smaller increases in the overall senior population. Counties with lower proportions of
seniors in 2010, in contrast, are projected to experience a dramatic aging trend. In eighteen
counties—most of which are located in central and southeastern Minnesota—the number of
seniors will more than double in the next 20 years. In fact, Scott County is anticipating a 255%
increase while Traverse County, with its already older population, is projected to begin the
trend toward a numeric and proportional decrease in its senior population.
In general, varying growth rates and proportions of seniors by county mean that communities
are and will continue to experience the aging of the population to varying degrees. The elderly
dependency ratio, which is the number of persons aged 65 or over per 100 persons in the
population aged 15 through 64 years, provides one indicator of the extent of the financial and
direct care burden on working adults in counties throughout Minnesota. For example, the
statewide elderly dependency ratio in 2008 was 18.4 but, by county, the measure ranges from
9.9 to 51.8. Counties around the Twin Cities area, central and southeastern Minnesota have
ratios under 20, while counties on western edge of the state typically have ratios above 35. By
2030, the statewide elderly dependency ratio will increase to 34.0, with counties ranging from
19.9 to 76.4. (A table with county-level elderly care ratios and other indicators is included in
Appendix A.)
2 Minnesota State Demographic Center (June 2007). Population Projections 2005-2035.

Housing for Minnesota’s Aging Population – Discussion Paper September 2010
4
Map 1
Housing for Minnesota’s Aging Population – Discussion Paper September 2010
5
Map 2
Housing for Minnesota’s Aging Population – Discussion Paper September 2010
6
Map 3
Housing for Minnesota’s Aging Population – Discussion Paper September 2010
7
Non-metro population will continue to be older than the total population because retirees are
moving to non-metro counties3 and because older people make up larger share of population in
population loss counties.4 In addition, migration patterns change with age, with older adults
less likely to migrate than younger cohorts, but more likely to migrate to rural non-metro-
adjacent counties, especially if they have adult children nearby. Compounding this trend as
boomers reach retirement, boomers have historically had higher rural migration rates than
other generational cohorts.5
Within metropolitan areas, a recent study examining 2005 Current Population Survey data from
U.S. metropolitan areas including the Twin Cities, found that just two percent of all empty-nest
retirement-age suburban homeowners can be expected to move to an urban area; seniors and
empty-nesters in suburbs are at least as likely to move to a small town as to the city.6 Surveys
of seniors and boomers in Minnesota confirm that preference.7
Policy Implications:
Given the size of the senior and boomer cohorts, older adults will dominate the housing market
in the state for the next twenty to thirty-five years. Builders and remodelers, as well as public
officials, will need to tune into this aging population to find efficient and multi-purpose housing
and care solutions that meet the needs of an aging population while contributing to a future
housing stock that is attractive and adaptable to Minnesota’s future population. Safe and
connected sidewalks, doors with easily-maneuverable lever handles, and entrances that
accommodate strollers as well as wheelchairs are examples of features worth investing in
because they enhance life for people of all ages and abilities.
And, as noted earlier, communities throughout Minnesota are and will continue to experience
this demographic change in different ways. In some communities, the next twenty years will
feel like a sprint toward an older demographic, while in others it will feel like the second half of
an endurance race. Effective policy responses should therefore recognize that requests for
assistance may vary in tone and emphasis and, to the extent possible, provide flexibility for
various types and levels of responses throughout the state.
3 Cromartie and Nelson (2009).
4 Jones, Kandel, and Parker (2007).
5 Cromartie and Nelson (2009).
6 Englehardt (2006).
7 Ecumen (2007).
Housing for Minnesota’s Aging Population – Discussion Paper September 2010
8
II. Seniors’ and Boomers’ Homes Responding to the housing needs of an aging population requires understanding of the
population beyond its numeric dominance throughout the state. To meet projected market
demands in a cost-effective manner, examination of current housing types, levels of
satisfaction, and future housing preferences of today’s seniors and boomers is essential.
Housing types: At any given time, only a small number of older adults live in nursing homes,
assisted living facilities, or other care facilities. In fact, a recent study of the need for long-term
care found that elders 65 years old today will need an average of three years of long-term care
(nursing facility, home care, or informal care).8 In 2009, 27,444 senior Minnesotans were in 281
nursing facilities9; this total constitutes 4% of all seniors in the state. Assisted living provides
housing and care for an estimated 57,261 Minnesota seniors (8%).
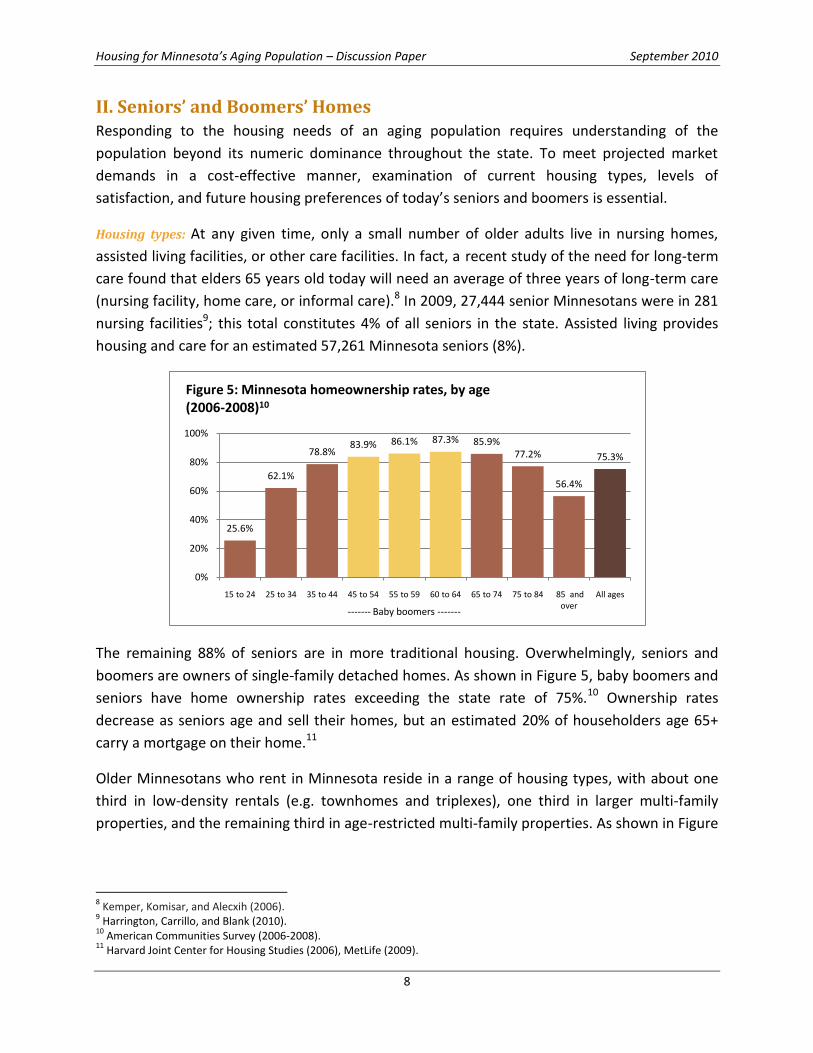
The remaining 88% of seniors are in more traditional housing. Overwhelmingly, seniors and
boomers are owners of single-family detached homes. As shown in Figure 5, baby boomers and
seniors have home ownership rates exceeding the state rate of 75%.10 Ownership rates
decrease as seniors age and sell their homes, but an estimated 20% of householders age 65+
carry a mortgage on their home.11
Older Minnesotans who rent in Minnesota reside in a range of housing types, with about one
third in low-density rentals (e.g. townhomes and triplexes), one third in larger multi-family
properties, and the remaining third in age-restricted multi-family properties. As shown in Figure
8 Kemper, Komisar, and Alecxih (2006).
9 Harrington, Carrillo, and Blank (2010). 10
American Communities Survey (2006-2008). 11
Harvard Joint Center for Housing Studies (2006), MetLife (2009).
25.6%
62.1%
78.8%83.9% 86.1% 87.3% 85.9%
77.2%
56.4%
75.3%
0%
20%
40%
60%
80%
100%
15 to 24 25 to 34 35 to 44 45 to 54 55 to 59 60 to 64 65 to 74 75 to 84 85 and over
All ages
Figure 5: Minnesota homeownership rates, by age (2006-2008)10
------- Baby boomers -------

Housing for Minnesota’s Aging Population – Discussion Paper September 2010
9
6, this means that 7% of older Minnesotans reside in age-restricted multi-family rental
properties.12
The age and condition of the housing stock in regions around the state varies significantly. In
southwest and west central counties, and along the Iowa border, the median age of the
housing stock is currently around 50 to 60 years. In counties surrounding Hennepin and Ramsey
counties, and in retirement destination areas around Bemidji and Brainerd, the median age of
housing is only about 15 to 30 years.13 In general, the condition of rural housing has improved
over the past century, but research finds that senior homeowners tend to live in the oldest
homes in the community14 and are less likely to move than older adults in urban areas.15
Satisfaction with housing: Housing type, however, does not appear to have a significant influence
on satisfaction with current housing. Adults 55
and older are generally very satisfied with their
current housing, ranking their satisfaction at an
average of 8.7 out of 10 (10 being highly
satisfied) in 2009.16 In addition, the level of
satisfaction with their housing increases with age,
as shown in Table 1.
Satisfaction with housing is related to housing’s
perceived impacts on wellbeing, access to social
and civic opportunities, and monetary benefits to
12
Minnesota Board on Aging (2005). Survey of Older Minnesotans. Table 59: Live in Senior Housing, Table 60: Housing Tenure. 13
American Community Survey, 2006-2008. 14
Strathers (2009). 15
MN Board on Aging (2005). Survey of Older Minnesotans. Table 63: Planning to Move. 16
MetLife Mature Market Institute and National Association of Home Builders (2009).
78%
8%
7%
7%
Figure 6: Current residence of Minnesotans, age 55+ (2005)12
Single-family home
Multi-family home, including townhomes, condos, duplexes, and triplexes Apartment in multi-family structure
Apartment in age-restricted multi-family structure
Table 1: Senior and boomer satisfaction with
current housing, by age cohort16
Age of
Respondent
Percent of respondents
rating housing satisfaction
at least 8.0 of 10.0
45 to 54 years 75
55 to 64 years 82
65 to 74 years 85
75+ years 86
Housing for Minnesota’s Aging Population – Discussion Paper September 2010
10
residents17. In detailed surveys of seniors in five communities and housing settings across the
United States, residents reported that both renting and ownership had a positive impact on
wellbeing, both provided social and civic opportunities for residents, and both provided
monetary benefits. Elderly Minnesota residents receiving assisted living services in their homes
also overwhelmingly report satisfaction with care received (99%) and that their lives are better
because of the assistance (85%).18
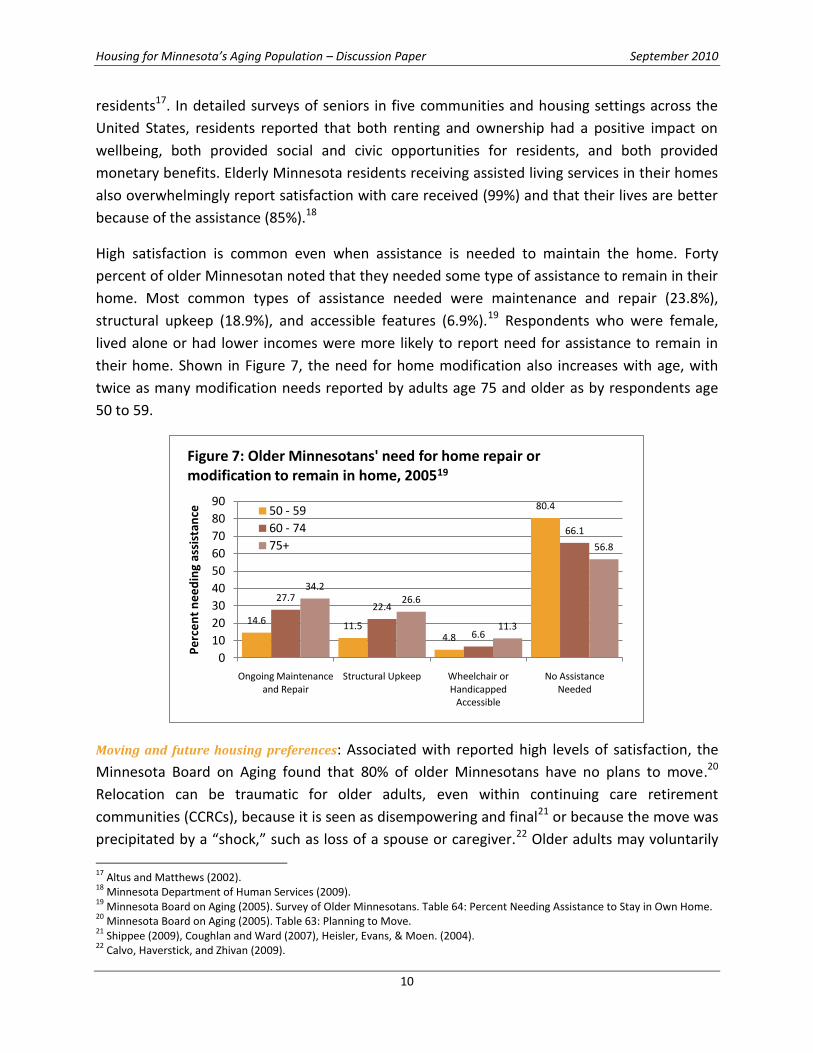
High satisfaction is common even when assistance is needed to maintain the home. Forty
percent of older Minnesotan noted that they needed some type of assistance to remain in their
home. Most common types of assistance needed were maintenance and repair (23.8%),
structural upkeep (18.9%), and accessible features (6.9%).19 Respondents who were female,
lived alone or had lower incomes were more likely to report need for assistance to remain in
their home. Shown in Figure 7, the need for home modification also increases with age, with
twice as many modification needs reported by adults age 75 and older as by respondents age
50 to 59.
Moving and future housing preferences: Associated with reported high levels of satisfaction, the
Minnesota Board on Aging found that 80% of older Minnesotans have no plans to move.20
Relocation can be traumatic for older adults, even within continuing care retirement
communities (CCRCs), because it is seen as disempowering and final21 or because the move was
precipitated by a “shock,” such as loss of a spouse or caregiver.22 Older adults may voluntarily
17
Altus and Matthews (2002). 18
Minnesota Department of Human Services (2009). 19
Minnesota Board on Aging (2005). Survey of Older Minnesotans. Table 64: Percent Needing Assistance to Stay in Own Home. 20
Minnesota Board on Aging (2005). Table 63: Planning to Move. 21
Shippee (2009), Coughlan and Ward (2007), Heisler, Evans, & Moen. (2004). 22
Calvo, Haverstick, and Zhivan (2009).
14.611.5
4.8
80.4
27.722.4
6.6
66.1
34.226.6
11.3
56.8
0
10
20
30
40
50
60
70
80
90
Ongoing Maintenance and Repair
Structural Upkeep Wheelchair or Handicapped
Accessible
No Assistance Needed
Pe
rce
nt
ne
ed
ing
assi
stan
ce
Figure 7: Older Minnesotans' need for home repair or modification to remain in home, 200519
50 - 59
60 - 74
75+
Housing for Minnesota’s Aging Population – Discussion Paper September 2010
11
move to CCRCs to maintain autonomy and increase social integration as they age, but
transitions within CCRCs often reflect administrative decisions and may result in decreased
social integration and satisfaction. Movement from independent living to assisted living or to
nursing care is especially traumatic, as independent living is a symbol of retaining control.
Demonstrating this tendency, 62% of older Minnesotans expressed concern about living in a
nursing home some day.23 Additionally, a senior housing provider study in Minnesota found
that, even if they or their spouse have a debilitating illness, 89% of Minnesota boomers want to
live at home, with just 3% stating a preference for “active adult” communities, 1% for assisted
living, and 0% for nursing homes.24 Nearly two thirds (65%) want a combination of professional
and family care in their own home. (These preference rates for assisted living are lower than
those found in national studies, where boomers reported preference for assisted living at five
to eight percent, and nursing homes at two to three percent.25)
When older adults consider relocating, reasons for moving can be grouped into pull factors and
push factors, with push factors dominating: 26
Pull Factors include proximity to grown children, church, shopping, or health care (24%).
Push Factors include the desire to reduce housing costs, including maintenance (76%).
Studies also reveal a preference for low-density neighborhoods and communities in small
towns and suburban areas. A randomized phone survey of Minnesota baby boomers revealed a
preference for rural locations (52%), followed by suburban neighborhoods (37%) and urban
neighborhoods (10%).27
When older adults’ examine a range of housing-care combinations, assisted living is favored by
the oldest households (especially those with the oldest person over 85) and when there are no
adult children nearby; however, this preference is unaffected by the presence of difficulties
with activities of daily living.28 Shared housing, or the “Golden Girls”/roommate model, is
favored by households with difficulties with activities of daily living and households with non-
resident children. Supported housing, or in-home care, is favored as a second choice by
households having difficulties with activities of daily living.
Policy Implications:
Most baby boomers clearly want to stay in their current homes (typically single-family) and
communities. If services are needed, they want them provided by family, friends and
23
Minnesota Board on Aging. 2005 Survey of Older Minnesotans. Table 77: Concerned about ending up in a nursing home. 24
Ecumen (2007). 25
Kane, Chan, and Kane (2007). 26
Bailey and Gilmore (2004), Kane, Chan, and Kane (2007). 27
Ecumen (2007). 28
Shafer (1999).
Housing for Minnesota’s Aging Population – Discussion Paper September 2010
12
professionals in their homes. Consequently, meeting the market demand for the senior housing
of the future requires solutions that address single-family homes; concentrated senior housing,
especially in larger multi-unit properties, is likely a limited part of the solution.
Additionally, helping seniors maintain their independence requires coordinated housing and
support services. The wellbeing that seniors feel in their homes is often directly connected to
their ability to remain as independent as possible. When the solution demands some ongoing
services, a plan for those services should be in place in conjunction with any home modification
activities. In addition, identifying and prioritizing naturally occurring retirement communities
(Census tracts or places where 25% of the population is seniors) may help to build in efficiencies
in service delivery.
Housing for Minnesota’s Aging Population – Discussion Paper September 2010
13
III. Meeting Seniors’ Housing Needs As people age, they are more likely to experience health or mobility limitations.29 At the same
time, the current senior and boomer population predominantly own and plan to remain in
homes that are not designed for people with disabilities. This incongruence points to an
unprecedented need for home modifications and forward-thinking design in new homes.
Housing and disablement: Environmental factors like home and neighborhood design set the
threshold for when limitations become a disability and, correspondingly, when assistance is
required.30 For example, someone who has difficulty getting in/out of bathtub may be
considered disabled; however, the same person may not be considered disabled if a grab bar
enabled the individual to perform the task without other assistance. As reported in the
Medicare Beneficiary Survey (2007) and shown in Figure 7, over nine percent of adults age 65+
have difficulty bathing or showering,31 both activities with which grab bars could be beneficial.
Twenty-two percent have difficulty walking and could benefit from zero-step entrances and
main-floor baths and laundries.
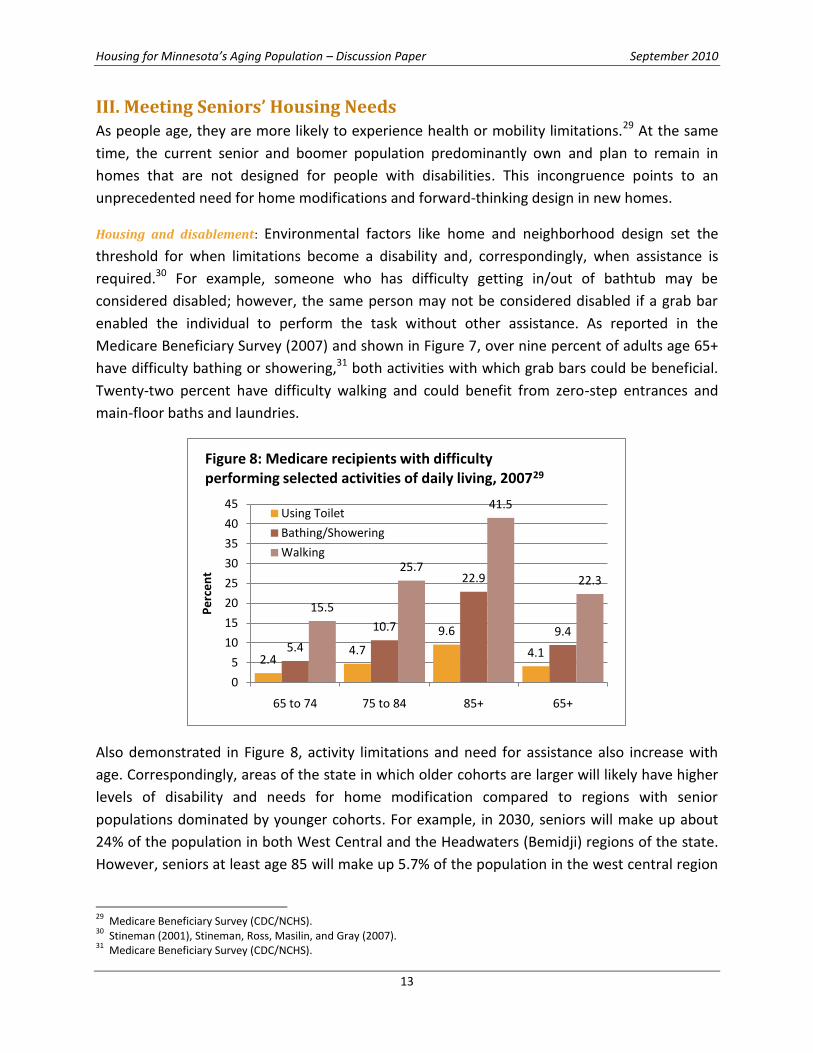
Also demonstrated in Figure 8, activity limitations and need for assistance also increase with
age. Correspondingly, areas of the state in which older cohorts are larger will likely have higher
levels of disability and needs for home modification compared to regions with senior
populations dominated by younger cohorts. For example, in 2030, seniors will make up about
24% of the population in both West Central and the Headwaters (Bemidji) regions of the state.
However, seniors at least age 85 will make up 5.7% of the population in the west central region
29
Medicare Beneficiary Survey (CDC/NCHS). 30
Stineman (2001), Stineman, Ross, Masilin, and Gray (2007). 31
Medicare Beneficiary Survey (CDC/NCHS).
2.44.7
9.6
4.15.4
10.7
22.9
9.4
15.5
25.7
41.5
22.3
0
5
10
15
20
25
30
35
40
45
65 to 74 75 to 84 85+ 65+
Pe
rce
nt
Figure 8: Medicare recipients with difficulty performing selected activities of daily living, 200729
Using Toilet
Bathing/Showering
Walking
Housing for Minnesota’s Aging Population – Discussion Paper September 2010
14
and only 2.8% around Bemidji, indicating that modification needs per senior may be higher in
west central Minnesota.
Beyond individual disability rates, however, housing researchers have recently turned to using
household disability rates instead of individual disability rates due to their better fit with
housing units. Household disability rates, or the percentage of households with at least one
person with a disability, are approximately twice that of individual rates and increase as the
household ages. Using medium assumptions regarding rates of disability and the number of
different households that could reside in a single-family home during its lifetime, there is a 60%
probability that, during its expected lifetime, a newly-built single family house will house at
least one resident with a physical limitation disability, and a 27% probability of housing at least
one resident with a self-care limitation, such as using the toilet.32 When disabled visitors are
accounted for, probabilities rise to 91% and 53%, respectively. Consequently, the current stock
of housing will not meet the needs of the aging baby boomers without some intervention.
Housing design for healthy living and healthy aging: Affordable housing with good initial design or
home modifications can significantly increase the length of time residents can live safely and
independently in their homes. Design modifications can potentially prevent a disability from
occurring, stop or slow the process of disablement, or possibly even reverse the disablement
process. In a controlled study of accessibility modifications in the homes of older adults with
mobility limitations,33 older adults with baseline modifications such as railings and bathroom
modifications were less likely than their counterparts without modifications to experience
subsequent decline in functional ability two years later. (However, there may be a health or
disability threshold after which modifications reap a limited benefit.)
Factors strongly associated with having residential modifications are health conditions, older
age, and living alone. Other factors involved in the decision to have home modifications include
residents’ and family members’ level of awareness, affordability, and beliefs of beneficiality of
modifications.34 These factors concerning home-modification decisions hint at some of the
barriers to having one’s home modified. Lack of resources or information for home
modification, lack of expertise/training for professionals, inertia on part of
homeowners/homebuyers were reported in a national study.35 Also prominent is homeowners’
desire to maintain “normal” or “non-disabled” perception. New homebuyers also demonstrate
reluctance to incorporate accessibility features (or accessible-ready features); most homes are
32
Smith, Rayer, and Smith (2008). 33
Liu and Lapane (2009). 34
Kutty (1999), Pynoos (1993). 35
Stafford and Harlan-Simmons (2003).
Housing for Minnesota’s Aging Population – Discussion Paper September 2010
15
purchased by younger adult households, who are unaware or in denial of future needs at
purchase.36
To overcome perception barriers to home modifications, Universal Design may provide a
framework for construction and modification that meets the needs of seniors without placing
emphasis on disabilities or limitations. Rather than being geared solely to older adults and
people with disabilities, universal design features are intended to have general utility and
market appeal. Universal design focuses on design beyond the "average adult user model” of
conventional design, creating models with broader performance capabilities for the population
as a whole, including children, short and very tall adults, those with temporary limitations like
pregnancy or a leg injury, and persons who are frail or have various disabilities.37
Core components of universal design are non-intrusive and non-specific, improving ease of
living for people. These core elements include at least one zero-step entrance, a bath and
bedroom on the main level, and broad blocking in walls around toilet, tub, and shower allowing
for future placement and relocation of grab bars. (The key with grab bars is having the
bathroom framed so that they can be added in the future at minimal cost.) Other examples of
universal design features include multiple countertop heights, wide doorways, lever faucets,
and a curbless shower with handheld adjustable shower head.
While modifications can be expensive, several assessments have found that universal design
feature costs are minimal if incorporated into the construction of new units, but can be
substantial if added to existing homes.38 Although a handrail installation may add only $100 to a
new construction project, major structural renovations to an existing home to accommodate
handrails can cost $50,000 or more. However, even the cost of major modifications should be
evaluated in the context of costs of other housing options, e.g. nursing home care at $64,000 to
$74,000 per year. 39
Along with structural modifications for ease of mobility, telehealth services and televideo
assessments for home modification have also proven effective in providing assistance to more
remote or underserved populations.40 Remote (televideo) assessment of home modification
needs for older adults are slightly less accurate in identification of problems, but were as
effective as in-home inspections in finding agreement on solutions. Remote assessments also
involve significantly less cost for residents in rural and other underserved areas.41
36
Lemmon (2007). 37
Lifetime Homes (no date). 38
Pynoos and Nishita (2003), Duncan (1998), Lansley et al (2004). 39
MetLife Mature Market Institute (2005). 40
Minnesota Department of Health (2008). 41
Sanford and Butterfield (2005)
Housing for Minnesota’s Aging Population – Discussion Paper September 2010
16
Senior and boomer preferences in housing design: Overlapping with some Universal Design
components and directly connecting with seniors and boomers’ desire to increase ease of living
in their own homes, older adult buyers prefer features that enable them to 1) reduce
maintenance, energy costs, or physical strain, and 2) maintain the “family home” role, having
space for guests and family events.
Boomers prefer homes that are:
larger (3-4 bedrooms),
high-tech (broadband internet and security systems), and
low maintenance or energy efficient.42
Respondents connected technology to both social interactions and to current or future home
health care needs.
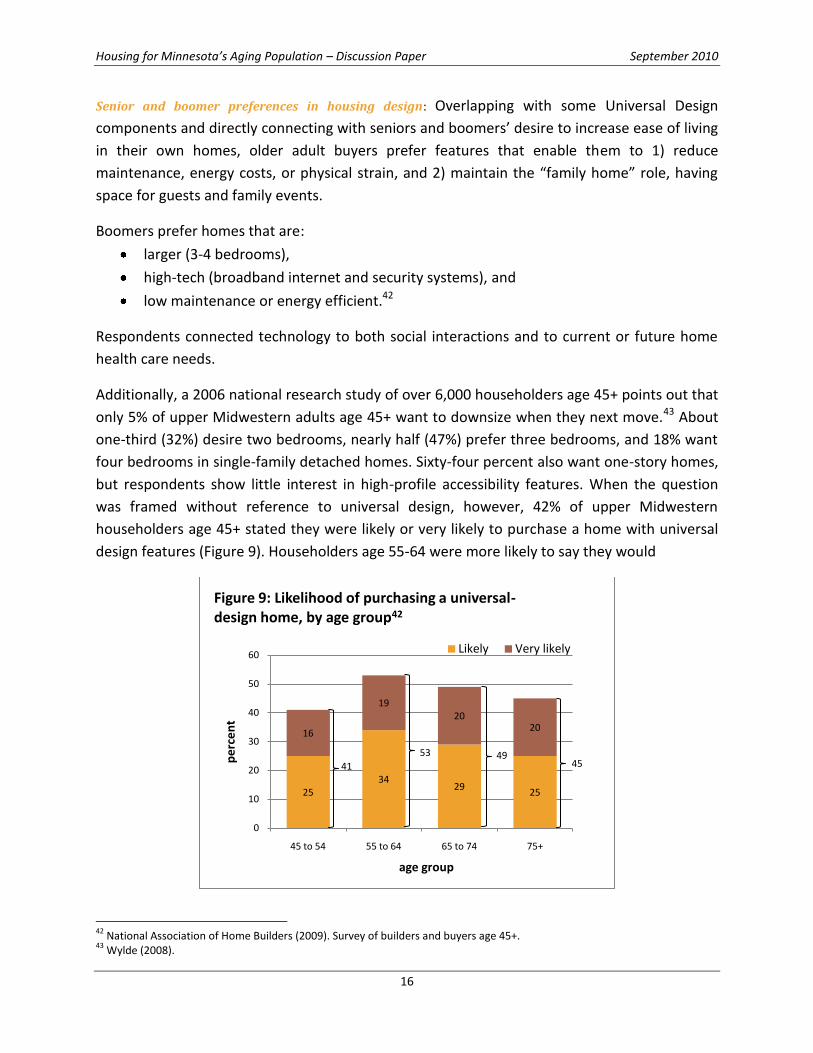
Additionally, a 2006 national research study of over 6,000 householders age 45+ points out that
only 5% of upper Midwestern adults age 45+ want to downsize when they next move.43 About
one-third (32%) desire two bedrooms, nearly half (47%) prefer three bedrooms, and 18% want
four bedrooms in single-family detached homes. Sixty-four percent also want one-story homes,
but respondents show little interest in high-profile accessibility features. When the question
was framed without reference to universal design, however, 42% of upper Midwestern
householders age 45+ stated they were likely or very likely to purchase a home with universal
design features (Figure 9). Householders age 55-64 were more likely to say they would
42
National Association of Home Builders (2009). Survey of builders and buyers age 45+. 43
Wylde (2008).
2534
2925
16
1920
20
0
10
20
30
40
50
60
45 to 54 55 to 64 65 to 74 75+
pe
rce
nt
age group
Figure 9: Likelihood of purchasing a universal-design home, by age group42
Likely Very likely
41
53 4945
Housing for Minnesota’s Aging Population – Discussion Paper September 2010
17
purchase a universally designed home than were householders ages 75+. Declining interest
with age is primarily a result of older households being less likely to purchase a new home than
younger households.
Explaining the lack of interest in overt accessibility features, homebuyers of all ages buy, build,
and remodel homes that demonstrate their independence and ability to provide for
themselves.44 As such, they do not generally choose products or designs that appear
institutional (e.g. rails in hallways) or emphasize need for assistance (e.g. grab bars or roll-in
showers) unless a household member has an immediate need for those products or designs.
Also worth noting: Seniors and boomers are supported by federal law in their desire to receive
care in their homes even as disability levels increase. The 1999 Olmstead Supreme Court
decision45 mandated that services be provided to people in the "most integrated setting" in
keeping with the Americans with Disabilities Act's integration mandate.
Comparing modifications with other housing and care options: As noted previously, home
modifications can be expensive if work cannot be done in conjunction with larger home
renovation projects or if homes are not designed to facilitate accessibility features. However,
compared to more traditional models of housing and care for aging or frail adults, modifications
with appropriate home care can preserve a sense of independence while saving money for
older adults, their families, and the State.
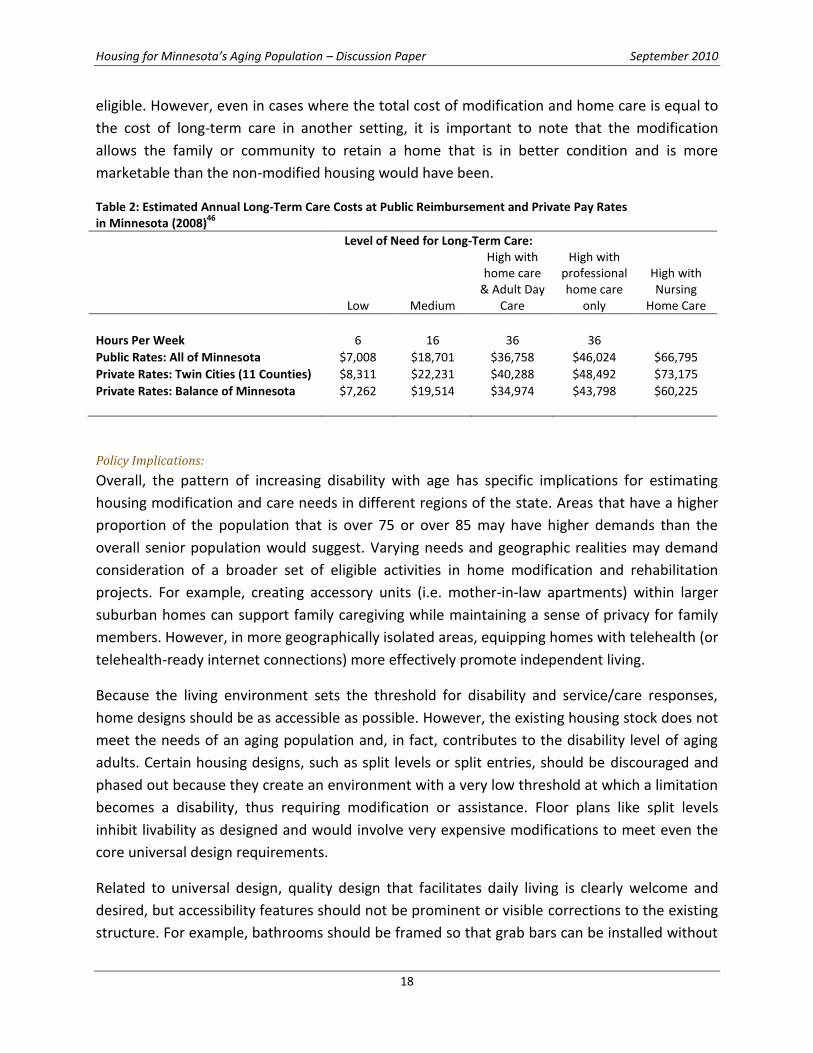
Table 2 compares the estimated annual costs associated with long-term care options in
Minnesota. While individual needs affect the care required, the housing choices for persons
with high needs represent vastly different costs.46 The third column, High with home care and
Adult Day Care, most closely reflects seniors and boomers stated desire for a combination of
professional and family care in their home and community. This option also presents a more
cost effective choice for seniors, with expenses approximately 42 to 45% lower than nursing
home care and 17 to 20% lower than professional home care alone. (Adult day services provide
health, social, and therapeutic activities in a supportive group environment.)
Reliable studies documenting the value of reductions in level or type of care needed as a result
of home modifications are not yet available. However, because the home environment
determines when a limitation becomes a disability, it is reasonable to assume that a successful
home modification could reduce reliance on some high-intensity (and high-cost) services47. This
could create potential savings for the family and/or the state when the individual is Medicaid
44
Golant (2007). 45
Olmstead v. L.C. and E.W. (98-536) 527 U.S. 581 (1999). 46
The Gerontology Institute, University of Massachusetts Boston, and Wider Opportunities for Women (2009), Genworth
(2010). 47
Lansley et al (2004), Tanner, Tilse, and de Jonge (2008).
Housing for Minnesota’s Aging Population – Discussion Paper September 2010
18
eligible. However, even in cases where the total cost of modification and home care is equal to
the cost of long-term care in another setting, it is important to note that the modification
allows the family or community to retain a home that is in better condition and is more
marketable than the non-modified housing would have been.
Table 2: Estimated Annual Long-Term Care Costs at Public Reimbursement and Private Pay Rates in Minnesota (2008)
46
Level of Need for Long-Term Care:
Low Medium
High with home care
& Adult Day Care
High with professional home care
only
High with Nursing
Home Care
Hours Per Week 6 16 36 36 Public Rates: All of Minnesota $7,008 $18,701 $36,758 $46,024 $66,795
Private Rates: Twin Cities (11 Counties) $8,311 $22,231 $40,288 $48,492 $73,175
Private Rates: Balance of Minnesota $7,262 $19,514 $34,974 $43,798 $60,225
Policy Implications:
Overall, the pattern of increasing disability with age has specific implications for estimating
housing modification and care needs in different regions of the state. Areas that have a higher
proportion of the population that is over 75 or over 85 may have higher demands than the
overall senior population would suggest. Varying needs and geographic realities may demand
consideration of a broader set of eligible activities in home modification and rehabilitation
projects. For example, creating accessory units (i.e. mother-in-law apartments) within larger
suburban homes can support family caregiving while maintaining a sense of privacy for family
members. However, in more geographically isolated areas, equipping homes with telehealth (or
telehealth-ready internet connections) more effectively promote independent living.
Because the living environment sets the threshold for disability and service/care responses,
home designs should be as accessible as possible. However, the existing housing stock does not
meet the needs of an aging population and, in fact, contributes to the disability level of aging
adults. Certain housing designs, such as split levels or split entries, should be discouraged and
phased out because they create an environment with a very low threshold at which a limitation
becomes a disability, thus requiring modification or assistance. Floor plans like split levels
inhibit livability as designed and would involve very expensive modifications to meet even the
core universal design requirements.
Related to universal design, quality design that facilitates daily living is clearly welcome and
desired, but accessibility features should not be prominent or visible corrections to the existing
structure. For example, bathrooms should be framed so that grab bars can be installed without
Housing for Minnesota’s Aging Population – Discussion Paper September 2010
19
extensive work or expense; alternate entrances or berms integrated into the landscaping
should be considered in place of prominent ramps. Significant effort may be required to
educate homebuilders and remodelers on flexible design strategies and non-intrusive
alternatives to institutional products, among other topics. Coordination with other home
modification funders and specialists, including DEED and statewide Centers for Independent
Living, could build expertise and control costs across the industry. In addition, connecting
builders to forward-thinking disability specialists or occupational therapists on an ongoing basis
could help to form relationships that facilitate responsible and individualized solutions to
housing and care problems.
Finally, selling universal design may require new language and new angles. Concepts such as
easy living, convenience, enablement, and young family-friendly design may be more
convincing to seniors and new homebuyers who may otherwise feel that they are
compromising their housing desires. For example, the same zero-step entrance that prevents
falls for seniors also prevents falls for toddlers, and more easily accommodates strollers than
traditional step entrances. Open floor plans enable caregivers of children and older adults to
work in the kitchen and maintain a line of sight to the living room.
Housing for Minnesota’s Aging Population – Discussion Paper September 2010
20
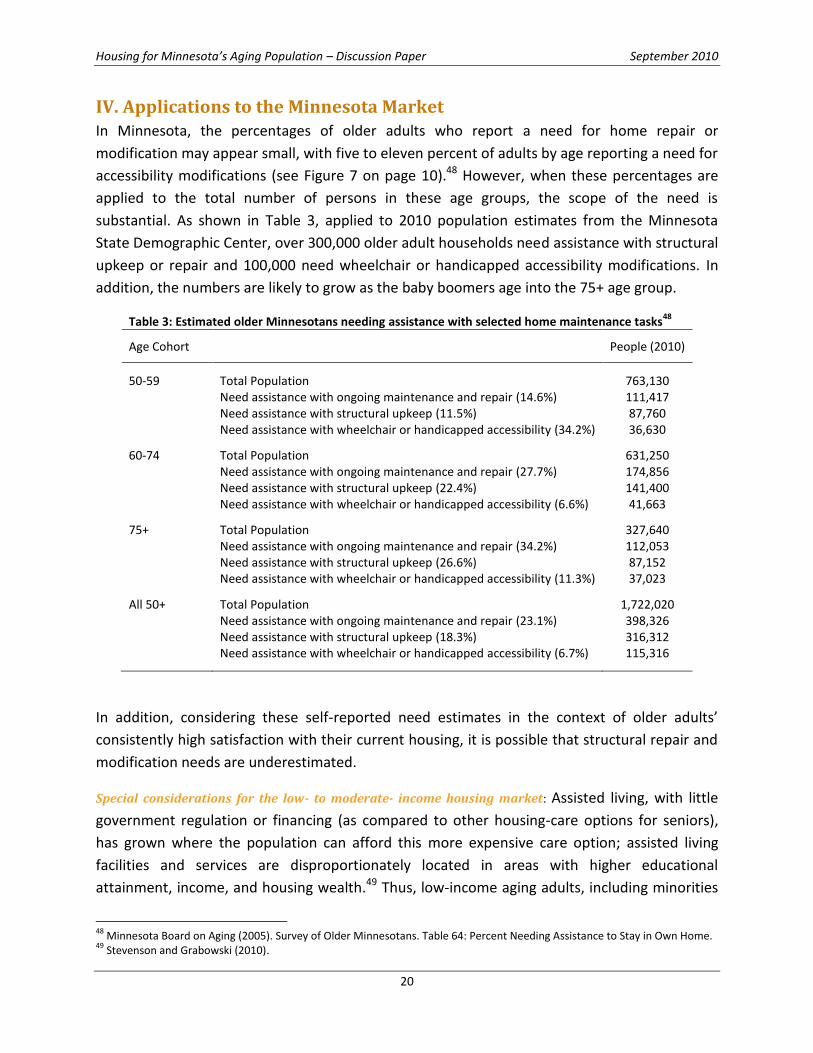
IV. Applications to the Minnesota Market In Minnesota, the percentages of older adults who report a need for home repair or
modification may appear small, with five to eleven percent of adults by age reporting a need for
accessibility modifications (see Figure 7 on page 10).48 However, when these percentages are
applied to the total number of persons in these age groups, the scope of the need is
substantial. As shown in Table 3, applied to 2010 population estimates from the Minnesota
State Demographic Center, over 300,000 older adult households need assistance with structural
upkeep or repair and 100,000 need wheelchair or handicapped accessibility modifications. In
addition, the numbers are likely to grow as the baby boomers age into the 75+ age group.
Table 3: Estimated older Minnesotans needing assistance with selected home maintenance tasks48
Age Cohort
People (2010)
50-59 Total Population 763,130
Need assistance with ongoing maintenance and repair (14.6%) 111,417
Need assistance with structural upkeep (11.5%) 87,760
Need assistance with wheelchair or handicapped accessibility (34.2%) 36,630
60-74 Total Population 631,250
Need assistance with ongoing maintenance and repair (27.7%) 174,856
Need assistance with structural upkeep (22.4%) 141,400
Need assistance with wheelchair or handicapped accessibility (6.6%) 41,663
75+ Total Population 327,640
Need assistance with ongoing maintenance and repair (34.2%) 112,053
Need assistance with structural upkeep (26.6%) 87,152
Need assistance with wheelchair or handicapped accessibility (11.3%) 37,023
All 50+ Total Population 1,722,020
Need assistance with ongoing maintenance and repair (23.1%) 398,326
Need assistance with structural upkeep (18.3%) 316,312
Need assistance with wheelchair or handicapped accessibility (6.7%) 115,316
In addition, considering these self-reported need estimates in the context of older adults’
consistently high satisfaction with their current housing, it is possible that structural repair and
modification needs are underestimated.
Special considerations for the low- to moderate- income housing market: Assisted living, with little
government regulation or financing (as compared to other housing-care options for seniors),
has grown where the population can afford this more expensive care option; assisted living
facilities and services are disproportionately located in areas with higher educational
attainment, income, and housing wealth.49 Thus, low-income aging adults, including minorities
48
Minnesota Board on Aging (2005). Survey of Older Minnesotans. Table 64: Percent Needing Assistance to Stay in Own Home. 49
Stevenson and Grabowski (2010).
Housing for Minnesota’s Aging Population – Discussion Paper September 2010
21
and people in rural areas, have substantially less access to assisted living services due to
financial resources and proximity issues. These adults are more likely to move directly from
their homes to nursing homes (which are heavily funded with public dollars), both because of
the dearth of other housing options and because the individual is likely to be more frail once
they move.
Limited access to housing and care options can contribute to expensive undercare and overcare
in underserved populations.50 For older adults with some care needs, both overcare (e.g.
nursing home care when 24-hour care is not needed) and undercare (e.g. limited or no home
care despite need) result in greater health care costs for individuals and society over their
lifetime. This under- or overcare can be more prevalent in areas underserved by mid-level care
services, including home care.
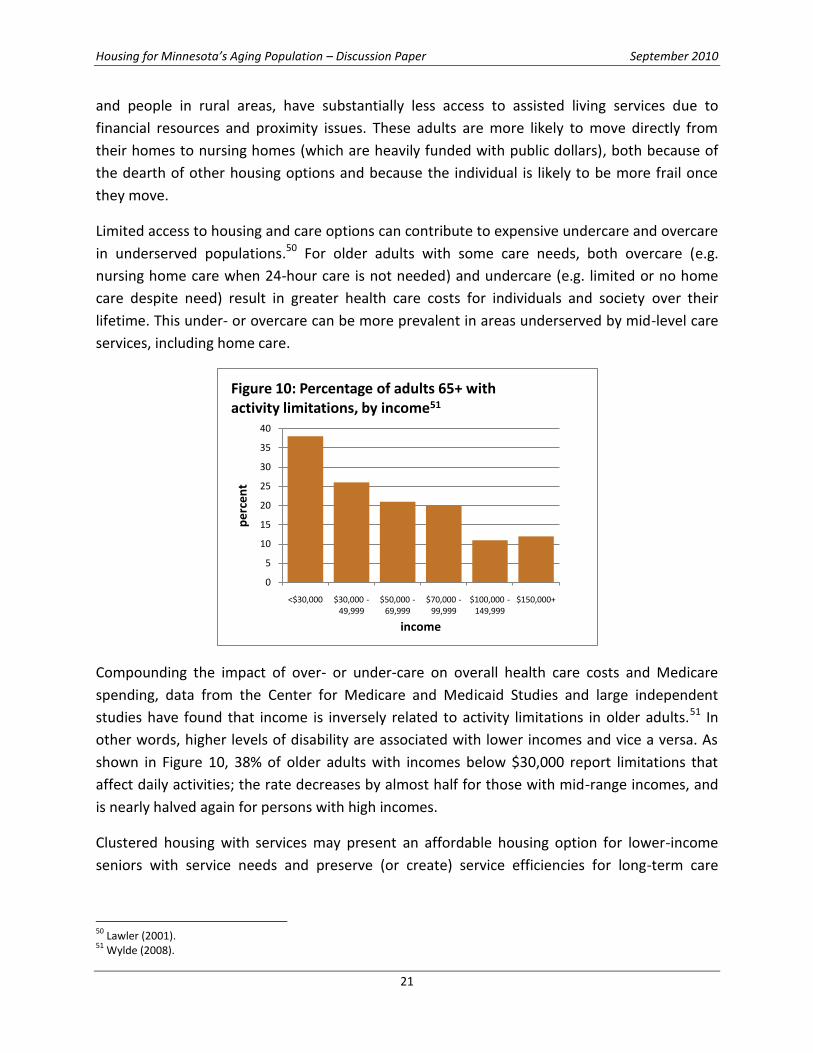
Compounding the impact of over- or under-care on overall health care costs and Medicare
spending, data from the Center for Medicare and Medicaid Studies and large independent
studies have found that income is inversely related to activity limitations in older adults.51 In
other words, higher levels of disability are associated with lower incomes and vice a versa. As
shown in Figure 10, 38% of older adults with incomes below $30,000 report limitations that
affect daily activities; the rate decreases by almost half for those with mid-range incomes, and
is nearly halved again for persons with high incomes.
Clustered housing with services may present an affordable housing option for lower-income
seniors with service needs and preserve (or create) service efficiencies for long-term care
50
Lawler (2001). 51
Wylde (2008).
0
5
10
15
20
25
30
35
40
<$30,000 $30,000 -49,999
$50,000 -69,999
$70,000 -99,999
$100,000 -149,999
$150,000+
pe
rce
nt
income
Figure 10: Percentage of adults 65+ with activity limitations, by income51

Housing for Minnesota’s Aging Population – Discussion Paper September 2010
22
providers.52 However, considering the various impacts of resident income and asset levels on
eligibility for housing subsidy or health services, coordination of housing finance and health
service provision can be extremely difficult.53 A new paradigm of senior housing, with
coordinated services and housing supports in the resident’s home, needs to be investigated.
Policy Implications:
Although multi-family rental units may not be the primary avenue of senior housing in the
future, it may be a key component of Minnesota Housing’s strategy for serving seniors. Because
about half of low-income seniors are renters, new construction and modification projects in
rental units that serve seniors should respond appropriately to the higher levels of disability in
the lower-income population (versus levels in all seniors and the general population). ADA
minimum requirements may not be adequate.
Financing mechanisms should not dissuade older adults from participating in programs
designed for them. Requirements such as extended residency or repayment due in full when
the unit is no longer the primary residence are reasonable in most circumstances, but may
prevent seniors and their families from seeking assistance with necessary modifications. In
addition, home values of lower-income senior homeowners can be minimal, especially in
greater Minnesota; thus, modification financing tied to housing value could be problematic.
Conclusions Minnesota’s aging seniors and baby boomers are bringing to bear new demands on the state’s
housing and services. While the needs are extraordinary and immediate, Minnesota Housing
has the opportunity to contribute to solutions that are both responsive and responsible. Being
responsive to the needs of seniors and the State’s budget goals, Minnesota Housing can work
quickly to coordinate housing initiatives with senior care initiatives, and develop program
guidelines that encompass the range of housing and care solutions that can help seniors remain
safely and affordably housed in their communities throughout the state. Being responsible to
customers and funders, Minnesota Housing can also develop and adapt quality housing that
meets the needs of people of all ages and abilities, creating a backbone of flexible and
affordable housing options for Minnesotans—now and in the years ahead.
52
Golant (2008). 53
Evashwick and Holt (2000), Ormond et al (2004).
Housing for Minnesota’s Aging Population – Discussion Paper September 2010
23
References Altus, D. E. and Mathews, R. M. (2002) “Comparing the Satisfaction of Rural Seniors with Housing Co-Ops and Congregate Apartments.” Journal of Housing for the Elderly, 16: 1, 39 - 50.
Bailey C. and K. Gilmore (2004). “Highlights of a survey of older adults in Ramsey County.” Wilder Research Center. www.wilder.org/research
Calvo, E., K. Haverstick, and N. Zhivan (2009). “Determinants and consequences of moving decisions for older Americans.” WP#2009-16. Chestnut Hill, MA: Center for Retirement Research at Boston College. http://crr.bc.edu/images/stories/Working_Papers/wp_2009-16.pdf.
Coughlan , R., & L. Ward (2007). Experience of recently relocated residents of a long-term care facility in Ontario: Assessing quality qualitatively. International Journal of Nursing Studies , 44 , 47 – 57.
Cromartie, J., and P.Nelson. (August 2009) .Baby Boom Migration and Its Impact on Rural America, ERR-79, U.S. Dept. of Agri., Econ. Res. Serv.
Duncan, R. (1998). Funding, financing and other resources for home modifications. Technology and Disability, 8 (1), 37–50.
Ecumen (2007). “Age Wave” Study. www.ecumen.org/app/webroot/files/file/White%20Papers/Age-Wave-Study.pdf.
Englehardt, G. (2006) “Housing Trends Among Baby Boomers.” Research Institute for Housing America. http://ssrn.com/abstract=1491747.
Evashwick, C., & T. Holt (2000). Integrating long-term care, acute care, and housing: Building success through a continuum of care. St. Louis, MO: The Catholic Health Association of the United States.
The Gerontology Institute, University of Massachusetts Boston, and Wider Opportunities for Women (2009). The Elder Economic Security Standard Index for Minnesota. www.wowonline.org/ourprograms/eesi/state-resources/documents/FinalElderIndexReportforMN.pdf.
Gitlin, L. N., L. Winter, M. Dennis, M. Corcoran, S. Schinfeld, & W. Hauck (2006). A randomized trial of a multicomponent home intervention to reduce functional difficulties in older adults. Journal of the American Geriatrics Society, 54(5), 809–816.
Golant, S. (2007). Supportive Housing for Frail, Low-Income Older Adults: Identifying Need and Allocating Resources. Generations, vol. 29, no. 4, 37-43.
Golant, S. (2008) “Affordable Clustered Housing-Care: A Category of Long-Term Care Options for the Elderly Poor.” Journal of Housing For the Elderly, 22: 1, 3 - 44
Harrington, C., H. Carrillo, and B. Blank. Table 1, "Nursing, Facilities, Staffing, Residents, and Facility Deficiencies, 2001 Through 2009," Department of Social and Behavioral Sciences, University of California, San Francisco. www.pascenter.org. Based on the Online Survey, Certification, and Reporting system (OSCAR), Centers for Medicare and Medicaid Services, U.S. Department of Health and Human Services.
Heisler, E. G. , W. Evans, & P. Moen. (2004). Health and social outcomes of moving to a continuing care retirement community. Journal of Housing for the Elderly , 18 , 5 – 24
Jones, C., W. Kandel, and T. Parker (2007). “Population dynamics are changing the profile of rural areas.” Amber Waves. USDA, Economic Research Service. www.ers.usda.gov/AmberWaves/April07/PDF/Population.pdf.
Kane, R.A., J. Chan, and R. L. Kane (2007). “Assisted Living Literature Through May 2004: Taking Stock.” The Gerontologist. Vol. 47, Special Issue III, 125–140.
Kemper, P., Komisar, H., & Alecxih, L. (2006). Long-term care over an uncertain future: What can current retirees expect? Inquiry, 42, 335-350.
Kutty , N. D. ( 1999 ). Demand for home modifications: A household production function approach . Applied Economics , 31 , 1273 – 1281.
Lansley, P., C. McCreadie, A. Tinker (2004). “Can adapting the homes of older people and providing assistive technology pay its way?” Age and Ageing 2004; 33: 571–576.
Lawler, K. (2001). “Aging in Place Coordinating Housing and Health Care Provision for America’s Growing Elderly Population.” Joint Center for Housing Studies of Harvard University & Neighborhood Reinvestment Corporation.
Lemmon, W. (2007). Reality check from the homebuilder’s sales floor. Planning Commissioners Journal, PlannersWeb. http://pcj.typepad.com/planning_commissioners_jo/2007/04/reality_check_f.html
Lifetime Homes (no date). “Background on Accessible, Adaptable, Universal, and Visitable Design.” www.lifetimehome.us.
Liu and Lapane (2009). “Residential Modifi cations and Decline in Physical Function Among Community-Dwelling Older Adults.” The Gerontologist, Vol. 49, No. 3, 344–354.
Medicare Current Beneficiary Survey (2007). “Difficulty performing activities of daily living among Medicare beneficiaries, ages 65+: US, 1992-2007.” U.S. Centers for Disease Control and the National Center for Health Statistics.
Housing for Minnesota’s Aging Population – Discussion Paper September 2010
24
MetLife Mature Market Institute and the National Association of Home Builders (April 2009). Housing for the 55+ market: trends and insights on boomers and beyond. www.MatureMarketInstitute.com.
MetLife Mature Market Institute and the National Association of Home Builders (September 2009). 55+ Housing: Builders, buyers and beyond. www.MatureMarketInstitute.com.
MetLife Mature Market Institute and the National Association of Home Builders (2009). Housing for the 55+ market: trends and insights on boomers and beyond. www.MatureMarketInstitute.com.
Minnesota Board on Aging (2005). 2005 Survey of Older Minnesotans. Table 59: Live in Senior Housing; Table 60: Housing Tenure; Table 63: Planning to Move; Table 64: Percent Needing Assistance to Stay in Own Home; Table 77: Concerned about ending up in a nursing home.
Minnesota Department of Health, Office of Rural and Primary Care (2008). “Successful Model: Mental/Behavioral Health-Primary Care Integration and Telemedicine.” www.health.state.mn.us/divs/orhpc/models/index.html.Minnesota Department of Human Services (May 2008). Elderly Waiver Statewide Consumer Experience Survey. www.dhs.state.mn.us/main/groups/aging/documents/pub/dhs16_141251.pdf
Minnesota State Demographic Center (June 2007). Population Projections 2005-2035. www.demography.state.mn.us/resource.html?Id=19167.
Olmstead v. L.C. and E.W. (98-536) 527 U.S. 581 (1999).
Ormond, B., K. Black, J. Tilly, & S. Thomas (2004). Supportive services programs in naturally occurring retirement communities. Washington, DC: Office of Disability, Aging and Long-Term Care Policy, Office of the Assistant Secretary for Planning and Evaluation, U.S. Department of Health and Human Services.
Petersson, I., M. Lilja, J. Hammel, and A. Kottorp (2008). “Impact of home modifications on ability in everyday life.” Journal Rehabil Medicine; 40: 253–260.
Pynoos, J.(2008). Linking housing and services to facilitate aging in place. Gerontologist. 48: 256-257 Sp. Iss. 3 Oct 2008.
Pynoos, J. (1993). Towards a national policy on home modification . Technology and Disability , 2 , 1 – 8 .
Pynoos, J., & Nishita, C. M. (2003). The cost of financing of home modifications in the United States. Journal of Disability Policy Studies 14 (2), 68–73.
Sanford, J. A., and T. Butterfield (2005). “Using Remote Assessment to Provide Home Modification Services to Underserved Elders.” The Gerontologist, Vol. 45, No. 3, 389–398.
Schafer, R. (2006). “Housing America’s Seniors.” Harvard Joint Center for Housing Studies. www.gsd.harvard.edu/jcenter.
Shippee, T. P. (2009). ‘“But I Am Not Moving”: Residents' Perspectives on Transitions Within a Continuing Care Retirement Community.’ The Gerontologist, v. 49 no. 3 (June 2009) p. 418-27.
Smith, S., S. Rayer, and E. Smith (2008). “Aging and Disability: Implications for the Housing Industry and Housing Policy in the United States.” Journal of the American Planning Association, Vol. 74, No. 3, 289-306.
Stafford, P. and J. Harlan-Simmons (2003). Home Modification Services in Indiana: Statewide Survey Results and Recommendations for Public Policy and Programs. Indiana Institute on Disability and Community, Indiana University. www.usc.edu/dept/gero/nrcshhm/resources/IndianaHM_report.pdf.
Stevenson, D. and D. Grabowski (2010). “Sizing Up The Market For Assisted Living.” Health Affairs, 29, no. 1 (2010): 35-43.
Stineman , M. G. ( 2001 ). A model of health environmental integration. Topics in Stroke Rehabilitation , 8 ( 2 ), 34 – 45 .
Stineman , M. G. , R. Ross, G. Masilin, & D. Gray ( 2007 ). Population based study of home accessibility features and the activities of daily living clinical and policy implications . Disability and Rehabilitation, 29, 1165 – 1175.
Strathers, C.(2005). “Housing Conditions and Housing Options for Older Residents.” Journal of Housing for the Elderly, 19: 1, 53 - 78.
Tanner, B., C. Tilse, and D. de Jonge (2008). “Restoring and Sustaining Home: The Impact of Home Modifications on the Meaning of Home for Older People.” Journal of Housing for the Elderly, 22: 3, 195 - 215.
U.S. Census Bureau, 2006-2008 American Community Survey. Detailed tables: B25007. Tenure by age of householder, B25037. Median year structure built by tenure.
Wylde, M. (2008).Right house, right place, right time: Community and lifestyle preferences of the 45+ housing market. Washington, DC: BuilderBooks.
Housing for Minnesota’s Aging Population – Discussion Paper September 2010
25
Appendices A: County Indicators
B: Select Universal Design Elements for All Housing
Housing for Minnesota’s Aging Population – Discussion Paper September 2010
26
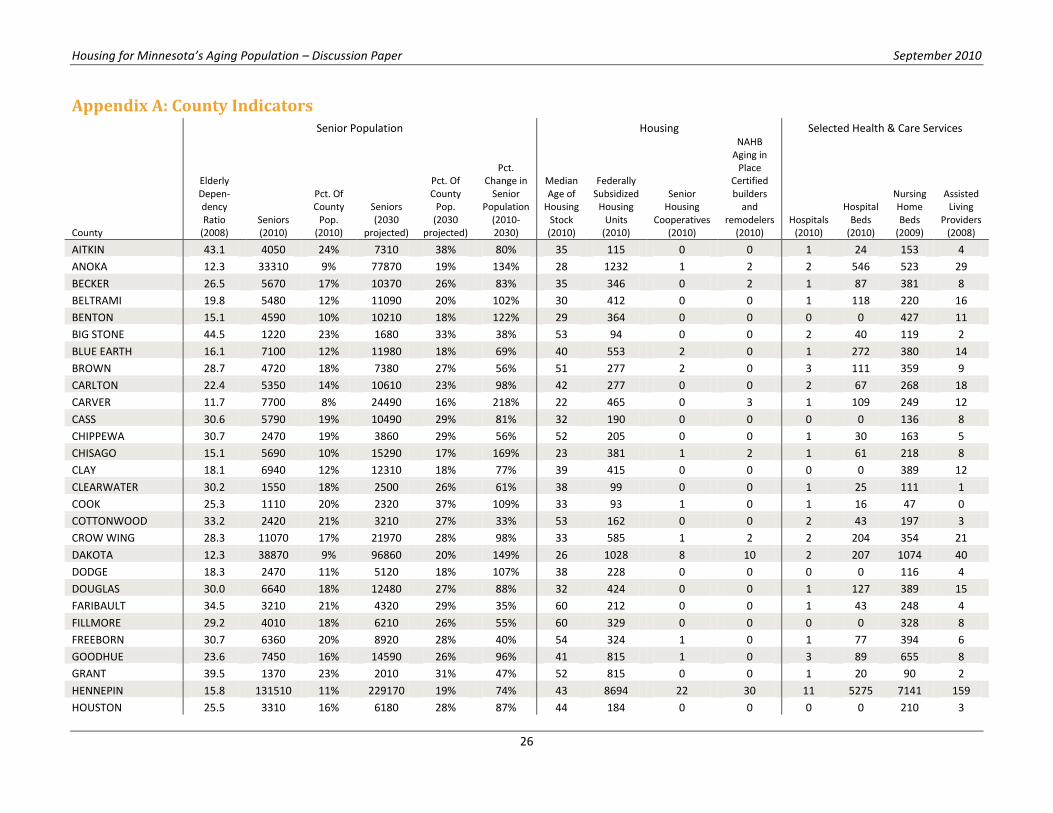
Appendix A: County Indicators
Senior Population Housing Selected Health & Care Services
County
Elderly Depen-dency Ratio
(2008) Seniors (2010)
Pct. Of County
Pop. (2010)
Seniors (2030
projected)
Pct. Of County
Pop. (2030
projected)
Pct. Change in
Senior Population
(2010-2030)
Median Age of
Housing Stock (2010)
Federally Subsidized
Housing Units
(2010)
Senior Housing
Cooperatives (2010)
NAHB Aging in
Place Certified builders
and remodelers
(2010) Hospitals
(2010)
Hospital Beds
(2010)
Nursing Home Beds
(2009)
Assisted Living
Providers (2008)
AITKIN 43.1 4050 24% 7310 38% 80% 35 115 0 0 1 24 153 4
ANOKA 12.3 33310 9% 77870 19% 134% 28 1232 1 2 2 546 523 29
BECKER 26.5 5670 17% 10370 26% 83% 35 346 0 2 1 87 381 8
BELTRAMI 19.8 5480 12% 11090 20% 102% 30 412 0 0 1 118 220 16
BENTON 15.1 4590 10% 10210 18% 122% 29 364 0 0 0 0 427 11
BIG STONE 44.5 1220 23% 1680 33% 38% 53 94 0 0 2 40 119 2
BLUE EARTH 16.1 7100 12% 11980 18% 69% 40 553 2 0 1 272 380 14
BROWN 28.7 4720 18% 7380 27% 56% 51 277 2 0 3 111 359 9
CARLTON 22.4 5350 14% 10610 23% 98% 42 277 0 0 2 67 268 18
CARVER 11.7 7700 8% 24490 16% 218% 22 465 0 3 1 109 249 12
CASS 30.6 5790 19% 10490 29% 81% 32 190 0 0 0 0 136 8
CHIPPEWA 30.7 2470 19% 3860 29% 56% 52 205 0 0 1 30 163 5
CHISAGO 15.1 5690 10% 15290 17% 169% 23 381 1 2 1 61 218 8
CLAY 18.1 6940 12% 12310 18% 77% 39 415 0 0 0 0 389 12
CLEARWATER 30.2 1550 18% 2500 26% 61% 38 99 0 0 1 25 111 1
COOK 25.3 1110 20% 2320 37% 109% 33 93 1 0 1 16 47 0
COTTONWOOD 33.2 2420 21% 3210 27% 33% 53 162 0 0 2 43 197 3
CROW WING 28.3 11070 17% 21970 28% 98% 33 585 1 2 2 204 354 21
DAKOTA 12.3 38870 9% 96860 20% 149% 26 1028 8 10 2 207 1074 40
DODGE 18.3 2470 11% 5120 18% 107% 38 228 0 0 0 0 116 4
DOUGLAS 30.0 6640 18% 12480 27% 88% 32 424 0 0 1 127 389 15
FARIBAULT 34.5 3210 21% 4320 29% 35% 60 212 0 0 1 43 248 4
FILLMORE 29.2 4010 18% 6210 26% 55% 60 329 0 0 0 0 328 8
FREEBORN 30.7 6360 20% 8920 28% 40% 54 324 1 0 1 77 394 6
GOODHUE 23.6 7450 16% 14590 26% 96% 41 815 1 0 3 89 655 8
GRANT 39.5 1370 23% 2010 31% 47% 52 815 0 0 1 20 90 2
HENNEPIN 15.8 131510 11% 229170 19% 74% 43 8694 22 30 11 5275 7141 159
HOUSTON 25.5 3310 16% 6180 28% 87% 44 184 0 0 0 0 210 3
Housing for Minnesota’s Aging Population – Discussion Paper September 2010
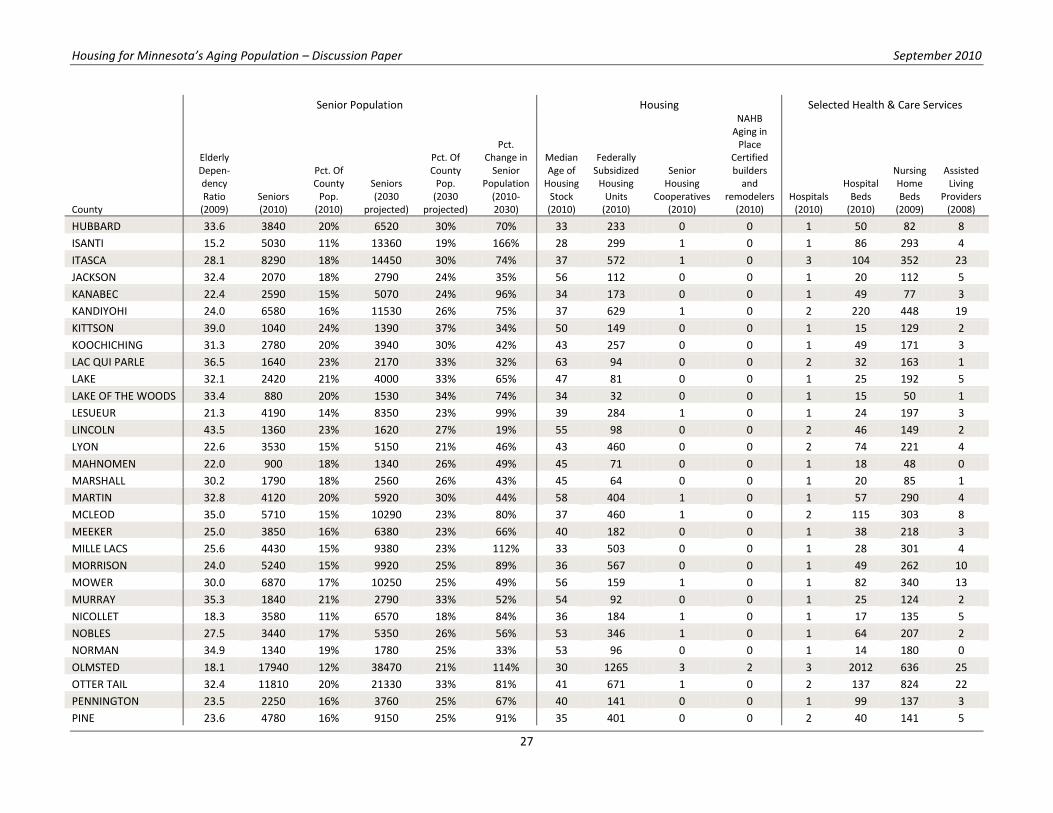
27
Senior Population Housing Selected Health & Care Services
County
Elderly Depen-dency Ratio
(2009) Seniors (2010)
Pct. Of County
Pop. (2010)
Seniors (2030
projected)
Pct. Of County
Pop. (2030
projected)
Pct. Change in
Senior Population
(2010-2030)
Median Age of
Housing Stock (2010)
Federally Subsidized
Housing Units
(2010)
Senior Housing
Cooperatives (2010)
NAHB Aging in
Place Certified builders
and remodelers
(2010) Hospitals
(2010)
Hospital Beds
(2010)
Nursing Home Beds
(2009)
Assisted Living
Providers (2008)
HUBBARD 33.6 3840 20% 6520 30% 70% 33 233 0 0 1 50 82 8
ISANTI 15.2 5030 11% 13360 19% 166% 28 299 1 0 1 86 293 4
ITASCA 28.1 8290 18% 14450 30% 74% 37 572 1 0 3 104 352 23
JACKSON 32.4 2070 18% 2790 24% 35% 56 112 0 0 1 20 112 5
KANABEC 22.4 2590 15% 5070 24% 96% 34 173 0 0 1 49 77 3
KANDIYOHI 24.0 6580 16% 11530 26% 75% 37 629 1 0 2 220 448 19
KITTSON 39.0 1040 24% 1390 37% 34% 50 149 0 0 1 15 129 2
KOOCHICHING 31.3 2780 20% 3940 30% 42% 43 257 0 0 1 49 171 3
LAC QUI PARLE 36.5 1640 23% 2170 33% 32% 63 94 0 0 2 32 163 1
LAKE 32.1 2420 21% 4000 33% 65% 47 81 0 0 1 25 192 5
LAKE OF THE WOODS 33.4 880 20% 1530 34% 74% 34 32 0 0 1 15 50 1
LESUEUR 21.3 4190 14% 8350 23% 99% 39 284 1 0 1 24 197 3
LINCOLN 43.5 1360 23% 1620 27% 19% 55 98 0 0 2 46 149 2
LYON 22.6 3530 15% 5150 21% 46% 43 460 0 0 2 74 221 4
MAHNOMEN 22.0 900 18% 1340 26% 49% 45 71 0 0 1 18 48 0
MARSHALL 30.2 1790 18% 2560 26% 43% 45 64 0 0 1 20 85 1
MARTIN 32.8 4120 20% 5920 30% 44% 58 404 1 0 1 57 290 4
MCLEOD 35.0 5710 15% 10290 23% 80% 37 460 1 0 2 115 303 8
MEEKER 25.0 3850 16% 6380 23% 66% 40 182 0 0 1 38 218 3
MILLE LACS 25.6 4430 15% 9380 23% 112% 33 503 0 0 1 28 301 4
MORRISON 24.0 5240 15% 9920 25% 89% 36 567 0 0 1 49 262 10
MOWER 30.0 6870 17% 10250 25% 49% 56 159 1 0 1 82 340 13
MURRAY 35.3 1840 21% 2790 33% 52% 54 92 0 0 1 25 124 2
NICOLLET 18.3 3580 11% 6570 18% 84% 36 184 1 0 1 17 135 5
NOBLES 27.5 3440 17% 5350 26% 56% 53 346 1 0 1 64 207 2
NORMAN 34.9 1340 19% 1780 25% 33% 53 96 0 0 1 14 180 0
OLMSTED 18.1 17940 12% 38470 21% 114% 30 1265 3 2 3 2012 636 25
OTTER TAIL 32.4 11810 20% 21330 33% 81% 41 671 1 0 2 137 824 22
PENNINGTON 23.5 2250 16% 3760 25% 67% 40 141 0 0 1 99 137 3
PINE 23.6 4780 16% 9150 25% 91% 35 401 0 0 2 40 141 5

Housing for Minnesota’s Aging Population – Discussion Paper September 2010
28
Senior Population Housing Selected Health & Care Services
County
Elderly Depen-dency Ratio
(2009) Seniors (2010)
Pct. Of County
Pop. (2010)
Seniors (2030
projected)
Pct. Of County
Pop. (2030
projected)
Pct. Change in
Senior Population
(2010-2030)
Median Age of
Housing Stock (2010)
Federally Subsidized
Housing Units
(2010)
Senior Housing
Cooperatives (2010)
NAHB Aging in
Place Certified builders
and remodelers
(2010) Hospitals
(2010)
Hospital Beds
(2010)
Nursing Home Beds
(2009)
Assisted Living
Providers (2008)
PIPESTONE 35.7 1970 21% 2600 28% 32% 54 61 0 0 1 44 201 3
POLK 26.4 5280 17% 8340 24% 58% 47 336 0 0 2 92 432 9
POPE 33.8 2290 20% 3790 30% 66% 47 149 0 0 1 34 190 4
RAMSEY 19.4 61590 12% 92620 19% 50% 49 4593 7 6 7 2014 3314 57
RED LAKE 25.7 810 19% 1370 30% 69% 48 117 0 0 0 0 45 1
REDWOOD 31.5 3070 20% 4130 27% 35% 52 184 1 0 1 25 294 4
RENVILLE 29.4 3020 18% 4520 26% 50% 54 239 0 0 1 35 285 6
RICE 17.1 7740 12% 15280 19% 97% 36 889 3 0 2 136 456 15
ROCK 31.6 1750 18% 2560 26% 46% 53 110 0 0 1 28 193 3
ROSEAU 18.8 2160 13% 4320 23% 100% 33 168 0 0 1 25 104 2
SAINT LOUIS 23.0 31300 16% 49490 24% 58% 53 2321 2 3 8 1132 1701 78
SCOTT 9.9 10050 7% 35720 13% 255% 16 426 0 0 2 142 363 12
SHERBURNE 11.0 7880 8% 23060 14% 193% 18 489 1 4 1 54 416 6
SIBLEY 24.0 2440 16% 3820 24% 57% 53 166 0 0 1 20 144 4
STEARNS 17.6 17380 11% 35480 19% 104% 31 1225 1 1 5 592 461 13
STEELE 21.0 4930 13% 9580 21% 94% 43 461 2 0 1 43 248 10
STEVENS 25.3 1470 15% 1840 18% 25% 46 154 0 0 1 54 104 2
SWIFT 28.0 1880 17% 2860 29% 52% 55 182 0 0 2 46 113 7
TODD 25.9 4110 16% 6830 26% 66% 44 253 0 0 1 34 173 3
TRAVERSE 51.8 900 25% 780 26% -13% 54 36 0 0 1 25 91 0
WABASHA 24.9 3450 15% 6080 24% 76% 40 132 0 0 1 31 173 2
WADENA 35.4 3060 22% 5150 34% 68% 42 157 0 0 2 89 266 3
WASECA 20.9 2800 14% 5280 25% 89% 46 157 1 0 1 35 175 3
WASHINGTON 12.7 24530 10% 62510 21% 155% 22 1087 1 3 2 183 606 20
WATONWAN 33.4 2110 19% 3140 31% 49% 55 196 1 0 2 50 146 1
WILKIN 24.9 1080 16% 1810 28% 68% 48 108 0 0 1 25 120 3
WINONA 20.0 6700 14% 11060 22% 65% 50 380 0 0 1 99 490 7
WRIGHT 12.9 11950 9% 34810 16% 191% 20 409 0 1 2 104 510 12
YELLOW MEDICINE 34.9 2010 20% 2800 29% 39% 57 152 0 0 2 55 192 3
Housing for Minnesota’s Aging Population – Discussion Paper September 2010
29
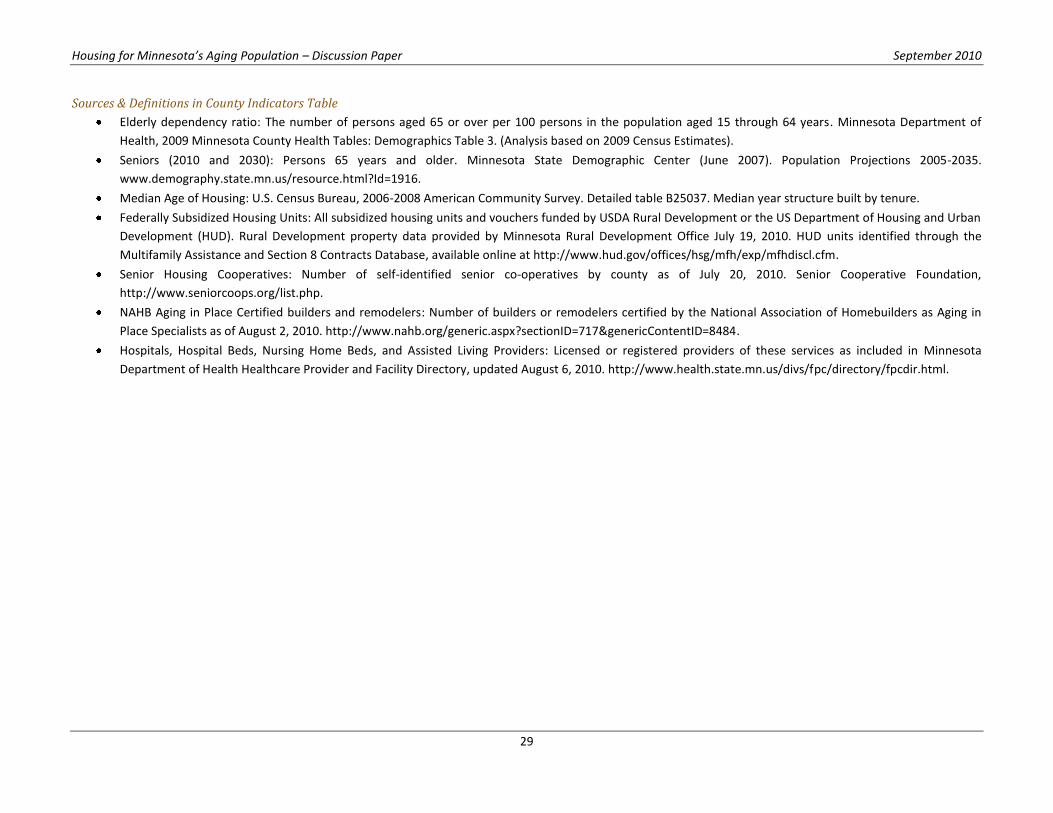
Sources & Definitions in County Indicators Table
Elderly dependency ratio: The number of persons aged 65 or over per 100 persons in the population aged 15 through 64 years. Minnesota Department of
Health, 2009 Minnesota County Health Tables: Demographics Table 3. (Analysis based on 2009 Census Estimates).
Seniors (2010 and 2030): Persons 65 years and older. Minnesota State Demographic Center (June 2007). Population Projections 2005-2035.
www.demography.state.mn.us/resource.html?Id=1916.
Median Age of Housing: U.S. Census Bureau, 2006-2008 American Community Survey. Detailed table B25037. Median year structure built by tenure.
Federally Subsidized Housing Units: All subsidized housing units and vouchers funded by USDA Rural Development or the US Department of Housing and Urban
Development (HUD). Rural Development property data provided by Minnesota Rural Development Office July 19, 2010. HUD units identified through the
Multifamily Assistance and Section 8 Contracts Database, available online at http://www.hud.gov/offices/hsg/mfh/exp/mfhdiscl.cfm.
Senior Housing Cooperatives: Number of self-identified senior co-operatives by county as of July 20, 2010. Senior Cooperative Foundation,
http://www.seniorcoops.org/list.php.
NAHB Aging in Place Certified builders and remodelers: Number of builders or remodelers certified by the National Association of Homebuilders as Aging in
Place Specialists as of August 2, 2010. http://www.nahb.org/generic.aspx?sectionID=717&genericContentID=8484.
Hospitals, Hospital Beds, Nursing Home Beds, and Assisted Living Providers: Licensed or registered providers of these services as included in Minnesota
Department of Health Healthcare Provider and Facility Directory, updated August 6, 2010. http://www.health.state.mn.us/divs/fpc/directory/fpcdir.html.
Housing for Minnesota’s Aging Population – Discussion Paper September 2010
30
Appendix B: Select Universal Design Elements for All Housing Excerpted from “Residential Rehabilitation, Remodeling and Universal Design,” The Center for Universal Design,
North Carolina State University College of Design (2006). Available online at:
http://www.ncsu.edu/www/ncsu/design/sod5/cud/pubs_p/docs/residential_remodelinl.pdf.
Entrances 1. Accessible parking convenient to dwelling (covered from the elements)
2. Accessible path of travel to dwelling from parking or drop off area (slope of 1:20 or less eliminates the
necessity for handrails, except when needed by a specific individual)
3. At least one entrance without steps and flush or low profile threshold
4. Minimum 5-feet X 5-feet maneuvering space at stepless entrance
5. 36-inch minimum exterior door with lever hardware
6. Movement sensor light at entrance
7. A sidelight or a peephole at 42 and 60 inches above the floor
8. Ambient and focused lighting at keyhole
9. High visibility address numbers
General Interior 1. Hall width 42 inches minimum (interior accessible route is 36 inches)
2. Interior door width 32-inch minimum (requires 34 or 36-inch wide door), equipped with lever hardware
3. Flush transitions between floor surfaces (maximum of 1/2-inch rise)
4. 5 pounds maximum force to open doors
5. 18-inch minimum space at latch side of door
6. 5-feet X 5-feet maneuvering space in each room (after furniture is placed)
7. Increased number of electrical outlets for additional lighting and alarm indicators, especially in bedrooms
8. Electrical outlets at 18-inch minimum height
9. Light switches 44 inches maximum above floor
10. View windows at 36-inch maximum sill height and large enough to use as an escape route in the event of
an emergency
11. Crank operated (casement) or light weight sliding windows
12. Closet rods adjustable from 30 inches to 66 inches above the floor
13. Loop or other easy-to-use handle pulls on drawers and cabinets
14. High contrast, glare free floor surfaces and trim
15. Low pile carpet or smooth anti-slip flooring
16. High-speed Internet access data connection port and cabling
Bathrooms 1. 60-inch diameter turning circle
2. 30-inch X 48-inch area of approach (forward or parallel, depending on fixture type) in front of all fixtures
3. Toilet more usable by many if positioned in a 5-feet X 5-feet space with centerline 18 inches from sidewall
4. 32-inch minimum lavatory counter height with lever faucet control
5. Adaptable cabinets to reveal kneespace under lavatory. Exposed piping in kneespace should be padded or
concealed.
6. When tub or shower are installed, select models designed to accept a portable bench or bathing seat
7. Curbless or roll-in shower plus standard tub
8. Offset single-lever controls in tub and shower to minimize stooping, bending, and reaching
Housing for Minnesota’s Aging Population – Discussion Paper September 2010
31
9. Adjustable height hand-held shower head in addition to standard fixed shower head
10. Anti-scald devices on all plumbing fixtures
11. Enlarged reinforced areas around toilet and bathing fixture to provide secure mounting locations for grab
bars and shower seats
12. Mirror to backsplash at lavatory
13. Contrasting color edge border at countertops
Kitchens 1. 60-inch diameter turning space
2. 30-inch X 48-inch area of approach (forward or parallel, depending on fixture type) in front of all
appliances
3. Cooktop or range with front- or side-mounted controls and staggered burners to eliminate dangerous
reaching
4. Front-mounted controls on washer and dryer
5. Adaptable cabinets to reveal kneespace (when needed) at sink and under work surface near cooking
appliance
6. Variable height sink adjustable between 32 and 40 inches
7. Exposed piping and any sharp or hot elements in any kneespace should be padded or concealed
8. Single-lever faucet controls
9. Full height pantry cabinets for high and low storage.
10. Adjustable height shelves in wall cabinets
11. Refrigerator / freezer with frozen food storage in the bottom or side-by-side refrigerator / freezer
12. Variable height counter surfaces or adjustable through a range of 28 to 40 inches
13. Base cabinets with pullout shelves or drawers
14. Contrasting color edge border at countertops
15. Microwave oven at countertop height with uninterrupted counter surface or pull out shelf to support the
safe transfer of hot and / or heavy cookware
16. Under cabinet glare free task lighting


