Housing Privatization in Moscow: Who Privatizes and Why* JENNIFER DANIELL AND RAYMOND STRUYK Perhaps the single most important policy reform undertaken to date in the Russian housing sector has been privatization of state rental units. Tenants have been given the opportunity to acquire their unit at little or no cost simply by requesting the transfer of ownership. The law ‘On Privatization of the RSFSR Housing Stock’, passed by the Supreme Soviet in June 1991, mandated privatization of state-owned rental units to registered tenants. Local governments were given the possibility of charging tenants for space occupied above the nationally set minimum. While most cities opted for charging for ‘extra space’, Moscow adopted free-of- charge privatization in January 1992. In December 1992, the Supreme Soviet established free-of-charge privatization throughout the Federation. Under the 1991 law, privatization got off to a slow start. By the beginning of December 1991, only 90,OOO units, or 0.4%, of self-contained, state-owned rental units in Russia had been transferred to private ownership. Privatization did not really get under way until early 1992, by which time local governments had determined the terms under which units would be tranferred.’ The number of units privatized each month was initially quite small. However, by the end of the year the number of units being privatized each month had increased significantly - 638,000 units in December alone, out of the 1992 total of 2.55 million units privatized. Among municipalities, Moscow’s free-of-charge programme, which was combined with an efficient system for processing applications, got off to a quick start and performed well during 1992. According to the State Statistical Office, 366,000 units were privatized in Moscow by the end of the year, or about 13% of the 1990 state housing stock. In short, the housing privatization programme appears to be well on its way to achieving its primary objectives: transferring sufficient units to private ownership so as to form the basis of a private market, and giving a substantial number of families a genuine stake in Russia’s economic reforms. While Russia’s record of housing privatization is clearly impressive, and Moscow’s even more so, many questions exist about this experience. Which households have availed themselves of the opportunity: those with higher incomes and white collar jobs, or all classes? How do pensioners behave? What motivates some families lo privatize and others not to do so? To what extent did privatization increase throughout the year, and when did households privatize? How many more units are likely to be privatized and what will influence these decisions? *Jennifer Daniell is a Research Associate at the Urban Institute, Moscow, where Raymond Struyk is a Senior Fellow. The paper was prepared as part of the technical cooperation programme with the Russian Federation funded by the US Agency for International Development.Opinions expressed are those of the authors and not necessarily those of USAID or the Urban Institute. The authors gratefully acknowledge the fine comments on a draft of the paper provided by Gregory Andrusz. 1 See Kosareva and Struyk (1993) for a description of the privatization law and its early implementation. 0 Joint Editors and Basil Blackwell Ltd 1994. Published by Blackwell Publishers, 108 Cowley Road, Oxford OX4 IJF, UK and 238 Main Street, Cambridge, MA 02142, USA.
Transcript
Housing Privatization in Moscow: Who Privatizes and Why*
JENNIFER DANIELL AND RAYMOND STRUYK
Perhaps the single most important policy reform undertaken to date in the Russian housing sector has been privatization of state rental units. Tenants have been given the opportunity to acquire their unit at little or no cost simply by requesting the transfer of ownership. The law ‘On Privatization of the RSFSR Housing Stock’, passed by the Supreme Soviet in June 1991, mandated privatization of state-owned rental units to registered tenants. Local governments were given the possibility of charging tenants for space occupied above the nationally set minimum. While most cities opted for charging for ‘extra space’, Moscow adopted free-of- charge privatization in January 1992. In December 1992, the Supreme Soviet established free-of-charge privatization throughout the Federation.
Under the 1991 law, privatization got off to a slow start. By the beginning of December 1991, only 90,OOO units, or 0.4%, of self-contained, state-owned rental units in Russia had been transferred to private ownership. Privatization did not really get under way until early 1992, by which time local governments had determined the terms under which units would be tranferred.’ The number of units privatized each month was initially quite small. However, by the end of the year the number of units being privatized each month had increased significantly - 638,000 units in December alone, out of the 1992 total of 2.55 million units privatized. Among municipalities, Moscow’s free-of-charge programme, which was combined with an efficient system for processing applications, got off to a quick start and performed well during 1992. According to the State Statistical Office, 366,000 units were privatized in Moscow by the end of the year, or about 13% of the 1990 state housing stock. In short, the housing privatization programme appears to be well on its way to achieving its primary objectives: transferring sufficient units to private ownership so as to form the basis of a private market, and giving a substantial number of families a genuine stake in Russia’s economic reforms.
While Russia’s record of housing privatization is clearly impressive, and Moscow’s even more so, many questions exist about this experience. Which households have availed themselves of the opportunity: those with higher incomes and white collar jobs, or all classes? How do pensioners behave? What motivates some families lo privatize and others not to do so? To what extent did privatization increase throughout the year, and when did households privatize? How many more units are likely to be privatized and what will influence these decisions?
*Jennifer Daniell is a Research Associate at the Urban Institute, Moscow, where Raymond Struyk is a Senior Fellow. The paper was prepared as part of the technical cooperation programme with the Russian Federation funded by the US Agency for International Development. Opinions expressed are those of the authors and not necessarily those of USAID or the Urban Institute. The authors gratefully acknowledge the fine comments on a draft of the paper provided by Gregory Andrusz.
1 See Kosareva and Struyk (1993) for a description of the privatization law and its early implementation. 0 Joint Editors and Basil Blackwell Ltd 1994. Published by Blackwell Publishers,
108 Cowley Road, Oxford OX4 IJF, UK and 238 Main Street, Cambridge, MA 02142, USA.
Housing privatization in Moscow 51 1
This paper addresses these and other relevant questions for the City of Moscow. The findings are based on a survey conducted in December 1992 of a random sample of 2000 housing units in Moscow which were state rentals at the beginning of 1992; some of these units were privatized during the year. The survey gathered substantial information about the occupants’ economic conditions and demographic characteristics, and their attitudes towards privatization, including the motivations of those who have privatized their units. The paper does not address broader issues about housing privatization, such as the efficiency of free-of- charge privatization, complementary actions necessary for successful privatization, or the multiple equity issues involved. These topics are discussed in World Bank (1993), Struyk and Telgarsky (1992), Hegedus et al. (1992), Katsura and Struyk (1992) and Buckley ef al., (1992).
Overall, we conclude that economic incentives, both for and against privatization, appear to be the driving force behind housing privatization. Estimates of unit value are a highly significant determinant of a household’s decision to privatize. As privatization was free of charge and little systematic information exists on the secondary sales prices of privatized apartments, households were asked to estimate value based on knowledge of the sales prices of similar units. For those respondents who did not give an estimate, values were computed using a regression model explained in detail later in the text. The results of our analysis show that the higher the value of the unit, the more likely the tenants are to privatize. Evidence also reveals that those in higher-level or favoured occupations, e.g. directors and intelligentsia, who are likely to have obtained better housing under the Soviet system, have a higher rate of privatization. Further, reasons for privatizing as reported by tenants indicate economic motivations for and against privatizing. The desire to bequeath a flat to an heir is a positive factor, and concern over economic liabilities, such as increased maintenance fees and property taxes, are negative factors in the privatization decision. Pensioners privatize in order to bequeath the unit to their heirs. Others privatize to acquire a valuable asset with the potential of providing rental income and/or to protect themselves from the uncertainty of the future of state rentals.
The following section outlines our hypotheses about who is and who is not privatizing, and why or why not. It also presents the methodology employed in testing the hypotheses. The next section describes the &ta and definitions used to determine the privatization status of households according to demographic characteristics. Following that is a section presenting descriptive fmdings from the survey data answering the questions about who is privatizing, why or why not, and how privatization trends changed throughout the year. Lastly, the results of logit models of the privatization decision are presented.
Conceptual framework and methodology The standard economic model of tenure choice casts the household’s decision to become a home owner in terms of the flow of the costs (positive and negative) of renting and owning. In the user cost of capital formulation, appreciation of the housing asset enters as a negative cost. The cost to the household of gross rent (as a renter) is compared with capital and operating costs less appreciation (as an owner).* The household is likely to choose the cheaper alternative.
In Moscow, since housing privatization is free of charge, a tenant’s gain from the transfer of ownership is the full value of the unit. Unlike a household purchasing a unit, there is no expenditure associated with unit acquisition, although the privatizing tenant may have to pay for rehabilitation in the future. By comparison, in Hungary for example, households could effectively purchase occupancy rights.3 Thus, the tenant’s potential capital gain from
2 3
See, for example, Grootaert and Dubois (1989) and Goodman (1988). Hegedus et af. (1992). For general discussions of the privatization decision, see Tolley (1992) and Katsura and Struyk (1992).
0 Joint Editors and Basil Blackwell Ltd 1994
512 Jennifer Daniel1 and Raymond Struyk
privatizing must be reduced by his initial investment. There were few cases in Moscow, however, of households who purchased the occupancy rights for a unit from another tenant under the former system. Hence, in Moscow the value of the privatized unit should be a clear and powerful determinant of the decision to privatize: those living in higher-value units are expected to have a higher likelihood of privatizing.
There are other demand-side forces at work. Most notably, pensioners have a special motivation to privatize. Under the regime of state-provided housing, the rental contract (the naym social agreement) gave tenants very strong rights. It was and is essentially impossible to evict them and occupancy of a unit could be bequeathed to certain farmly members who were registered as living in the same unit. Those not registered as living in that particular apartment, however, could not receive the unit. Hence, pensioners are motivated to privatize in order to be able to pass their unit to their non-resident relations. They will privatize to ‘cash in’ their right to bequeath the unit to someone.
There are, however, factors that discourage privatization. As noted, extremely strong tenants’ rights provide owner-like security, and reduce such gains from privatizing. In addition, if the operating costs - e.g. maintenance fees and property taxes - of owning are higher than those of renting, the likelihood of privatization declines as the relative advantage of owning is diminished. The governments of the Russian Federation and the city of Moscow recognized this fact and acted to encourage privatization. The Law on Privatization declares that during an undefined ‘transition period’ those who privatize will pay the same maintenance and communal service fees as renters. The Russian Federation has a property tax, which is a local tax but with a nationally set tax rate and method of assessment. The actual parameters were set so that the effective rate on residential property is trivial (Lowry, 1992). Moreover, some cities including Moscow even delayed implementing the tax. Thus, through 1993 there was no difference in the operating costs confronted by owners and renters.
The Moscow housing stock consists nearly completely of multi-family buildings and under the privatization law any unit in any building can be privatized. Therefore, renter and owner neighbours in the same building differ in no significant respect, except that the owner has the right to sell or rent his unit freely on the market. However, presumably many households suspect that the situation of equal operating costs will not continue indefinitely and that owners are at risk some day of paying property taxes and of paying much higher fees for maintenance and communal services than renters living under the naym social agreement. These expectations may affect the privatization decision.
Operationally, the effect of these various factors is to make the model actually estimated extremely simple. The mode is:
In [P/(l -P)] = a + b, (VALUE) + b2 (EXPECT) + e
where the dependent variable is the log of the odds of a tenant electing to privatize his unit, VALUE is the market value of the tenant’s unit, EXPECT are variables indicating the tenant’s expectations about future increases in operating costs, and e is an error term.
We have also estimated a ‘descriptive model’ to identify important household demographic and economic factors associated with the decision to privatize. The variables included in this model were selected on the basis of a series of cross-tabulations reviewed below.
Data and definitions This section describes the data employed in this analysis and explains some of the variables created to analyse the attitudes towards and the extent of privatization among various demographic groups.
0 Joint Editors and Basil Blackwell Ltd 1994
Housing privatization in Moscow 513
Sample survey The objective of the survey was to obtain information for a sample of 2000 units which were state rentals in January 1992. The primary sample was drawn by randomly selecting from a listing of residential telephone numbers provided by the Moscow Telephone Network. As of October 1992, 92% of apartments in Moscow (and 94% of urban families - the difference being attributable to communal flats) had telephones. The great majority of units without telephones is in areas of newly constructed buildings awaiting installation of this equipment. Samples were drawn of units in three of these large, new residential sites from listings of units in each. Including these areas, 95% of all units in Moscow were included in the population from which the sample was drawn.
The sample was restricted to state rentals by interviewer screening. Occupants were asked whether the unit met the definition for inclusion, i.e. was it a state rental unit in January 1992. For cases in which the occupant refused to be interviewed, the interviewer followed instructions for selecting a similar unit in the same building, usually a unit above or below the one originally selected through the telephone listing.
A total of 2002 interviews were completed in person in December 1992. The survey included questions on housing quality of both the flat and public spaces in the building, household characteristics including family size, occupations and incomes, and attitudes towards privatization. These data enable us to examine which households in Moscow are privatizing their units and, furthermore, to determine a household’s motivations for privatizing or for not privatizing their unit.
Definitions In order to evaluate the depth of interest in privatization, households were divided into five groups based on whether or not they had privatized or were planning to do so, and if not, their interest in privatization:
Privatizers (those who ‘did’) - those who have received a certificate of ownership through the privatization process, plus those who have applied to receive their unit, whose application has been accepted and who are waiting for their certificate. Interested (those who ‘will’) - those who express a strong interest in privatizing their unit, i.e., they stated explicitly that they intend to privatize within the next six months. Might - those who have no concrete plans to privatize, but responded positively to two or more questions about their intentions regarding privatization of their unit if certain developments occurred, such as rents being raised by ten times or a government announcement that free-of-charge privatization would end in a year. Uninterested (‘won’t’) - those who have no plans to privatize their units and who responded negatively to at least two out of three questions about their intentions to privatize given different policy changes. Unclear - those who believe that in general flats in their building are not eligible because, for example, the building needs extensive rehabilitation, plus those in communal flats where the occupants of other rooms do not agree to privatization, and those who applied to privatize their unit but whose applications were rejected for other reasons. The key variable in the analysis of incentives for privatization is the value of the unit. In
the survey, following a screening question asking if tenants knew units similar to theirs which had been privatized, and then sold or rented, interviewees were requested to appraise the value of their flats. Answers were provided by 162 of those surveyed. To obtain values for other units a hedonic regression model was estimated using data on units for which the respondents had provided estimates of value. (The model is presented in the Appendix.) The model was used to impute unit value for the other cases.
The model estimating the odds of privatizing also incorporates the occupant’s views about the importance of maintenance fees and property taxes in the decision to privatize. 0 Joint Editors and Basil Blackwell Ltd 1994
5 14 Jennifer Daniel1 and Raymond Struyk
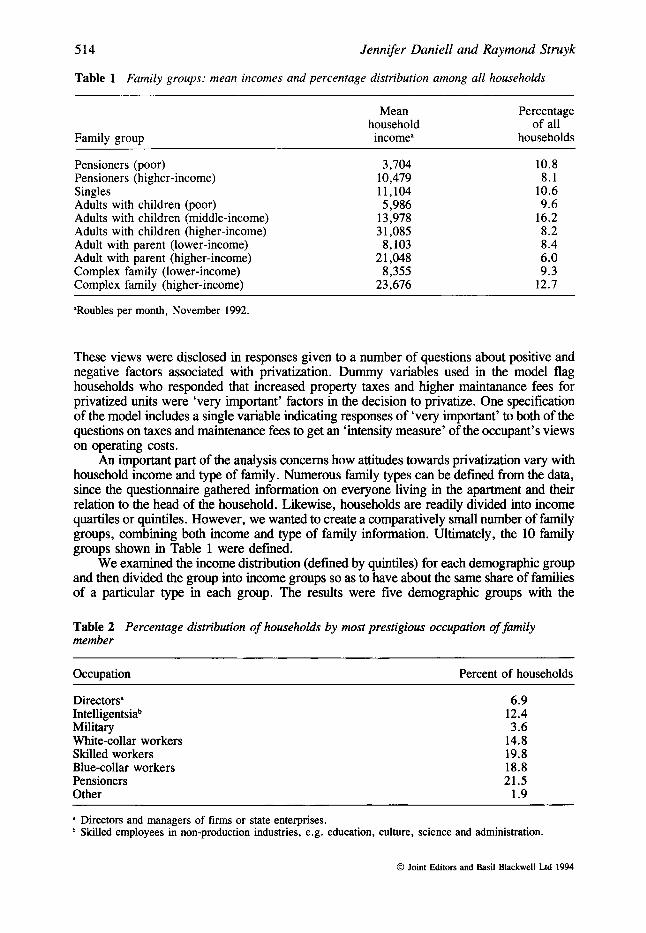
Table 1 Family groups: mean incomes and percentage distribution among all households
Family group
Mean household income"
Percentage of all
house holds
Pensioners (poor) Pensioners (higher-income) Singles Adults with children (poor) Adults with children (middle-income) Adults with children (higher-income) Adult with parent (lower-income) Adult with parent (higher-income) Complex family (lower-income) Complex family (higher-income)
3,704 10,479 11,104 5,986
13,978 3 1,085
8,103 2 1,048
8,355 23,676
10.8 8.1
10.6 9.6
16.2 8.2 8.4 6.0 9.3
12.7
"Roubles per month, November 1992.
These views were disclosed in responses given to a number of questions about positive and negative factors associated with privatization. Dummy variables used in the model flag households who responded that increased property taxes and higher maintanance fees for privatized units were 'very important' factors in the decision to privatize. One specification of the model includes a single variable indicating responses of 'very important' to both of the questions on taxes and maintenance fees to get an 'intensity measure' of the occupant's views on operating costs.
An important part of the analysis concerns how attitudes towards privatization vary with household income and type of family. Numerous family types can be defined from the data, since the questionnaire gathered information on everyone living in the apartment and their relation to the head of the household. Likewise, households are readily divided into income quartiles or quintiles. However, we wanted to create a comparatively small number of family groups, combining both income and type of family information. Ultimately, the 10 family groups shown in Table 1 were defined.
We examined the income distribution (defined by quintiles) for each demographic group and then divided the group into income groups so as to have about the same share of families of a particular type in each group. The results were five demographic groups with the
Table 2 Percentage distribution of households by most prestigious occupation of family member
Occupation Percent of households
Directors" Intelligentsiab Military White-collar workers Skilled workers Blue-collar workers Pensioners Other
6.9 12.4 3.6
14.8 19.8 18.8 21.5
1.9
a Directors and managers of firms or state enterprises. Skilled employees in non-production industries, e.g. education, culture, science and administration.
0 Joint Editors and Basil Blackwell Ltd 1994
Housing privatization in Moscow 515
number of income classes for each demographic group ranging from one to three (Table 1). Note that pensioners are retired elderly persons living alone or with their spouse, including those reporting income from working. Singles are non-elderly singles or two unrelated individuals living together. Families with children have one or more children aged 18 or under living with the parents (or parent). Complex families are multigenerational or multinuclei households.
Finally, households were divided into seven occupational categories from among the 18 options included in the questionnaire. A family’s category was based on the most prestigious occupation of the first three family members. The categories defined, from highest to lowest prestige, are shown in Table 2. Occupation may well be more important than income in determining the tenure decision. Under the Soviet system, cash income was a poor measure of total income because of an elaborate system of special stores and price discounts for the favoured. Furthermore, obtaining a good flat depended substantially on party membership and prestigious positions in the nomenclature, and working in priority industries whose enterprises were allocated more funds to construct workers’ housing (Alexeev, 1988). We suspect that the distribution of occupation for Moscow differs significantly from the balance of Russia. We are uncertain how such differences may affect the privatization decision.
Findings of the survey: Who privatizes? Why or why not? This section presents and reviews tabular information on the extent of privatization: which households have privatized their units with greater frequency; the reasons expressed by tenants for and against privatization; and, changes in the pattern of who privatized over the year.
There has been an overwhelming response to the offer of free-of-charge housing privatization. Almost one-quarter, 23.4%, of the households surveyed have privatized and 26.2% plan on privatizing in the next six months (Table 3). At current raies, over half of the city’s housing stock will be under private ownership by the autumn of 1993. Only 9% of households express no interest in privatizing, leaving a large percentage who have no real plans to privatize but do not express a strong disinterest. These households, those who ‘might’ privatize, claimed to have no plans to privatize but responded positively to two or more questions about whether they would privatize given specific policy changes - for example, ‘would you privatize if no-charge privatization were to end?’ Those households who would definitively not privatize responded negatively to all of the conditional questions.
Our primary hypothesis that value is the driving force behind most privatization is supported by the mean value of units privatized compared to the mean value of all units. Table 4 presents these figures along with the privatization rates and the percentage of aggregate value of privatized units for each income quintile. Except for the lowest quintile, which includes many of the pensioners, who may have other motivations for privatizing which we will discuss below, privatized units are more valuable than the average unit.
Table 3 Percentage distribution of tenants by privatization status
a Thousands of roubles. For all households in survey.
Table 5 Percentage distribution of privatization status by socio-economic group
Did Will Might Won’t Unclear
Pensioners (poor) Pensioners
(higher-income) Singles Adults with children
(Poor) Adults with children
(middle-income) Adults with children
(higher-income) Adult with parent
(lower-income) Adult with parent
(higher-income) Complex family
(lower-income) Complex family
(higher-income)
46.8 15.3 31.9 3.7 2.3
42.9 17.4
25.8 24.9
18.4 38.0
6.7 11.7
6.1 8.0
14.1 25.0 38.0 13.5 9.4
6.5
11.6
10.1
6.7
5.1
5.1
14.5 28.6 37.8 12.6
11.0 32.9 38.4 6.1
21.3 30.2 32.5 5.9
27.5
22.8
26.7 27.5 11.7
29.5 35.0 7.5
23.1 25.6 35.9 10.3
But, who is doing this privatization? A very telling response is given by privatization among socio-economic groups and by household occupational status. Results clearly support the assertion that a large percentage of pensioners are taking advantage of privatization, as illustrated in Table 5 . Of the socio-economic groups, the largest percentages of privatizers are in the pensioner categories: 46.8% of low income and 42.9% of higher income pensioners had privatized. Moreover, only 3.7% and 6.7% of lower- and higher-income pensioners, respectively, report that they will not privatize. Other groups are considerably further behind in their rate of privatization, with high-income adults living with parents in second position with 27.5% privatized.
Table 6 presents the breakdown of privatization status by occupation status of the household. The highest rate of privatization is, as was evidenced in the previous table,
0 Joint Editors and Basil Blackwell Ltd 1994
Housing privatization in Moscow
Table 6 Percentage distribution of privatization status by household occupation
Table 7 Reasons for privatizing: percentages answering ‘very important ’ by privatization status
Reasons Did Will Might Won’t Unclear
Bequeath unit to heir Not want to move Easier to move Could sell flat Rents may increase Possible rental income Good investment Control of maintenance
and management More control of
rehabilitation
63 .O 31.4 9.2
1 1 . 1 28.4 9.6
12.8
7.1
6.6
49.7 27.4 10.1 12.0 26.1 7.0
15.6
8.0
7.0
23.5 10.9 5.1 5.5 9.3 4.5 5.2
6.0
5.1
42.8 27.8 1 1 . 1 15.6 26.1 12.8 15.6
10.0
1 1 . 1
46.4 28.6 17.9 16.4 32.9 11.4 22.9
10.7
12.1
among pensioner^.^ Excluding pensioners, however, there is a clear pattern among occupations. As expected, those in more prestigious occupations, likely to have better hou~ing,~ i.e. in more desirable locations or of higher quality, have a high rate of privatization. Directors and managers of state or private enterprises and intelligentsia have the highest rates of privatization and highest rates of those who will privatize in the next six months. Skilled and blue-collar workers not only have the lowest rate of privatization, but also have the highest percentage of those who will not privatize, presumably due to lower quality or less valuable units.
The survey also included questions asking tenants about their opinions on the importance of various reasons for privatization. Respondents were asked to rank each reason from ‘very important’ to ‘not important’. There is a certain degree of ambiguity about whether respondents are expressing the importance of these issues to themselves or whether they feel that these issues are generally important to most tenants. However, in either case their responses indicate the issues which are viewed as most relevant to the decision to privatize. Those responding that the specified reason was very important are tabulated according to their privatization status in Table 7.
Table 7 does clearly show that respondents are strongly motivated by immediate concerns of housing security and stability. The majority of respondents, 63 % , expressed the
4 Unfortunately, data is not available on the occupation of pensioners before they retired. 5 Evidence on this point is presented in Daniel1 et al. (1993).
0 Joint Editors and Basil Blackwell Ltd 1994
518 Jennifer Daniel1 and Raymond Struyk
Table 8 Percentage distribution of those who ‘might ’ privatize following spec$ed changes in policy
Would privatize if . . . Definitely More likely
Rent for state housing increased
No-charge privatization ended
Owners were permitted to select
significantly (10 times) 28.0 12.0
in a year 34.4 16.4
maintenance companies 39.2 11.2
opinion that the ability to bequeath a flat to an heir is very important. As explained previously, only those registered as living in a state-owned unit have the right to inherit it. By privatizing, the new owner has the right to bequeath the unit to whomever he chooses and may keep the unit in the family regardless of the previous residence registration.
Protection against having to move and increases in rents are also very important to many respondents. Many see privatization as a means to establish more security in their housing situation. On the other hand, fewer respondents expressed the desire for more control over maintenance and management and rehabilitation of their flat, perhaps indicating some uncertainty or apprehension about the responsibilities of ownership.
Much smaller percentages of respondents reported the sale or rent of the unit, or the investment potential of the unit, as an important reason for privatizing. These sentiments, perhaps, do not reflect the view that the unit is not a valuable asset, but instead reflect a lack of faith in the current real estate market or uncertainty in the current economic environment.
Of those who ‘might’ privatize, many stated that their decisions would be strongly influenced by changes in current housing policy. Table 8 tabulates the responses of those who ‘might’ privatize to specific questions concerning their intentions to privatize if: (1) rent for state housing increased significantly; (2) the policy of free privatization - transferring ownership of the unit to the tenant free of charge - was ended; and (3) new owners were given greater choice (and responsibility) in the selection of their maintenance company. For the latter two policy changes almost half of respondents in this category would either ‘definitely’ or ‘more likely’ privatize. That fewer will privatize if rents for state housing increased probably reflects fears that maintenance fees for privatized units might be even greater.
Reactions to reasons for privatization also vary considerably across socio-economic groups. Although the ability to bequeath the apartment to an heir is important to all households, pensioners and especially low-income pensioners more consistently stated that this reason is very important. Among family types, those households with higher incomes express more strongly their opinions about the importance of financial reasons to privatize. Higher-income households recognize the economic benefits of privatizing, such as the fact that the apartment is a good investment which could potentially provide rental income. Almost four times as many higher-income households with children, compared with their lower-income counterparts, respond that the ability to sell an apartment is an important factor in privatizing than those in the lower-income category; more than four times as many view the flat as a good investment; and about seven times as many respond that possible rental income is very important to the decision to privatize. This pattern is consistent across all family types, except pensioners, who probably do not look at privatization in the long term. This suggests that higher-income households are more strongly motivated by the economic incentives to privatize than are those in the low-income categories.
Tenants were also questioned about their opinions on the importance of various reasons against privatization, and asked to rank each from ‘very important’ to ‘not important’. Those
0 Joint Editors and Basil Blackwell Ltd 1994
Housing privatization in Moscow 519
Table 9 Reasons against privatizing: percentage answering 'very important ' by privatization status
Reasons Did
Property taxes Higher maintenance fees Responsibility for
rehabilitation Plan to move to another
state unita No reason to privatize" Poor flat condition" Poor locationa
30.3 25.2
1 1 . 1
3.6 6.4 3.0 2.6
Will
37.1 32.2
17.7
7.8 21.0
6.9 6.6
Might Won't Unclear
39.2 46.7 40.1 43.3
21.3 24.4
15.2 13.9 30.9 30.0 13.5 18.3 8.7 15.0
36.4 33.6
17.9
20.0 22.9 21.4 12.9
a These questions were asked only to those who had not yet received their privatization certificate. Note that some of the households who 'did' had privatized their unit but not received certificates.
responding that the specified reason was very important are tabulated according to their privatization status in Table 9. It is evident that many are concerned with increases in property taxes, higher maintenance fees and responsibility for rehabilitation of buildings. As expected, those who have not yet privatized feel more strongly about these issues.
Privatization has accelerated over time as more information became available on the market and on the future of government policies. For example, the government has recognized the concern over property taxes and announced the postponement of the implementation of the tax on residential property. As more units are privatized and the private housing market develops, more information has become available on prices. Moreover, the scattered information available reveals that house prices have increased - although not as quickly as the overall inflation, owing mostly to the tiny number of units available on the market in the early days of the transition, and recent increases in supply of units for sale.6 The trend in privatization may also have been influenced by the simple fact that once there was a significant number of privatized units, others felt more secure in privatizing.
As the monthly totals for units privatized show, privatization increased considerably in the last quarter of 1992. Of those who privatized and received their certificate of ownership in 1992,48% did so in the last three months of the year. Including those who have privatized but not yet received their certificates, which indicates that they had applied in the last few months of the year, these figures are impressive.
Interestingly, this trend varied among demographic groups and household occupational status. Table 10 tabulates percentages of households in each of the socio-economic groups who have privatized and when in 1992 they privatized. The majority of pensioners and singles who privatized did so in the first nine months, but for other groups the pace of privatization increased significantly in the last three months of the year.
Data on the percentage of those who have privatized according to household occupation by time period in 1992 show that privatization among households in all occupational categories increased substantially in the last quarter of 1992.
6 Pchelinstev et al. (1993) estimate a free market sales prices to income ratio in Moscow of 150; Kosareva (1993) estimates the same ratio for 1992 as 85.
0 Joint Editors and Basil Blackwell Ltd 1994
520
Table 10 Privatization by socio-economic group and when privatized (month of 1992)
Jennifer Daniel1 and Raymond Struyk
Of those privatized:
First Last nine three
Privatized“ months months
Pensioners (poor) Pensioners (higher-income) Singles Adults with children (poor) Adults with children
(middle-income) Adults with children
(higher-income) Adult with parent
(lower-income) Adult with parent
(higher-income) Complex family
(lower-income) Complex family
(higher-income)
34.3 30.1
8.9 8.3
6.5
7.9
13.0
17.5
14.0
11.4
71.4 61.1 58.4 43.4
38.5
46.8
40.8
33.1
34.3
41.2
27.4 38.9 41.6 56.6
61.5
53.2
59.2
66.9
65.7
58.8
These figures differ from those in Table 5 because these are only those households who had already received their privatization certificates by December 1992.
h g i t estimates While the foregoing descriptive information is of interest, it fails to address the question of what is really driving the decision to privatize. Our basic hypothesis was tested by means of logistic regression of the likelihood of privatization being significantly determined by a few key economic factors, most importantly the value of the unit.
The logit results are presented in Table 11. Model 1 includes only value as the independent variable. Model 2 includes value and two dummy variables indicating whether or not a household considers increased property taxes and higher maintenance fees for private units ‘very important’ to the decision to privatize. Finally, Model 3 includes value and a dummy variable indicating that the household responded that both higher taxes and maintenance fees were ‘very important’.
The findings clearly indicate the significance of value. The higher the value of the unit, the greater the odds of privatization. The effect of an increase in value is, however, modest. An increase in value from 8 million roubles (about the mean reported value) to 13 million roubles increases the odds by 0.15 from a mean of 0.3 (i.e., [0.23/(1-0.23)]). The models also indicate that concerns over increased maintenance fees significantly reduce the odds of privatizing, although similar expressed concerns about property taxes do not have this effect.
Despite the high statistical significance of the models, they do poorly as predictive devices. Although the overall predictions are reasonable (76% correct), the choice to privatize is correctly predicted in only a few cases by any of the models.
Logit models were also estimated with two additional specifications for the value variable. In the frrst model, apartment value was in units of 10,OOO roubles (versus 1OOO in the reported models) to reduce the spread and possibly improve the fit of the regression. In the second, apartment value was transformed into three dummy variables, each representing
0 Joint Editors and Basil Blackwell Ltd 1994
Housing privatization in Moscow 52 1
Table 11 Results of logistic regression economic incentives to privatize ~ ~~
Significance B EXP(B) Significance B Significance Chi-square Significance
EXP(B)
EXP(B)
EXP(B)
3.18E-5 1 .0000 0.0000
*
*
*
2 155 .W70 0.0000
3.30E-5 1 .m O . o o 0 0
-0.0300 0.9705 0.8453
0.5684 0.0004
-0.5649
*
-1.3011 O.oo00
2 129.7570 O.oo00
3.24E-5 1 .m O.oo00
*
-0.5175 0.5960 O.oo00
- 1.3478 O.oo00
2137.3970 O.oo00
* Variable not included in the regression.
roughly one-third of the value distribution. Neither alternative had much effect on the quality of the fit or predictive power of the models. However, for the 10,000-rouble specification, the coefficient doubled in size (after adjusting for the scalar transformation), suggesting that the estimated magnitude of the effect on privatization may not be very robust. For the specification employing dummy variables, interestingly, only the variable for the highest one-third of the value distribution was significant (relative to the lowest one-third), suggesting that it is the highest’valued units that are being privatized. This is supported by inspection of the data: the incidence of privatization in the lowest third is 22%, 20% in the second third, and 29% in the highest third.
These results are in line with those for Budapest, the only other location for which rigorous statistical analysis has been undertaken (Hegedus ef al., 1992). Value also proved to be highly significant, although for Budapest calculating the capital gain to those privatizing is more difficult because one-third of all state rentals had been obtained through payments to prior tenants for occupancy rights. In addition, a variable for expectations about increases in rents was highly signifcant in encouraging privatization. In Hungary, those who privatize enjoy no protection from higher maintenance fees: indeed, a condominium association must be formed and a minimum share of all units in a building slated for privatization before the title for the fvst unit is transferred. Hence, higher rents increase the cost of renting relative to
We have also estimated a descriptive logit model to clan@ the economic and demographic patterns associated with privatization, based largely on the results of the tabulations reviewed in the last section. The variables in this model include: (a) household’s income, entered in quadratic form to capture potential non-linearities; (bi age of the head of the household;’ (c) occupation; and, the extent of crowding, as measured by square metres of space for each member of the household. The f d variable was added on the premise that
7 There are problems with the measurement of age because the oldest person in the household is not necessarily the person whose age is indicated. The age variable was defined as the older of the first two household members listed, typically the husband and spouse. However, it is likely that a parent living in
owning.
0 Joint Editors and Basil Blackwell Ltd 1994
522 Jennifer Daniel1 and Raymond Struyk
Table 12 Results of logistic regression: household characteristics ~ ~~~
Independent variables
Age
Income
Income2
Director
Intelligentsia
Military
White-collar worker
Skilled worker
Pensioner
Sqm per
Constant
-2 Log likelihood:
B
Significance B EXP(B) Significance B
Significance B
Significance B
Significance B
Significance B
Significance B
Significance B
Significance B EXP(B) Significance B Significance Chi-square Significance
EXP(B)
EXP(B)
EXPW
EXP(B)
EXP(B)
EXP(B)
-0.2340 0.9769 O.ooO0
5.66E-6 1 .m 0.6021
-7.5E-11 1 .m 0.5867 0.6135 1.8469 0.0141 0.8410 2.3186 O . o o 0 0 0.3729 1.4520 0.2633 0.2737 1.3148 0.1715
the most crowded households would be anxious to privatize to make it easier to find a better unit in the market rather than waiting to be allocated a larger unit through the official procedures or working through an apartment swap, which is often complicated (Khadduri and Puzanov, 1992). The results are quite interesting, and are shown in Table 12. Income itself is not associated with the decision to privatize. On the other hand, there are definite patterns for different occupation categories: directors and members of the intelligentsia are significantly more likely to privatize relative to blue-collar workers, and skilled workers are less likely than blue-collar workers. This result again supports the assertion that under the old
- the flat or an elderly household member, who may have been the driving force behind privatization, was not captured in this definition of age of the head of the household.
0 Joint Editors and Basil Blackwell Ltd 1994
Housing privatization in Moscow 523
regime income was not the key determinant of the distribution of housing among households and that the legacy of these practices still strongly effects this distribution.
The effect of age is somewhat complicated. First, note that being a pensioner household (a single pensioner or a pensioner couple living alone) is associated with a large positive increment in the likelihood of privatizing. After controlling for pensioner households, however, the separate effect of a greater age of the husband or spouse is to reduce the likelihood. Together these results indicate that middle-aged households are less likely to privatize than their older or younger counterparts. Finally, crowding has essentially no effect on the decision to privatize.
An interesting comparison to these results for Moscow are those reported for Budapest (Hegedus et a l . , 1992). A ‘descriptive model’ was also estimated for Budapest, but the specification is rather different from the one just presented. Nevertheless, the most interesting contrast between the results for Budapest and Moscow is that income is significantly associated with the decision to privatize in Budapest. Although privatization was not free of charge in Budapest, units were offered to tenants at discounts which reduced the price of privatizing to a nominal charge. Thus, the difference in the significance of income seems attributable to the much greater possibility in Budapest of acquiring a unit through legal payment (i.e., the purchase of occupancy rights) and the much larger share of total income received in cash (rather than in special privileges) in recent years. Together these factors have permitted households with higher cash incomes systematically to acquire better housing - housing which is the most valuable to privatize under the deep discounts available to Hungarian renters. Overall, the findings for both Moscow and Budapest clearly support the idea that tenants of state housing are making highly rational decisions about privatizing their units.
The future Privatization is well under way in Moscow and in Russia generally. One can reasonably anticipate that half of the state housing stock will shift to private ownership. Still, this will leave a large stock of social housing, consisting typically of less valuable units. In Moscow, such units may well fall into two broad groups: poor-quality units in central locations and standard units in the more distant suburbs. The systematic differences in the quality and location of privatized and state units probably implies the development of increased socio- economic stratification between the occupants of the two types of housing. Aside from inheritances (which will be far from trivial in volume), privatized units will be sold or rented to families with greater resources.
The economic differentiation may as well eventually produce a heightened disparity in the quality of the buildings. Buildings in which most units are privatized are the strongest candidates for forming condominiums (possible in Russia since 1993) and improving maintenance by hiring private f m s . Municipal and departmental buildings, on the other hand, are likely to continue to suffer neglect from both underfunding of maintenance and poorly motivated maintenance f m s .
The patterns just described should, however, be limited by the combination of rent increases and the simultaneous introduction of housing allowances which will take place in 1994. The higher rents will improve the ability to fund maintenance which is especially critical for the state sector. Housing allowances will protect the poor from having to pay an excessive share of income for housing and in particular can help the poor meet condominium payments.
8 For a general description of housing allowances in Russia, see Struyk et al. (1993). The specific programme being implemented is described in Struyk and Kosareva (1994).
0 Joint Editors and Basil Blackwell Ltd 1994
524 Jennifer Daniell and Raymond Struyk
Finally, by early 1994 the impact of privatization on the housing market was becoming clearer. In MOSCOW, changes in ownership (secondary transfers after privatization) of 13,000 units were registered in January - on an annual basis equivalent to about 5 % of the housing stock. While many of these transfers involved gifts (often by the elderly to their relatives), many are genuine market transactions. In short, privatization has helped create a housing market. Jennifer W e l l and Raymond Struyk, The Urban Institute, USAID Shelter Cooperation Program, 12/5 Furkasovsky pereulok, Moscow 101819, Russia
References Alexeev, M. (1988) Market vs. rationing: the case of Soviet housing, Review of Economics and
Statistics 70.3, 414-20. Buckley, R., P. Hendershott and K. Villani (1992) Rapid housing privatization: pay the special
dividend and get on with it. World Bank, Washington, DC. Daniell, J . , A. Puzanov and R. Struyk (1993) Dwelling conditions and the quality of maintenance
in Moscow’s state rental sector. Urban Institute Technical Cooperation Office, Moscow. Goodman, A.C. (1988) An econometric model of housing price, permanent income, tenure choice,
and housing demand, Journal of Urban Economics 23, 327-53. Grootaert, C., and J.L. Dubois (1989) Tenure choice and the demand for rental housing in cities of
the Ivory Coast. Journul of Urban Economics 24, 44-63. Hegedus, J . , K. Mark, R. Struyk and I. Tosics (1992) Zhe privatization dilemma in Budapest’s
public rental housing sector. Metropolitan Research Institute, Budapest. Katsura, H. and R. Struyk (1992) Selling eastern Europe’s state rental housing: proceed with
caution. Housing Policy Debate, 4.2, 1251 -74. Khadduri, J. and A. Puzanov (1992) Notes on the residential real estate market in Russia. Urban
Institute Technical Cooperation Office, Moscow. Kingsley, G.T. and R. Struyk (1992) Progress in privatization: transforming eastern Europe’s
social housing. The Urban Institute, Washington, DC. Kosareva, N.B. (1993) Housing reform in Russia - first steps and future potential, Cities 10.3,
- and R. Struyk (1993) Housing privatization in the Russian Federation, Housing Policy Debate
Lowry, I S . (1992) Real estate tenure and taxation in the Russian Federation. The Urban Institute, Washington, DC.
Pchelintsev, O., T. Belkina, G. Ronkin and E. Tcherbakova (1993) Housing indicators forMoscow and the Russian Federation 1992. The Institute of Economic Forecasting, Russian Academy of Sciences, Moscow.
Struyk, R. and N. Kosareva (1994) Zhe Russian housing market in transition: 1991 - 1994. Urban Institute Technical Cooperation Office, Moscow. - N. Kosareva, J. Daniell, C. Hanson and M. Mikelsons (1993) Implementing housing
allowances in Russia: rationalizing the rental sector. Urban Institute Press, Washington, DC. - and J. Telgarsky (1992) The puzzle of housing privatization in eastern Europe, Review of
Urban and Regional Development Studies. Tolley, G. (1992) Urban housing reform in China: an economic analysis. World Bank,
Washington, DC. Discussion paper 123. World Bank (1993) Russia: housing reform and privatization. World Bank, Washington, DC,
draft, restricted distribution.
198-207.
4.1, 81-100.
Appendix: Estimation of unit values A hedonic regression model including variables on housing characteristics and quality was used to estimate the value of a unit. In the survey, following a screening question asking if tenants knew units similar to theirs which were privatized, sold or rented, interviewees were requested to appraise the value of their flats. The dependent variable in
0 Joint Editors and Basil Blackwell Ltd 1994
Housing privatization in Moscow 525
Table A1 Variable definitions
Dependent variable
Type of variable Definition
Value Continuous Value of the unit in thousand roubles
Total space of the unit in sq. m Height of the ceiling in sq. m Single family (l) , communal (0)
Brick building of the Stalin era (l) , other (0) Building of new panel construction (l) , other (0) Building of 1970s design (l), other (0)
Building of Krushchev era (l), other (0) Toilet and bath separate (l), else (0)
Dummy (0.1)
Central heating was out in the unit for a month or more (l), else (0)
Continuous
Dummy (0.1)
Ratio of total space to living space in the flat Too much heat in the flat, had to open windows to regulate temperature (l), else (0)
center Dummy Located in the centre (l), else (0) (0.1)
the regression model is the value of the unit given by those who responded that they did know a similar unit privatized, sold or rented, 162 cases.
Despite this screening the resulting distribution of values included several unrealistic outliers. Where there was a clear break in the distribution, outliers were assigned the value at the break. Estimates of less than 1 million roubles were assigned a value of 1 million roubles and those over 45 million roubles were assigned 45 million roubles. For all other cases, the coefficients of the hedonic model were used to determine the value of a unit according to the following equation:
All independent variables included in the final model were significant at the 0.10 level or higher. The resulting distribution of values was normal but included negative estimates. Those below the value of the tenth percentiles of the dependent variable, a plausible price for a unit in Moscow, were assigned that value, 1.5 million roubles. Variable definitions are in Table A1 . @ Joint Editors and Basil Blackwell Ltd 1994