HOUSING SYSTEM INDICATOR TOOL HOUSING AND HOMELESSNESS RESOURCE CENTRE Prepared by: Housing Services Corporation This is the second series of resource tools to guide the development and reporting on indicators for the Ten Year Housing & Homelessness Plans WORKING DRAFT (updated April 2013)
Transcript
HOUSING SYSTEM INDICATOR TOOL
HOUSING AND HOMELESSNESS RESOURCE CENTRE
Prepared by:
Housing Services Corporation
This is the second series of resource tools to guide the development and reporting on indicators for the Ten Year
Housing & Homelessness Plans
WORKING DRAFT
(updated April 2013)
1
HOUSING AND HOMELESSNESS RESOURCE CENTRE (HHRC)
The Housing and Homelessness Resource Centre is a partnership between the Ontario Municipal Social Services Association (OMSSA), the Ontario Ministry of Municipal Affairs and Housing
(MMAH) and the Housing Services Corporation (HSC), the Northern Ontario Service Deliverers Association (NOSDA), the Association of Municipalities of Ontario (AMO), and the City of Toronto.
The Housing and Homelessness Resource Centre provides, on an as needed basis, the tools, training, and other resources necessary to undertake the full range of planning
activities required to successfully develop and complete a local Housing and Homelessness Plan.
In partnership OMSSA and the HSC are developing analytical tools and providing customised support to Service Managers that require assistance with data and consultation related
to their Housing and Homelessness Plans.
ONTARIO MUNICIPAL SOCIAL SERVICES ASSOCIATION (OMSSA)
The Ontario Municipal Social Services Association (OMSSA) is a non-profit organization working on behalf of Ontario's 47 municipal service system managers, known as Consolidated Municipal
Service Managers (CMSMs) and District Social Services Administration Boards (DSSABs). CMSMs and DSSABs are responsible for the management, planning, delivery and funding of human
services including early learning and child care, employment and income supports, and housing and homelessness programs.
Through OMSSA, CMSMs and DSSABs promote progressive human services in Ontario. In our policy work with municipal and provincial partners and through our training programs and events,
we are committed to ensuring our members have the tools and resources they need to deliver human services that meet the needs of people in the communities where they live.
www.omssa.com
HOUSING SERVICES CORPORATION (HSC)
The Housing Services Corporation (HSC) is a non-profit organization that delivers province-wide programs that benefit Ontario’s affordable housing sector. It assists Service Managers, including
DSSABs, by:
• Helping protect the building asset through programs and services that support better capital asset and energy management
• Delivering business value through economies of scale with competitively procured province-wide programs in bulk purchasing, insurance and investments
• Building and spreading knowledge that supports effective decision-making with relevant research, training and by facilitating collaborative best practice sharing
• Enabling greater resident engagement and self-sufficiency by developing partnerships for social innovation with other organizations and networks. HSC was created in January 2012 under the Housing Services Act. HSC, as successor to the Social Housing Services Corporation (SHSC), builds on that organization’s 9 years of experience in delivering programs to social housing and working with different levels of government, the public and the private sector.
www.hscorp.ca
2
Contents
GENERAL HOUSING AND RELATED DOMAINS ................................................................................................................................................................................................................................ 1
................................................................................................................................................................................................................................................................. 1 BASIC TENURE AND BUILT FORM
............................................................................................................................................................................................................................................................................... 1 HOUSING PRODUCTION
............................................................................................................................................................................................................................................................................... 7 211 CALLS FOR SERVICE
........................................................................................................................................................................................................................................................................................................ 8 INCOME
HOUSING SYSTEM ................................................................................................................................................................................................................................................................................. 12
....................................................................................................................................................................................................................................................................................... 19 SOCIAL HOUSING
Arising out of the feedback from the Housing and Homelessness Forums, outreach with Service Managers/DSSABs and input from regional sessions- an indicator tool has been developed by the
Housing and Homelessness Resource Centre as a resource to assist Service Managers/DSSABs to assess, collect and establish metrics for their 10 year Housing and Homelessness Plans; and to
trigger the thought process for long-term tracking and monitoring, and measurement reporting. To understand the relative impact of local plans and related general trends about the housing
system, empirical data will be required. The underlying premise is to provide an indicator tool to help service managers develop a more robust housing indicator framework/system that
works for their service area that builds further into monitoring outcomes and developing measures in their plan. The tool also enables thinking ahead about the types of data that can
be collected and reported when updating their plan in the future. The HHRC will continue to build on this indicator tool as SMs develop and share their indicators and outcome
measures for their plans.
The tool highlights relevant indicators and provides guidance on how to demonstrate the housing system in your service area and to determine what data and information can be collected on a
routine basis to demonstrate progress. The indicator tool also presents an opportunity for SM to think about modifications to current data collection practices if necessary, to ensure information
gathered is relevant data that can provide evidence that supports the nature of the housing environment and reporting of housing outcomes. Increasing and improving data collection processes
will provide a more accurate picture of progress made. This will facilitate continuous improvements to the plan development and monitoring process as well as set out an evaluation framework for
future programs and initiatives.
The indicators can serve a number of functions:
• A tool to determine how SMs are faring-and assist in the identification of issues that are in greatest need, setting priorities and objectives
• Inform service-planning and evidence-based policy development within and between municipal divisions
• A tool to monitor progress and performance interventions over time
• Provide supporting metrics to demonstrate change, progress and areas that require improvement
• Provide a framework to track and communicate success and best practices
• Support decision-making specific to the housing system
• Demonstrate pressure points in the system that will enable the development of strategies to respond
• Keep the broader community informed about housing and homelessness issues
• Assist in creating a report card to demonstrate trends, outcomes, and measures of success
5
USING THE INDICATOR TOOL:
The Housing System Indicator Tool provides a compilation and range of indicators that reflects various aspects of the housing continuum. Given the uniqueness of each Service Manager area, the
indicators are general with broad definitions that enable for them to be tweaked and changed where needed. While the tool does not include an inclusive list of indicators, it provides a
MENU for a foundational set of indicators that can be used to start thinking about data collection strategies to: 1) assess current and further housing needs within the service manager
areas, 2) address objectives and targets relating to housing needs, 3) development of appropriate indicators and measures, and 4) to guide the thought process for establishing
housing targets. The indicators can also be used to inform policy development and reform on an ongoing basis.
This indicator tool and/or content in this document is not prescribed. It is not required for Service Managers to collect, analyze and report on any of the indicators listed in this tool.
Each Service Manager will need to make its own decision about what type of data and indicators they want to use and have priority, find out what data exists locally to report on, and
determine what is feasible.
Tips for selecting indicators:
• Prioritize what you want to report on and select few indicators that can be effectively measured: KEEP IT SIMPLE
• Indicators should be plausible, in that it make sense to a wide variety of audiences
• DOABLE (within the resources and capacities of the SM and stakeholders)
• Assessable- select indicators that can align with measurable objectives and that can assess impact
• It is not necessary to collect heaps of data
• While indicators can provide counting- think about meaning
• Indicators to support broader trends, short-term and long-term outcomes
The indicators are organized under several headings but indicators may speak to more than one area or domain:
General Housing and Related Domains: - these are more general indicators that reveal key trends about a community’s housing system. Some of these domains have sub-categories.
• Basic Tenure and Built Form
• Housing Market
• Housing Production
• Housing Condition/Quality
• Housing Demolition
• Housing Stress
• Residential Mobility
• Housing Affordability
• Subsidies
• 211 Calls for Service
• Settlement Services
• Legal Clinics
• Income
• Employment
• Eviction
Housing System- these are community and local indicators that describe and relate to the various components of the housing system.
• Homelessness (street counts, streets to home
program, criminal justice system)
• Emergency Shelter
• Supportive Housing
• Social Housing (including Waiting list)
• Private Market Rental
• Homeownership
The indicators also list a variety information sources. Some information can be extracted from standard sources as the census or CMHC sources. Other types of indicators data may be available at
the local municipal level (administrative data) or through other sources (funders, providers, agencies, institutions).
The type of indicator is also noted: descriptive, process, efficiency, and effectiveness. Descriptive indicator show the development of a variable but may not be connected with a concrete policy
target. Process indicators are typical of operational characteristics or the output of a process (i.e., number of applicants in a program etc.). Efficiency and Effectiveness Indicator are types of
impact/outcome indicators.
1
HOUSING SYSTEM INDICATOR TOOL
Domain Indicators Type of
Indicator Sources Comments
GENERAL HOUSING AND RELATED DOMAINS
BASIC TENURE AND
BUILT FORM
# Houses- Rented Descriptive Statistics Canada, Census
This forms a 4X4 matrix of basic tenure and form. # Houses- Owned Descriptive Statistics Canada, Census
# Apartments- rented Descriptive Statistics Canada, Census
# Apartments- owned Descriptive Statistics Canada, Census
HOUSING MARKET
# of Owning/Renting by income Descriptive Statistics Canada, Census (analysis
based on census data). 2011 NHS
data when available. Special Census
data can be ordered
These are general housing related indicators that
provide a profile and describes the composition and
state of a SM/DSSABs housing market based on trends
and changes over time.
# of owners/renters by age Descriptive
# of owners/renters by family type Descriptive
# of dwellings by structural type
(semi, single, row, apt etc.) Descriptive Census, Planning Departments
# of seasonal and vacation home
supply Descriptive Local Planning or Realtor sources
HOUSING PRODUCTION
# of ownership and rental housing
starts Descriptive CMHC custom data
The indicators linked to housing production
demonstrate change in housing tenure and form
which contribute social, economic and demographic
changes in communities.
The number of housing starts, secondary plan
approvals, and housing permits provides an indicator
of the trend in supply of new ownership and rental
dwellings. Housing starts are key to increasing the
supply of housing across a SM/DSSAB area. A diversity
of dwelling types and an increase in supply improves
# of Housing starts by intended
market (freehold, condominium,
rental)
Descriptive CMHC custom data
# of housing starts by dwelling
type (single, semi-detached, row,
apartment)
Descriptive CMHC custom data
# of new secondary plan approvals Descriptive Local municipal planning or building
department
# of registered units Descriptive Local municipal planning or building
2
Domain Indicators Type of
Indicator Sources Comments
HOUSING PRODUCTION department housing choice and affordability for owners and
renters alike.
# of housing permits issued by year Descriptive
Local municipal planning or building
department
HOUSING DEMOLITION
# of houses demolished Descriptive Local municipal building department
Statistics Canada (collected regularly
from municipalities)
Allows calculating net change (e.g., many new houses
and apartments are not new). Data can be ordered.
Does not identify tenure nor 1-for-1 replacement
houses.
# of apartments demolished Descriptive
# of applications to demolish rental
units Descriptive
Local municipal planning/
development department
This indicator describes losses to the existing,
purpose-built rental stock that may result due to
demolition and redevelopment of rental housing sites,
and conversion to condominium.
# of applications to convert to
condominium Descriptive
HOUSING CONDITION
AND QUALITY
Condition of Housing
# of dwellings owned, rented that
require regular maintenance,
minor, and major repairs
Descriptive CMHC (data online)- Major repair.;
Statistics Canada, Census series
Self-rated by residents. Undercounting of rented
rooms and second suites. Provides an indication of
state of the housing in a SM area, and the viability and
sustainability of the housing stock over time.
# of property standards infractions
Facility Condition Index Efficiency
Property Standards inspections
(Municipalities)
RRAP/IAH application data
Given no one reliable indicator, the viable approach is
to have more than one partial indicator.
Condition of Social Housing
# or % of providers with up to date
BCAs Efficiency
Building Condition Audits, Energy
Audits, Asset Planner
This is an important indicator that provides a rating for
the condition of social housing projects- review of the
major capital components of projects to determine the
general condition, quality and where
replacements/repair are needed. BCA’s are critical to
project viability, especially in light of Social Housing
End Dates. It can also demonstrate the processes in
places to preserve existing affordable rental housing
and asset management practices undertaken.
3
Domain Indicators Type of
Indicator Sources Comments
# or % of providers with
preventative maintenance plans Efficiency
Housing Provider, SM administrative
data (local level availability)
This is an indicator that infers purposeful action taken
towards ongoing maintenance and improvement.
SUBSIDIES
Renovation Subsidies
# Rental and rooming house (units) Descriptive/
Effectiveness Administrative Data (SM)
SMs/DSSABs may have similar programs. These could
be used as descriptive or effectiveness indicators to
demonstrate program effectiveness.
# Senior modified (units) Descriptive/Eff
ectiveness Administrative Data (SM)
# Homeowner modified (units) Descriptive/Eff
ectiveness Administrative Data (SM)
Subsidies in Market Rent
#(household count, rent
supplement)
Descriptive/
Effectiveness Administrative Data (SM)
These are indicators of rental subsidies in place to
reduce financial burden on low income households to
afford rent. While it can demonstrate demand it is also
a program/initiative effective measure to illustrate
housing stability or instability as a result.
#(household count), portable
allowances
Descriptive/
Effectiveness Administrative Data (SM)
RESIDENTIAL MOBILITY
# of households by tenure that
have moved in past 1 yr or past 5
yrs
Descriptive Statistics Canada, Census. Available
only every 5 years.
An important dimension of community and
geographic change.
Land Transfer Tax exemption
(property counts) Descriptive
Local municipal planning or building
department
An important indicator of neighbourhood turnover to
moderate-income first-time buyers.
# or % Recent (0-10 year)
immigrants Descriptive Statistics Canada, Census.
These 2 are main categories regarding trends for
‘recent’ immigrants. # or % Semi-recent (10-20 year)
immigrants Descriptive Statistics Canada, Census.
HOUSING STRESS
Cost of Utilities
# of households by income source
assisted with utilities arrears
Process/
Effectiveness
Utilities Arrears Program or similar
program- Administrative data Indicator will demonstrate the number of low income
households that accessed help for heat and hydro
(including water) arrears through the SM. Total # utilities cost issued through
the SM program Process
Utilities Arrears Program or similar
program- Administrative data
4
Domain Indicators Type of
Indicator Sources Comments
HOUSING STRESS
Food Insecurity
# of households accessing SM area
food banks in March by year
Descriptive/
Process Hunger Count Survey is completed
each year in the month of March and
provides information about a typical
month for access to food banks and
allows for comparison year to year.
Custom requests for Hunger Count
by Region- Food Banks Canada
(Ontario Association of Food Banks)
This indicator describes the number and characteristics
of people who use food relief programs.
It provides a measure of how many people do not
have enough income to meet basic needs of food and
shelter. It also provides a measure of the vulnerability
of low-income households to provide for the basic
necessities of life. Food bank use refers to the number
of people accessing food banks.
Food bank users:
# people, # adults, # adults and
children, # of mètis first nations, #
children, # total households)
Descriptive
# of Single Parents
# of Single People
Descriptive
Rent Bank Users
# of eligible rent bank applicants
(changes in the number of rent
bank loans)
Effectiveness/
Process
MMAH Data Request, Rent Bank
Statistics The Rent bank is a government program that provides
interest-free loans and grants to help tenants avoid
eviction. The number of assisted households indicates
housing stress in the rental market and a household’s
ability to pay shelter costs.
# of eligible rent bank applicants
served or number of households
assisted/supported through the
rent bank
Descriptive/
Process
MMAH Data Request, Rent Bank
Statistics
Emergency Rent and Energy Assistance Fund usage
# of emergency rent applicants
# of emergency rent households
assisted
Effectiveness/
Process
MMAH Data Request, Energy
Assistance Program; SM
administrative data
These are indicators that demonstrate the number of
households requiring financial assistance for rental
arrears and energy-related emergencies.
Energy Arrears: covers eligible energy arrears, and the
security deposit and reconnection feeds related to
natural gas, oil and other forms of energy
Rental Arrears: covers eligible costs to a maximum of
two months of rental arrears.
# of energy assistance households
assisted
Effectiveness/
Process
MCSS Data Request, Energy
Assistance Program; SM
administrative data
# of energy assistance applicants Effectiveness/
Process
MCSS Data Request, Energy
Assistance Program; SM
administrative data
5
Domain Indicators Type of
Indicator Sources Comments
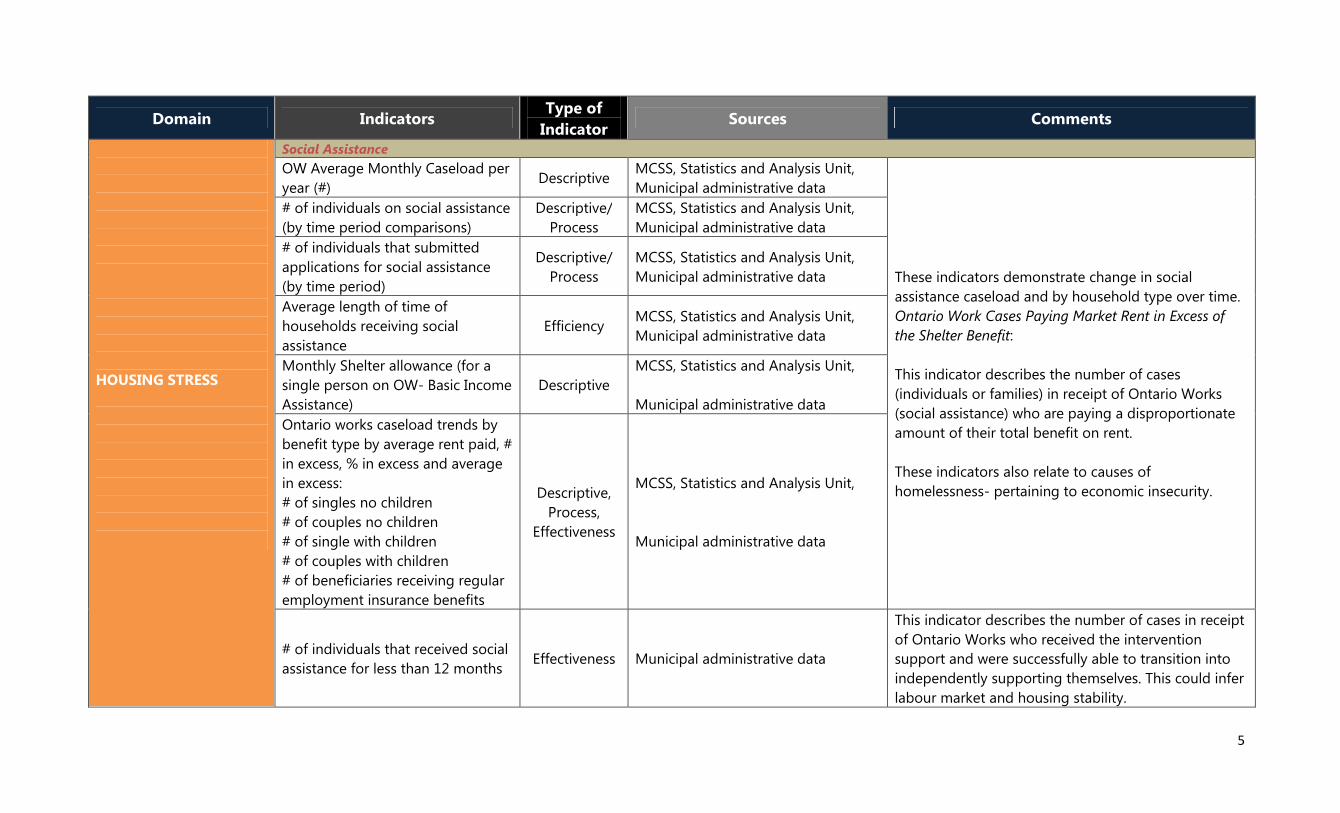
HOUSING STRESS
Social Assistance
OW Average Monthly Caseload per
year (#) Descriptive
MCSS, Statistics and Analysis Unit,
Municipal administrative data
These indicators demonstrate change in social
assistance caseload and by household type over time.
Ontario Work Cases Paying Market Rent in Excess of
the Shelter Benefit:
This indicator describes the number of cases
(individuals or families) in receipt of Ontario Works
(social assistance) who are paying a disproportionate
amount of their total benefit on rent.
These indicators also relate to causes of
homelessness- pertaining to economic insecurity.
# of individuals on social assistance
(by time period comparisons)
Descriptive/
Process
MCSS, Statistics and Analysis Unit,
Municipal administrative data
# of individuals that submitted
applications for social assistance
(by time period)
Descriptive/
Process
MCSS, Statistics and Analysis Unit,
Municipal administrative data
Average length of time of
households receiving social
assistance
Efficiency MCSS, Statistics and Analysis Unit,
Municipal administrative data
Monthly Shelter allowance (for a
single person on OW- Basic Income
Assistance)
Descriptive
MCSS, Statistics and Analysis Unit,
Municipal administrative data
Ontario works caseload trends by
benefit type by average rent paid, #
in excess, % in excess and average
in excess:
# of singles no children
# of couples no children
# of single with children
# of couples with children
# of beneficiaries receiving regular
employment insurance benefits
Descriptive,
Process,
Effectiveness
MCSS, Statistics and Analysis Unit,
Municipal administrative data
# of individuals that received social
assistance for less than 12 months Effectiveness Municipal administrative data
This indicator describes the number of cases in receipt
of Ontario Works who received the intervention
support and were successfully able to transition into
independently supporting themselves. This could infer
labour market and housing stability.
6
Domain Indicators Type of
Indicator Sources Comments
HOUSING
AFFORDAIBILITY
Shelter/Income Ratios (Core Need
Indicator) Descriptive
CMHC (data online). Every 5 years,
from census data. Many SM areas
will match geographic boundaries
used. Captures >30% shelter-to-
income ratio (i.e., half of renters, most
new buyers) but not >40%, >50%
STIR is an indicator of housing affordability and the
degree to which housing costs affect a household’s
ability to obtain other necessities such as food and
clothing.
This shelter cost to income ratio represents the
percent of income a household spends on shelter in a
given period. The ratio is calculated by dividing a
household’s before-tax annual expenditure on
housing by annual income.
# Incidence of renters in core
housing need
# Incidence of owners in core
housing need
# or % of aboriginal, lone parent,
recent immigrant, single person
households in core housing need
Descriptive CMHC Housing in Canada, Online
Database
Core housing need is a measure of the number of
households that are inadequately housed based on
affordability, physical condition of the dwelling and
size relative to the number of occupants. Households
in ‘core housing need’ are unable to afford shelter that
meets adequacy, suitability and affordability norms.
Affordability is recognized as a maximum of 30% of
the household income spent on shelter Core housing
need is not available for small areas.
# of owner households spending
30% of more of their income on
shelter (by income deciles)
Effectiveness/
Descriptive Statistics Canada, Census Series
This indicator describes the percentage of households
spending 30% or more of their income on shelter.
The indicator is a measure of housing affordability and
provides an estimate of the degree to which
households at each decile may be experiencing
financial stress due to homeownership and rental
costs
# of renter households spending
30% of more of their income on
shelter (by income deciles)
Effectiveness/
Descriptive Statistics Canada, Census Series
# of renter and owner households
spending 50% or more of their
Effectiveness/
Descriptive
Canada Mortgage and Housing
Corporation (CMHC). 2006 Census
This indicator is a measure of serious housing
affordability problems, where households in core
7
Domain Indicators Type of
Indicator Sources Comments
HOUSING
AFFORDAIBILITY
income on shelter Housing Series, Households Spending
at Least 50% of Their Income on
Shelter Research Highlight
housing need spend more than half (50%) of their
households income on their rent and mortgage and
utilities. The proportion of the household budget that
must be spent on shelter is so high that they cannot
pay other expenses. This indicator is a measure of the
availability of affordable housing. It can demonstrate
the degree to which different household types may
have trouble finding or keeping housing because of
the cost. Tenants are especially vulnerable to changes
in the housing market.
211 CALLS FOR SERVICE
# of calls related to housing
Process and
Effectiveness
211 Ontario, Data request
These are a set of indicators that demonstrate demand
for type of social and human services. It can highlight
changes in the number of calls made, information
about referral service for people who are homeless or
at risk of homelessness. Monitoring the trends can
also provide an understanding of demand for
supports and services.
# of calls related to shelters 211 Ontario, Data request
# of calls related to addiction and
counselling
211 Ontario, Data request
# of calls related to emergency
food- food banks and soup
kitchens
211 Ontario, Data request
# of calls related to health issues 211 Ontario, Data request
# of calls related to income and
financial assistance
211 Ontario, Data request
# of calls related to food and meals 211 Ontario, Data request
# of calls related to legal and public
safety
211 Ontario, Data request
# of calls from individuals at risk of
homelessness
211 Ontario, Data request
# of calls related to assistance with
arrears
211 Ontario, Data request
# of calls related to assistance with
utility charges
211 Ontario, Data request
8
Domain Indicators Type of
Indicator Sources Comments
INCOME
Income quintiles by tenure by
family type
(Family type (hybrid category) = 2
parent, 1 parent, multifamily, non-
family, senior couple, single senior)
Descriptive Custom Analysis, Statistics Canada,
Census, Tax Filer Data
This indicator describes the distribution of income for
families and single people. It provides a measure of
how equitably wealth is distributed as well as the
relative income status and level of need for
households and individuals.
Income quintiles are best because they facilitate
comparison over time.
Equivalent data can be used for social housing
tenants, to break out trends in market rental, where
greatest income/social change may be occurring.
# or % Low income families, non-
family persons, all persons Descriptive
LICO or LIM, Statistics Canada, Tax
Filer data
This indicator provides a measure of potential demand
for subsidized housing to meet the needs of low-
income households of various types
Use standard measure either Low-Income Cut Off or
LIM.
There are 3 main household categories for low income
(unattached = singles)
# or % Low income seniors Descriptive LICO or LIM, Statistics Canada, Tax
Filer data
# or % Low income non-senior
unattached Descriptive
LICO or LIM, Statistics Canada, Tax
Filer data
# or % Low income recent
immigrants- family Descriptive
FCM Indicator (QOLRS Municipal
Data Collection Tool)
This indicator provides a measure of potential demand
for subsidized housing to meet the needs of low-
income households of various types.
# of EI recipients (count of
caseload)
Descriptive/
Process Local Municipal data
These are three main indicator categories of
government transfer income.
# of GAINS recipients (count of
caseload)
Descriptive/
Process Local Municipal data
# of OW & ODSP recipients (count
of caseload)
Descriptive/
Process
OW local Municipal data, MCSS
Program Data (OW, ODSP)
9
Domain Indicators Type of
Indicator Sources Comments
INCOME
Median Household Income Descriptive Statistics Canada, Census
Median household income is used as a measure to of
a household’s ability to obtain suitable housing at a
price they can afford. Median household income is
based on before-tax household income. The median is
the midpoint in income distribution. It gives an
indication of the relative economic position for
households and individuals and the change over time
Income of tenant households Descriptive Statistics Canada, Census Series This indicator compares tenant incomes by household
type.
Average Rents compared to
Average Wages:
• Average Rent
• Average Wages
• OW Shelter Allowance
Descriptive
Statistics Canada, Labour Force
Survey, CMHC, Rental Market Survey
This indicator measures the increases in rental housing
costs and its relative change in relation to wages and
Ontario Works shelter benefit. It is an
indicator/measure of the degree to which individuals
are able to keep pace with changing rents.
EMPLOYMENT
Occupation (age 25-65) by
community (5-6 broad categories) Descriptive
Statistics Canada, Census; Planning
departments or economic
development agencies
These can identify gaps and provide information to
support related spheres that impact housing
outcomes. This information is a fundamental driver of
population change and housing issues.
Education (age 25-65) by 5-6 broad
categories
Unemployment Rate Descriptive Statistics Canada, Census Series
The status of the labour market related to
unemployment will dictate the pressures on the
housing market, social assistance and social housing
waiting list. High unemployment rates will mean a
more demand for affordable housing or supports to
assist vulnerable households.
10
Domain Indicators Type of
Indicator Sources Comments
EVICTIONS
Eviction Rate Descriptive,
Effectiveness Local Municipal Data
This information can demonstrate the housing
pressures faced by households. Eviction rates can be
reported for social housing providers to demonstrate
evictions as a result of arrears or non-arrears.
Trending data may be significant in understanding
how many households are exiting out of RGI housing.
As an effective ness indicator eviction rates can
demonstrate the impact of policies such as Tenant
Retention or Eviction Prevention Strategies to mitigate
eviction and retain housing.
# of applications to the Ontario
Rental Housing Tribunal for
termination of tenancy for rental
arrears
Descriptive
Ontario Rental Housing Tribunal;
Some information may be available
through Municipal Departments-
Housing Units; Non-Profit Housing
Provider Data, Social housing data
about evictions.
Ontario Ministry of Attorney General
This indicator describes the annual number of
applications to the Ontario Rental Housing Tribunal by
landlords to terminate tenancies for rental arrears, and
the number of eviction orders issued by the Tribunal.
It provides a measure of economic pressures in the
rental housing market and eviction trends. Data
gathered through this indicator can act as a base line
for future years. *Access to tribunal application may
be restricted due to privacy reasons.
# of tribunal orders to evict on the
grounds of rental arrears Descriptive
# of applications from private
landlords Descriptive
SETTLEMENT SERVICES
# of clients served for housing
related matters Descriptive
Settlement Service Agencies,
Administrative Data; United Way
administrative data. CIC data. Data
may be available through Ontario
Council of Agencies Serving
Immigrants (OTIS) Online Tracking
and Information System.
This indicator describes the number of
newcomers/refugees that are using Settlement
Services for housing assistance. There may be other
types of data collected through settlement service
agencies: (clients facing evictions, loss of housing,
domestic violence, negotiations with private landlords,
providing guarantor letters)
# of newcomers and refugees
served with housing related issues Descriptive
Client usage statistics of housing
help programs/services Descriptive
# of clients requesting searching
for housing Descriptive
# of cases requesting legal
assistance related to property and Descriptive
11
Domain Indicators Type of
Indicator Sources Comments
rental issues
LEGAL CLINICS
# of clients served experiencing
domestic violence
Descriptive /
Process
Local Legal clinic administrative data These are indicators that can demonstrate the
assistance households require pertaining to their
housing situations.
# of clients served relating to
tenant/landlord issues
Descriptive /
Process
# of clients using duty counsel at
the Landlord and tenant board
Descriptive /
Process
# of clients served relating to
government service issues (i.e.,
ODSP or OW benefits, CPP, CPP
disability pension)
Descriptive /
Process
# of Aboriginal clients served Descriptive /
Process Ontario Friendship Centres
12
Domain Indicators Type of
Indicator Sources Comments
HOUSING SYSTEM
HOMELESSNESS (The definition of homeless
people varies across
SMs/DSSABs. Homeless can be
visible street homeless, those
accessing the shelter system,
couch suffers, people who live
in insecure housing or housing
that is unsafe)
# of homeless (street count of the
unsheltered homeless)
Trends reported by street patrol
staff (if applicable)- profile, ‘new’
street people, aboriginal count
Descriptive
Street Needs Assessment;
While it is common knowledge
that there are homeless
people, there is a lack of
regional consistency in
definitions. Different
methodologies for counting
homeless people make it
challenging for comparisons.
Despite these challenges, it is
important to recognize the
presence of homeless people
and their housing needs
This indicator gives a profile of people who are living on the
street. Street life is transient by nature, making it hard to
count the number of people accurately. This is not a
definitive measure of the number of people living on the
street, but can it can help build an understanding of the
nature and extent of street homelessness.
Not all SM undertake point in time street counts.
# of homeless (point in time
counts) Descriptive
Point in Time Counts; Studies
undertaken that may provide a
count of the homeless.
Homeless counts are ‘snapshots in time’, and are generally
intended to measure the number of people who lack
permanent, safe, adequate and/or affordable housing. A
conservative estimate can be made using point in time
counts, however it is difficult to estimate the total number of
people who are homeless or at risk of homelessness,
including people who live rough on the street, double up in
inadequate housing, living temporarily with family or friends,
spend the majority of their income on rent.
Length of time homeless:
Average days in emergency shelter
and/or transitional housing
(households with children,
Descriptive,
Effectiveness
HIFIS, SM Administrative data,
SM may set up to collect and
monitor this particular data
This indicator can be used to demonstrate a reduction or
increase in the length of time that people are homeless.
13
Domain Indicators Type of
Indicator Sources Comments
HOMELESSNESS
households without children, all
households)
Return to Homeless after exit to
permanent housing: % of
households that exited to
permanent housing in the prior
year that returned to services
during the current quarter
(households with children,
households without children, all
households)
Descriptive,
Effectiveness
HIFIS, SM Administrative data,
SM may set up to collect and
monitor this particular data
This indicator can be used to demonstrate- decrease or
increase returns to homelessness after exit to permanent
housing.
First time homeless
# of households entering
emergency shelter or transitional
housing not recorded as being
served in the past year (households
with children, households without
children)
Descriptive
HIFIS, SM Administrative data,
SM may set up to collect and
monitor this particular data
This indicator can be used to demonstrate the number of
households entering homelessness for the first time.
# of homeless veterans Descriptive Local agencies
This indicator may demonstrate veterans returning from wars
or service that have become homeless due to physical
disabilities and mental illnesses resulting from combat.
Streets to Home Program or Similar Programs
# of homelessness placed in
housing Effectiveness SM- Program Data, Local
These indicators demonstrate the effectiveness of supports
and program interventions to that move people from
unstable housing conditions into stable housing. It can
illustrate housing stability.
# of ex-homeless still in housing 6
months later Effectiveness SM- Program Data, Local
# of people/households who have
been supported to move from
streets to homes
Effectiveness SM- Program Data, Local
14
Domain Indicators Type of
Indicator Sources Comments
HOMELESSNESS
Criminal Justice System
# of homeless in correction
facilities
Process,
Effectiveness
Ministry of Community Safety
and Correctional Services
(MCSCS)
John Howard Society, Ontario
Other local agencies that
provide supports and services
to ex-prisoners
This is an indication of the incidence of homelessness in
outside the periphery of the streets or living in shelters. # of prisoners with no fixed address
Descriptive
# of prisoners leaving with no
housing plan in place
Effectiveness This is an indication of rehousing issues.
# of individuals using ‘post-
incarceration housing supports
services
Effectiveness
Ministry of Community Safety
and Correctional Services; John
Howard Society; local agencies
This data may not always be available. However tapping into
local agencies serving incarcerated individuals could provide
an indication of issues and housing supports required to
maintain housing successfully and for re-integration into the
community
Trends reported by street patrol or
police Descriptive
SM, Policy Department
Statistics
Indicators may provide information to demonstrate the
number of homeless arrested for various types of activities.
# of Offenders under probation
supervision living in settled and
suitable accommodation
Effectiveness
Ministry of Community Safety
and Correctional Services
(MCSCS); Or local agencies
This indicator could demonstrate reduction in reoffending
and housing stability.
EMEREGENCY SHELTER
Shelter Capacity
Annual Shelter Occupancy rate
Descriptive,
Process,
Effectiveness
Federation of Canadian
Municipalities, QOLRS
Municipal Data Collection tool
(Available only for some SM)
Similar data can be collected
through HIFIS
These indicators provide an indication of shelter capacity. It
can be used to assess supply vs. demand, mismatch between
need, services and potential long term need.
# of single men’s shelter beds Descriptive
# of single women’s shelter beds Descriptive
# of family shelter beds Descriptive
# of youth shelter beds Descriptive
# of aboriginal shelter beds Descriptive
15
Domain Indicators Type of
Indicator Sources Comments
EMERGENCY SHELTER
# of mixed shelter beds Descriptive Ontario Ministry of Community
and Social Services MCSS;
Administrative data (SM or
funders or providers);
Social Planning agencies;
Community entity (HPS);
Major providers (e.g., YWCA,
Salvation Army)
These indicators provide an indication of shelter capacity. It
can be used to assess supply vs. demand, mismatch between
need, services and potential long term need.
# of refugee shelter beds
Descriptive
# of beds available to provide
women experiencing homelessness Effectiveness
This indicator gives a measure of supply for emergency
shelter accommodation for specific groups.
# of emergency shelter bed nights
(for men, women no domestic
violence, women (domestic
violence)
Descriptive,
Process,
Effectiveness
# of beds for drug/alcohol,
rehabilitation/detox (for men, for
women)
Descriptive
Admissions to emergency shelters
# total persons in emergency
shelters
Descriptive
Municipal Administrative Data
Ontario Ministry of Community
and Social Services
Homeless Individuals and
Families Information System
(HIFIS)
The indicator describes the number of different individuals
staying in shelters one or more times on an annual basis. This
data can be collected between time periods. Data for all
persons can include (adults and children) staying in funded
shelters and provincially funded abused women’s shelters.
# total children in emergency
shelters Descriptive
This indicator describes the number of different children who
have stayed in shelters. Data for children in shelters can be
collected and reported for different time periods. Data for
children can include staying in municipally funded shelters
and provincially funded abused women’s shelters.
Total number of admissions to
shelters in SM area (document by
time period)
Descriptive Local Municipal Administrative
Data; HIFIS
Indicator will demonstrate increases and decreases in shelter
usage, but also links to interventions such as production of
new social housing, reduction or increases in social
assistance benefits by the Province.
16
Domain Indicators Type of
Indicator Sources Comments
EMERGENCY SHELTER
# or % of single persons
# or % of single-led parent
w/children
# or % of two parents w/children
# or % of couples
Descriptive
Ontario Ministry of Community
and Social Services; Local
Municipal Administrative data
This indicator describes characteristics of individuals and
families using shelters in Toronto.
# of individual/households
classified as ‘episodic use of
shelters’
Descriptive
Effectiveness
Local Municipal Administrative
Data
This indicator describes people who use shelters on an
‘episodic’ basis meaning that they stayed in a shelter more
than (3) times in a given years. It gives a measure of the
number of people who go through multiple episodes of
homelessness. EPISODIC USE OF SHELTERS
# of different (unique) individuals
using the shelter system in a year
Process,
Effectiveness
Federation of Canadian
Municipalities, QOLRS
Municipal Data Collection tool
This indicator describes the number of different individuals
who have used the shelter system. Only available for some
SM areas
# of women and # of children that
stayed in a VAW shelter
Descriptive
There are varying data sources:
Local Municipal Administrative
Data; HIFIS, Local Agency client
records
This indicator describes characteristics of individuals and
families using shelters in Toronto.
Indicators listed below relate to the total number of admissions to
emergency shelters. Time series data may be valuable for
comparisons purposes. This indicator gives a measure of overall
demand for emergency shelter accommodation.
Average occupancy rate for the
VAW shelters
Descriptive
#of single men in an emergency
shelter
Descriptive
# of single women in an emergency
shelter
Descriptive
# of families in an emergency
shelter
Descriptive
Annual hostel and shelter
admissions (singles) Process
The following series of indicators describes changes and
trends in the profile of individuals and families who have lost
their housing and become homeless.
Annual hostel and shelter
admissions (families) Process
Annual hostel and shelter
admissions total individuals Process
17
Domain Indicators Type of
Indicator Sources Comments
EMERGENCY SHELTER
Annual hostel and shelter
admissions- total children Process
Local Municipal Administrative
Data; HIFIS
# of shelters for women and
children leaving a situation of
domestic violence
Process
Local Municipal Administrative
Data; HIFIS, Local Agency client
records
Average length of stay in
emergency shelters
Process,
Effectiveness
Federation of Canadian
Municipalities, QOLRS
Municipal Data Collection tool
This indicator can demonstrate the number of different
households and individuals admitted to emergency shelters,
using time series data. This indicate can provide a
conservative estimate of the number of homelessness
people.
CHIPI Indicators
# of nights a household spends in
emergency shelter Effectiveness
Local Municipal Administrative
Data, Local Agency statistics
These are CHIPI outcome indicators that relate to people
experiencing homelessness obtain and retain housing
# of households moved from
homelessness to transitional
housing
Effectiveness Local Municipal Administrative
Data, Local Agency statistics
These are CHIPI outcome indicators that relate to people
experiencing homelessness obtain and retain housing
# of households moved from
homelessness to long-term
housing
Effectiveness Local Municipal Administrative
Data, Local Agency statistics
These are CHIPI outcome indicators that relate to people
experiencing homelessness obtain and retain housing
# of households moved from
emergency shelter to long-term
housing
Effectiveness Local Municipal Administrative
Data, Local Agency statistics
These are CHIPI outcome indicators that relate to people
experiencing homelessness obtain and retain housing
# of supports and services provided
to households experiencing
homelessness that are not related
to the provision of accommodation
but contribute to a positive change
in housing status
Effectiveness Local Municipal Administrative
Data, Local Agency statistics
These are CHIPI outcome indicators that relate to people
experiencing homelessness obtain and retain housing
18
Domain Indicators Type of
Indicator Sources Comments
TRANSITIONAL
HOUSING
# of transitional housing units Descriptive
Local Municipal Administrative
Data, Local Agency statistics-
program records; Survey of
clients
Transitional housing is intended to offer a supportive living
environment and tools and opportunities for social and skills
development. It is an intermediate step between emergency
shelters and supportive housing, with limits on the length of
stay.
These indicators can demonstrate the effectiveness of
interventions relating to permanent housing of the homeless
who are willing and able to work towards self-sufficiency. The
indicators can demonstrate:
• stable residency, once permanent housing is provided;
• greater reliance on employment rather than incomes
support
• programs; and
• increased income from employment or welfare programs.
# of clients applying for transitional
housing during the reporting
period
Descriptive
# and % of new clients accepted for
services during the reporting
period
Process
# and % of households/persons in
transitional housing
Process/
Descriptive
# and % of clients who move to
long-term housing within 24 month
of entry
Effectiveness
# and % of clients who maintain
safe and permanent housing for 6
months or more
Effectiveness
# and % of clients who do not re-
enter the homeless system within
one year of obtaining permanent
housing
Effectiveness
SUPPORTIVE HOUSING
# of existing provincial mental
health supportive housing units Descriptive
Ontario, Ministry of Health and
Long Term Care, Data Request
This indicator demonstrates the number of people who need
affordable housing plus support services to help them stay in
their housing. Supportive housing refers to housing that has
support services attached.
# of new provincial mental health
supportive housing units Effectiveness
Ontario, Ministry of Health and
Long Term Care, Data Request
This indicator measures the number of new supportive
housing units that have been added to the overall supply in
an area.
# of special needs & supportive
units in non-profit/co-ops Descriptive
Ontario, Ministry of Health and
Long Term Care, Data Request,
Providers, SM administrative
This indicator describes the number and type of supportive
housing units in social and private rental housing.
19
Domain Indicators Type of
Indicator Sources Comments
SUPPORTIVE HOUSING
data
# Provincial rent supplement-
supportive/Violence Against
Women units
Descriptive
Ontario, Ministry of Health and
Long Term Care, Data Request,
Providers, SM administrative
data
# of persons with serious mental
illness and addictions Descriptive
SM admin data; Major
Providers; LHIN; LHIN funded
agencies; Social planning
agencies or special studies;
MCSS regional office,
Community living agencies
These indicators demonstrate the number of people who
need affordable housing plus support services to help them
stay in housing.
# of persons with physical
disabilities and mobility
impairments
Descriptive
# of persons with development
delays Descriptive
# of hard to house/long term
homeless placed in supportive
housing
Descriptive
Effectiveness
# of dedicated supportive housing
beds Descriptive
# of domiciliary hostels with # of
beds Descriptive
# of senior assisted living units Descriptive
SOCIAL HOUSING
# of social housing units Descriptive Municipal Data, SMAIR,
Administrative Data
These indicators provide a profile of the social housing stock
and by type.
% or # of Non-Profit and Co-op
units Descriptive
Administrative Data
(SM/DSSAB)
# of Other Federally Administered
Co-op units Descriptive
Administrative Data
(SM/DSSAB)
# of rent supplements Descriptive Administrative Data
(SM/DSSAB)
# of private landlord rent Descriptive Administrative Data These are descriptive indicators of the social housing stock in
20
Domain Indicators Type of
Indicator Sources Comments
SOCIAL HOUSING
supplement units (SM/DSSAB) a SM area. It can also be used to demonstrate supply vs.
demand. # of housing allowances Descriptive
Administrative Data
(SM/DSSAB)
# of social housing units where
tenants pay rent geared to income Descriptive
Administrative Data
(SM/DSSAB)
# of Market/Low-end market units Descriptive Administrative Data
(SM/DSSAB)
# of Bachelor & 1-bed units; # of
2&3 Bedroom Units; # of Low Rent
& Ltd. Dividend Units
Descriptive Administrative Data
(SM/DSSAB)
# of social housing units vs. waiting
list demand (waiting list as a % of
social housing units)
Process,
Descriptive,
Effectiveness
SMAIR; SM Waiting List data;
ONPHA This indicator provides a comparison of the number of
households on the wait list relative to number of RGI units.
# of households leaving subsidized
housing in arrears Effectiveness
Administrative Data
(SM/DSSAB)/ HSC Arrears
Database
This indicator demonstrates households at the risk of