22
Time-Based Competition (Key to Growth & Prosperity in Manufacturing, Office, & Service Industries ) Jim McCarthy April 6, 2015 © Product Ventures, Inc. - Eden Prairie,MN. 1
| Date post: | 07-Aug-2015 |
| Category: |
Documents |
| Upload: | james-f-mccarthy |
| View: | 118 times |
| Download: | 1 times |

Time-Based Competition
(Key to Growth & Prosperity in Manufacturing, Office, & Service Industries )
Jim McCarthy
April 6, 2015
© Product Ventures, Inc. - Eden Prairie,MN. 1

What is the One Resource?
That can’t be:1. Rented2. Leased 3. Or Bought
At any Price!
2 2

3
Time
“Time waste differs from material waste in that there can be no salvage. The easiest of all wastes, and the hardest to correct, is this waste of time, because wasted time does not litter the floor like wasted material.” - Henry Ford, 1926

Time Drives Everything: (The Short List)
4
1. Customer Satisfaction2. Industry Reputation3. Safety4. Quality5. Production6. Morale (less frustration)7. Revenue8. Profits9. Process Variation 10. Forecasting11. Inventory12. Cash Flow13. Growth14. Job Security15. Continuous Improvement

Why Reduce Lead Time?
1. Customers want what they want when they want it.
2. Customers could care less about our “work days” or “shift schedules”
3. As customers trim staffs , inventories, & their lead times, they will require 24/7 time reductions from us
4. International customers especially sensitive to Time-Based suppliers
5

Lead Time Reduction Why do it?
Time-Based Competitors: (as compared to competitors in same industry)A. Grow at least three times faster1
B. Two times more Profitable1
C. For every quartering of lead time, productivity of labor & of working capital can often double & costs reduced by 20%1
D. Introduce new products four times faster2
E. Inventory turns two to four times higher3
1. Competing Against Time, Stalk & Hout, pp. 77-782. ibid, p. 1103. ibid, p. 157
6
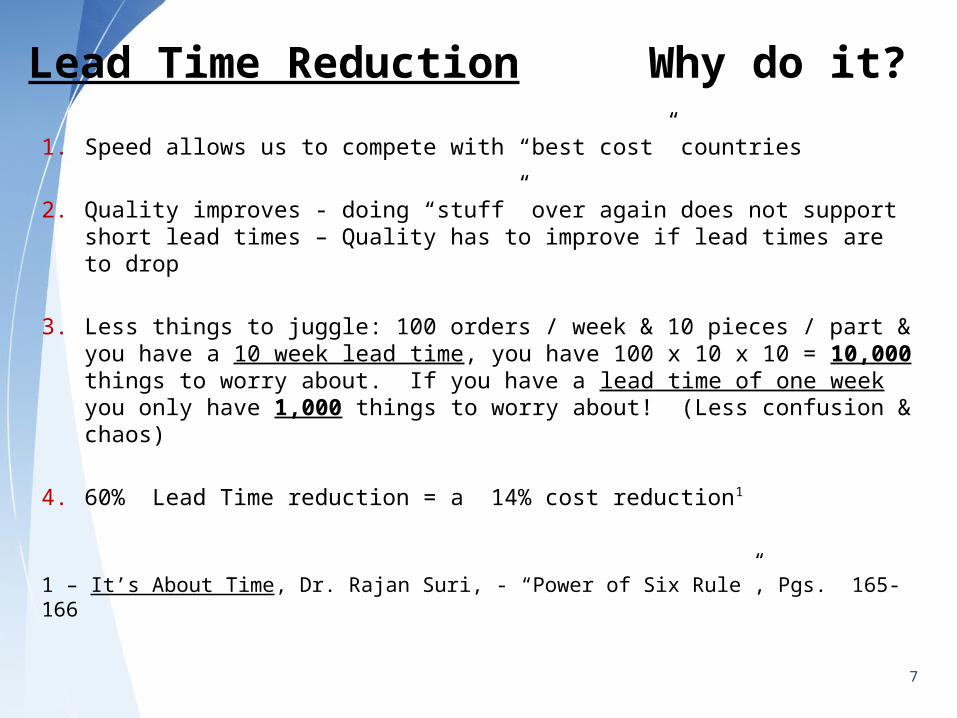
Lead Time Reduction Why do it?
1. Speed allows us to compete with “best cost” countries
2. Quality improves - doing “stuff” over again does not support short lead times – Quality has to improve if lead times are to drop
3. Less things to juggle: 100 orders / week & 10 pieces / part & you have a 10 week lead time, you have 100 x 10 x 10 = 10,000 things to worry about. If you have a lead time of one week you only have 1,000 things to worry about! (Less confusion & chaos)
4. 60% Lead Time reduction = a 14% cost reduction1
1 – It’s About Time, Dr. Rajan Suri, - “Power of Six Rule”, Pgs. 165-166
7

Lead Time Reduction Have Multiple Plants? Why should
all do it?1. As more & more projects pass through multiple
plants, we need to shorten overall lead times.
2. Customers will require shorter lead times no matter how many plants their products go through.
3. To do this, we need to pool our resources across plants to develop enhanced improvement techniques for meeting these challenges.
8

Ability to Embrace Customers Who are in a Hurry!
1. The least attractive customers are those who will wait for what they want.
2. The least attractive customers are those who will wait because the price they want to pay is low compared to the prices the more impatient customers will pay.
3. Time-based businesses let their competitors have the patient customers while they embrace the impatient ones.
9

Will it Work in the Office?
Continuous Improvement in the Office CanBe a “New Frontier” For Many Folks – This is all about “people” & not tools!
Some Common Myths & Perceptions:1. Continuous improvement applies to “shop” only2. “Intellectual” & “creative” tasks can not be structured3. Measurement of office work is not possible4. Every job is too different to apply any improvement tools5. Automation is the 1st & only choice for office improvement
10

Office Project: “Customer Order to Acknowledge”VA= Value Added Time ; NVA = Non Value Added Time
11
Parameter “Was”(March 6,
20007)
“Is”(June 12,
2007)
Delta(Difference)
% Improve-
ment
Remarks
Total Lead Time
(Average)
67.88 Hours
11.30 Hours - 56.6 Hours 83.4 %6 Times Faster
Total Lead Time
(Worst 10)
104-306 Hours
51-120 Hours
-53 to –186 Hours 51% - 61%
Inventory (Average) 155 Orders 36 Orders -119 Orders 77%
VA/NVA Ratio 0.29% 1.58% +1.29% 445% VA “was”
12 Minutes
Distance Walked
9,111 Feet(1.73 miles)
2,620 Feet(0.49 Miles)
-6,498 Feet(1.22 Miles)
71.3%(Distances
are Per Day)

Metric Baseline (2013- Jan.-Aug., 2013
As of March 2014
Delta(Diff.)
% Improv-ement
Remarks
Lead Time (Average)
27.14 Days
11.65 Days
15.49Days
57% Charter Target = 50%
Lead Time StandardDeviation
37.2 Days
13.31Days
23.89Days
64%
95th Percentile Days
96.1Days
37.5Days
58.6 Days
61%
On-Time %
33% 86% 53% 161%53% “absolute”
& 161% “relative”
Average Days Tardy
13.27 Days 1.11Days
12.16Days 91.6%
12 Times Better
(1.2 Orders of Magnitude)!
Quoting Results as of 2014
12
13
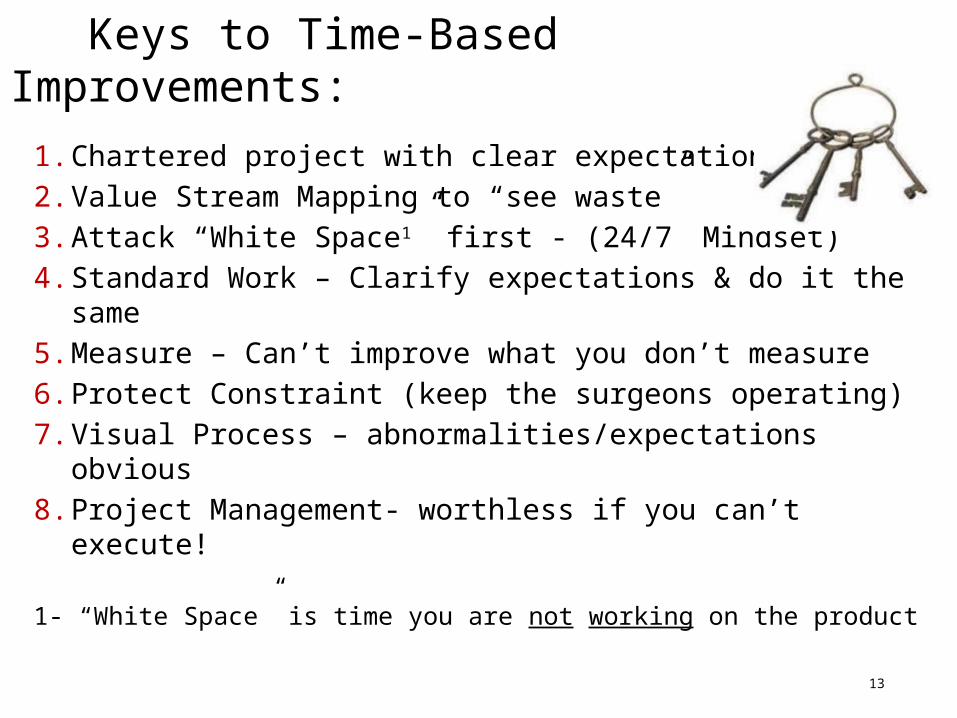
Keys to Time-Based Improvements:
1. Chartered project with clear expectations2. Value Stream Mapping to “see waste”3. Attack “White Space1” first - (24/7 Mindset)4. Standard Work – Clarify expectations & do it the same5. Measure – Can’t improve what you don’t measure6. Protect Constraint (keep the surgeons operating)7. Visual Process – abnormalities/expectations obvious8. Project Management- worthless if you can’t execute!
1- “White Space” is time you are not working on the product
13

What Should it Look Like?
Visual Management Triangle
We See Together
We ActTogether
We Know Together
14

15
Review Order
OP 10 - CS
Computer
Screen 251
Gadget Data
A 10
1.00Cycle Time Mins
6Operators Staff
B 20
0.00Cycle Time Mins
Create Account No.(CFS)
Account No. Required?
Yes
Verify Account No.
OP 10.1 - CS
1.0 Mins
18.0 Hrs 0 Hrs
0.25 Mins
0 Hrs
0.1 Hrs
0 Mins
4 Hrs
0.25Cycle Time Mins
6Operators Staff
0.25 Mins
No
A 30
NAR Required ?
Create NAR(Engineering)
0.00Cycle Time Mins
Yes
0.0 Mins
2 Hrs
Schedule Order
6Operators Staff
1.00Cycle Time Mins
0 Hrs
0.25 Mins
0.0 Hrs
1.0 Mins
OP 10.3 – CS
A 60
No
A 50
D 50
Schedule. Aceptable ?
Computer
Screens 264 & 175
A 70
0.25Cycle Time Mins
0.25 Mins
A20
0.25Cycle Time Mins
0.25Cycle Time Mins
6Operators Staff
Yes
OP 20 – Sched.
ATP
A80
1.50Cycle Time Mins
13 Hrs
1.50 Mins
Short Parts?
0.0 Hrs
Contact Buyer
OP 20.1 – Sched.
A100
0.50Cycle Time Mins
1Operators Staff
0.25 Mins
0.0 Hrs
Yes (14% of orders)
0.50 Mins
Contact Supplier
OP 20.2 – Purch.
A110
5.00Cycle Time Mins
.75 Hrs
5 Mins
OP 20.3 – Supplier/Purchasing
2.00Cycle Time Mins
3Operators Staff
A120
1.5 Hrs
2.0 Mins
Contact Scheduler
OP 20.4 – Purch.
A130
0.50Cycle Time Mins
3Operators Staff
1.0 Hrs
0.50 Mins
Enter Order
4.00Cycle Time Mins
7Operators Staff
OP 30 – CS OP 30.1 – CS
Print Acknowledgement
0.50Cycle Time Mins
7Operators Staff
OP 30.2 – CS
Distribute Acknowlegement &
Order
0.50Cycle Time Mins
OP 30.3 – CS
Verify Acknowledgement
(Inspection)
1.00Cycle Time Mins
A140 A150 A160 A170
11 Hrs
4 Mins
9.5 Hrs
0.50 Mins
0.25 Hrs
0.50 Mins
12.0 Hrs
1 Mins
0.30 Hrs
OP 30.4 – CS
Fax Acknowledgement
0.50Cycle Time Mins
0.50 Mins
A180
Computer
Screen 252
Supplier Response
Fax To Customer
Computer
Screens 264 & 175
42% Req’d %
1Operators Staff
6Operators Staff
1Operators Staff29
Orders(Inventory)
Docs
13
Orders(Inventory)
Docs
1Operators Staff
24
Days
Hrs
60
Hrs
Mins
0.30
% Req’d
%
5
Wks
Days
0.25Cycle Time Mins
3Operators Staff
1Operators Staff 6Operators Staff 6Operators Staff
Create Mfg. Order
Units Converter
Summary
67.30Non Value Added Hrs
12.05Value Added Mins
Summary
9118Distance Trav. Ft.
155Inventory Ahead Pcs
T 10
T 20
16
Orders(Inventory)
Docs
7
Orders(Inventory)
Docs
12
Orders(Inventory)
Docs
16
Orders(Inventory)
Docs 24
Orders(Inventory)
Docs15
Orders(Inventory)
Docs
Distance Trav.
Ft.1116
23
Orders(Inventory)
Docs
1Operators Staff
Distance Trav.
Ft.2520
Current State Value Stream Map – Tescom (Elk River) - Customer Order to Acknowledgement VSM (Ops 10- 30)
(Exploded From Original Current State VSM Dtd. 1/23/07) - J.F. McCarthy – 4/16/07- Original Issue – Rev. (none)
42% Req’d %
CustomerOrders
No
Plant & Customer Data
4.53Takt Mins
T 30
12% Req’d %
All Info. OK ?
0.25Cycle Time Mins
5.00Cycle Time Mins
No
0.25 Mins
0.35 Hrs
5 Mins
4 Hrs
0.0 Hrs
NO
A40
C 40
A90
0.0 Hrs
0.50 Hrs
Customer
0.0 Hrs
6Operators Staff
6Operators Staff
0.0 Hrs
Yes
Different Operators(30.3 is inspection)
HP = Via Email
21Operations No.
Based on 90 orders per day & 408 available
minutes / Day
Ground Rules & Assumptions:
1.) Actual Inventory taken from an averaged calculation of 9 days; inclusive dates from: 2/15/07-2/27/07 by Cust. Service group.
2.) NVA & VA times taken from Data Tagging Sheets (120 customer orders- using averaged data) and/or known estimates. In most cases data was rounded to the next highest incremental value to be conservative. Inclusive dates for data collection: 2/26/07- 3/6/07 (7 work days)
3.) Shaded process blocks represent “Shared internal & external Resources” .
4.) NAR % based on 20 working days of data from Feb.,26 - Mar., 26, 2007
5.) % values shown associated with contingent operations are % of total orders processed and not % split at decision point/s.
Contact Customer(Customer Service)
1Operators Staff
IC = Via
Paper
2.5 Hrs
Reduce NVA time
Reduce NVA time
Reduce NVA time
Reduce NVA time
14% of orders 14% of orders
100% of orders
58% of orders
42% of orders
58% of orders
42% of orders
42% of orders
100% of orders
4% Req’d %
Distance Traveled is total per Day
(9,118 Ft. = 1.73 miles)
640
Distance Trav.
Ft.
640
Distance Trav.
Ft.
1630
Distance Trav.
Ft.
1400
Distance Trav.
Ft. 1172
Distance Trav.
Ft.
0.30 VA / NVA x 100 = (%)
%
Consider eliminating 30.2 & 30.3 – do self inspection
Pg.15
Value Stream Mapping – Shows Opportunities for
Time-Based Improvements

16
Touch Time
White Space
Working on product 3.2% of time! : 032 x 100= 3.2%
4 hrs. 10 hrs. 6 hrs. 4 hrs.
Order Capture6 days
Phase 110 days
Phase 28 days
Write/Send Report7 days
Total Lead Time = 31 days
Work on 97% or 3% to Reduce Overall Time?
Total Touch Time = 24 Hrs. (1day)
4 Total Operations in Our Example(Customer wants product in 21 days vs. 31 days)

Metrics
Rule One of Lean Metrics:You can’t improve (or lead) what you don’t measure!Imagine you are at a Twins baseball game & there is no
scoreboard – wouldn’t you feel cheated?……
Always establish baselines and measure results on an on-going basis to display progress.
Measure the “process” not the people. – Empower improvement by changing the System.
Use pareto charting (80 /20 rule) to establish the “critical few”.17

Without “Real Time” Visual Metrics:
It’s like trying to drive forward by looking in your Rear View Mirror!
18
Page 9Company Confidential
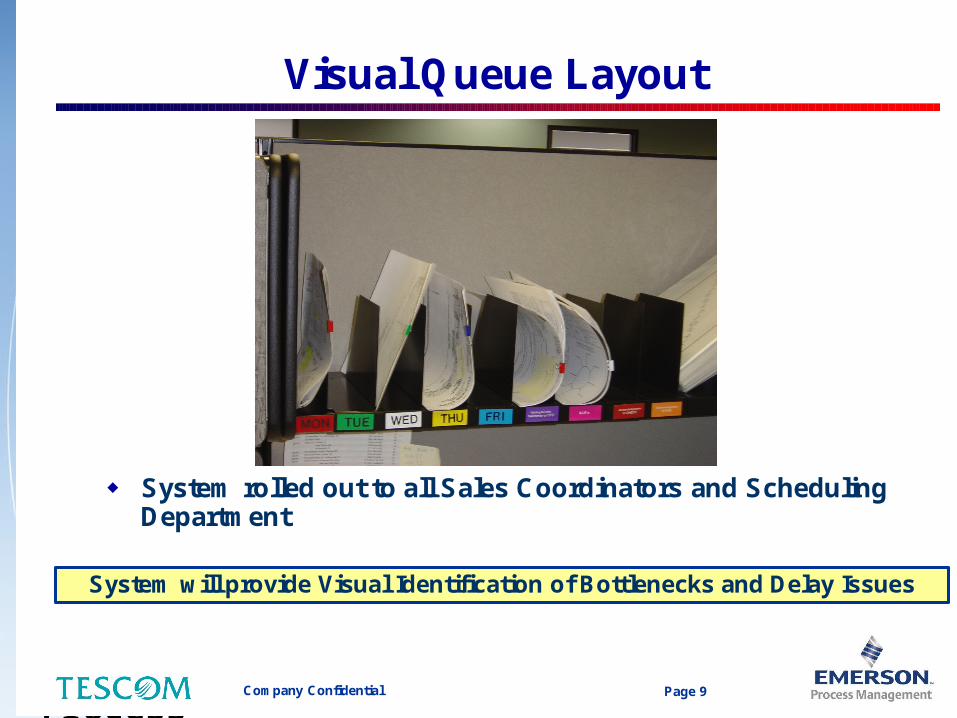
Visual Queue Layout
System rolled out to all Sales Coordinators and Scheduling Department
System will provide Visual Identification of Bottlenecks and Delay Issues
19
Bins (Modified Post Picture):• To Scheduling
• NARS to Engineering
• NARS
• Waiting for Customer Info.
• Waiting to Print Acknowledgement
• Acknowledgements to Fax
Prototype Bin System Shown
Two Bins Added Later In Project
19 Customer Order to Acknowledge Process
19

20
2
12
Daily stand-up meetings
Quoting - Standard Work for Flow – I.D.: GSW-QUOT- 001 Travel Path = Receipt of Request For Quote to ‘Quote Submission’ (to Customer) Drawing Scale: (Not to Scale) Original Issue 11/19/13 – J. McCarthy (Preliminary version 2/13/14) Distribution:
1
Standard Work Sequence
Note: Pitch times are Per Pitch Schedule – (PPS) Flow is pictorially shown for one estimator & is typical for all estimators
2
4
5
6
7
8
8A
9
Minimum Cell / Operator Requirements – (Metrics & Audits)
Metrics / Chart Name (Form No./I.D.)
Frequency Remarks
24/7 Process Time (L014)
1X /day (Min.)
Prog. Mgm’t.____________ Date________ Finance ____________ Date_________Sales_______________Date________ Materials _________Date_______
FIFO
3
6
10
General Notes & Instructions:
Display Metrics, Audit Record, & B.O.K.
Time
7 - 8 AM
8 - 9 AM
9 -10 AM
10 -11 AM
11-12 Noon
12 – 1PM
1 - 2 PM
2 – 3 PM
3 – 4 PM
4 – 5 PM
PM’s
PM’s
PM’s
Est./SA
SA
SA
EST.
SA
SA
EST.& SA
Pitch Schedule (Time Slicing) by Function Monday – Friday (except holidays)
“MS Outlook®” to be programmed for required pitch schedule alerts
Estimating__________________Date_______ Quality _________ Date_____
Matl’s.
Matl’s.
Matl’s.
Finance
FA/Cont.
FA
FA/Cont.
Pitch #
1
2
3
4
5
6
7
8
9
10
Metrics War Room Metrics
MetricsMetrics
Me
tric
s
Me
trics
P40 (Big Lake)
P10 (New Brighton)(unless otherwise noted)
Metrics Metrics
Estimator # 3 (LH)
Seven Program Managers
Between Plant 10 & 40(not co-located)
P10 or P40
Quoting Manager (CS)
Office(Estimator # 5)
Standard Work Audit (L020)
See RemarksTier 1 (Quoting Mgr.) – Weekly; Tier 2 (Sales
Mgr.) - Monthly, Tier 3 (Gen. Mgr.) Bi-Monthly
Quality – Data Tracking (L006)
Daily as issues occur
Operator Station Metrics Boards (L061)
Daily (see remarks)Update inventory & pitch per pitch schedule,
update delays & absences when known.
Cell Meeting Attendance (L003)
Daily (Mon-Fri.)
Cross Training (L015) Monthly
Program Manager (PM) (or other recipient) receives RFQ via. email, faxes, mail, etc., fills in Quotation Qualification Checklist xxx, & sends same to Sales Admin. (PPS).
Sales Admin (CU)
Estimator # 2 (PB)
Estimator #1 (DS)
Electronically coupled to P10
Sales Admin. (SA) creates Funnel I.D. # in Funnel & transfers drawings into Vault (PPS). SA Assigns estimator per Est. Qualification Matrix/SWIP limits & emails (with funnel symbol).
Estimator (Est.) does “quote/no quote” evaluation (PPS) & completes checklist (# xxxxxx). (“No quotes” excluded from flow unless vetoed by management within 2 calendar days.)
Est. creates BOM, outside RFQ (checklist XXX), & sends to Materials (PPS). Est. requests any missing data from customer. Est. continues process until stopped due to information flow. Est. Pre-schedule Management Review Meeting ≥3 days ahead.
Customer RFQ
1
Suppliers
12
22
34
Materials reviews & sends to outside suppliers for RFQ with expectations for timing, receives/reviews supplier quote & sends (no SWIP limit on return) to respective estimator (PPS).
5
5
Est. roughs-in cost planner, estimates hours, evaluates equipment needs, & non reoccurring costs per WI- xxxxxx & finalizes once step # 5 is complete. (PPS)
Est. reviews Quote with Operations: (machine capacity/availability) & Engineering (technical & manpower ) - PPS
Operations &Engineering Review 8
Finance prepares, approves, & sends (no SWIP limit on return) Multi-Year Cost Plan to requesting estimator (PPS). Advise RTI Corp. ≥ 3days before formal submittal.
Est.: If quote is ≥$1MM (≥$0.75MM-Government), send to Finance to prepare Multi-Year Cost plan (PPS). If below these thresholds skip steps 8/8A & go to step 9.
Est. reviews with internal management (PPS), makes required changes until approved & notifies SA of DOA approval.
SA sends quote to customer within 4 hrs.
7
To Finance
8A
To Originating Estimator
7
9Customer
10
(A) SWIP levels not to be violated without Quoting Mgr. approval. Notify Mgr. within 4 hours if SWIP is, or could be, exceeded
(B) SWIP levels are “RFQ” items except for Materials’ items which are per materials (supplier) RFQ item
To Sales Admin.
QRM No. Monthly
5S Monthly Quoting Manager
(C) SWIP levels to be posted at each work station: Estimating, Materials, & Finance – Update Operator WIP metrics when changes are known.
(K) Value Stream members are expected to “flex” (help in all areas) where lead time goals could, or are, being compromised.
(G) Pitch schedule variances are to be reported to Quoting Mgr. prior to next “due” pitch increment.
“Passing” must be authorized by
Quoting Mgr.
(H) “Pitch compliance” (per pitch schedule) is: inspection for, & action on, quoting elements & related requests/actions to support Std. Work goals.
#
Pitch&
Metrics log
StationStatus
Total Station Inventory(circle SWIP- max. or range).
Move markers to show inventory in all 3 locations
(see Key & WIP/SWIP notes)
Number @ Remote locationsSuppliers, Customers, etc.
Number of Quotes
‘Not Started’# #
Typical Operator Station Metrics Board - updated
daily & reset monthly (Form: L061)
Key: Symbols & Abreviations:
BOM = Bill of Materials,SWIP = Range of, or Max.(if no range shown) allowable work in process PPE = Per Pitch Schedule (Pitch = product movement times)BOK = Book of Knowledge (stores cell data)
Electronic communication (primarily email) =
FA = Financial Analyst, Cont.= Controller PM = Program Manager, SA= Sales Admin., Est.= Estimator, Matl’s. = Materials Department or Operator
RFQ = request for quotationWI = Work Instruction Q-ROC = Quick Response Office CellHVM = High Velocity MachiningPCA = Pumps, Controls, & ActuatorsFIFO = First in, First OutSW= Standard WorkOperation sequence (number) =
Walking =
Remote Location =
#
WIP (Work in
Process) Symbol
x
Remarks
SA (overall process), Matl’s., & Finance loops, before daily “stand-up” meeting (GSW-QUOT-002)
Tier 1 (Quoting Mgr.) – Weekly; Tier 2 (Sales Mgr.) – Monthly; Tier 3 (Gen. Mgr.) - Bi-Monthly
Shows opportunities for improvement (each operator)
Operators update inventory, pitch compliance, delays, & absences when known (“real time” basis). Retain in BOK (by Month)
Attendees fill out before daily stand-up meetings @ 8:30 AM (Agenda=GSW-QUOT-002)
Quoting Manager or Designee
Measures QRM No.,& lead time days for both average & 95th percentile
Prelim copy 2/13/14
#
SWIP (Standard Work in Process)
Symbol - circle around maximum
number or range (inside triangle)
Phantom Lines
Estimator I. D. #
PCALarge Assys.
HVM Hard
MetalsSpecialties
1 x x x2 x x x3 x x x4 x5 X x x x
Estimator Qualification Matrix (Major Areas)
Estimator # 4 (DK)
Vault (Drawings)
Funnel(Quote Data)
Quote Review Meetings
Finance (PH, BJ)
(L ) Materials & Finance Value Stream operators responsible/accountable for their entire “Loop’s” daily performance (Metrics & Continuous Improvement).
(J) Subordinate all resources to constraint (Estimating) - must ensure constant “work feed” and timely assistance to minimize “throughput” compromise.
(D) Reduction of inventory (WIP) is an “on going” goal to continually reduce lead times, provide spare capacity, & minimize “job passing”
Quote Win Rate Monthly % won & which jobs - SA
4
4
4
4
1
1
1
4
1
1
1-3
1-3
1
1
1
1-6 2
1-3
(E) Quoting Team may “collectively” change SWIP (Max. & Range levels) to support trials for continuous improvement. (Must advise Quoting Manager).
(S) Quote review & approval requirements shown in “Quote Approval Schedule” – Official DOA documents govern in case/s of conflict
(M) Quoting team & support/review functions are responsible for pre-arranging backup coverage (in their absence) to ensure cell performance & reporting
(O) Quotation Qualification Checklist “(xxxx)” completion required by quote requestor, & Quoting Manager approval prior to any quoting activities.
Approval Notification
9A
9A SA receives DOA approval & files same. (PPS)
% on Time, No of Quotes Submitted
MonthlyShows customer % on time & no of quotes
submitted during month - SA
(See Page #2 for current 24/7 timeline expectations & “start date” probabilities.)
“No Quote”
Est. Mgr.
Reviews &
sorts “Quote/
No Quote” @
7:30-8:30 AM.
V.P. Sales &
Est. Mgr.
confirm @ 4PM
DOA / Review
‘Same Day’
Review
Required
Except
RTI
Corporate =
3 Days
(24/7)
Max.
(F) Capacity triggers (with prioritization) to address SWIP violations/variances to be posted & updated by Quoting Manager
(N) Shared resource definitions-need to define for estimators (what takes priority & what % of time is committed to authorized RFQ’s ????????
(Q) Max ‘work ahead window’ = 7 days ahead of actual “projected lead time” to meet customer date (based on RFQ complexity/current lead time & WIP)
(I ) “Trouble Bin” (reviewed daily @ stand-up meetings) for “job issues”, Customer time extensions , potential or actual ‘need date’ misses, etc.
Trouble “Trouble Bin”- reviewed daily
for ‘flow issues’ & countermeasures
WIP & SWIP
Staffing & Accountability
Flow & Pitch
Scheduling & System Controls
Review & Approvals
Quote Approval Schedule
Est. Mgr.or
PM
SalesVP
PMDirector
FinanceController
(Multi-Yr. Plan)
GeneralMgr.
RTICorp.
≤250K X>250K - 1MM X X X
>1MM X X X X X X750K - 1MM (U.S. Gov. only)
X X X X X X
Quote $ ValueK=1,000
MM=1,000,000
Quote Review Functions Required to Approve = X Yellow Highlighted = Declaration of Authority (DOA) Requirement
Materials JC,DG,NW,LS (As Req’d.)
SWIP shown is for entire Matl’s group
SWIP shown is for entire Finance group
(P) “Repeat Work” is to be quoted by applicable Program Manager & is not to be processed by this value stream which is intended to Quote “new work” only
(R) Requests with missing/incorrect information shall be returned to “upstream” provider (PPS) for correction to limit “defect flow” in quoting system
M
February 14
T W T F S S
1 2 3 4 5 6
7 8 9 10 11 12 13
14 15 16 17 18 19 20
21 22 23 24 25 26 27
28 29 30 1 2
Daily Issues
Pg. 20
“Standard Work for Flow” is Critical to Daily Time-Based Execution and Sustainability
(Rule Book on one sheet of paper)
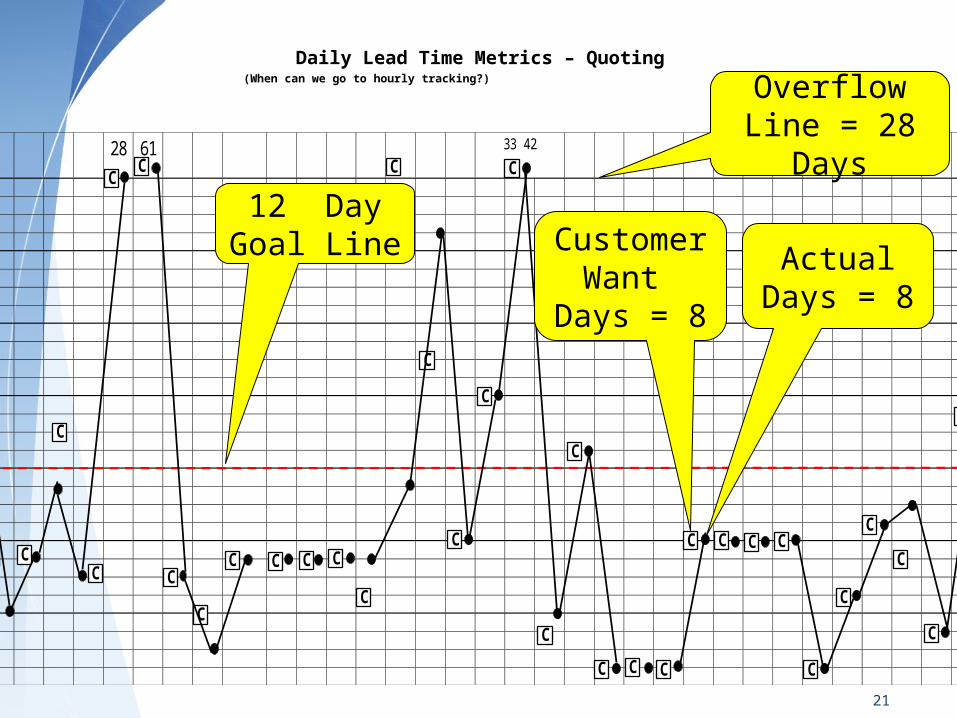
Daily Lead Time Metrics – Quoting (When can we go to hourly tracking?) Lead Time Metrics – Quoting
Daily Lead Time Metrics – Quotingcan we go to hourly tracking?)(When can we go to hourly tracking?)
21
28 61 33 42
C C
C
C
CC
C
C
C C C C
C
C
C
C
C
C
C
C
C CC C
C C C C
C
C
C
C
C
12 Day Goal Line Customer
Want Days = 8
Actual Days = 8
Overflow Line = 28 Days

Quoting-Daily Operator Metrics (Estimating, Materials & Finance)g - Daily Operator Metrics (Estimators, Materials, & Finance)
22
Total WIP
Total Not Started
Pitch Compliance
OperatorLoading (%)
Metrics Compliance
Absences & Issues (Daily)


