1 Houston Regional Benzene Air Pollution Reduction: A Voluntary Plan for Major Sources Report prepared by City of Houston Mayor’s Office of Environmental Programming Department of Health and Human Services Bureau of Air Quality Control February 2007 900 Bagby, 3 rd Floor, (713)-437-6961
Transcript
1
Houston Regional Benzene Air Pollution Reduction: A Voluntary Plan for Major Sources
Report prepared by
City of Houston Mayor’s Office of Environmental Programming
Department of Health and Human Services Bureau of Air Quality Control
February 2007
900 Bagby, 3rd Floor, (713)-437-6961
2
Houston Regional Benzene Air Pollution Reduction Plan for Major Sources
Overview of the Plan Objective: Benzene is a hazardous air pollutant that causes cancer. In the majority of the Houston region, ambient air concentrations of benzene exceed the Environmental Protection Agency’s (EPA) risk guidelines. In some parts of the region, notably east Houston and east Harris County, benzene concentrations also exceed the Texas Commission on Environmental Quality’s (TCEQ) guidelines. This plan will improve air quality in the region by reducing the ambient air concentrations of benzene over a five-year period.
Background: Improvement of air quality in our region protects the health of our population and stimulates economic development. Over the last two decades, we have substantially reduced ground level ozone by identifying its causes and implementing strategies to control its precursors. Recently, reports from the TCEQ (1), EPA (2), Houston Mayor Bill White’s Health Effects of Air Pollution Task Force (3), and Rice University/Houston Endowment, Inc. (4) indicate that, in the Houston area, ambient air concentrations of benzene are too high and must be reduced. This plan focuses on industrial point sources because they are the largest individual sources of benzene in the Houston area and contribute significantly to the unacceptably high levels of benzene in east Houston and east Harris County.
Mechanism: The City of Houston and other cooperating governmental, business, health, environmental and civic organizations will work with the largest emitters of benzene, who are identified in this plan. These sources will reduce their benzene emissions through enhancements to their facilities and operational practices to be accomplished on an agreed-to schedule over the next five years. Enhanced monitoring and accountability for reductions are components of the plan. To evaluate performance, we will track the concrete action of undertaken by facilities to reduce benzene emissions, the facilities’ benzene emissions inventories, fence line monitoring data, and ambient air data. Rationale: This Regional Benzene Reduction Plan for Major Sources is necessary because there is no legal or regulatory framework in place at the state or federal level to ensure that ambient levels of benzene in the neighborhoods in which we live and work, are maintained at healthful levels. Unlike ozone, fine particulate matter, carbon monoxide, lead, nitrogen dioxide, and sulfur oxides, there is no EPA designated National Ambient Air Quality Standard for benzene. The state of Texas has the authority to set standards for and to regulate ambient levels of benzene, as several other states have done, but the state has not done so to date. A regulatory structure that effectively limited the ambient level of benzene could result in significant consequences for industrial facilities, as have ozone standards. In the absence of a state or federal framework, which could be draconian, and outside of the adversarial context of costly litigation, the voluntary
3
cooperation of the largest emitters of benzene is the most expedient mechanism for obtaining significant reductions in ambient levels of benzene over the next five years.
Note: This plan focuses on the reduction of benzene from major sources. The reduction strategies in this plan will simultaneously reduce emissions and/or ambient air concentrations of six additional air pollutants that pose definite health risks according to the Health Effects of Air Pollution Task Force: ozone, fine particles, diesel particulate matter, 1,3-butadiene, formaldehyde and acrolein.
Benzene Concentrations and Major Source Emissions
Sources, Uses, and Emissions of Benzene: Benzene is an important chemical feedstock and product in today’s petrochemical industry. It is used as an industrial solvent and precursor in the production of drugs, plastics, synthetic rubber and dyes. Although benzene is a constituent of naturally occurring petroleum deposits, including crude oil and natural gas, it is typically produced from other compounds present in petroleum through chemical reaction processes such as steam cracking and catalytic reforming. According to the Association of Petrochemicals Producers in Europe (APPE), about 7.647 million tons of benzene were produced in North America in 2005.
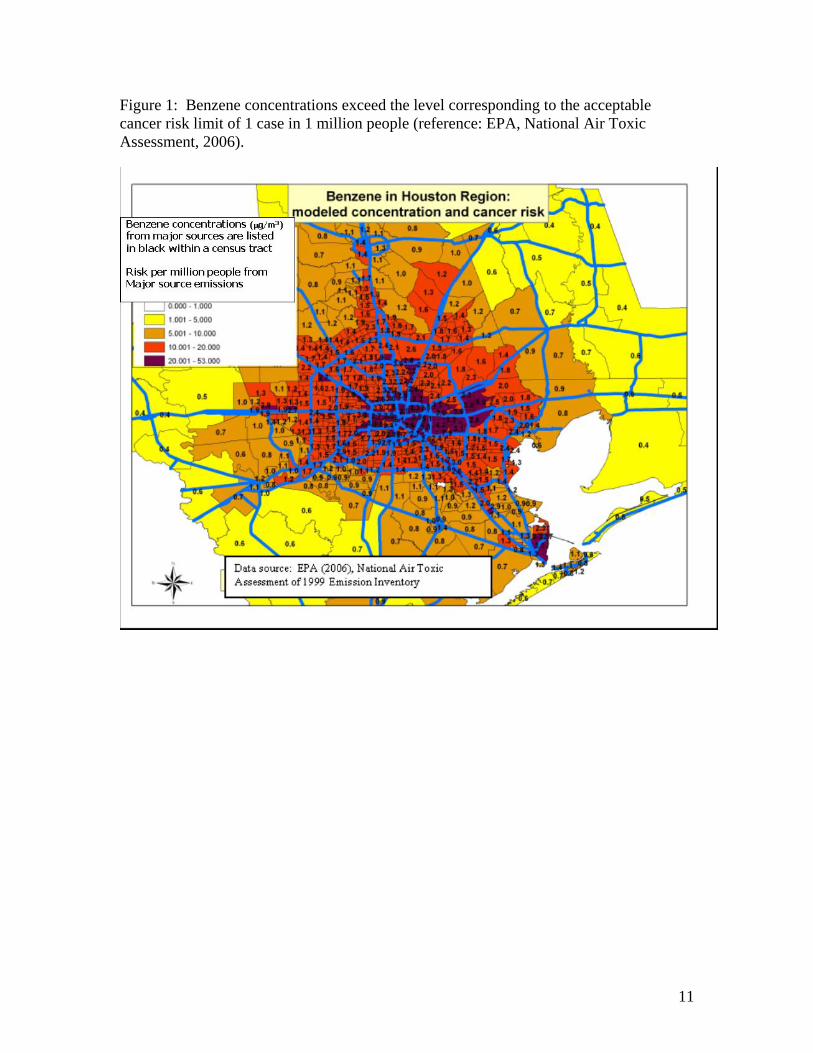
In the petrochemical industry, benzene is primarily used as an intermediate product to make other chemicals. Styrene, phenol and cyclohexane, which are benzene derivatives, are used to make polymers, plastics, synthetic rubber, resins, adhesives, and Nylon. Benzene is also used as a solvent in printing and paints and to make certain, dyes, detergents, drugs, and explosives. Benzene escapes from the petrochemical and refining process and enters the atmosphere through flares, tanks, transport pipes, loading and unloading facilities, cooling towers, wastewater treatment facilities, valves, flanges and other points. Given that benzene is a valuable commodity, its release is not only harmful to the health and the environment but also economically wasteful and unnecessary in the light of viable engineering technologies to recover and reuse hydrocarbons. In many cases, the expense of minimizing air emissions of benzene can be offset by product recovery. Benzene Concentrations and Cancer Risks: Benzene is well established as a carcinogen. When benzene is present in the ambient air, people who breathe the air are at increased risk for developing cancer. In order to protect public health, the EPA establishes probability risks that describe the number of people per million of population who will develop cancer as a result of exposure to benzene at particular concentrations. The EPA’s goal is that benzene should remain at or below the concentration level for which no more than one additional cancer case per 1,000,000 people will result. EPA expresses this probability risk as 1x10⁻⁶. The benzene concentration corresponding to 1x10⁻⁶ is 0.14 ppb or 0.45 µg/m3. The TCEQ has set a less stringent risk threshold level of ten cancer cases per one million people, expressed as 1x10⁻⁵, which corresponds to a concentration of 1.4 ppb or 4.5 µg/m3. The maps in Figures 1 and 2 show ambient air
4
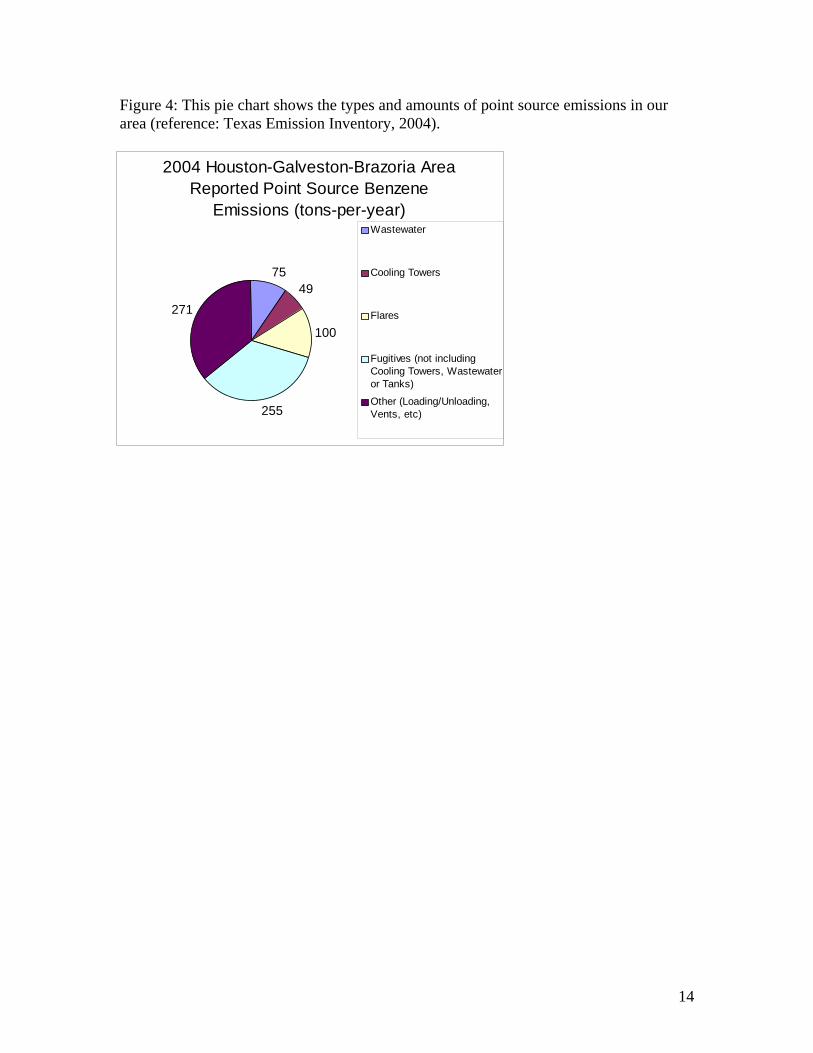
concentrations of benzene and corresponding cancer risks by census tract for the Houston area. Benzene Emissions from Mobile Sources: Benzene is emitted from the tailpipes of automobiles, SUVs and light duty trucks. The current gasoline mixture in Houston contains less than 0.95% (according to 40 CFR 80.41) benzene by weight. Benzene is emitted as it evaporates from the fuel system and from incomplete combustion. Since the 2004 model year, automobiles, SUVs and light duty trucks are manufactured with the federal government’s Tier 2 emission control system, which reduces benzene and other emissions through a combination of engine technology and cleaner fuels. This system will produce dramatic decreases in both volatile organic compound emissions, including benzene, and nitrogen oxides (NOx), as more older vehicles are retired and replaced with newer models. California requires a more stringent set of emission controls, which would further reduce ambient levels of benzene, other VOCs and NOx. The Texas Legislature is considering adoption of those standards this year and, if adopted, these standards will accelerate the process of reducing benzene emissions from vehicles. A disproportionate amount of on-road emissions come from high emitting, older vehicles. The emissions testing program helps identify these vehicles at their annual inspections. Vehicles not passing the emissions test require repairs to improve their emissions profile in order to pass inspection. The state of Texas supports the cost of repair or replacement of these vehicles for income-qualified residents through the Low Income Repair Assistance Program (LIRAP). The inspection program, coupled with LIRAP, helps make sure that the current fleet stays as clean as possible. The Texas Legislature is considering enhancing the LIRAP program this year, and this will further help reduce benzene emissions. Benzene Emissions from Industrial Sources: The largest emitters of benzene, as well as the largest number of benzene monitors, are located in the east Houston/east Harris County ship channel area. The map in Figure 3 shows the location of these emitters. According to the Texas Emissions Inventory, emissions of benzene from industrial sources are comprised as follows: wastewater (10%), cooling tower (6.5%), flares (13.3 %), fugitive-not including cooling towers, wastewater or tanks (34%) and miscellaneous-loading, unloading, vents (36.1%) (Figure 4). The facilities emitting the largest quantities of benzene within our region, as reported by the facilities to the TCEQ, are listed in Table 1. The facilities whose benzene emissions pose the greatest health risk because their concentrations result in exposure to people living in proximity to the facility, according to the EPA RSEI model, are listed in Table 2. The facilities that emit the highest levels of benzene and pose the greatest human health risks are listed in Table 3, and are the primary focus of this plan. Table 4 lists the remainder of the facilities from Tables 1 and 2, which will be addressed after those in Table 3.
5
Emission Reductions: Under this plan, facilities will commit to reduce their annual benzene emissions over a five-year period by undertaking the projects described in this plan, or other projects that yield similar or greater reductions. Benzene reductions by facility will be tracked using thee indicators:
• Emissions inventory: The facility’s annual emissions inventory will be compared to the 2004 baseline inventory.
• Fence line monitoring: Facilities will install fence line monitors and will report benzene levels annually.
• Ambient air concentrations: Upwind/downwind intra-monitor concentrations will be tracked annually.
Specific benzene reduction strategies for each facility listed in Table 3 are set forth in proposed individual facility plans. These initial plans will be modified following input from sources and stakeholders and consideration will be given to benzene reduction efforts that are planned or have already been implemented by the identified benzene emitters, if the reduction strategies go above and beyond the existing applicable requirements. The following essential features should be in all plans:
• Improved benzene monitoring around the site. The improved benzene monitoring will be designed so that impact analyses can be conducted that consider the upwind and downwind ambient concentrations of benzene, wind directions, wind speeds and other benzene sources. The goal of the improved monitoring will be to measure a baseline emissions impact from the site and measure subsequent improvements resulting from emissions reduction efforts.
• Enhanced operational strategies to identify and reduce benzene emissions. These strategies and procedures should employ state of the art techniques, like the passive optical gas infrared imaging cameras, to find leaks and other significant benzene emissions sources.
• Upgraded facilities and equipment to reduce the impact of the most significant sources of benzene at the site. The significance of each benzene source will be evaluated using the improved monitoring and implemented operational strategies and procedures.
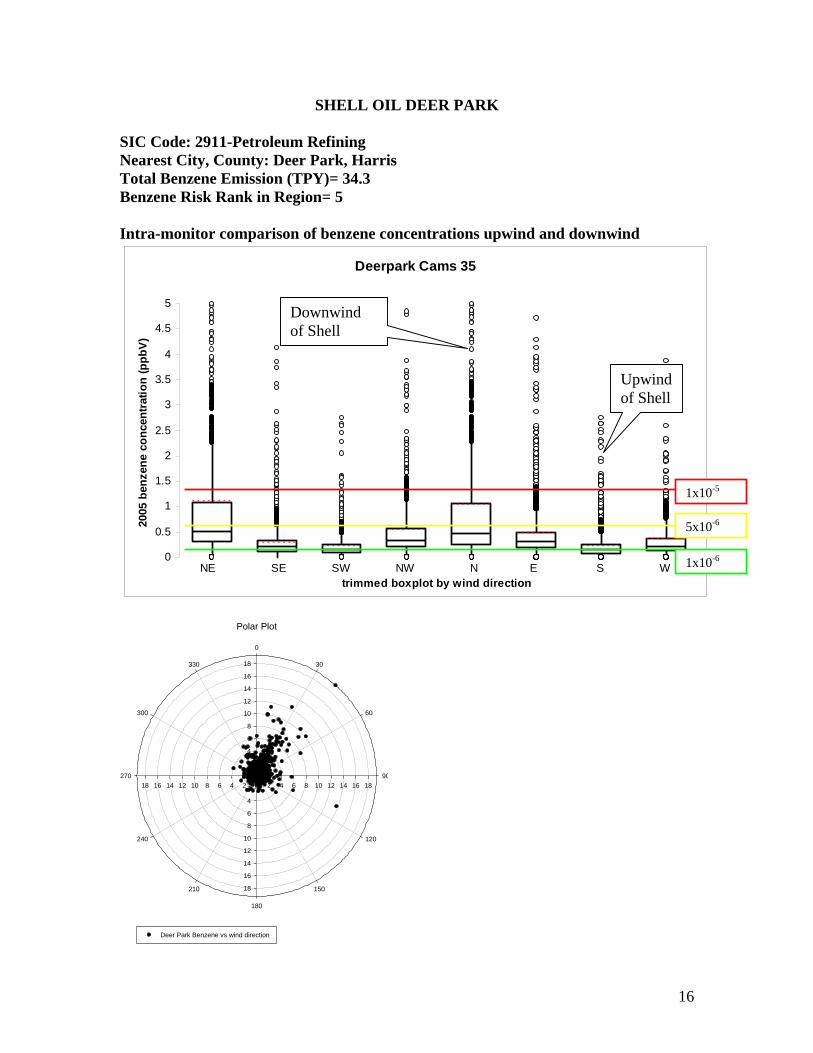
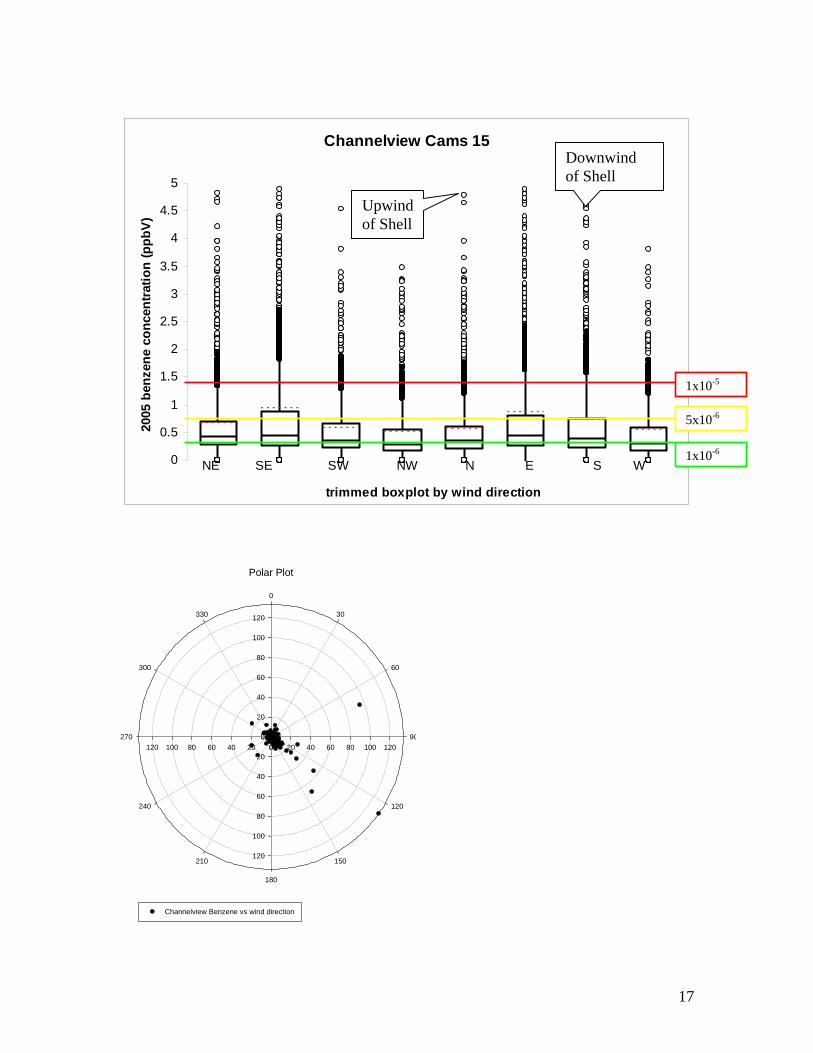
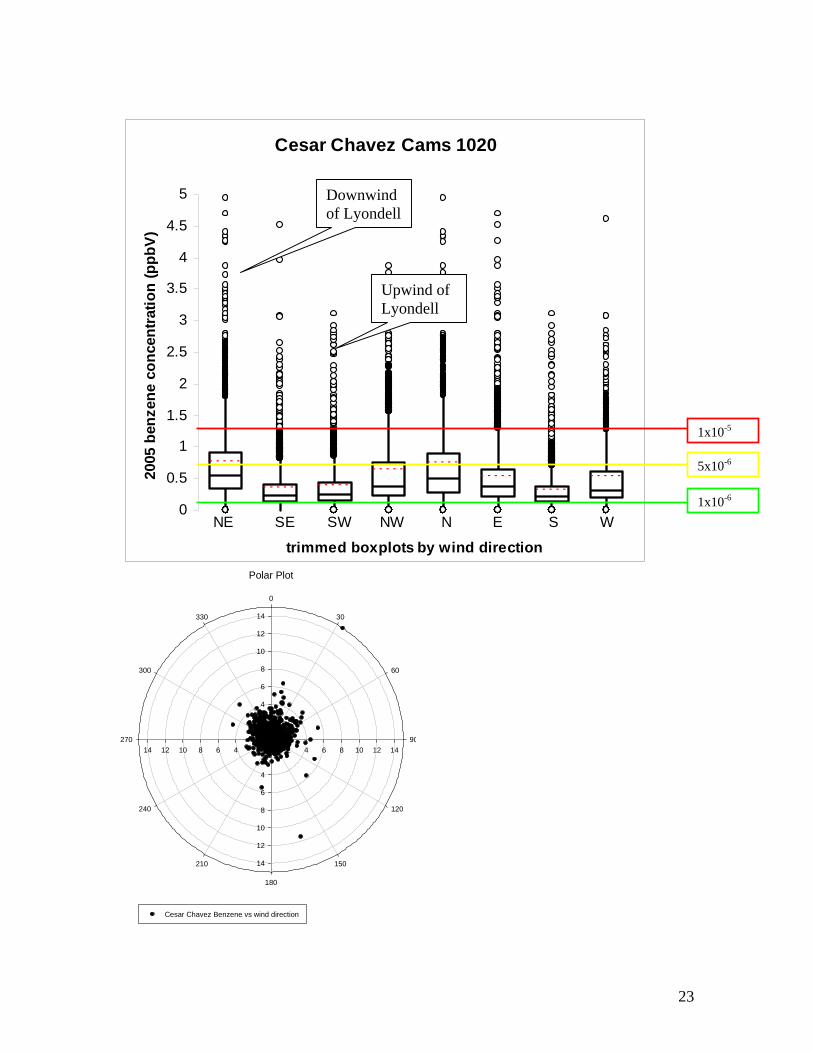
• Additional verification of reductions through ambient concentration trend tracking specific to a facility. The ambient benzene data from nearby autoGC monitors will be used to track the trend of benzene concentrations. The 2005 benzene data were divided by wind direction (concentrations measured at <2mph wind speed were eliminated). Boxplots indicate the up and down wind benzene profile at each site to establish the baseline. Verification of ambient benzene concentration trends will be statistically determined each quarter by the City of Houston’s BAQC using a suite of appropriate statistical techniques (e.g., nonparametric Mann Kendall, Sen Slope estimator, proportion tests and difference between up and down wind profiles).
Rewards for Benzene Reductions: In return for reductions, these facilities will have the benefit of becoming an industrial benzene reduction partner to the community by establishing a clean air legacy. In addition, because industrial benzene reduction partners are voluntarily committing to stricter standards than those required by law, often
6
requiring additional expense, the City of Houston and other sponsoring organizations will:
• Show public appreciation and praise for benzene reduction partners • Support participants in any enforcement actions brought by others arising out
of benzene emissions, if the participant is complying in good faith with their emission reduction plan
• Give credit for participation in developing inspection priorities and advocate for the same with other agencies
• Provide the "Benzene Reduction Partner" award level logo for marketing materials.
• Provide assistance/guidance from BAQC staff in developing benzene reduction strategies.
• Provide New Source Review permit support.
7
Table 1: This table lists the facilities, which emit the largest quantities of benzene in the 10 county region (reference: Texas Emission Inventory, 2004).
Regulated Entity Name SIC Code
Nearest City, County
Total Benzene Emissions
(Annual TPY) BP PRODUCTS NORTH AMERICA TEXAS CITY
2911-PETROLEUM
REFINING TEXAS CITY, GALVESTON 86.675
EQUISTAR CHEMICALS LP, CHANNELVIEW COMPLEX
2869-INDUSTRIAL
ORGANIC CHEMICALS
CHANNELVIEW, HARRIS 51.5511
EXXON MOBIL CHEMICAL BAYTOWN CHEMICAL PLANT
2869-INDUSTRIAL
ORGANIC CHEMICALS
BAYTOWN, HARRIS 49.5266
LYONDELL HOUSTON REFINING LP
2911-PETROLEUM
REFINING HOUSTON,
HARRIS 41.7735 EXXON MOBIL CHEMICAL BAYTOWN OLEFINS PLANT
2869-INDUSTRIAL
ORGANIC CHEMICALS
BAYTOWN, HARRIS 41.5693
SHELL OIL DEER PARK
2911-PETROLEUM
REFINING DEER PARK,
HARRIS 34.2546
DOW TEXAS OPERATIONS FREEPORT
2869-INDUSTRIAL
ORGANIC CHEMICALS
FREEPORT, BRAZORIA 31.8008
EQUISTAR CHEMICALS CHOCOLATE BAYOU COMPLEX
2869-INDUSTRIAL
ORGANIC CHEMICALS
LIVERPOOL, BRAZORIA 29.0378
LYONDELL CHEMICAL CHANNELVIEW
2869-INDUSTRIAL
ORGANIC CHEMICALS
CHANNELVIEW, HARRIS 28.947
EXXON MOBIL BAYTOWN FACILITY
2911-PETROLEUM
REFINING BAYTOWN,
HARRIS 26.105
8
Table 2: This table lists the facilities, which pose the greatest human health risk from benzene air pollution exposure in the 10 county region (reference: EPA, RSEI, 2003). Regulated Entity
Name SIC Code Nearest City,
County Risk Rank LYONDELL HOUSTON REFINING LP
2911-PETROLEUM
REFINING HOUSTON,
HARRIS 1 EXXON MOBIL CHEMICAL BAYTOWN CHEMICAL PLANT
2869-INDUSTRIAL
ORGANIC CHEMICALS
BAYTOWN, HARRIS 2
EQUISTAR CHEMICALS LP, CHANNELVIEW COMPLEX
2869-INDUSTRIAL
ORGANIC CHEMICALS
CHANNELVIEW, HARRIS 3
DOW CHEMICAL FORMERLY UNION CARBIDE TEXAS CITY
2869-INDUSTRIAL
ORGANIC CHEMICALS
TEXAS CITY, GALVESTON 4
SHELL OIL DEER PARK
2911-PETROLEUM
REFINING DEER PARK,
HARRIS 5 MARATHON PETROLEUM-TEXAS CITY REFINERY
2911-PETROLEUM
REFINING TEXAS CITY, GALVESTON 6
BP PRODUCTS NORTH AMERICA TEXAS CITY
2911-PETROLEUM
REFINING TEXAS CITY, GALVESTON 7
GEORGIA GULF CHEMICALS & VINYLS LLC
2865-CYCLIC ORGANIC
CRUDES AND INTERMEDIATES
PASADENA, HARRIS 8
EXXON MOBIL BAYTOWN FACILITY
2911-PETROLEUM
REFINING BAYTOWN,
HARRIS 9
LYONDELL CHEMICAL CHANNELVIEW
2869-INDUSTRIAL
ORGANIC CHEMICALS
CHANNELVIEW, HARRIS 10
9
Table 3: This table lists the facilities, which emit the largest quantities of benzene and pose the greatest human health risk from benzene air pollution exposure in the 10 county region (reference: EPA, RSEI, 2003).
Regulated Entity Name SIC Code
Nearest City, County
Total Benzene
Emissions (ANNUAL
TPY)
Benzene Risk Rank
BP PRODUCTS NORTH AMERICA TEXAS CITY
2911-PETROLEUM
REFINING TEXAS CITY, GALVESTON 86.7 7
EQUISTAR CHEMICALS LP, CHANNELVIEW COMPLEX
2869-INDUSTRIAL
ORGANIC CHEMICALS
CHANNELVIEW, HARRIS 51.6 3
EXXON MOBIL CHEMICAL BAYTOWN CHEMICAL PLANT
2869-INDUSTRIAL
ORGANIC CHEMICALS
BAYTOWN, HARRIS 49.5 2
LYONDELL HOUSTON REFINING LP
2911-PETROLEUM
REFINING HOUSTON,
HARRIS 41.8 1
SHELL OIL DEER PARK
2911-PETROLEUM
REFINING DEER PARK,
HARRIS 34.3 5
LYONDELL CHEMICAL CHANNELVIEW
2869-INDUSTRIAL
ORGANIC CHEMICALS
CHANNELVIEW, HARRIS 28.9 10
EXXON MOBIL BAYTOWN FACILITY
2911-PETROLEUM
REFINING BAYTOWN,
HARRIS 26.1 9
10
Table 4: This table lists the second tier of facilities that emit the largest quantities of benzene and pose the greatest human health risk from benzene air pollution exposure in the 10 county region (reference: EPA, RSEI, 2003).
Regulated Entity Name SIC Code County
Total Benzene
Emissions (ANNUAL
TPY)
Benzene Risk Rank
DOW CHEMICAL CO, PLANT B 2869 BRAZORIA 31.80 14 EQUISTAR, CHOCOLATE BAYOU CHEMICAL 2869 BRAZORIA 29.04 17 GEORGIA GULF CHEM & VINYLS LLC, PASADENA PLANT 2865 HARRIS 21.07 8 ROHM & HAAS TEXAS, DEER PARK PLANT 2869 HARRIS 18.69 11 STERLING CHEMICALS INC, TEXAS CITY PLANT 2869 GALVESTON 17.88 13 GOODYEAR TIRE AND RUBBER 2869 HARRIS 16.80 15 MARATHON PETROLEUM COMPANY LLC TEXAS CITY REFINERY 2911 GALVESTON 15.61 6
11
Figure 1: Benzene concentrations exceed the level corresponding to the acceptable cancer risk limit of 1 case in 1 million people (reference: EPA, National Air Toxic Assessment, 2006).
12
Figure 2: In a magnification of east Houston, the benzene risk, concentrations and general locations that exceed the TCEQ’s benzene ESL are shown (reference: 2005 monitor data (TCEQ), National Air Toxic Assessment, EPA (2006)).
Benzene concentrations (µg/m3) from major sources are listed in black within a census tract Risk per million people from Major srouce emission
13
Figure 3: Benzene emission points and benzene air monitor locations in East Houston/East Harris County are shown.
14
Figure 4: This pie chart shows the types and amounts of point source emissions in our area (reference: Texas Emission Inventory, 2004).
2004 Houston-Galveston-Brazoria Area Reported Point Source Benzene
SIC Code: 2911-Petroleum Refining Nearest City, County: Deer Park, Harris Total Benzene Emission (TPY)= 34.3 Benzene Risk Rank in Region= 5 Intra-monitor comparison of benzene concentrations upwind and downwind
Deerpark Cams 35
0
0.5
1
1.5
2
2.5
3
3.5
4
4.5
5
trimmed boxplot by wind direction
2005
ben
zene
con
cent
ratio
n (p
pbV)
NE SE SW NW N E S W
Polar Plot
0 2 4 6 8 10 12 14 16 180
2
4
6
8
10
12
14
16
18
0246810121416180
2
4
6
8
10
12
14
16
18
0
30
60
90
120
150
180
210
240
270
300
330
Deer Park Benzene vs wind direction
Upwind of Shell
Downwind of Shell
1x10⁻⁵
5x10⁻⁶
1x10⁻⁶
17
Channelview Cams 15
0
0.5
1
1.5
2
2.5
3
3.5
4
4.5
5
trimmed boxplot by wind direction
2005
ben
zene
con
cent
ratio
n (p
pbV
)
NE SE SW NW N E S W
Polar Plot
0 20 40 60 80 100 1200
20
40
60
80
100
120
0204060801001200
20
40
60
80
100
120
0
30
60
90
120
150
180
210
240
270
300
330
Channelview Benzene vs wind direction
Downwind of Shell
Upwind of Shell
1x10⁻⁵
5x10⁻⁶
1x10⁻⁶
18
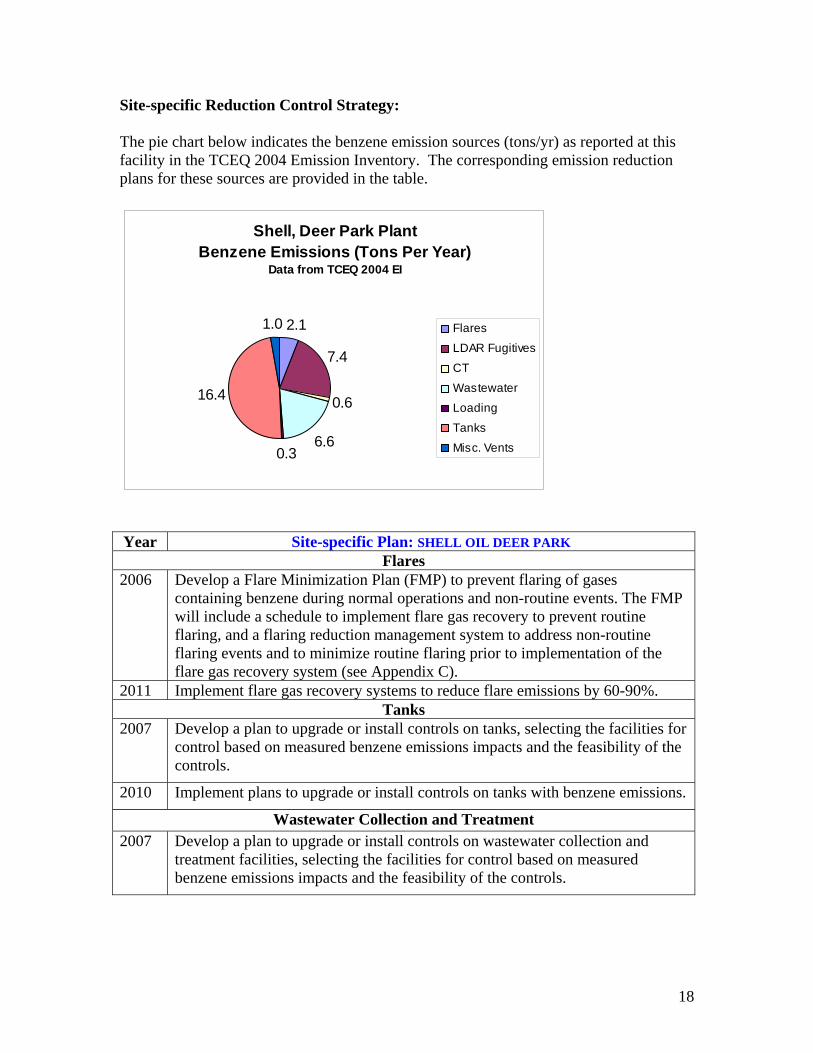
Site-specific Reduction Control Strategy: The pie chart below indicates the benzene emission sources (tons/yr) as reported at this facility in the TCEQ 2004 Emission Inventory. The corresponding emission reduction plans for these sources are provided in the table.
Shell, Deer Park PlantBenzene Emissions (Tons Per Year)
Data from TCEQ 2004 EI
2.1
7.4
0.6
6.60.3
16.4
1.0 Flares
LDAR Fugitives
CT
Wastewater
Loading
Tanks
Misc. Vents
Year Site-specific Plan: SHELL OIL DEER PARK
Flares 2006 Develop a Flare Minimization Plan (FMP) to prevent flaring of gases
containing benzene during normal operations and non-routine events. The FMP will include a schedule to implement flare gas recovery to prevent routine flaring, and a flaring reduction management system to address non-routine flaring events and to minimize routine flaring prior to implementation of the flare gas recovery system (see Appendix C).
2011 Implement flare gas recovery systems to reduce flare emissions by 60-90%. Tanks
2007 Develop a plan to upgrade or install controls on tanks, selecting the facilities for control based on measured benzene emissions impacts and the feasibility of the controls.
2010 Implement plans to upgrade or install controls on tanks with benzene emissions.
Wastewater Collection and Treatment 2007 Develop a plan to upgrade or install controls on wastewater collection and
treatment facilities, selecting the facilities for control based on measured benzene emissions impacts and the feasibility of the controls.
19
Year Site-specific Plan: SHELL OIL DEER PARK 2010 Implement plans to upgrade or install controls on wastewater collection and
treatment facilities.
LDAR Fugitives 2007 Accept a 100-ppm leak threshold definition for monitored fugitive components
that contain benzene, which are part of an existing leak detection and repair program and make first repair attempts within one day of leak detection for leaks from monitored fugitive components that contain benzene.
2007 Initiate an investigation to find and correct contributing conditions within four hours of measuring a significant net impact from the site. The significance threshold will depend on the baseline ambient monitoring data, and will be reduced over the five-year period as monitoring verifies reductions over time.
2008 Utilize a passive optical gas imaging instrument to perform startup and quarterly site-wide surveys of leak detection and repair program components, tanks, vents, wastewater collection and treatment facilities and loading and unloading operations. Leaks detected with the passive optical gas-imaging instrument must be confirmed with tradition leak detection methods (Method 21) and/or seal inspections, and the leaks must be corrected according to applicable leak repair time frames. If there is not an applicable leak repair time frame, a leak repair plan must be developed and implemented so that the leak will be repaired within a reasonable amount of time.
Quantifiable and Verifiable Reductions: Monitoring 2008 Initiate monitoring at locations along or adjacent to the north and south or
northwest and southeast property lines to verify emissions reductions and measure impacts.
2008 Make benzene monitoring data available through a web-based application (such as the TCEQ's monitoring data internal web page) and provide an automated email notification to the City of Houston when the hourly average net benzene impact from the site exceeds the current significance threshold.
2008 Submit an annual report to the City of Houston, within 60 days after the end of each calendar year in the five-year period. The annual report must include the estimated amount of benzene emissions that were reduced during the year compared to a designated baseline year as a result of participation, the estimated net annual average benzene impact from the site in ppb (through modeling and using the fence line monitoring data once fence line monitoring has been implemented), a description of projects implemented during the year, dates that each project was implemented and a schedule for each project that has not yet been implemented. If all required reductions have not been implemented by the end of the fourth year of the agreement, a final report will be due after one complete calendar year where no emissions reduction projects were implemented.
20
LYONDELL HOUSTON REFINING LP
21
LYONDELL HOUSTON REFINING LP
SIC Code: 2911-Petroleum Refining Nearest City, County: Houston, Harris Total Benzene Emission (TPY)= 41.8 Benzene Risk Rank in Region= 1 Intra-monitor comparison of benzene concentrations upwind and downwind
Clinton Cams 403
0
0.5
1
1.5
2
2.5
3
3.5
4
4.5
5
trimmed boxplot by direction
2005
ben
zene
con
cent
ratio
n (p
pbV
)
NE SE SW NW N E S W
Polar Plot
0 5 10 15 20 250
5
10
15
20
25
05101520250
5
10
15
20
25
0
30
60
90
120
150
180
210
240
270
300
330
Clinton Benzene vs wind direction
Downwind of Lyondell
Upwind of Lyondell
1x10⁻⁵
5x10⁻⁶
1x10⁻⁶
22
Milby Park Cams 169
0
0.5
1
1.5
2
2.5
3
3.5
4
4.5
5
trimmed boxplots by direction
2005
ben
zene
con
cent
ratio
n (p
pbV)
NE SE SW NW N E S W
Polar Plot
0 5 10 15 20 250
5
10
15
20
25
05101520250
5
10
15
20
25
0
30
60
90
120
150
180
210
240
270
300
330
Milby Benzene vs wind direction
Upwind of Lyondell
Downwind of Lyondell
1x10⁻⁵
5x10⁻⁶
1x10⁻⁶
23
Cesar Chavez Cams 1020
0
0.5
1
1.5
2
2.5
3
3.5
4
4.5
5
trimmed boxplots by wind direction
2005
ben
zene
con
cent
ratio
n (p
pbV)
NE SE SW NW N E S W
Polar Plot
0 2 4 6 8 10 12 140
2
4
6
8
10
12
14
024681012140
2
4
6
8
10
12
14
0
30
60
90
120
150
180
210
240
270
300
330
Cesar Chavez Benzene vs wind direction
Upwind of Lyondell
Downwind of Lyondell
1x10⁻⁵
5x10⁻⁶
1x10⁻⁶
24
Site-specific Reduction Control Strategy: The pie chart below indicates the benzene emission sources (tons/yr) as reported at this facility in the TCEQ 2004 Emission Inventory. The corresponding emission reduction plans for these sources are provided in the table.
Lyondell-Houston Refining Benzene Emissions (Tons Per Year) Data from TCEQ
Year Site-specific Plan: LYONDELL HOUSTON REFINING LP
Heaters and Furnaces 2006 Develop a Benzene Combustion Minimization Plan (BCMP) to prevent
combustion of gases containing benzene during normal operations, by recovering benzene from fuel gas systems. The BCMP will include a schedule to implement the plan.
2011 Implement BCMP to reduce benzene emissions from heaters and furnaces. Tanks
2007 Develop a plan to upgrade or install controls on tanks, selecting the facilities for control based on measured benzene emissions impacts and the feasibility of the controls.
2010 Implement plans to upgrade or install controls on tanks with benzene emissions.
LDAR Fugitive 2007 Accept a 100-ppm leak threshold definition for monitored fugitive components
that contain benzene, which are part of an existing leak detection and repair program and make first repair attempts within one day of leak detection for leaks from monitored fugitive components that contain benzene.
2007 Initiate an investigation to find and correct contributing conditions within four hours of measuring a significant net impact from the site. The significance threshold will depend on the baseline ambient monitoring data, and will be reduced over the five year period as monitoring verifies reductions over time.
25
Year Site-specific Plan: LYONDELL HOUSTON REFINING LP 2008 Utilize a passive optical gas imaging instrument to perform startup and
quarterly site-wide surveys of leak detection and repair program components, tanks, vents, wastewater collection and treatment facilities and loading and unloading operations. Leaks detected with the passive optical gas-imaging instrument must be confirmed with tradition leak detection methods (Method 21) and/or seal inspections, and the leaks must be corrected according to applicable leak repair time frames. If there is not an applicable leak repair time frame, a leak repair plan must be developed and implemented so that the leak will be repaired within a reasonable amount of time.
Quantifiable and Verifiable Reductions: Monitoring 2008 Initiate monitoring at locations along or adjacent to the north and south or
northwest and southeast property lines to verify emissions reductions and measure impacts.
2008 Make benzene monitoring data available through a web-based application (such as the TCEQ's monitoring data internal web page) and provide an automated email notification to the City of Houston when the hourly average net benzene impact from the site exceeds the current significance threshold.
2008 Submit an annual report to the City of Houston, within 60 days after the end of each calendar year in the five-year period. The annual report must include the estimated amount of benzene emissions that were reduced during the year compared to a designated baseline year as a result of participation, the estimated net annual average benzene impact from the site in ppb (through modeling and using the fence line monitoring data once fence line monitoring has been implemented), a description of projects implemented during the year, dates that each project was implemented and a schedule for each project that has not yet been implemented. If all required reductions have not been implemented by the end of the fourth year of the agreement, a final report will be due after one complete calendar year where no emissions reduction projects were implemented.
26
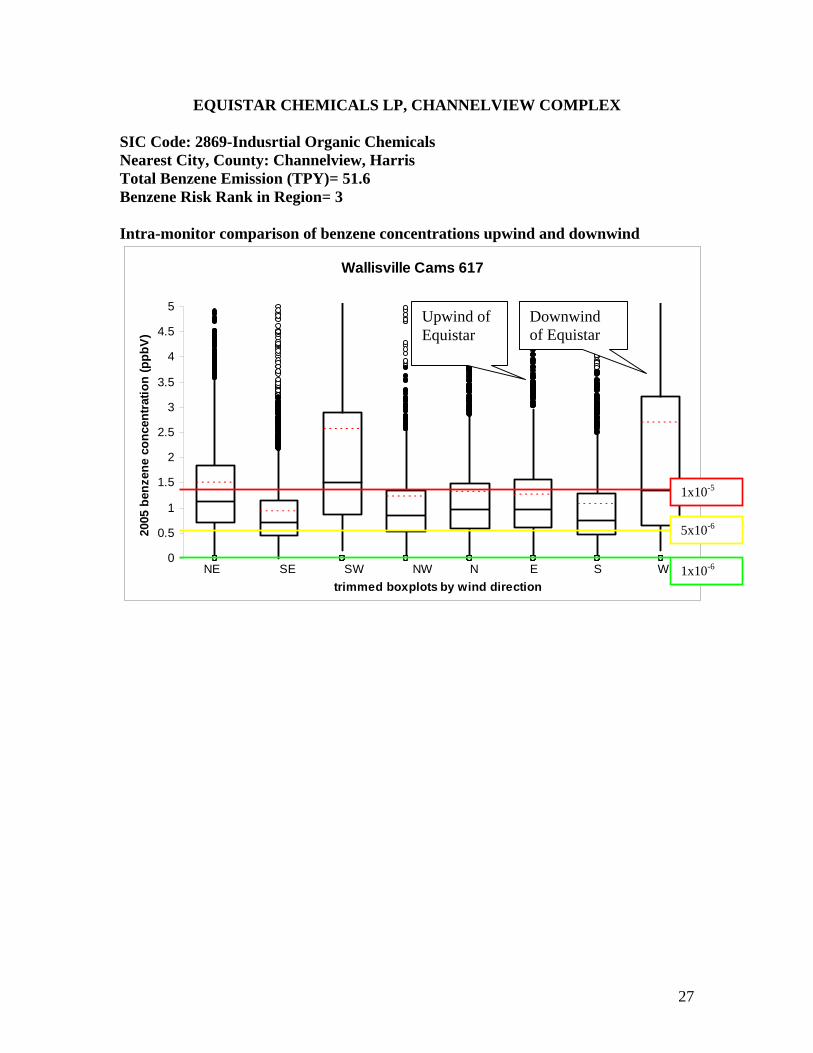
EQUISTAR CHEMICALS LP, CHANNELVIEW COMPLEX
27
EQUISTAR CHEMICALS LP, CHANNELVIEW COMPLEX
SIC Code: 2869-Indusrtial Organic Chemicals Nearest City, County: Channelview, Harris Total Benzene Emission (TPY)= 51.6 Benzene Risk Rank in Region= 3 Intra-monitor comparison of benzene concentrations upwind and downwind
Wallisville Cams 617
0
0.5
1
1.5
2
2.5
3
3.5
4
4.5
5
trimmed boxplots by wind direction
2005
ben
zene
con
cent
ratio
n (p
pbV)
NE SE SW NW N E S W
Upwind of Equistar
Downwind of Equistar
1x10⁻⁵
5x10⁻⁶
1x10⁻⁶
28
Polar Plot
0 5 10 15 20 25 30 35 400
5
10
15
20
25
30
35
40
05101520253035400
5
10
15
20
25
30
35
40
0
30
60
90
120
150
180
210
240
270
300
330
Wallisville Benzene vs wind direction
29
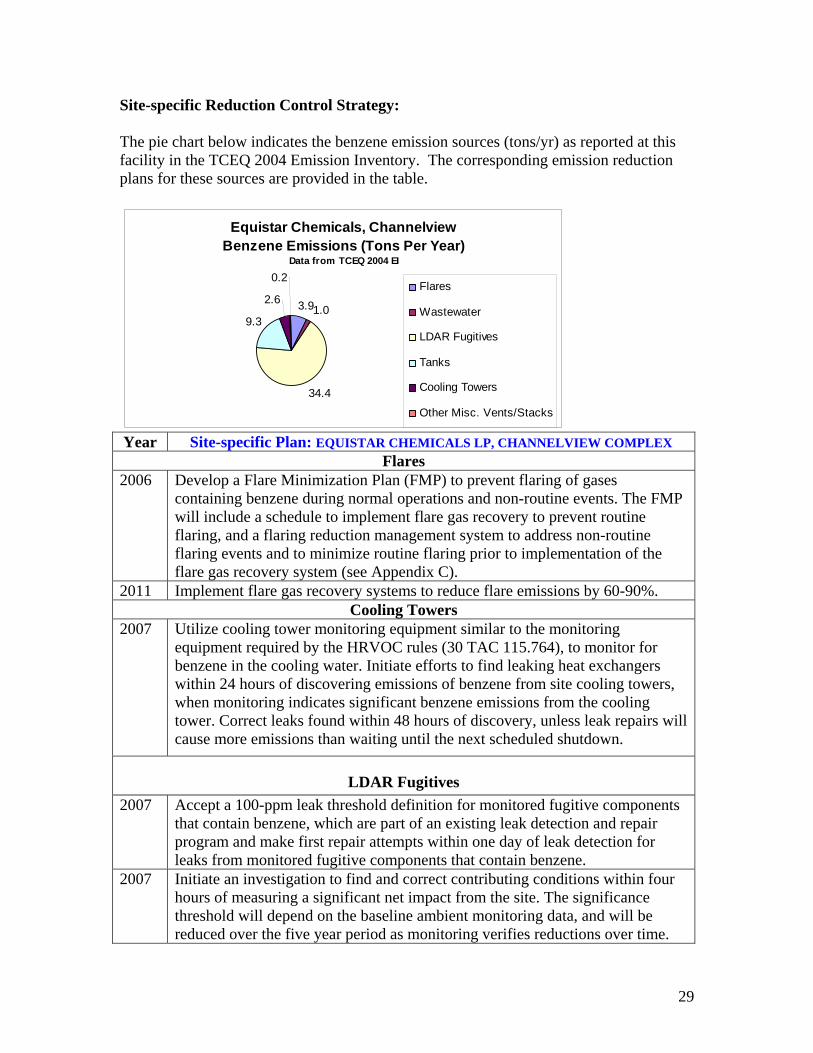
Site-specific Reduction Control Strategy: The pie chart below indicates the benzene emission sources (tons/yr) as reported at this facility in the TCEQ 2004 Emission Inventory. The corresponding emission reduction plans for these sources are provided in the table.
Equistar Chemicals, Channelview Benzene Emissions (Tons Per Year)
Data from TCEQ 2004 EI
3.91.0
34.4
9.3
2.6
0.2Flares
Wastewater
LDAR Fugitives
Tanks
Cooling Towers
Other Misc. Vents/Stacks
Year Site-specific Plan: EQUISTAR CHEMICALS LP, CHANNELVIEW COMPLEX Flares
2006 Develop a Flare Minimization Plan (FMP) to prevent flaring of gases containing benzene during normal operations and non-routine events. The FMP will include a schedule to implement flare gas recovery to prevent routine flaring, and a flaring reduction management system to address non-routine flaring events and to minimize routine flaring prior to implementation of the flare gas recovery system (see Appendix C).
2011 Implement flare gas recovery systems to reduce flare emissions by 60-90%. Cooling Towers
2007 Utilize cooling tower monitoring equipment similar to the monitoring equipment required by the HRVOC rules (30 TAC 115.764), to monitor for benzene in the cooling water. Initiate efforts to find leaking heat exchangers within 24 hours of discovering emissions of benzene from site cooling towers, when monitoring indicates significant benzene emissions from the cooling tower. Correct leaks found within 48 hours of discovery, unless leak repairs will cause more emissions than waiting until the next scheduled shutdown.
LDAR Fugitives 2007 Accept a 100-ppm leak threshold definition for monitored fugitive components
that contain benzene, which are part of an existing leak detection and repair program and make first repair attempts within one day of leak detection for leaks from monitored fugitive components that contain benzene.
2007 Initiate an investigation to find and correct contributing conditions within four hours of measuring a significant net impact from the site. The significance threshold will depend on the baseline ambient monitoring data, and will be reduced over the five year period as monitoring verifies reductions over time.
30
Year Site-specific Plan: EQUISTAR CHEMICALS LP, CHANNELVIEW COMPLEX 2008 Utilize a passive optical gas imaging instrument to perform startup and
quarterly site-wide surveys of leak detection and repair program components, tanks, vents, wastewater collection and treatment facilities and loading and unloading operations. Leaks detected with the passive optical gas-imaging instrument must be confirmed with tradition leak detection methods (Method 21) and/or seal inspections, and the leaks must be corrected according to applicable leak repair time frames. If there is not an applicable leak repair time frame, a leak repair plan must be developed and implemented so that the leak will be repaired within a reasonable amount of time.
Quantifiable and Verifiable Reductions: Monitoring 2008 Initiate monitoring at locations along or adjacent to the north and south or
northwest and southeast property lines to verify emissions reductions and measure impacts.
2008 Make benzene monitoring data available through a web-based application (such as the TCEQ's monitoring data internal web page) and provide an automated email notification to the City of Houston when the hourly average net benzene impact from the site exceeds the current significance threshold.
2008 Submit an annual report to the City of Houston, within 60 days after the end of each calendar year in the five-year period. The annual report must include the estimated amount of benzene emissions that were reduced during the year compared to a designated baseline year as a result of participation, the estimated net annual average benzene impact from the site in ppb (through modeling and using the fence line monitoring data once fence line monitoring has been implemented), a description of projects implemented during the year, dates that each project was implemented and a schedule for each project that has not yet been implemented. If all required reductions have not been implemented by the end of the fourth year of the agreement, a final report will be due after one complete calendar year where no emissions reduction projects were implemented.
Tanks 2007 Develop a plan to upgrade or install controls on tanks, selecting the facilities for
control based on measured benzene emissions impacts and the feasibility of the controls.
2010 Implement plans to upgrade or install controls on tanks with benzene emissions.
Wastewater Collection and Treatment 2007 Develop a plan to upgrade or install controls on wastewater collection and
treatment facilities, selecting the facilities for control based on measured benzene emissions impacts and the feasibility of the controls.
2010 Implement plans to upgrade or install controls on wastewater collection and treatment facilities.
31
LYONDELL CHEMICAL CHANNELVIEW
32
LYONDELL CHEMICAL CHANNELVIEW
SIC Code: 2869-Industrial Organic Chemicals Nearest City, County: Channelview, Harris Total Benzene Emission (TPY)= 28.9 Benzene Risk Rank in Region= 10 Intra-monitor comparison of benzene concentrations upwind and downwind
Channelview Cams 15
0
0.5
1
1.5
2
2.5
3
3.5
4
4.5
5
trimmed boxplot by wind direction
2005
ben
zene
con
cent
ratio
n (p
pbV
)
NE SE SW NW N E S W
Polar Plot
0 20 40 60 80 100 1200
20
40
60
80
100
120
0204060801001200
20
40
60
80
100
120
0
30
60
90
120
150
180
210
240
270
300
330
Channelview Benzene vs wind direction
Upwind of Lyondell
Downwind of Lyondell
1x10⁻⁵
5x10⁻⁶
1x10⁻⁶
33
Site-specific Reduction Control Strategy: The pie chart below indicates the benzene emission sources (tons/yr) as reported at this facility in the TCEQ 2004 Emission Inventory. The corresponding emission reduction plans for these sources are provided in the table.
Lyondell Chemical, Channelview Benzene Emissions (Tons Per Year)
Year Site-specific Plan: LYONDELL CHEMICAL CHANNELVIEW
Flares/Incinerators 2006 Develop a Flare Minimization Plan (FMP) to prevent flaring and incineration of
gases containing benzene during normal operations and non-routine events. The FMP will include a schedule to implement flare gas recovery to prevent routine flaring, and a flaring reduction management system to address non-routine flaring events and to minimize routine flaring prior to implementation of the flare gas recovery system (see Appendix C).
2011 Implement flare gas recovery systems to reduce flare and incinerator emissions by 60-90%.
Cooling Towers 2007 Utilize cooling tower monitoring equipment similar to the monitoring
equipment required by the HRVOC rules (30 TAC 115.764), to monitor for benzene in the cooling water. Initiate efforts to find leaking heat exchangers within 24 hours of discovering emissions of benzene from site cooling towers, when monitoring indicates significant benzene emissions from the cooling tower. Correct leaks found within 48 hours of discovery, unless leak repairs will cause more emissions than waiting until the next scheduled shutdown.
LDAR Fugitive 2007 Accept a 100-ppm leak threshold definition for monitored fugitive components
that contain benzene, which are part of an existing leak detection and repair program and make first repair attempts within one day of leak detection for leaks from monitored fugitive components that contain benzene.
34
Year Site-specific Plan: LYONDELL CHEMICAL CHANNELVIEW 2007 Initiate an investigation to find and correct contributing conditions within four
hours of measuring a significant net impact from the site. The significance threshold will depend on the baseline ambient monitoring data, and will be reduced over the five year period as monitoring verifies reductions over time.
2008 Utilize a passive optical gas imaging instrument to perform startup and quarterly site-wide surveys of leak detection and repair program components, tanks, vents, wastewater collection and treatment facilities and loading and unloading operations. Leaks detected with the passive optical gas-imaging instrument must be confirmed with tradition leak detection methods (Method 21) and/or seal inspections, and the leaks must be corrected according to applicable leak repair time frames. If there is not an applicable leak repair time frame, a leak repair plan must be developed and implemented so that the leak will be repaired within a reasonable amount of time.
Quantifiable and Verifiable Reductions: Monitoring 2008 Initiate monitoring at locations along or adjacent to the north and south or
northwest and southeast property lines to verify emissions reductions and measure impacts.
2008 Make benzene monitoring data available through a web-based application (such as the TCEQ's monitoring data internal web page) and provide an automated email notification to the City of Houston when the hourly average net benzene impact from the site exceeds the current significance threshold.
2008 Submit an annual report to the City of Houston, within 60 days after the end of each calendar year in the five-year period. The annual report must include the estimated amount of benzene emissions that were reduced during the year compared to a designated baseline year as a result of participation, the estimated net annual average benzene impact from the site in ppb (through modeling and using the fence line monitoring data once fence line monitoring has been implemented), a description of projects implemented during the year, dates that each project was implemented and a schedule for each project that has not yet been implemented. If all required reductions have not been implemented by the end of the fourth year of the agreement, a final report will be due after one complete calendar year where no emissions reduction projects were implemented.
Tanks 2007 Develop a plan to upgrade or install controls on tanks, selecting the facilities for
control based on measured benzene emissions impacts and the feasibility of the controls.
2010 Implement plans to upgrade or install controls on tanks with benzene emissions.
35
EXXON MOBIL CHEMICAL BAYTOWN CHEMICAL PLANT
36
EXXON MOBIL CHEMICAL BAYTOWN CHEMICAL PLANT
SIC Code: 2869-Industrial Organic Chemicals Nearest City, County: Baytown, Harris Total Benzene Emission (TPY)= 49.5 Benzene Risk Rank in Region= 2 Intra-monitor comparison of benzene concentrations upwind and downwind
Deerpark Cams 35
0
0.5
1
1.5
2
2.5
3
3.5
4
4.5
5
trimmed boxplot by wind direction
2005
ben
zene
con
cent
ratio
n (p
pbV)
NE SE SW NW N E S W
Polar Plot
0 2 4 6 8 10 12 14 16 180
2
4
6
8
10
12
14
16
18
0246810121416180
2
4
6
8
10
12
14
16
18
0
30
60
90
120
150
180
210
240
270
300
330
Deer Park Benzene vs wind direction
Downwind of ExxonMobil
Upwind of ExxonMobil
1x10⁻⁵
5x10⁻⁶
1x10⁻⁶
37
Site-specific Reduction Control Strategy: The pie chart below indicates the benzene emission sources (tons/yr) as reported at this facility in the TCEQ 2004 Emission Inventory. The corresponding emission reduction plans for these sources are provided in the table.
ExxonMobil, Baytown Chemical PlantBenzene Emissions (Tons Per Year)
Year Site-specific Plan: EXXON MOBIL CHEMICAL BAYTOWN CHEMICAL PLANT
Flares 2006 Develop a Flare Minimization Plan (FMP) to prevent flaring of gases
containing benzene during normal operations and non-routine events. The FMP will include a schedule to implement flare gas recovery to prevent routine flaring, and a flaring reduction management system to address non-routine flaring events and to minimize routine flaring prior to implementation of the flare gas recovery system (see Appendix C).
2011 Implement flare gas recovery systems to reduce flare emissions by 60-90%. Wastewater Collection and Treatment
2007 Develop a plan to upgrade or install controls on wastewater collection and treatment facilities, selecting the facilities for control based on measured benzene emissions impacts and the feasibility of the controls.
2010 Implement plans to upgrade or install controls on wastewater collection and treatment facilities.
LDAR Fugitives 2007 Accept a 100-ppm leak threshold definition for monitored fugitive components
that contain benzene, which are part of an existing leak detection and repair program and make first repair attempts within one day of leak detection for leaks from monitored fugitive components that contain benzene.
38
Year Site-specific Plan: EXXON MOBIL CHEMICAL BAYTOWN CHEMICAL PLANT 2007 Initiate an investigation to find and correct contributing conditions within four
hours of measuring a significant net impact from the site. The significance threshold will depend on the baseline ambient monitoring data, and will be reduced over the five year period as monitoring verifies reductions over time.
2008 Utilize a passive optical gas imaging instrument to perform startup and quarterly site-wide surveys of leak detection and repair program components, tanks, vents, wastewater collection and treatment facilities and loading and unloading operations. Leaks detected with the passive optical gas-imaging instrument must be confirmed with tradition leak detection methods (Method 21) and/or seal inspections, and the leaks must be corrected according to applicable leak repair time frames. If there is not an applicable leak repair time frame, a leak repair plan must be developed and implemented so that the leak will be repaired within a reasonable amount of time.
Quantifiable and Verifiable Reductions: Monitoring 2008 Initiate monitoring at locations along or adjacent to the north and south or
northwest and southeast property lines to verify emissions reductions and measure impacts.
2008 Make benzene monitoring data available through a web-based application (such as the TCEQ's monitoring data internal web page) and provide an automated email notification to the City of Houston when the hourly average net benzene impact from the site exceeds the current significance threshold.
2008 Submit an annual report to the City of Houston, within 60 days after the end of each calendar year in the five-year period. The annual report must include the estimated amount of benzene emissions that were reduced during the year compared to a designated baseline year as a result of participation, the estimated net annual average benzene impact from the site in ppb (through modeling and using the fence line monitoring data once fence line monitoring has been implemented), a description of projects implemented during the year, dates that each project was implemented and a schedule for each project that has not yet been implemented. If all required reductions have not been implemented by the end of the fourth year of the agreement, a final report will be due after one complete calendar year where no emissions reduction projects were implemented.
Tanks 2007 Develop a plan to upgrade or install controls on tanks, selecting the facilities for
control based on measured benzene emissions impacts and the feasibility of the controls.
2010 Implement plans to upgrade or install controls on tanks with benzene emissions.
39
EXXON MOBIL BAYTOWN FACILITY
40
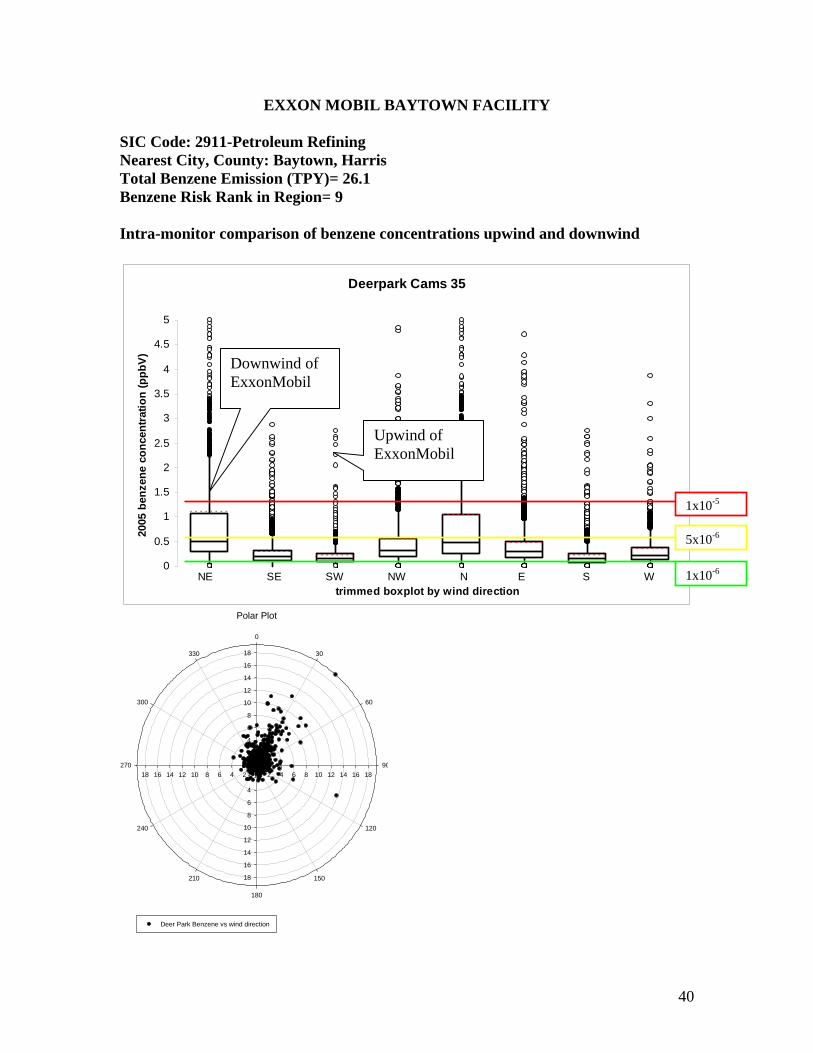
EXXON MOBIL BAYTOWN FACILITY
SIC Code: 2911-Petroleum Refining Nearest City, County: Baytown, Harris Total Benzene Emission (TPY)= 26.1 Benzene Risk Rank in Region= 9 Intra-monitor comparison of benzene concentrations upwind and downwind
Deerpark Cams 35
0
0.5
1
1.5
2
2.5
3
3.5
4
4.5
5
trimmed boxplot by wind direction
2005
ben
zene
con
cent
ratio
n (p
pbV
)
NE SE SW NW N E S W
Polar Plot
0 2 4 6 8 10 12 14 16 180
2
4
6
8
10
12
14
16
18
0246810121416180
2
4
6
8
10
12
14
16
18
0
30
60
90
120
150
180
210
240
270
300
330
Deer Park Benzene vs wind direction
Downwind of ExxonMobil
Upwind of ExxonMobil
1x10⁻⁵
5x10⁻⁶
1x10⁻⁶
41
Site-specific Reduction Control Strategy: The pie chart below indicates the benzene emission sources (tons/yr) as reported at this facility in the TCEQ 2004 Emission Inventory. The corresponding emission reduction plans for these sources are provided in the table.
ExxonMobil Baytown Refinery Benzene Emissions (Tons Per Year)
Year Site-specific Plan: EXXON MOBIL BAYTOWN FACILITY
Incinerators/Boilers and Heaters 2006 Develop a Benzene Combustion Minimization Plan (BCMP) to prevent
combustion of gases containing benzene during normal operations, by recovering benzene from fuel gas systems. The BCMP will include a schedule to implement the plan.
2011 Implement BCMP to reduce benzene emissions from incinerators, heaters and boilers.
Cooling Towers 2007 Utilize cooling tower monitoring equipment similar to the monitoring
equipment required by the HRVOC rules (30 TAC 115.764), to monitor for benzene in the cooling water. Initiate efforts to find leaking heat exchangers within 24 hours of discovering emissions of benzene from site cooling towers, when monitoring indicates significant benzene emissions from the cooling tower. Correct leaks found within 48 hours of discovery, unless leak repairs will cause more emissions than waiting until the next scheduled shutdown.
LDAR Fugitives
42
Year Site-specific Plan: EXXON MOBIL BAYTOWN FACILITY 2007 Accept a 100-ppm leak threshold definition for monitored fugitive components
that contain benzene, which are part of an existing leak detection and repair program and make first repair attempts within one day of leak detection for leaks from monitored fugitive components that contain benzene.
2007 Initiate an investigation to find and correct contributing conditions within four hours of measuring a significant net impact from the site. The significance threshold will depend on the baseline ambient monitoring data, and will be reduced over the five year period as monitoring verifies reductions over time.
2008 Utilize a passive optical gas imaging instrument to perform startup and quarterly site-wide surveys of leak detection and repair program components, tanks, vents, wastewater collection and treatment facilities and loading and unloading operations. Leaks detected with the passive optical gas-imaging instrument must be confirmed with tradition leak detection methods (Method 21) and/or seal inspections, and the leaks must be corrected according to applicable leak repair time frames. If there is not an applicable leak repair time frame, a leak repair plan must be developed and implemented so that the leak will be repaired within a reasonable amount of time.
Quantifiable and Verifiable Reductions: Monitoring 2008 Initiate monitoring at locations along or adjacent to the north and south or
northwest and southeast property lines to verify emissions reductions and measure impacts.
2008 Make benzene monitoring data available through a web-based application (such as the TCEQ's monitoring data internal web page) and provide an automated email notification to the City of Houston when the hourly average net benzene impact from the site exceeds the current significance threshold.
2008 Submit an annual report to the City of Houston, within 60 days after the end of each calendar year in the five-year period. The annual report must include the estimated amount of benzene emissions that were reduced during the year compared to a designated baseline year as a result of participation, the estimated net annual average benzene impact from the site in ppb (through modeling and using the fence line monitoring data once fence line monitoring has been implemented), a description of projects implemented during the year, dates that each project was implemented and a schedule for each project that has not yet been implemented. If all required reductions have not been implemented by the end of the fourth year of the agreement, a final report will be due after one complete calendar year where no emissions reduction projects were implemented.
Tanks 2007 Develop a plan to upgrade or install controls on tanks, selecting the facilities for
control based on measured benzene emissions impacts and the feasibility of the controls.
2010 Implement plans to upgrade or install controls on tanks with benzene emissions.
Misc. Vents 2007 Develop a plan to upgrade or install controls on miscellaneous vents, selecting
43
Year Site-specific Plan: EXXON MOBIL BAYTOWN FACILITY the vents for control based on measured benzene emissions impacts and the feasibility of the controls.
2010 Implement plans to upgrade or install controls on vents with benzene emissions.
Wastewater Collection and Treatment 2007 Develop a plan to upgrade or install controls on wastewater collection and
treatment facilities, selecting the facilities for control based on measured benzene emissions impacts and the feasibility of the controls.
2010 Implement plans to upgrade or install controls on wastewater collection and treatment facilities.
44
BP PRODUCTS NORTH AMERICA TEXAS CITY
45
BP PRODUCTS NORTH AMERICA TEXAS CITY SIC Code: 2911-Petroleum Refining Nearest City, County: Texas City, Galveston Total Benzene Emission (TPY)= 86.7 Benzene Risk Rank in Region= 7 Intra-monitor comparison of benzene concentrations upwind and downwind
Texas City 34th Street Cams 620
0
0.5
1
1.5
2
2.5
3
3.5
4
4.5
5
trimmed boxplots by wind direction
2005
ben
zene
con
cent
ratio
n (p
pbV)
NE SE SW NW N E S W
Polar Plot
0 10 20 30 40 50 600
10
20
30
40
50
60
01020304050600
10
20
30
40
50
60
0
30
60
90
120
150
180
210
240
270
300
330
Texas City 34th Benzene vs wind direction
Downwind of BP
Upwind of BP
1x10⁻⁵
5x10⁻⁶
1x10⁻⁶
46
Site-specific Reduction Control Strategy: The pie chart below indicates the benzene emission sources (tons/yr) as reported at this facility in the TCEQ 2004 Emission Inventory. The corresponding emission reduction plans for these sources are provided in the table.
BP, Texas City Refinery Benzene Emissions (Tons Per Year)
Year Site-specific Plan: BP PRODUCTS NORTH AMERICA TEXAS CITY
Flares 2007 Develop a Flare Minimization Plan (FMP) to prevent thermal oxidizer
combustion of gases containing benzene during normal operations and non-routine events. The FMP will include a schedule to implement flare gas recovery to prevent routine flaring, and a flaring reduction management system to address non-routine flaring events and to minimize routine flaring prior to implementation of the flare gas recovery system (see Appendix C).
2011 Implement flare gas recovery systems to reduce flare emissions by 60-90%. Wastewater Collection and Treatment
2007 Develop a plan to upgrade or install controls on wastewater collection and treatment facilities, selecting the facilities for control based on measured benzene emissions impacts and the feasibility of the controls.
2010 Implement plans to upgrade or install controls on wastewater collection and treatment facilities.
LDAR Fugitives 2007 Accept a 100-ppm leak threshold definition for monitored fugitive components
that contain benzene, which are part of an existing leak detection and repair program and make first repair attempts within one day of leak detection for leaks from monitored fugitive components that contain benzene.
47
Year Site-specific Plan: BP PRODUCTS NORTH AMERICA TEXAS CITY 2007 Initiate an investigation to find and correct contributing conditions within four
hours of measuring a significant net impact from the site. The significance threshold will depend on the baseline ambient monitoring data, and will be reduced over the five year period as monitoring verifies reductions over time.
2008 Utilize a passive optical gas imaging instrument to perform startup and quarterly site-wide surveys of leak detection and repair program components, tanks, vents, wastewater collection and treatment facilities and loading and unloading operations. Leaks detected with the passive optical gas-imaging instrument must be confirmed with tradition leak detection methods (Method 21) and/or seal inspections, and the leaks must be corrected according to applicable leak repair time frames. If there is not an applicable leak repair time frame, a leak repair plan must be developed and implemented so that the leak will be repaired within a reasonable amount of time.
Quantifiable and Verifiable Reductions: Monitoring 2008 Initiate monitoring at locations along or adjacent to the north and south or
northwest and southeast property lines to verify emissions reductions and measure impacts.
2008 Make benzene monitoring data available through a web-based application (such as the TCEQ's monitoring data internal web page) and provide an automated email notification to the City of Houston when the hourly average net benzene impact from the site exceeds the current significance threshold.
2008 Submit an annual report to the City of Houston, within 60 days after the end of each calendar year in the five-year period. The annual report must include the estimated amount of benzene emissions that were reduced during the year compared to a designated baseline year as a result of participation, the estimated net annual average benzene impact from the site in ppb (through modeling and using the fence line monitoring data once fence line monitoring has been implemented), a description of projects implemented during the year, dates that each project was implemented and a schedule for each project that has not yet been implemented. If all required reductions have not been implemented by the end of the fourth year of the agreement, a final report will be due after one complete calendar year where no emissions reduction projects were implemented.
Tanks 2007 Develop a plan to upgrade or install controls on tanks, selecting the facilities for
control based on measured benzene emissions impacts and the feasibility of the controls.
2010 Implement plans to upgrade or install controls on tanks with benzene emissions.
Blowdown Maintenance Vent Emissions 2007 Develop a plan to upgrade or install controls on blowdown vents with benzene
emissions.
2009 Implement plans to upgrade or install controls on blowdown vents with benzene emissions.


![AMINES - Chemistry Silpakorn University Synthesis of 1,3,5-Tribromobenzene from Benzene - Nitration followed by reduction forms aniline (C6H5NH2) from benzene (Steps [1] and [2]).](https://static.documents.pub/doc/80x56/5b0c66967f8b9af65e8c01cf/amines-chemistry-silpakorn-synthesis-of-135-tribromobenzene-from-benzene-nitration.jpg)
