building an opportunity culture for america’s teachers www.opportunityculture.org How America’s Best Teachers Could Close the Gaps, Raise the Bar, and Keep Our Nation Great bryan c. hassel and emily ayscue hassel Opportunity at the Top
Transcript
building an opportunit y culture for americ a’s teachers www.opportunityculture.org
How America’s Best Teachers Could Close the Gaps, Raise the Bar, and Keep Our Nation Greatbryan c. hassel and emily ayscue hassel
BRYAN C. HASSEL is Co-Director of Public Im-pact. He consults nationally with leading public agencies, nonprofit organizations and foundations working for dramatic improvements in K-12 educa-tion. He is a recognized expert on charter schools, school turnarounds, education entrepreneurship, and human capital in education. Dr. Hassel re-ceived his doctorate in public policy from Harvard University and his master’s degree in politics from Oxford University, which he attended as a Rhodes Scholar. He earned his B.A. at the University of North Carolina at Chapel Hill, which he attended as a Morehead Scholar.
EMILy AYSCUE HASSEL is Co-Director of Public Impact. She provides thought leadership and over-sight to Public Impact’s work on human capital, organizational transformation, parental choice of schools, and emerging opportunities for dramatic change in pre-K to grade 12 education. She previ-ously worked for the Hay Group, a leading human resources consulting firm. Ms. Hassel received her law and master’s in business administration degrees from the University of North Carolina at Chapel Hill.
About the Series
This report is part of the series Building an Opportunity Culture for America’s Teachers. To see all reports in this series, including an executive summary for this report, please visit www.opportunityculture.org.
Made possible with the support of:
Acknowledgements
This report was made possible by the generous sup-port of the Joyce Foundation. It is part of a series of reports about “Building an Opportunity Cul-ture for America’s Teachers.” The authors would like to acknowledge the assistance of numerous Public Impact colleagues in the preparation of this report. Daniela Doyle led the creation of the model used to forecast the effects of changing our teacher policies, with significant support from Jacob Rosch. Ms. Doyle and Mr. Rosch, along with Joe Ableidinger, provided extensive research assistance. Julie Kowal and Lucy Steiner provided invaluable comments on an early draft, and Dana Brinson oversaw production and dissemination of the report. In addition, several external reviewers provided helpful feedback and insights, though all errors remain our own. Finally, we would like to thank Sharon Kebschull Barrett for careful edit-ing, and April Leidig-Higgins for the design of the report.
Public Impact is a national education policy and management consulting firm based in Chapel Hill, NC. We are a team of researchers, thought leaders, tool-builders, and on-the-ground consultants who help education leaders and policymakers improve student learning in K-12 education. For more on Public Impact and our research, please visit: www.publicimpact.com.
Public Impact encourages the free use, repro-duction, and distribution of this working paper for noncommercial use. We require attribution for all use. For more information and instructions on the commercial use of our materials, please contact us at www.publicimpact.com.
w w w. o p p o r t u n i t y c u lt u r e . o r g o p p o r t u n i t y at t h e t o p | 1
Thanks to two decades of research, everyone now understands the vital role teachers play in student learning. These days, few would debate that teachers differ widely in their effectiveness. Our schools have amazingly powerful teachers, woefully inadequate teachers, and every gradation in between. And few would dispute now that these differences have an enormous impact on how much students learn. In the schoolhouse, nothing matters more. Although schools are trying to improve professional develop-ment and mentoring of teachers already on the job, wide agreement has emerged that replacing ineffec-tive teachers with high-potential teachers can di-rectly and immediately improve student outcomes.
This consensus has generated two major responses from policymakers and education reformers. First, numerous efforts are underway to improve the pipe-line of teachers entering the profession. We are encouraging more of our talented college seniors to consider teaching, enticing mid-career professionals to change jobs, and retooling the ways we prepare teaching candidates for the challenges of teaching.1
Second, we are becoming more serious about removing the least effective teachers from class-rooms. Spurred by compelling research,2 the federal Race to the Top competition,3 and major philan-thropic initiatives,4 states and districts across the country are working to revamp teacher-evaluation
systems to reflect the performance differences ev-eryone knows are there. And as measures improve, policymakers are beginning to consider ways to use the data, such as by dismissing or denying tenure to teachers who fall short on the new ratings.
Yet in our zeal to bring in new sources of talent and relieve schools of their lowest performers, we risk overlooking what is perhaps the most obvious, immediate source of improved teaching effectiveness: the great teachers we already have.
The top 25 percent of U.S. teachers — more than 800,000 of them — already achieve a level of results that could enable all of our children to meet and exceed standards, graduating from high school ready for college and careers.5 In two ways, however, we are failing as a nation to capitalize on this extraordinary resource:
Our nation is squandering one of its most important resources —our best teachers — and children are paying the price.{
The top 25 percent of U.S. teachers — more than 800,000 of them — already achieve a level of results that could enable all of our children to meet and exceed standards.
Opportunity at the TopHow America’s Best Teachers Could Close the Gaps, Raise the Bar, and Keep Our Nation GreatBy Bryan C. Hassel and Emily Ayscue Hassel
2 | o p p o r t u n i t y at t h e t o p w w w. o p p o r t u n i t y c u lt u r e . o r g
→ We lose far too many of the best teachers: An-nually, an estimated 8 percent of these high-fliers leave teaching, a loss of about 64,000 very ef-fective teachers every year. That’s 15 times more than Teach For America brought into teaching in 2009.6
→ We fail to leverage their talent for students’ benefit: Even when great teachers stay, their im-pact generally remains small over their careers. For example, only 600 students will benefit from the instruction of an excellent elementary school teacher even if she stays on the job for 30 years.7 We lack effective systems to enable these teachers to reach more students by helping other teachers or by educating more students directly.
In this report, we show that even if we achieve our boldest current goals for top-teacher recruitment and dismissal of low performers, the great majority of children will still lack access to effective instruction. Our stubborn achievement gaps will persist, and advanced learners will continue to fall short of their potential. In contrast, we also show that by coupling these goals with retaining more high-performing teachers and extending their reach to more students, nearly all children could have great teachers year after year. Education in America would at last achieve its promise.
This outcome is well within our reach — but only if we vastly expand the opportunities for top teachers to achieve success, impact, and rewards by building an “opportunity culture” in education.
Our Best Teachers: A National Treasure
What Having a Great Teacher Means for Students
Of course having a great teacher makes a difference, but how much of a difference? In this section, we briefly recount major research, which reveals that our nation’s stubborn achievement gaps could be closed in a mere half-decade if lagging children gained ac-cess to today’s top teachers.
In one early study of teaching effectiveness, re-searchers in Tennessee found that low-performing stu-dents with the top 20 percent of teachers learned two to four times as much as students with the bottom 20 percent.8 Since then, many other rigorous studies have returned results showing that the best teachers consis-tently produce sizable and significant learning gains far in excess of their less-effective peers.9
As an illustration, consider 4th-grade mathemat-ics. Researchers at the highly regarded research firm MDRC analyzed student results on six well-known standardized math tests. They determined how much the typical student progresses between 3rd and 4th grade.10 We can think of this amount of progress as “a year’s worth of learning” for 4th grade. Separately, researchers have compared the learning achieved by students assigned to different teachers for 4th-grade math in two of the nation’s largest school districts, New York City and Los Angeles.
In both studies, students assigned to the best teachers (those in the top 25 percent of all teachers, or the “top quartile”) learned far more than those assigned to the worst (those in the bottom 25 percent).11
How much more? Students with top-quartile teachers learned nearly twice as much as those taught by the bottom 25 percent of teachers. Stu-
Even if we achieve our boldest current goals for top-teacher recruitment and dismissal of low performers, the great
majority of children will still lack access to effective instruction.
Good teachers do not generate the learning progress needed for lagging students. Only great teachers get the job done.
w w w. o p p o r t u n i t y c u lt u r e . o r g o p p o r t u n i t y at t h e t o p | 3
dents with top-25-percent instructors mastered one-third more material than a typical student would learn. Students with bottom-quartile teachers, by contrast, learned a third less than the typical amount (see Figure 1). Put another way, students with the best teachers learned about 6 months more material than their peers with bottom-tier instructors.12
And that’s just in one year of instruction. Imag-ine the impact on a student of having great teachers year after year rather than ineffective teachers. Every two years, the student could advance a whole year
beyond peers relegated to classes with bottom-tier instructors.
Moreover, these studies examined the top 25 per-cent of all teachers. Comparing the very best teachers — say the top 10 percent — with the very worst would yield even more dramatic results. As econo-mist Dan Goldhaber writes: “A very good teacher as opposed to a very bad one can make as much as a full year’s difference in learning growth for students.”13
As many commentators have noted, assigning low-income and minority students to great teachers could well eliminate the persistent achievement gaps we ob-serve between non-poor and poor students, and be-tween white students and black and Latino students. In 4th-grade math, low-income students are, on average, about 1.7 years behind their non-poor peers. Black students lag their white peers by nearly two years of learning.14 If disadvantaged students could switch from bottom-25-percent to top-25-percent teachers, they could make up these differences in just three to four years (see Figure 2). With teachers from the top 10 percent, they could catch up even faster. Good teachers do not generate the learning progress needed for lagging students. Only great teachers get the job done.
Having great teachers not only enables disad-vantaged children to “catch up,” but also enables these same children — and their already advanced peers — to continuing making learning progress
Caveats: Estimating the Value of a Great Teacher
The caveats about methods used to calculate the difference a great teacher makes for students could fill pages, if not tomes. As a result, the numbers used here are intended to be illustrative rather than definitive statements of the exact value of a top-quartile teacher. Among the caveats: researchers vigor-ously debate the best methods for isolating the effects of teachers from the effects of other variables; different studies yield different estimates of teacher effects; even within the same study, effects usually differ by grade and subject; and teacher effects appear to fade over time (when not reinforced by simi-larly effective teachers). For the illustration here, we selected two well-known studies that examine the same grade and subject with a large number of student and teacher observations. Other studies have yielded results in the same general range, so these numbers provide good illustrations of the benefits of having a top-quartile teacher.
Bottom 25% Typical Teacher Top 25%
1 yr
acad
emic
pro
gre
ss m
ade
by s
tud
ents
figure 1. Student Learning Achieved in a Single Academic Year, by Teacher’s Effectiveness
Source: Authors’ calculations based on comparing results reported in the Los Angeles study (Gordon, Kane and Staiger, 2006) and the New York City study (Kane, Rockoff and Staiger, 2006) with the “normal” gains reported in Hill et al. (2007). See text endnote for full details.
4 | o p p o r t u n i t y at t h e t o p w w w. o p p o r t u n i t y c u lt u r e . o r g
well above basic standards. In other words, great teachers are the key not only to closing our nation’s achievement gaps, but also to providing advanced learning opportunities to every child. As others have noted, increasing educational achievement is critical not just for children’s prospects but for our national economy.17
Our Unacknowledged Success: More Than 800,000 Great Teachers
In discussions of teacher quality, we tend to empha-size the negative, such as the decline in the aptitude of the average teacher over the decades,18 or our unwillingness to let go of teachers who prove them-selves ineffective.19
And yet even with these real challenges, our na-tion’s schools do manage to recruit a cadre of teachers each year who turn out to be excellent instructors. The top 25 percent of teachers — the ones achieving the results profiled in the previous section — amount to more than 800,000 out of the national total of ap-proximately 3.25 million teachers.20
Make no mistake — we need more of them. But if we pause for a moment, we realize that despite all of public education’s widely cited dysfunctional human resources policies and systems, more than 800,000 truly excellent teachers — ones who close achievement gaps and raise the bar for advanced learners — come to work every day in our nation’s public schools. About 12.5 million children benefit from their instruction at any one time. So, what are we doing as a nation to capitalize on this often unac-knowledged success?
How We Squander the Treasure
It would be one thing if our public schools simply could not attract high-caliber teachers to their ranks. But as the previous section illustrates, public educa-tion does attract top-notch talent into teaching.
today’s year 1 year 2 year 3 year 4 gap
2
1
0
-1
bla
ck-
wh
ite
ach
iev
emen
t g
ap
in y
ear
s
No achievement gap after 4 straight years of a top-25% vs. bottom-25% teacher
teacher teacher teacher teacher in top 25% in top 25% in top 25% in top 25%
figure 2. Effect of Having Great Teachers on the Black-White Achievement Gap15
Great teachers could close our nation’s stubborn achievement gaps in a mere
half-decade and provide advanced learning opportunities to every child.
Note: This graphic illustrates the effects on black students of having a top-quartile teacher rather than a bottom-quartile teacher for four consecutive years. The distribution of teachers for white students remains the same as it is today.16
w w w. o p p o r t u n i t y c u lt u r e . o r g o p p o r t u n i t y at t h e t o p | 5
Yet as a nation, we receive far less value from this accomplishment than we should, for two reasons. First, we fail to retain enough of the best teachers from year to year. Second, we fail to leverage their talent to benefit more children. But our failure to retain and leverage great teachers begins with our failure to identify them. As a chorus of voices has pointed out, teacher evaluation systems rarely differ-entiate teachers based on performance, giving almost every teacher a rating of “satisfactory” or higher.21 Outstanding teachers cannot be identified with these systems. As a result, districts and schools cannot rely on current, official ratings to identify great teachers, leverage their talents, and retain them. Moving past this barrier must be part of any solution.
Failing to Retain the Best
Teacher turnover receives a lot of attention in edu-cation discussions.22 According to the Institute for Educational Science’s (IES) 2007 study of “teacher attrition and mobility,” approximately 8.4 percent of public school teachers in 2003-04 were out of the profession in 2004-05.23 Numerous studies have ana-lyzed teacher turnover, finding that somewhere in the range of 7.5 to 9 percent of teachers leave the pro-fession each year.24 Many other teachers, of course, switch schools, but here we are concerned about individuals who, from the nation’s perspective, are leaving the classroom altogether.
Teacher turnover rates, however, are low relative to the amount of churn and job-switching common in other professions. The same IES study, for example, estimated that 13.6 percent of private school teachers left the profession between 2003-04 and 2004-05, 62 percent higher than the leave rate in public schools.
In one careful analysis of evidence from the Current Population Survey, Douglas Harris and Scott Adams compared teachers’ rates of leaving the profession to those of three other professions: nursing, accounting, and social work. While the teacher departure rate (7.7 percent) was higher than that for nurses (6.1 per-cent), it fell below the rates for accountants (8.0 per-cent) and social workers (14.9 percent).25 In separate analyses, one can see that rates for the wider category of “business and professional services” are typically even higher, with a 2008 voluntary “quit rate” of 28 percent.26 In addition, perhaps a quarter to one-half of teachers who leave the profession return within five years, reducing the long-term attrition rate sig-
nificantly.27 All in all, teaching is a relatively stable profession compared with many other jobs.
Losing 64,000 top-notch teachers per year. The real turnover crisis, it turns out, is not the overall rate of teacher attrition. Instead, it is our annual loss of tens of thousands of the highest performing teachers. Even if higher-performing teachers leave the profes-sion at a slightly lower rate than other teachers (see the box on page 6 Prior Research on Turnover Rates for the Best Teachers), we can estimate that about 8 percent of them depart each year. With 800,000 top-quartile teachers in classrooms, that means an exodus of 64,000 top-notch teachers from schools each year.
To get a sense of the magnitude and significance of that outflow, consider:
→ As a result of this exodus, about 1 million students lose access to a top teacher the following year. Even though some of these students find their teacher replaced by another top-tier teacher, nearly 750,000 children end up with less-effective teach-ers than they would have had if the top teacher stayed on for another year.28
About 1 million students lose access to a top teacher each year due to turnover.
Our failure to retain and leverage great teachers begins with our
6 | o p p o r t u n i t y at t h e t o p w w w. o p p o r t u n i t y c u lt u r e . o r g
→ The outflow dwarfs the inflow from the impres-sive set of programs that has been extraordinarily successful at bringing new talent into public edu-cation. Teach For America (TFA), for example, brought in 4,100 new teachers in fall 2009. Since its start in 1990, TFA has recruited about 25,000 teachers for high-need schools.29 In a decade of recruiting, The New Teacher Project has placed 37,000 new teachers.30 The Woodrow Wilson Teaching Fellowship will recruit and train 700 math and science teachers over the next three years (see Figure 3).31 And despite these programs’ selectivity, not all of these recruits turn out to be top-quartile teachers.
→ In his presidential campaign, candidate Barack Obama called for a national effort to create an “army” of new teachers, with an annual goal of recruiting 30,000 people into the teaching ranks. As with other recruiting efforts, we would not expect all 30,000 to fall into the top ranks of effectiveness.32
Why we lose the best. The fact that we lose so many excellent teachers each year should come as no surprise. Though public education has many systems
designed to retain teachers in general, these systems are almost all non-selective. That is, as “magnets” they exert no more force on top-notch teachers than on their less-effective peers. As a recent report from The New Teacher Project put it, our policies treat teachers like interchangeable “widgets” rather than acknowledging the striking differences in effective-ness described above.34 Specifically:
Teachers Recruited Teachers Recruited Annual Number by tntp, 2009 by tfa, 2009 of Top-Quartile Teachers Lost
3,992 4,100
64,000
figure 3. Annual Outflow of Great Teachers Compared With Inflow from Successful Programs
Prior Research on Turnover Rates for the Best Teachers33
Several studies have compared turnover rates for teachers exhibiting different levels of effectiveness, based on their “value added” or contributions to student learning as measured by standardized assessments. Among the findings:
→ More-effective teachers appear slightly more likely to stay in the profession from one year to the next than less-effective teachers. This finding especially holds for teachers early in their careers (the first few years).
→ Evidence from a study of Florida teachers suggests that by the end of five years, however, higher-per-forming teachers have attrition rates similar to those of their less-effective peers.
→ Schools vary in how successfully they retain their best teachers. Data from Florida and New York show that the best teachers are more likely to stay at their school if the school is high performing. Schools in general, however, had no more success retaining their best teachers than their worst, according to the Florida study.
Source: Teach For America, http://www.teachforamerica.org/; Correspondence from TNTP, March 2010; Authors’ calcula-tions described more fully in the text.
w w w. o p p o r t u n i t y c u lt u r e . o r g o p p o r t u n i t y at t h e t o p | 7
→ Compensation. Public education’s teacher com-pensation system is built to retain. Almost all school districts pay teachers on a salary schedule that rewards teachers for accumulating experi-ence. In contrast to other professions such as law and medicine, in which top performers can reach the peak of the salary scale in about 10 years, teachers must work 25 to 30 years before reaching top pay levels.35 As a result, teachers have a strong financial incentive to remain in the profession. This incentive, however, exerts at least an equal pull on effective and ineffective teachers alike, be-cause pay is typically not linked in any significant way to performance. Of the 100 largest school districts, only 17 offer any pay for performance. Of these 17, only three — employing less than 1 per-cent of the nation’s teachers — offer performance awards in which the maximum potential award exceeds 10 percent of an average teacher’s salary (see Figure 4). Nationally, less than one penny out of every dollar of teacher compensation is based on performance — or on any factor, for that mat-ter, other than experience or advanced degrees.36
Arguably, the pull of this late-years compensation is actually stronger for lower performers, because higher performers can earn more outside of educa-tion. Chingos and West’s study of teachers leaving the profession, for example, found that higher-performing teachers earned significantly more outside of teaching than their less-effective peers.37
→ Tenure. Another powerful system that arguably helps retain teachers is the job protection that teachers enjoy after receiving tenure. Once ten-ured, public school teachers can be removed only after extensive due process. This job security has obvious value to teachers, who are therefore more likely to remain in teaching rather than moving into other, less secure occupations. Yet tenure exerts its pull without regard to performance because, in contrast to the university setting, the award of tenure in K-12 education is not based on performance.38 Only two states require any evi-dence of effectiveness before awarding tenure.39 If anything, tenure is arguably disproportionately attractive to less-effective teachers, who benefit more from the job protections it affords.
figure 4. Maximum Performance-Based Awards in Large Districts
$12,000
$11,000
$10,000
$9,000
$8,000
$7,000
$6,000
$5,000
$4,000
$3,000
$2,000
$1,000
$0
20% of national aver age teacher sal ary
10% of national aver age teacher sal ary
less than 1% of u.s. teachers
Source: National Council on Teacher Quality, “Teacher Rights, Rules, and Regulations Database.” Retrieved May 28, 2009, from http://www.nctq.org/tr3/search.jsp
8 | o p p o r t u n i t y at t h e t o p w w w. o p p o r t u n i t y c u lt u r e . o r g
→ Retirement Benefits. Like the compensation sys-tem, teacher pension systems are built to retain — up to a point. Benefits tend to be “back-loaded” in several ways, accruing mostly toward the end of teachers’ careers. Like employees in other sectors with traditional pension benefits, teachers in their first few years often accrue no retirement savings until they “vest.” Then, pension wealth grows slowly over most of a teacher’s career, with well-documented “spikes” when teachers reach their 50s or early 60s. Authors Podgursky and Costrell have argued that these spikes “pull” teachers to re-main in the profession until these late years. After the spike, however, teachers are “pushed” to retire: as the value of the pensions begins to decline every year, it becomes worth their while to retire sooner rather than later.40 In addition, teachers face strong incentives to continue teaching in the same state, because of substantial penalties if they
switch to a different state’s pension system mid-career.41 What is important to note here, though, is that all of this “pulling” and “pushing” happens without regard to a teacher’s effectiveness. The draw to stay and earn a maximum pension ap-plies to all teachers, regardless of how much their students learn. And the enticement to leave the profession after the spike occurs beckons effective and ineffective teachers alike.
These three incentive systems — compensation, tenure, and pensions — help education retain teach-ers. But they do so in an undifferentiated way. Great teachers generally earn no more than ineffective teachers with the same level of experience and educa-tion. Great teachers obtain tenure, but so do almost all other teachers, including the least effective. And great teachers can receive generous retirement ben-efits, but at the same level as all other teachers who retire at the same age and years of service.
Other factors may influence retention as well, including inadequate school-level leadership and dif-ficult working conditions in some schools. Across sectors, these factors are most cited by average and less-effective professionals as reasons for leaving their jobs. In contrast, top performers are most likely to leave for lack of career advancement and pay oppor-
figure 5. States’ Grades on Retaining Effective Teachers from the National Council on Teacher Quality
0 5 10 15 20 25 30
23
27
No State Earned an A
No State Earned a B
1
a
b
c
d
f
Today’s pay, tenure, and benefits do no more to retain top-notch teachers than
to retain their least effective peers.
Source: NCTQ State Policy Yearbook 2008, p. 7. Available: http://www.nctq.org/stpy08/reports/stpy_national.pdf.
w w w. o p p o r t u n i t y c u lt u r e . o r g o p p o r t u n i t y at t h e t o p | 9
tunity.42 But in education, tenure, pay, and benefits not only fail to focus on high performers, the enor-mous sums spent through these systems on the least effective teachers also are effectively removed from the pool that could reward and keep top teachers in advanced instructional roles.
As a result, these systems do little to dispropor-tionately retain the best teachers. In its 2008 study, the National Council on Teacher Quality graded the states on their policies for retaining effective teach-ers. No state earned higher than a “C+.” More than half earned a “D+” or lower (Figure 5).43 Is it any wonder that 64,000 high-performing teachers leave the profession every year?
Failing to Leverage the Best
Retaining more of the best teachers would be enor-mously valuable to students. But retention has its limits. Attrition rates in public education are rela-tively low already. And these rates will never go to zero: some high-performing teachers will always have reasons, personal and professional, to move on.
As a result, we also need to focus our attention on the 92 percent of high-performing teachers who stay in the classroom from one year to the next. Though these teachers have a significant positive impact on students, that impact is severely constrained by the fact that, by and large, each great teacher reaches only a small number of students. As Public Impact has argued in other work, “extending the reach” of the great teachers we already have holds excep-tional promise as a strategy for improving student learning.44
So, for the many great teachers who do stay, what opportunities exist to “leverage” their talents, having an impact on more students? Woefully few. Com-pared with other professions such as law, medicine, and engineering, which offer high performers a trove of opportunities to advance in their careers while still practicing their crafts, great teachers enjoy few such prospects to extend their reach.
If we began identifying our best teachers, those great teachers could leverage their impact, contribut-ing to more students’ learning, in two ways. First,
10 | o p p o r t u n i t y at t h e t o p w w w. o p p o r t u n i t y c u lt u r e . o r g
they could do so directly, by providing instruction to a larger number of students. Second, they could do so indirectly, by helping other teachers be more effective. But our school systems do neither.
Providing instruction to a larger number of stu-dents. The most obvious way to leverage the talents
of great teachers would simply be to expose more students to their top-notch instruction. They have already proven they can teach successfully. Why not give them the opportunity, with commensurate com-pensation, to teach more kids?
If this idea conjures up images of 3rd-grade class-rooms packed with 75 students getting little indi-vidual attention, consider this: by reorganizing great teachers’ time to reduce non-instructional tasks, we could enable them to teach more students in person and give children more individual attention. By using the rapidly improving bank of new technologies, we could free great teachers from rote instruction to engage in much more one-on-one or small-group interaction than they do now — with many more students.45
Yet such arrangements are exceedingly rare in U.S. public education. The norm of “one teacher, one classroom” prevails. Dan Lortie wrote about the “egg crate school” in his classic study of the Ameri-can teaching profession in 1975: “. . . throughout the long, formative decades of the modern school system, schools were organized around teacher separation rather than teacher interdependence.”46 As Harvard education scholar Richard Elmore has written: “The organization and culture of American schools is, in most important respects, the same as it was in the late nineteenth and early twentieth centuries. Teach-ers are still, for the most part, treated as solo practi-tioners operating in isolation from one another. . . .”47
Not only does public education fail to offer these reach-extending opportunities to great teachers, but our policies also often actively work against ex-panding the impact of education’s best. Among the culprits:
→ Simplistic across-the-board class-size mandates: According to the Education Commission of the States, “The majority of states — 36 — currently have at least one policy via statute or regulation . . . that places a limit on the number of students that may be in any one general-education classroom.”48 Though smaller classes could help new teachers get their footing, or help struggling teachers get on track, simplistic across-the-board class-size mandates also have the effect of reducing the number of children receiving each great teacher’s instruction. Almost certainly, some great teach-ers could handle more students — for example, 10 to 20 percent more, or two to four more children in an average class — without diluting learning results.
→ Compensation systems that cannot flex up if teachers reach more students: Even if a school or district wanted to extend its best teachers’ reach, it generally could not offer the teacher more pay for educating more students. The vast majority of teacher pay is tied up in automatic increases with each year of service (“steps”) and added funds for obtaining advanced degrees (“lanes”).49 Adminis-trators have little flexibility to offer teachers more than this scale dictates, even if they teach more children.
→ Funding systems that allocate staff positions, rather than dollars: Schools often receive re-sources not in the form of dollars, but in the form of staff positions.50 This structure makes it dif-ficult or impossible for an innovative school leader to hire fewer teachers and use the savings to bring in remote instruction delivered by star teachers or, as just noted, pay the remaining on-site teachers more for their added responsibility.
→ Limits on teaching across state lines: Though much reach extension could take place within
The vast majority of great teachers reach the same number of students as
w w w. o p p o r t u n i t y c u lt u r e . o r g o p p o r t u n i t y at t h e t o p | 11
schools or districts, districts could also “import” great teachers using interactive technology that enables remote teachers to instruct their children. Our state-by-state teacher licensure requirements make this difficult, however, and sometimes impossible.51
Consequently, the vast majority of great teachers reach the same number of students as their least ef-fective peers, year-in and year-out. As a nation, we thereby miss one tremendous opportunity to extend great teaching to more children — using the teachers we already have.
Helping other teachers to be more effective. We could also leverage our best teachers indirectly, by en-listing them to help other teachers be more effective by providing professional development, mentoring and coaching, or supervision. In contrast to reach extension, public education is full of efforts to engage teachers in this kind of work. Yet three dysfunctions keep us from tapping the talent of great teachers to help others.
First, our professional development systems are rarely designed to place the best teachers in the po-sition of helping other teachers get better. Instead, the selection of individuals to lead professional de-velopment sessions or to serve as mentors or coaches generally follows a process of self-selection. Districts and other professional development providers do not generally screen their faculty to ensure they come only from the ranks of teachers who achieve great results with their own students. In part, they forgo this kind of screening because, as noted above, they simply have no formal mechanism to identify their best teachers. As a result, the corps of people engaged in teaching other teachers is much wider than just education’s best.
Second, professional development is rarely de-signed and implemented in ways that are likely to have a strong impact on teacher practice and, through that, student learning. To illustrate this shortfall, consider three large-scale surveys of teach-ers about their professional development experiences: one administered in 1999, one in 2005, and one more
recently in 2009. In varying ways, these surveys re-veal a PD system that does not appear up to the job of improving teacher practice. Instead, they illustrate that the PD system typically fails to:
→ Provide the kind of sustained, job-embedded devel-opment that research suggests would be most helpful. In the U.S. Department of Education’s 1999 study of the large-scale Eisenhower PD program for math and science teachers, 79 percent of teachers in district programs received their development through workshops, institutes, college courses, and conferences rather than more embedded, on-the-job learning.52
→ Be of sufficient duration to stick. In the Eisenhower study, the median duration of district-sponsored PD reported by teachers was just 15 hours,53 far below the duration that other research has sug-gested typifies professional development that re-sults in improved teaching effectiveness.54
→ Match the development each teacher receives to his or her specific needs for improvement. According to The New Teacher Project’s 2009 survey for The Widget Effect, “73 percent of teachers surveyed said their most recent evaluation did not identify any development areas. . . . This is true even for novice teachers who are most in need of actionable feedback as they learn their craft — only 43 per-cent of teachers in their first three years had any development areas identified.”55
Third, those who lead professional development are rarely accountable for student outcomes. Even when professional development is “embedded” in planning sessions at schools and personalized to close student and teacher gaps, it is a rare school that mea-
There is significant opportunity at the top, both to serve more children with our nation’s great teachers and to provide achievement opportunities that would attract and keep more teachers.
12 | o p p o r t u n i t y at t h e t o p w w w. o p p o r t u n i t y c u lt u r e . o r g
sures the effects on students and connects it back to the participating staff.
The professional development system could be a critical tool for education to leverage the power of its best teachers. Instead, schools yet again miss an op-portunity to make the most of this valuable resource.
The Projected Payoff of Major Strategies
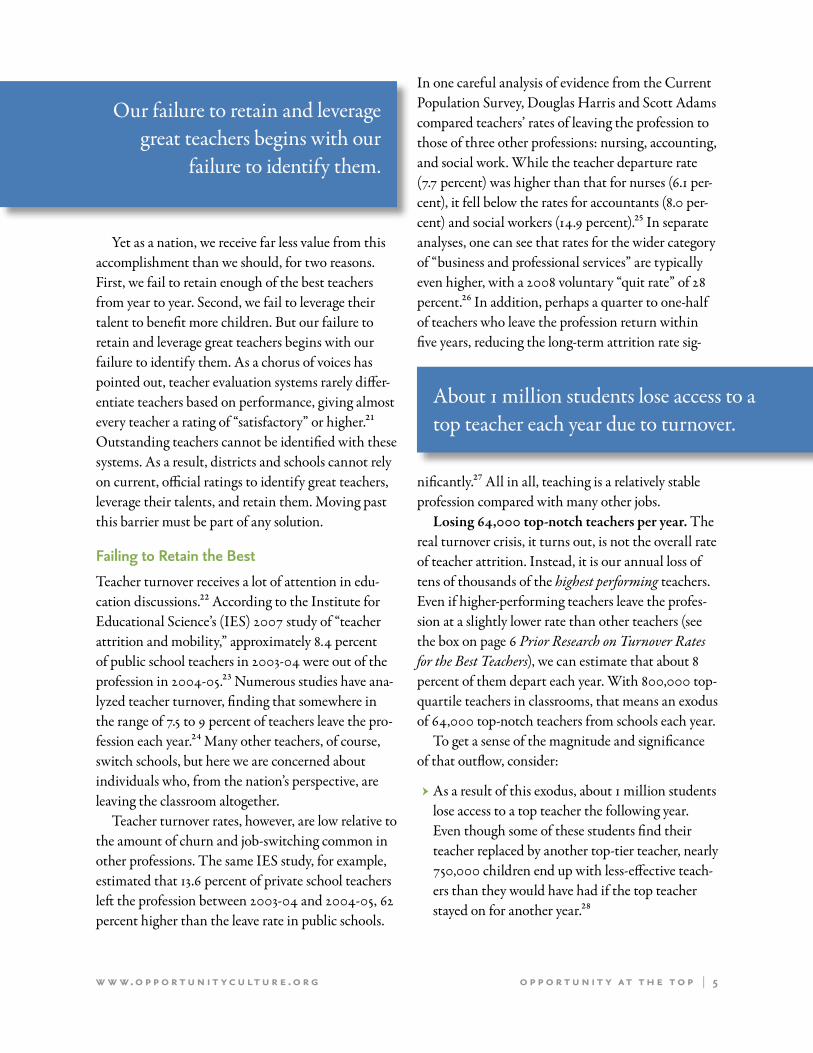
By not retaining and leveraging the great teachers we already have, our nation is missing an enormous opportunity to close achievement gaps, raise the bar for our most capable and motivated learners, and keep our nation’s promise as the land of opportunity. In short, there is significant opportunity at the top, both to serve more children with our nation’s great teachers and to provide achievement opportunities that would attract and keep more teachers like them.
To illustrate the magnitude of this opportunity, we developed a model of the teaching force and how it changes over time, based on current data and trends.56 In this section, we use this model in three steps.
First, we demonstrate that our most ambitious current strategies for recruiting and dismissal, if achieved in full over five years, would give only about
40 percent of the nation’s students access to a top-ranked teacher at any given time. Then, we illustrate that if our nation focused far more on leveraging and retaining the top teachers we already have for the next five years, more than half of all students could have a great teacher at any one time. Finally, we ex-plore the payoff of combining all of these powerful strategies, enabling nearly nine in ten students to enjoy a top-tier teacher after five years.
figure 6. The Status Quo: The Current Distribution of Teacher Effectiveness
w w w. o p p o r t u n i t y c u lt u r e . o r g o p p o r t u n i t y at t h e t o p | 13
The Payoff of Recruitment and Dismissal
Starting point: the current range of teacher ef-fectiveness. Before exploring the payoff of different strategies, it helps to have a picture in mind of the current state of teacher effectiveness. Then as we peer into possible futures, we can see how well each im-proves on the status quo.
One way to picture the state of teacher effective-ness is to view the proportion of classes taught by teachers at different levels of effectiveness. First, we show this range on a “bell curve,” or “normal curve” (Figure 6). Not all distributions of human perfor-mance at work fall into such a neat pattern. But in fact this approximately describes the current teach-ing force in measured grades and subjects (reading and math in grades 3 through 8), so we also apply it to teachers in other subjects and grades. Note that among teachers at the top, some in fact achieve ex-traordinary progress above even their effective peers.
Second, we divide this range into four quartiles.57 The picture in Figure 7 shows the percentage of teachers who fall into today’s four quartiles, 25 per-cent each.
We can think about our goals for improving teacher effectiveness as increasing the size of the top group. This group represents great teachers, who we know from research produce far higher levels of stu-dent learning than their peers. As we examine pos-sible futures, we can ask: what proportion of teachers will be as effective as today’s top 25 percent? The higher the proportion of teachers we have in that top group, the better. And ultimately, as we demonstrate later in this paper, we can also show the proportion of children taught by this top group.
Recruiting more high performers. To begin, con-sider what would happen if we were wildly successful at one of the nation’s current priorities: recruiting more talented people into teaching. Currently, school districts’ recruiting and hiring systems are widely
figure 7. Today’s Teachers Divided into Four Equal-Sized Effectiveness Groups
14 | o p p o r t u n i t y at t h e t o p w w w. o p p o r t u n i t y c u lt u r e . o r g
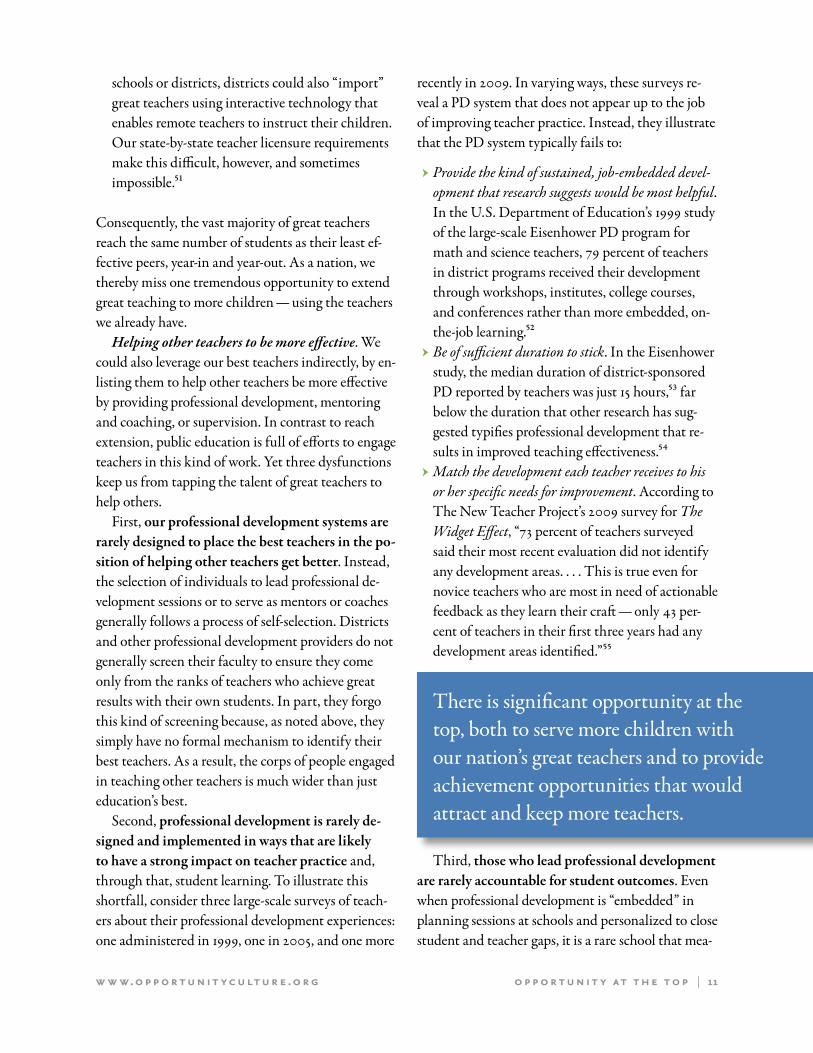
thought to be broken. They tend to reproduce the picture in Figures 6 and 7, bringing in teachers with the usual range of effectiveness.
The National Center for Education Statistics predicts that public schools will hire an average of 339,000 teachers each year between 2010 and 2018.58 About 85,000 (25 percent) of those will ultimately fall into the top effectiveness group.59 What if we could enhance our recruiting so that 40 percent of our incoming teachers were headed for the top level of effectiveness — and then keep up that pace for five years? Figure 8 shows where we would be at the end of five years of this enhanced recruiting.60
Better recruiting would yield benefits for kids. The percentage of teachers in the best group would go from 25 percent to 30 percent. At any one time, about 15 million students would be in classes taught by great teachers, compared with 13 million if we
continued our current recruiting practices — creating a large, direct increase in learning results for many children.61
But two facts should give us pause. First, even after a half-decade of outstanding recruitment, a very large number of students still would not be assigned to teachers in the top group. Some 37 million students would lack access to a great teacher in a given period of the day. Fully 46 percent of students at any one time would still be in classes taught by teachers from the bottom two effectiveness groups — below average in today’s schools. One in five would still be in a class taught by a teacher from the least effective group.
Second, raising the percentage of great recruits from 25 to 40 percent annually would be a breath-taking achievement, requiring the attraction of at least an additional 50,000 very talented new entrants
100%
90%
80%
70%
60%
50%
40%
30%
20%
10%
0%Least Effective
TeachersMost Effective
Teachers*
perc
ent
of
cla
sses
tau
gh
t
After 5 years of enhanced recruiting Status quo
figure 8. Teacher Effectiveness Groups After 5 Years of Enhanced Recruiting
*Teachers who produce learning progress in the same range as the top 25 percent of teachers today.
w w w. o p p o r t u n i t y c u lt u r e . o r g o p p o r t u n i t y at t h e t o p | 15
every year. Teach For America’s entire annual class is just over 4,000, with a similar number entering through The New Teacher Project’s efforts. And not all of these new recruits fall into today’s top quartile of classroom effectiveness. Another prominent na-tional initiative, the Woodrow Wilson Teaching Fel-lowship, plans to work in three states to attract and train 700 high-potential math and science teachers in three years. Even if that program expanded to all 50 states, and even if all of its recruits proved them-selves as effective as teachers in today’s top quartile, it would yield only about 3,900 top-ranked new teach-ers per year.
Just to be clear: better, bolder recruiting efforts just like these are crucial, because each new great teacher from among these recruits either replaces one of the departing great teachers or grows the ranks of great teachers. The point is that even if we met today’s most ambitious targets for recruiting great teachers, we would still fall far short of a “great teacher for every student” — about 70 percent short. More than two-thirds of America’s classes would still be taught by teachers who do not generate prog-ress adequate to close achievement gaps and make advanced students internationally competitive. We would be stuck in the same reality as today, with parents in good schools jockeying for the one or two great teachers in each grade or subject and with
students in high-poverty schools even less likely to encounter the great teachers they so desperately need.
Dismissing low performers. Another strategy that holds promise for improving teacher effectiveness is to dismiss more of the least effective teachers.62 The National Center for Education Statistics estimates
that the average district dismisses or refuses to renew the contract for about 2.1 percent of its teaching force each year based on performance.63
What if we were much more successful at dismiss-ing teachers who are the least effective at instruction? Specifically, what if districts tripled the current per-centage and focused dismissals with perfect accuracy on the lowest performing teachers, so that the least effective 6.3 percent of teachers left the profession annually? How would that change the teaching force over five years relative to the status quo’s policies? Figure 9 shows the results.
With that policy, students would benefit enor-mously. After five years, only 7 percent of kids would have teachers in the bottom effectiveness group, compared with 25 percent under today’s policies. As teachers left, they would be replaced by teachers across the whole range of effectiveness — including by teachers in the top group. As a result, the propor-tion of teachers in the top tier would rise, from 25 percent in the status quo to 31 percent after 5 years.
But even this highly aggressive, half-decade effort to remove the worst performers would leave almost 70 percent of our nation’s children without a great teacher. Fewer students would suffer from having the worst teachers, but far too few would gain access to the best.
Combined recruiting and dismissal. If we pur-sued both of these aggressive policies simultaneously
Even if we met today’s most ambitious targets for recruiting great teachers, more than two-thirds of America’s classes would still be taught by teachers who do not generate progress adequate to close achieve-ment gaps and make advanced students internationally competitive.
A highly aggressive, half-decade effort to remove the worst performers would
leave almost 70 percent of our nation’s children without a great teacher.
After 5 years of dismissing the bottom 6.3% of teachers Status quo
100%
90%
80%
70%
60%
50%
40%
30%
20%
10%
0%Least Effective
TeachersMost Effective
Teachers*
perc
ent
of
cla
sses
tau
gh
t
After 5 years of enhanced recruiting and dismissing the bottom 6.3% of teachers Status quo
figure 9. Teacher Effectiveness Groups After 5 Years of Dismissing Low Performers64
figure 10. Teacher Effectiveness Groups After 5 Years of Enhanced Recruitment and Dismissal
*Teachers who produce learning progress in the same range as the top 25 percent of teachers today.
*Teachers who produce learning progress in the same range as the top 25 percent of teachers today.
w w w. o p p o r t u n i t y c u lt u r e . o r g o p p o r t u n i t y at t h e t o p | 17
— dramatically expanding our recruitment of top talent and tripling our dismissal rates for low per-formers — of course we would make even more prog-ress, as illustrated in Figure 10.
Under this scenario, fully 40 percent of teach-ers would be as effective as today’s top quartile. At a given time, 21 million students would enjoy top-notch teaching, versus 13 million under the status quo’s policies. Yet this new world would still leave the other 60 percent, nearly 32 million students, without a great teacher at any one time.
The Payoff of Retaining and Leveraging the Great Teachers We Already Have
Recruitment strategies look outside of education for new sources of talent. Dismissal strategies look inside schools, but with an eye to identifying and removing chronically ineffective teachers. Here, we consider the payoff of a different set of strategies, approaches that focus on retaining and enhancing the impact of the great teachers who already flow into our schools.
Retaining the best teachers. One of those strate-gies is to increase the portion of high-performing teachers who stay in the classroom from one year to the next. Focusing turnover prevention tactics on top-performing teachers would make an immediate difference for large numbers of children.
Turnover never drops to zero, and as noted above, turnover rates among teachers are already low com-pared with other professions. We lose about 8 percent of our top teachers every year. People leave jobs for all kinds of reasons, professional and personal. And younger workers are more likely to switch jobs than their more senior counterparts, suggesting that gener-ational changes may drive teacher turnover rates up.65
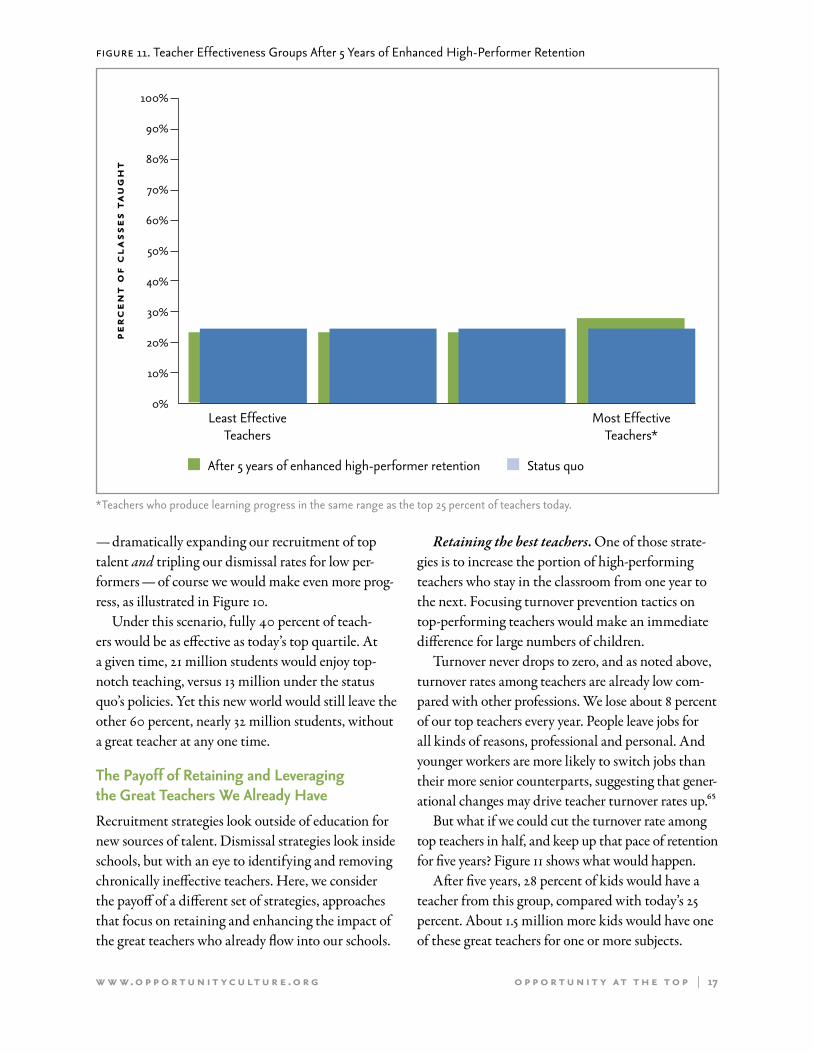
But what if we could cut the turnover rate among top teachers in half, and keep up that pace of retention for five years? Figure 11 shows what would happen.
After five years, 28 percent of kids would have a teacher from this group, compared with today’s 25 percent. About 1.5 million more kids would have one of these great teachers for one or more subjects.
figure 11. Teacher Effectiveness Groups After 5 Years of Enhanced High-Performer Retention
100%
90%
80%
70%
60%
50%
40%
30%
20%
10%
0%Least Effective
TeachersMost Effective
Teachers*
perc
ent
of
cla
sses
tau
gh
t
After 5 years of enhanced high-performer retention Status quo
*Teachers who produce learning progress in the same range as the top 25 percent of teachers today.
18 | o p p o r t u n i t y at t h e t o p w w w. o p p o r t u n i t y c u lt u r e . o r g
Leveraging the best teachers. Retaining more of the best teachers would produce great benefits, but we need to do better. Our largest opportunity is to extend the reach of the best teachers so that more students benefit from their instruction. As we de-tailed in the report 3X for All: Extending the Reach of Education’s Best, our nation could boost the im-pact of great teachers in several ways. We expect that education innovators will devise many more meth-ods, but here are some examples of reach extension in three modes:66
→ In-Person Reach Extension: changing instruc-tional roles and how schools are organized to leverage limited talent while keeping the best in-structors close to the classroom. Great teachers are still physically present to interact with children and other staff in schools. Examples include:
1. Great teachers using far more of the workday for instruction to reach more children, by eliminat- ing non-instructional tasks that other adults could do;67 2. Great teachers with managerial skills leading multiple classrooms, with direct oversight of other teachers who then use their methods and work to their standards; 3. Voluntary shifts of small numbers of children — e.g., two to four per class — to top teachers’ classrooms (ideally drawn from the classrooms of the least effective teachers).
These examples of in-person reach extension could increase the number of students with access to top teachers by 10 to 50 percent without diluting in-person instruction time.
→ Remote Reach Extension: using technology to enable great teachers to engage directly though not in person with students, bringing great teaching even to places where great teachers are in
short supply. Current technology allows both real-time and asynchronous interaction between great teachers and students. Examples include:
1. Pods of teaching specialists working together in desirable living locations and accessing children in schools anywhere that lack sufficient local talent. 2. School providers focusing great teachers’ time on student work review, personalized feed- back, and diagnostics of next-step instructional needs — all high-value roles that typical teachers are pressed to do as well — via email and internet. 3. School providers having top teachers use all of their work time to interact online with far more students than possible when giving repeated live lectures; this is possible if videos or computers are used to deliver routine lecture content that all students need.
Remote Reach Extension could double or triple the number of children reached by top teachers, and it could do so where In-Person Reach Extension is not feasible.
→ Boundless Reach Extension: using video of great teachers and software based on their insights and practices to deliver great teaching even when great teachers cannot interact directly with stu-dents. Examples include:
1. Video recordings of teachers who are both masters of content and engaging performers.2. Smart software designed by great instructors to ascertain and respond instantly to each child’s level of skill and knowledge.
It is “boundless” because the number of children who can be served by an individual instructor is unlimited. It is bounded very little by the time and not at all by the location of each instructor who contributes intellectual and “performance” capital. The only limits on time are the time it takes for each great teacher to participate in the design and produc-tion of video or online content. The precise formula
Reach extension alone could double the number of children receiving top-tier instruction.
w w w. o p p o r t u n i t y c u lt u r e . o r g o p p o r t u n i t y at t h e t o p | 19
for combining technology with other instructional elements to achieve the level of learning progress that top teachers achieve is still unknown. And yet, in-novators in other countries that outperform the U.S. on comparable exams are moving forward aggres-sively, reaching children nationwide with outstand-ing, charismatic instructors who are revered — and paid — like rock stars.68
Not every great teacher will be equally effec-
tive with every child need or every reach extension method. Implementing assessment methods that iden-tify which teachers do best with which child learning needs and reach extension methods — and then creat-ing the opportunities for those teachers to reach the children they can best help — are essential tasks.69
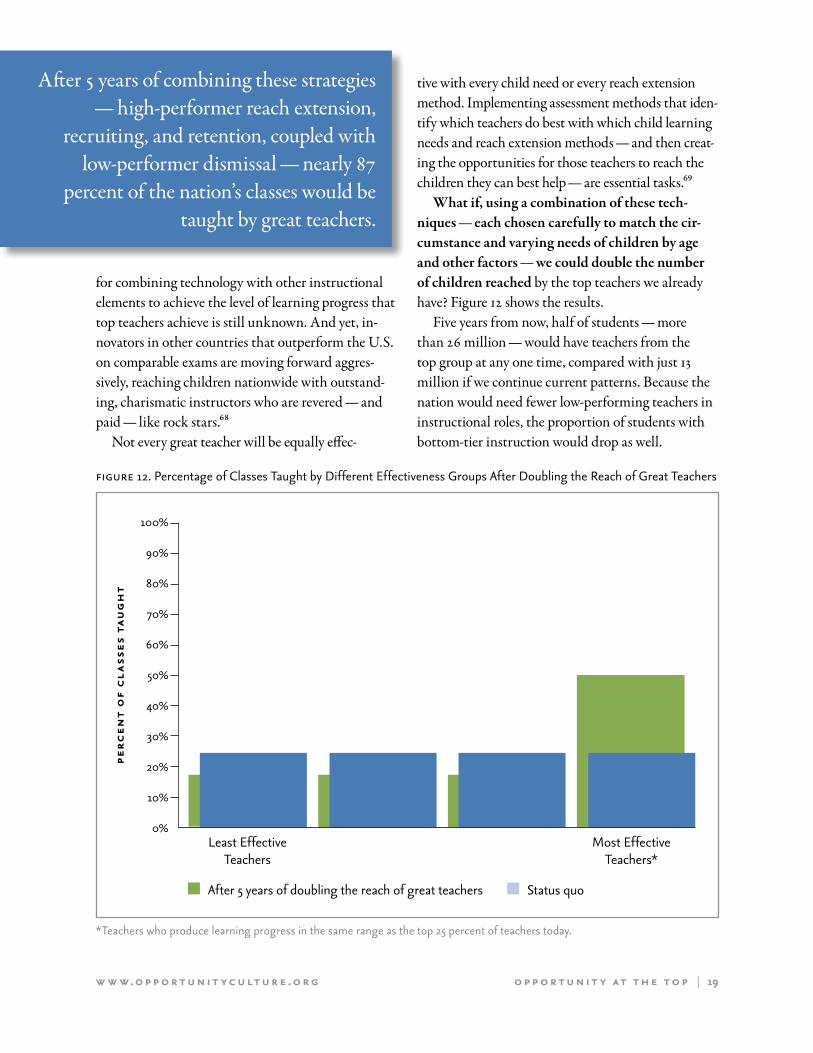
What if, using a combination of these tech-niques — each chosen carefully to match the cir-cumstance and varying needs of children by age and other factors — we could double the number of children reached by the top teachers we already have? Figure 12 shows the results.
Five years from now, half of students — more than 26 million — would have teachers from the top group at any one time, compared with just 13 million if we continue current patterns. Because the nation would need fewer low-performing teachers in instructional roles, the proportion of students with bottom-tier instruction would drop as well.
After 5 years of combining these strategies — high-performer reach extension,
recruiting, and retention, coupled with low-performer dismissal — nearly 87
percent of the nation’s classes would be taught by great teachers.
figure 12. Percentage of Classes Taught by Different Effectiveness Groups After Doubling the Reach of Great Teachers
100%
90%
80%
70%
60%
50%
40%
30%
20%
10%
0%Least Effective
TeachersMost Effective
Teachers*
perc
ent
of
cla
sses
tau
gh
t
After 5 years of doubling the reach of great teachers Status quo
*Teachers who produce learning progress in the same range as the top 25 percent of teachers today.
20 | o p p o r t u n i t y at t h e t o p w w w. o p p o r t u n i t y c u lt u r e . o r g
The Payoff of Combining Recruitment, Dismissal, Retention, & Reach Extension
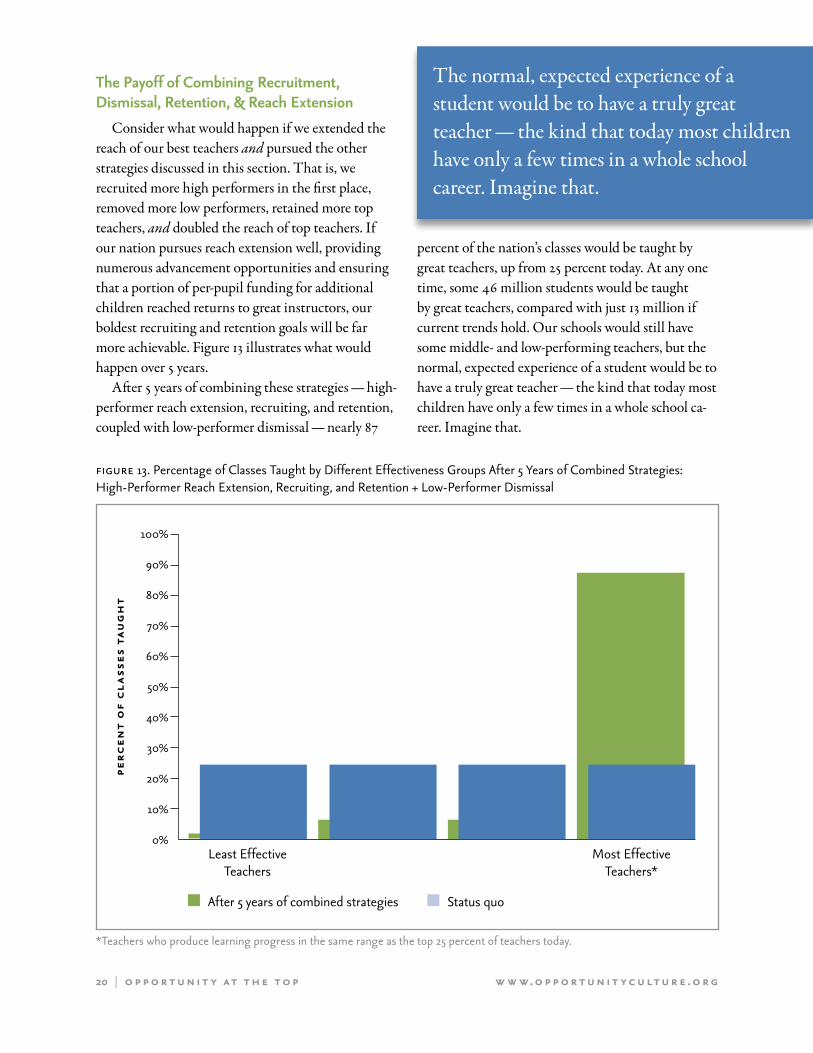
Consider what would happen if we extended the reach of our best teachers and pursued the other strategies discussed in this section. That is, we recruited more high performers in the first place, removed more low performers, retained more top teachers, and doubled the reach of top teachers. If our nation pursues reach extension well, providing numerous advancement opportunities and ensuring that a portion of per-pupil funding for additional children reached returns to great instructors, our boldest recruiting and retention goals will be far more achievable. Figure 13 illustrates what would happen over 5 years.
After 5 years of combining these strategies — high-performer reach extension, recruiting, and retention, coupled with low-performer dismissal — nearly 87
percent of the nation’s classes would be taught by great teachers, up from 25 percent today. At any one time, some 46 million students would be taught by great teachers, compared with just 13 million if current trends hold. Our schools would still have some middle- and low-performing teachers, but the normal, expected experience of a student would be to have a truly great teacher — the kind that today most children have only a few times in a whole school ca-reer. Imagine that.
figure 13. Percentage of Classes Taught by Different Effectiveness Groups After 5 Years of Combined Strategies: High-Performer Reach Extension, Recruiting, and Retention + Low-Performer Dismissal
100%
90%
80%
70%
60%
50%
40%
30%
20%
10%
0%Least Effective
TeachersMost Effective
Teachers*
perc
ent
of
cla
sses
tau
gh
t
After 5 years of combined strategies Status quo
The normal, expected experience of a stu dent would be to have a truly great teacher — the kind that today most children have only a few times in a whole school career. Imagine that.
*Teachers who produce learning progress in the same range as the top 25 percent of teachers today.
w w w. o p p o r t u n i t y c u lt u r e . o r g o p p o r t u n i t y at t h e t o p | 21
Figure 14 shows the relative impacts of these strat-egies on children.
The potential boosting power of professional development. Note that here we do not include a potential boost in the number of great teachers as a result of improved professional development. Despite much “how to” research, professional development in implementation has not led to widespread, measur-able results.
However, we suspect that professional develop-
ment consistently designed and led by teachers who are already performing well will benefit students more than professional development today, particu-larly when it is coupled sensibly with accountability for student outcomes. For example, some forms of reach extension include enabling top teachers who have managerial competencies to lead multiple classrooms. Professional development that happens in that context — when the lead teacher is both ac-countable and highly capable — would be much more likely to improve outcomes than efforts unteth-ered from responsibility for children. The prospect of professional development led by capable, account-able stars only increases the astonishing potential of an education culture dominated by excellent instructors.70
Implications for the Sector: Building an Opportunity Culture
The projections in the previous section show that with the right combination of strategies, we could come dramatically closer to attaining the timeworn call for “a great teacher in every classroom.” With-out that combination, even if our most promising reforms-in-progress bear fruit, we will not come re-motely close to closing our nation’s achievement gaps or raising the bar to internationally competitive levels for our most advanced students.
We are making good progress as a nation on some components of this combined approach. The most significant gap — the part scarcely on the policy radar screen — is the set of strategies that would retain and leverage the talent of the best teachers. Even as we improve our recruiting and hiring and re-
figure 14. Proportion of Children Served By Great Teachers — Today and in an “Opportunity Culture”
Today
With Additional Bold Recruiting Efforts
With Tripled Dismissal of Low Performers
With Great-Teacher Turnover Rate Cut in Half
With Great Teachers Reaching Double the Students (“Reach Extension”)
All Strategies Above Combined —“Opportunity Culture”
% of children served by great teachers
% of children served by other teachers
The prospect of professional development led by capable, accountable stars only increases the astonishing potential of an education culture dominated by excellent instructors.
22 | o p p o r t u n i t y at t h e t o p w w w. o p p o r t u n i t y c u lt u r e . o r g
move more low performers, we need a substantially heightened focus on education’s top talent.
Achieving that focus requires that we build an “opportunity culture” in public education (see box above). In an opportunity culture, the avenues avail-able to teachers for personal achievement, impact on children, and pay would be many and wide open, in proportion to each teacher’s contributions to student
learning. Policies and systems would be aimed first and foremost at identifying better teachers and pro-viding them with more chances to achieve and help more children, and to receive commensurate rewards. More of the best would stay as they experienced
career advancement and rewards on par with alter-native careers. Eventually, the best teachers would dominate not only the educational experience of our nation’s children, but the professional culture in education.
But U.S. education today is solidly built to be a “security culture” and has only a few, weak elements of an opportunity culture. Real career advancement opportunities — in which better teachers can achieve higher levels of excellence using their full range of talents, reach more children, and reap the economic and psychic rewards — are very limited. Even the very best teachers, the ones who achieve three or four times the learning results of others, have few op-portunities and little more recognition and reward beyond that of the worst teachers.
Proposals addressing the pieces needed to com-plete the opportunity culture puzzle are beginning to circulate.71 These and others must move forward far faster. Together, we must ensure that no major policy or system acts as a barrier to further achieve-ment, contribution, or reward opportunities for great teachers.
In an opportunity culture, the avenues available to teachers for personal achieve- ment, impact on children, and pay would
be many and wide open, in proportion to each teacher’s contributions.
Opportunity Culture
An organization or field of endeavor open to all candidates with valid indi cators of likely performance and providing further opportunities for achievement, impact, and rewards that are significant and proportional to each person’s actual effectiveness at work. Resources — money, managerial attention, and further opportunities for achievement and impact — are allocated disproportionately to people who are more effective at work.
Antonym — Security Culture
An organization or field of endeavor into which almost anyone can enter, nearly everyone can stay, and opportunities for achievement, impact, and rewards are predetermined, not proportional to the actual effectiveness of individuals at work. Resources — money, managerial attention, and further opportunities for achievement and impact — are allocated by formula irrespective of individuals’ effectiveness at work.
24 | o p p o r t u n i t y at t h e t o p w w w. o p p o r t u n i t y c u lt u r e . o r g
Reach Extension: the Golden Key to an Opportunity Culture
When great teachers reach more children than their less-effective peers, a greater portion of per-pupil funding flows can return to them. This provides a pre-existing, sustainable means of supporting more pay for better teachers who choose to achieve more impact with their talents. Not all would choose to extend their reach to more children, but many would — if job roles and enabling technologies were already organized to allow it in a variety of ways that could tap each great teacher’s competencies, without diluting effectiveness with students. Not only could the best teachers reach more children directly, they also could have a powerful leveraging effect by man-aging, mentoring, and otherwise enabling higher performance by their more typical peers.
Reach extension by itself is an important means for meeting the needs of far more children, but it is also the first domino in a virtuous cycle of opportu-nity for great teachers. When large numbers of great teachers have an all-you-can-eat menu of achieve-ment opportunities and earn proportionally more money:
→ more of the best potential teachers will enter the profession;
→ more of the proven best will stay; and → dismissals will become far easier, because the re-
placement pool will be stronger and tomorrow’s “bad hires” will be today’s average teachers.
Reach extension is the golden key to achieving — and exceeding — our nation’s boldest goals, both for re-cruiting and retaining great teachers and for dismiss-ing the worst.
First Steps Toward Building an Opportunity Culture: The Will and the Way
How can public education move toward an oppor-tunity culture? This is the detailed subject of the companion report, Seizing Opportunity at the Top.72 Here we initiate the conversation in hopes of igniting further thinking and action by others. Two areas of action are essential: finding the will and the way to build an opportunity culture.
The Will. Our nation’s great teachers can ac-complish only so much within the shackles of cur-rent policies and practices. They are dependent on political leadership and management determination, from the White House to the schoolhouse, to effect changes that put great teachers first.
Our federal government, state leaders, district leaders, and school leaders must use the powers they already have to remove barriers and start building opportunities for our best teachers. When the power is lacking, leaders must indeed lead and take our nation’s laws, regulations, and other policies in new directions that enable great teachers to reach more children effectively. When will is wanting at the local or state level, leaders with broader powers must enforce existing laws in new ways that reflect modern realities — or create new legal means for our nation’s children to gain access to highly effective instruction. The moral imperative is enormous, and the alterna-tive unacceptable.
The Way. Many systems operate together to de-fine our nation’s existing security culture in educa-
When great teachers reach more children, a larger portion of per-pupil funding
can return to them.
If great teachers can advance their careers by reaching more children and earning more money, more will stay, more will enter, and low-performer dismissal will become far easier.
w w w. o p p o r t u n i t y c u lt u r e . o r g o p p o r t u n i t y at t h e t o p | 25
tion. Of course these include human capital systems, from recruitment, hiring, pre-service training, job design, and professional development to performance evaluation, tenure, and pay. But other systems play a role as well: funding formulas, facilities, technology, and school design.
These systems are a tightly wound chain of poli-cies that choke off opportunities for our nation’s best educators at every turn. For example, education leaders who want to pay top teachers to reach more children cannot in most district public schools, be-cause pay is predetermined by formula in “steps and lanes” compensation policies. Likewise, principals with willing top-notch teachers who want to use their work time to instruct far more children would have to craft these roles from scratch, without an existing flow of appropriately selected support staff, and at the risk of violating state laws on class size. Technology to import world-class instruction while top teachers on site focus all work time on instruct-ing more children in smaller groups is similarly hampered by funding streams built for a one-teacher-one-classroom model, even though this guarantees children in the vast majority of classrooms a sub-excellent instructional experience.
An opportunity culture, one that supports great teachers at every turn, will include tightly designed and purposefully implemented systems with clear and specific goals. As a start, education leaders will commit to the ultimate goal: providing every child with instruction that achieves results at least on par with what top-progress teachers provide today, by any means necessary — in all important topics, every year. In pursuit of that goal, teacher effectiveness will be rigorously assessed with measures including and correlated with student outcomes. These mea-sures will be used to attract, identify, develop, retain, reward, and extend the reach of great teachers. Sup-porting peers will play their part, but top-performing teachers will be the undisputed leaders of the educa-tion field, without leaving instruction.
Because they will be clearly identified and their reach extended to more children, great teachers will
accrue far more pay, prestige, and power over educa-tion operations and policies. More high-potential candidates will see education as “the place for me” and enter, keeping today’s top teachers on their toes and beginning a virtuous cycle of performance, advancement opportunity, rewards, retention, and further attraction of excellent new teachers. In an op-portunity culture, the best teachers will never again need to remind themselves why they chose education over other careers. It will be obvious, and they will have peers with whom they can openly reveal their ambitions of achievement and impact on children and our nation’s course.
Our nation’s great teachers can accomplish only so much within the shackles of current policies and practices.
26 | o p p o r t u n i t y at t h e t o p w w w. o p p o r t u n i t y c u lt u r e . o r g
Education leaders within single schools, districts, and charter management organizations, and across entire states can start effecting these changes now — in some cases all at once, in others one by one. Only one guidepost is needed to choose changes wisely: a commitment that all children have access to instruction that achieves high-progress results on par
with today’s leading teachers. Leaders must do any-thing necessary to identify, utilize, and keep the great teachers among us who can get the job done.
Conclusion
Policymakers and education leaders have far more at their fingertips to offer our nation’s best teachers. Top teachers, in turn, have far more to offer our na-tion’s children than current policies enable them to deliver. We must work together to ensure that our nation’s education system is rebuilt around America’s great teachers. Building an opportunity culture in education will take creativity, hard work, and deter-mination, three of our nation’s greatest strengths and ones we must rely on now to close our gaps, raise our bar, and keep our nation great.
Education leaders within single schools, districts, and charter management organi-
zations, and across entire states can start effecting these changes now.
1. Examples of pipeline initiatives include The New Teacher Project’s various “Teaching Fellow” programs (http://www.tntp.org/teach.html); Teach For America’s annual placement of top college graduates in high-need schools (http://teachforamerica.org/mission/mission_and_approach.htm); the Woodrow Wilson Indiana Teaching Fellowship (http://www.woodrow.org/index.php); and urban teacher residency programs such as the Boston Teacher Residency (http://www.bostonteacherresidency .org/), and Chicago’s Academy of Urban School Leadership (http://www.ausl-chicago.org/).
2. The New Teacher Project, The Widget Effect: Our National Failure to Acknowledge and Act on Differences in Teacher Effectiveness (New York: The New Teacher Project, 2009).
3. More than 10 percent of the points awarded in the $4.3 billion Race to the Top competition are for measuring teacher and leader effectiveness and using the data to make such decisions as pay, tenure, and dismissal. U.S. Depart-ment of Education, “Race to the Top Executive Summary,” November 2009.
4. Measuring teacher effectiveness and acting on the data are major focal points of the Bill and Melinda Gates Foun-dation’s multisite “Empowering Effective Teachers” initia-tive. See “Empowering Effective Teachers: Readiness for Reform” for details. Available: http://www.gatesfoundation .org/united-states/Pages/empowering-effective-teachers-readiness.aspx.
5. Statement is based on comparing top-quartile teachers’ results with those of bottom-quartile teachers’ results. Com-pared with second- and third-quartile teachers, of course, top-quartile teachers’ relative advantage is smaller. See notes 12 and 14 for calculations underlying this statement.
6. Teach For America, “Teach For America Adds Largest Number of Teachers in History,” News Release, May 9, 2009. Available: http://www.teachforamerica.org/newsroom/ documents/20090528_Teach_For_America_Adds_Largest _Number_of_Teachers_in_History.htm.
7. Based on an average class of 20 students. See National Center for Education Statistics, “Highest Degree Earned, Years of Full-Time Teaching Experience, and Average Class Size for Teachers in Public Elementary and Secondary Schools, by State: 2007–08,” Projections of Education Statis-tics to 2018, 2009. Available: http://nces.ed.gov/programs/ digest/d09/tables/dt09_067.asp.
8. William L. Sanders and Joan C. Rivers, Cumulative and Residual Effects of Teachers on Future Student Academic
Achievement (Knoxville, TN: University of Tennessee Value-Added Research and Assessment Center, 1996).
9. For example, see Eric A. Hanushek, Steven G. Rivkin, and John F. Kain, “Teachers, Schools, and Academic Achieve-ment,” Econometrica, 73, 2 (2005), 417–458; Jonah E. Rock-off, “The Impact of Individual Teachers on Students’ Achievement: Evidence from Panel Data,” American Eco-nomic Review 94, 2 (2004), 247–52.
10. Carolyn J. Hill, Howard S. Bloom, Alison Rebeck Black, and Mark W. Lipsey, Empirical Benchmarks for Inter-preting Effect Sizes in Research (MDRC Working Papers on Research Methodology) (New York: MDRC, 2007), p. 2. Available: https://www.mdrc.org/publications/459/full.pdf. The study estimates the average annual gain in 4th-grade math to be equivalent to an “effect size” of 0.52, which means that average gain is about one-half of a standard de-viation of test scores in that subject and grade.
11. Thomas Kane, Jonah E. Rockoff, and Douglas O. Staiger, What Does Certification Tell Us About Teacher Effec-tiveness? (2006). Available: http://www.dartmouth.edu/ ~dstaiger/Papers/nyc%20fellows%20march%202006.pdf.; Robert Gordon, Thomas Kane, and Douglas O. Staiger; Identifying Teacher Performance on the Job (Washington, DC: The Brookings Institute, 2006). Available: http://www .brookings.edu/views/papers/200604hamilton_1.pdf.
12. Authors’ calculations based on comparing results re-ported in the Los Angeles (LA) study (Gordon, Kane and Staiger, 2006) and the New York City (NYC) study (Kane, Rockoff and Staiger, 2006) with the “normal” gains reported in Hill et al. (2007). In the LA study, 4th-grade math stu-dents with top-quartile teachers gained 5 percentile points while those with bottom-quartile teachers lost 5 points, for a difference of 10 percentile points, approximately equivalent to an effect size of 0.29. The NYC study found the effect size of having a top-quartile to a bottom-quartile teacher to be 0.33. So 0.31 is a reasonable estimate of the effect size of a top- vs. bottom-quartile teacher in 4th-grade math. Hill et al. (2007)’s average normal gain in 4th-grade math in effect size terms is 0.52. Combining these figures, we calculated that the difference between top- and bottom-quartile teach-ers is about 60 percent of a normal year’s worth of progress, or six months out of a 10-month school year.
13. Dan Goldhaber, Teacher Pay Reforms: The Political Implications of Recent Research (Washington, DC: Center for American Progress, 2009 [originally published 2006]), p. 4. Emphasis in original. Available: http://www.american-progress.org/issues/2006/12/pdf/teacher_pay_report.pdf.
14. Authors’ calculations based on Hill et al. (2007) re-ported effect size equivalents for the 4th-grade math test-
score gap between white and black students (0.99) and non-FRPL-eligible and FRPL-eligible students (0.85). Dividing these figures by their 4th-grade math “normal” growth esti-mate (0.52) yields nearly two years for the white/black gap and 1.7 years for the non-eligible/eligible gap.
15. As explained in note 12, the difference between top- and bottom-quartile teachers is about 60 percent of a nor-mal year’s worth of progress in 4th-grade math. With a black-white test-score gap in 4th-grade math at nearly two years, four years of 60 percent higher growth would more than eliminate the gap for an African-American student. By the same analysis, the gap between students eligible for free or reduced-price lunch and non-eligible students would be more than eliminated in three years.
16. The policy directions suggested in this paper would include increased access to top teachers by all children. Once children achieve today’s grade-level standards, teachers would enable them to make further progress, as advanced students do today when they have great teachers.
17. McKinsey & Company, The Economic Impact of the Achievement Gap in America’s Schools (McKinsey & Com-pany, 2009). Available: http://www.mckinsey.com/App_Media/Images/Page_Images/Offices/SocialSector/PDF/achievement_gap_report.pdf
18. Caroline Hoxby and Andrew Leigh, “Pulled Away or Pushed Out? Explaining the Decline of Teacher Aptitude in the United States,” AEA Papers and Proceedings, 94, 2 (2004), 236–240.
19. Gordon, Kane, and Staiger, 2006.20. National Center for Education Statistics, “Table 32.
Actual and Alternative Projected Numbers for Elementary and Secondary Teachers and Elementary and Secondary New Teacher Hires, by Control of School: Fall 1992 through Fall 2017,” Projections of Education Statistics to 2018, 2009. Available: http://nces.ed.gov/programs/projections/pro jections2017/tables/table_32.asp?referrer=list.
21. The New Teacher Project, The Widget Effect; The Bill and Melinda Gates Foundation, Empowering Effective Teachers: Strategies for Implementing Reforms (Seattle, WA: The Foundation, 2010), p. 1; Robin Chait and Raegan Miller, Treating Different Teachers Differently: How State Policy Should Act on Differences in Teacher Performance to Improve Teacher Effectiveness and Equity (Washington, DC: Center for American Progress, 2010).
22. Richard Ingersoll, Unraveling the “Teacher Shortage” Problem: Teacher Retention is the Key, symposium of the Na-tional Commission on Teaching and America’s Future and NCTAF Partners, August 20–22, 2002, Washington, DC. Available: http://www.ncsu.edu/mentorjunction/text_files/teacher_retentionsymposium.pdf; Gary Barnes, Edward Crowe, and Benjamin Schaefer, The Cost of Teacher Turn-
over in Five School Districts: A Pilot Study. (Washington, DC: The National Commission on Teaching and America’s Future, 2007). Available: http://www.nctaf.org/resources/demonstration_projects/turnover/documents/CTTFull Reportfinal.pdf.
23. Institute for Education Sciences, Teacher Attrition and Mobility: Results from the 2004–05 Teacher Follow-up Survey. (Washington, DC: U.S. Department of Education, 2007). Available: http://nces.ed.gov/pubs2007/2007307.pdf .
24. Robin Chait and Raegan Miller, Teacher Turnover, Tenure Policies, and the Distribution of Teacher Quality: Can High-Poverty Schools Catch a Break? (Washington, DC: Center for American Progress, 2009). Available: http://www.americanprogress.org/issues/2008/12/pdf/teacher_ attrition.pdf; National Council on Teaching Quality and U.S. Department of Education, International Affairs Office, Attracting, Developing, and Retaining Effective Teachers: Background Report for the United States (Washington, DC: U.S. Department of Education, 2008). Available: http://www.oecd.org/dataoecd/18/52/33947533.pdf; Karen J. DeAngelis and Jennifer B. Presley, Leaving Schools or Leav-ing the Profession: Setting Illinois’ Record Straight on New Teacher Attrition (Edwardsville, IL: Illinois Education Re-search Council Policy Research Report, 2003). Available: http://www.eric.ed.gov/ERICDocs/data/ericdocs2sql/ content_storage_01/0000019b/80/2b/c2/56.pdf; Brian A. Jacobs, “The Challenges of Staffing Urban Schools with Effective Teachers,” The Future of Children, 17, 1, (2007), 129–153. Available: http://www.futureofchildren.org/ futureofchildren/publications/docs/17_01_07.pdf
25. D.C. Harris and S. J. Adams, “Understanding the level and causes of teacher turnover: A comparison with other professions,” Economics of Education Review, 26, 3, (2007) 325–337. The authors limited their analysis to employees with college degrees or higher in the four sectors to make the comparison as relevant to teaching as possible. Includes pri-vate school teachers.
26. The quit rate (voluntary turnover exclusive of retire-ment and transfers to other locations) in professional and business services ranged between 28 and 38 percent between 2001 and 2008, not seasonally adjusted. Bureau of Labor Statistics, “Job Openings and Labor Turnover Survey.” Available: http://www.bls.gov/jlt/data.htm. BLS does not report quit rates for teachers specifically, but its broader “educational services” category reported a 2008 quit rate of 12.7 percent, less than half the business and professional ser-vices rate. Other forms of turnover in education jobs (layoffs and “other separations”) were similarly less than half of busi-ness and professional services rates in 2008.
27. DeAngelis and Presley, 2003; Harris and Adams, 2007.
28. These calculations estimate, in round numbers, how students are affected. With about 50,000,000 students in U.S. public schools (National Center for Education Statis-tics, “Table 2. Actual and Projected Numbers for Enroll-ment in Elementary and Secondary Schools, by Organiza-tional Level and Control of School: Fall 1993 through Fall 2018,” Projections of Education Statistics to 2018, 2009. Avail-able: http://nces.ed.gov/programs/projections/projections 2018/tables/table_02.asp?referrer=list), 12,500,000 (25%) of them have top-quartile teachers at a given time. If 8 per-cent are affected by a teacher’s departure, that amounts to 1,000,000. If one-quarter of the replacements are them - selves top-quartile, 250,000 gain back a top teacher, leaving 750,000 with a less-effective teacher. Of course, these calcu-lations simplify a complicated reality for illustration purposes.
29. Teach For America, “Teach For America Adds Larg - est Number of Teachers in History,” News Release, May 9, 2009.
30. The New Teacher Project, “Our Impact.” Available: http://www.tntp.org/ourimpact/overview.html.
31. Woodrow Wilson National Fellowship, “President Obama Heralds Expansion of Woodrow Wilson Teaching Fellowship in Key States to Prepare Math and Science Teachers for Hard-to-Staff Schools,” News Release, January 6, 2010. Available: http://www.woodrow.org/news/news_items/WW_TchgFellows_Pres_ Jan10.php.
32. Obama Campaign website (now “Organizing for America”), “Education.” Available: http://www.barack obama.com/issues/education; Greg Toppo, “Where they stand: McCain, Obama split on education,” USA Today. October 13, 2008. Available: http://www.usatoday.com/news/education/2008-10-13-obama-mccain-policy_N.htm.
33. Don Boyd, Pam Grossman, Hamp Lankford, Susanna Loeb, and Jim Wyckoff, Who Leaves? Teacher Attrition and Student Achievement, 2007. Available: http://irepp.stanford .edu/publications/documents/wp_Do_Effective_Teachers_Leave.pdf; Dan Goldhaber, Betheny Gross and Daniel Player, Are Public Schools Really Losing Their “Best”? Assess-ing the Career Transitions of Teachers and Their Implications for the Quality of the Teacher Workforce (CRPE Working Paper #2007_2) (Seattle, WA: CRPE, 2007). Available: http://www.crpe.org/cs/crpe/download/csr_files/wp_crpe2 _ttlosingbest_sept07.pdf; Eric A. Hanushek, John F. Kain, Daniel M. O’Brien, and Steven G. Rivkin, The Market for Teacher Quality, prepared for the American Economic Asso-ciation Meeting: Philadelphia, January 6–8, 2005. Available: http://www.aeaweb.org/annual_mtg_papers/2005/0107 _0800_0803.pdf; John M. Krieg, “Teacher Quality and At-trition,” Economics of Education Review, 25 (2004) 13–27; Martin R. West and Matthew M. Chingos, “Teacher Effec-
tiveness, Mobility, and Attrition in Florida,” Performance Incentives: Their Growing Impact on American K-12 Educa-tion, ed. Matthew G. Springer, (Washington, DC: Brook-ings Institute, 2009). Available: http://www.people.fas.har-vard.edu/~chingos/West-Chingos_prepub.pdf.
34. The New Teacher Project, The Widget Effect.35. Jacob Vigdor, “Scrap the Sacrosanct Salary Schedule,”
36. Public Impact, Re-Slicing the Teacher Compensation Pie (Chapel Hill, NC: Public Impact, 2009). Available: http://www.publicimpact.com/teacher-compensation-pie.
37. Matthew M. Chingos and Martin R. West, Do more effective teachers earn more outside of the classroom? Unpub-lished. We received the authors’ consent to reference the unpublished manuscript.
38. Public Impact, Dials of Reform: What Job Protections in Academia and the Civil Service Teach Us about Tenure in Public Education. (Chapel Hill, NC: Public Impact, Forth-coming 2010).
39. National Council on Teacher Quality, NCTQ State Policy Yearbook 2008: National Summary (Washington, DC: The Council, 2008), p. 3.
40. Robert M. Costrell and Michael Podgursky, “Peaks, Cliffs, and Valleys,” Education Next, 8, 1, (2008), 22–28. Available: http://educationnext.org/files/ednext_20081_22.pdf; Michael Podgursky and Mark Ehlert, Teacher Pensions and Retirement Behavior: How Teacher Pension Rules Affect Behavior, Mobility and Retirement, (CALDER Working Paper 5) (National Center for Analysis of Longitudinal Data in Education Research, 2007). Available: http://www .caldercenter.org/PDF/1001071_Teacher_Pensions.pdf
41. Robert M. Costrell and Michael Podgursky, “Golden Handcuffs,” Education Next, 10, 1 (2010), 60–66. Available: http://educationnext.org/golden-handcuffs.
42. HayGroup, Bridging the Pay-for-Performance Gap: Establishing Truly Differentiated Rewards (Philadelphia, Pa.: HayGroup, 2004). Our national failure to recognize high-performing teachers includes the consistent failure in sur-veys to distinguish the opinions of these teachers from their less-effective peers.
43. NCTQ State Policy Yearbook 2008, p. 7.44. Public Impact, 3X for All: Extending the Reach of Edu-
cation’s Best (Chapel Hill, NC: Public Impact, 2009). Avail-able: http://publicimpact.com/3x-for-all.
45. For examples see Public Impact, 3X for All, box titled “High-Touch Reach Extension: A Powerful Combination.”
46. Dan C. Lortie, Schoolteacher: A Sociological Study (Chicago: University of Chicago Press, 1975), pp. 14–15.
47. Richard Elmore, Bridging the Gap Between Stan - dards and Achievement: The Imperative for Professional De-
velopment (Washington, DC: Albert Shanker Institute, 2002), p. 4.
48. Kyle Zinth, Maximum P-12 Class-Size Policies State Note (Denver, CO: Education Commission of the States, 2009), p. 1.
49. Public Impact, Re-Slicing the Teacher Compensa - tion Pie.
50. Paul T. Hill, Marguerite Roza, and James Harvey, Facing the Future: Financing Productive Schools (Seattle, WA: Center on Reinventing Public Education at the Uni-versity of Washington Bothell, 2008). Available: http://www.crpe.org/cs/crpe/download/csr_files/pub_sfrp_ finalrep_nov08.pdf.
51. For information about inter-state reciprocity in teacher licensure, see “The NASDTEC Interstate Agreement Facili-tating Mobility of Educational Personnel” (National Associ-ation of State Directors of Teacher Education and Certifica-tion). Available: http://www.nasdtec.org/agreement.php.
52. Michael S. Garet et al., Designing Effective Professional Development: Lessons from the Eisenhower Program (Wash-ington, DC: U.S. Department of Education, 1999), pp. 3–10. Available: http://www2.ed.gov/inits/teachers/eisenhower/chapter3.pdf.
53. Garet et al., Designing Effective Professional Develop-ment, pp. 3–13.
54. Research on PD that produces student learning gains summarized in: Kwang Suk Yoon et al., Reviewing the evi-dence on how teacher professional development affects student achievement (Washington, DC: Institute of Education Sci-ences, 2007).
55. The New Teacher Project, The Widget Effect, pp. 6, 14.56. All projections on the following pages are based on a
model that begins with a starting distribution of 25 percent of teachers in each of today’s quartiles of effectiveness, and then projects the change in that distribution each year as ex-isting teachers leave the profession, new teachers enter, and (if applicable) top teachers extend their reach to more stu-dents. The projections model the consequences of changing key parameters, such as increasing the percentage of newly entering teachers who match today’s top quartile from 25 percent to 40 percent. Like any projection or model, the re-sults are intended to be illustrative rather than definitive predictions of the future.
57. The same analyses could be done using any divisions of interest, such as quintiles.
58. NCES, Projection to 2018, p. 78, using “middle alterna-tive projection” for public schools only.
59. Here we assume that the effectiveness of the replace-ment pool mirrors the effectiveness of the departing pool. However, this is a factual question worthy of future study. On average, entering teachers do not reach their stride of ef-
fectiveness for approximately two or three years, so our pro-jections about the benefit of additional recruiting may be generous. There is likely a two- to three-year lag time even for top-notch replacements to achieve the learning progress results that high-performing departing teachers achieve. These factors make reach extension and high-performer re-tention strategies, highlighted later in this paper, even more compelling. For studies of the lag in effectiveness for teach-ers early in their careers, see, for example, Sunny Ladd, Charles Clotfelter, and Jacob Vigdor, Teacher Credentials and Student Achievement in High School: A Cross-Subject Analysis with Student Fixed-Effects, NBER Working Paper 13617, 2007; Eric Hanushek, John F. Kain, Daniel M. O’Brien, and Steven G. Rivkin, The Market for Teacher Quality, (Working Paper No. 1115, Cambridge, MA: National Bureau of Economic Research, 2005); and J.E., Rockoff, “The Impact of Individual Teachers on Student Achievement: Evidence from Panel Data,” American Eco-nomic Review, 94(2), 247–252.
60. In Figure 8, our calculations assume that as the per-centage of recruits into the top effectiveness group rises by 15 percentage points (from 25 to 40), the percentage in each of the three other effectiveness group falls by 5 percentage points, so that the sum across the four groups remains 100 percent (40+20+20+20). In Figures 9 through 13, we assume a similar, equal distribution after changes modeled here, unless otherwise indicated.
61. According to Projections of Education Statistics to 2018, enrollment in public schools is likely to exceed 52 million within five years, meaning 25 percent of students will at that time exceed 13 million.
62. Gordon, Kane, and Staiger (2006).63. P. Aritomi and J. Coopersmith, Characteristics of Pub-
lic School Districts in the United States: Results From the 2007–08 Schools and Staffing Survey (NCES 2009-320) (Washington, DC: National Center for Education Statis-tics, 2009), 14.
64. This figure does not include the enhanced recruit-ment described in the previous section — only the annual dismissal of the bottom 5 percent.
65. See, for example, Bill Leonard, “College graduates en-tering the workforce have lowered expectations,” HR Maga-zine, November 2001. Available: http://findarticles.com/p/articles/mi_m3495/is_11_46/ai_80327062; Laura Fragiaco-mo’s “Talking about Y generation,” Managing Information Strategies, January 2005. Available: http://www.misweb .com/magarticle.asp?doc_id=24223&rgid=7&listed_months=0; and Young Money’s “New Grads Don’t Stay at First Job for Long,” December 6, 2006. Available: http://www.youngmoney.com/blog/?cat=7.
66. Adapted from Public Impact, 3X for All (2009), pp. 2–3.
67. Non-instructional tasks consume up to half of a teach-er’s day currently. In many cases, increasing the number of children reached by 50 percent could still leave a quarter of the work day for essential administrative tasks and develop-ing other teachers. See National Center for Educational Statistics, Characteristics of Schools, Districts, Teachers, Prin-cipals, and School Libraries in the United States, 2003–04 [Schools and Staffing Survey] (Washington, DC: U.S. De-partment of Education, Revised June 2007), Table 26.
68. See, for example, this article about a Korean firm that is an early mover in this field: “Where a teacher can make millions,” Business Week, September 2006. Available: http://www.businessweek.com/magazine/content/06_50/b4013056.htm
69. See 3X for All for a more detailed discussion of match-ing great teachers with the right children and reach exten-sion methods.
70. For two recent examples of efforts to document and share what top teachers do for the benefit of other teachers, see Doug Lemov, Teach Like a Champion: 49 Techniques that Put Students on the Path to College (San Francisco: Jossey-Bass, 2010); and Steven Farr and Teach For America, Teaching As Leadership: The Highly Effective Teacher’s Guide to Closing the Achievement Gap (San Francisco: Jossey-Bass, 2010).
71. Barnett Berry, The Teachers of 2030: Creating a Student-
Centered Profession for the 21st Century (Hillsborough, NC: Center for Teaching Quality, 2009); Chait and Miller, Treating Different Teachers Differently; Jane Coggshall, Molly Lasagna, and Sabrina Laine, Toward the Structural Transformation of Schools: Innovations in Staffing (Naper-ville, IL: Learning Point Associates, 2009); Steven Glazer-man et al., America’s Teacher Corps (Washington, DC: Brookings Institution, 2010); Frederick M. Hess, “How to Get the Teachers We Want,” Education Next 9, 3 (Summer 2009), 35–39; National Council on Teacher Quality, Human Capital in Boston Public Schools: Rethinking How to Attract, Develop and Retain Effective Teachers (Washington, DC: NCTQ, 2010); Public Impact, 3X for All: Extending the Reach of Education’s Best; Elena Silva, Teachers at Work: Im-proving Teaching Quality through School Design (Washing-ton, DC: Education Sector, 2009); TeachPlus, Ready for the Next Challenge: Improving the Retention and Distribution of Excellent Teachers in Urban Schools; A Proposal by Teachers (Boston, MA: TeachPlus, 2009); Dan Goldhaber and Jane Hannaway (eds.), Creating a New Teaching Profession (Washington, DC: Urban Institute, 2010).
72. Seizing Opportunity at the Top: How America’s Best Teachers Can Close Our Gaps, Raise the Bar and Keep Our Nation Great (Chapel Hill, N.C.: Public Impact, Forthcom-ing 2010).