How animals distribute themselves inspace energy landscapes of Antarctic avianpredatorsJuan F Masello1 Andres Barbosa2 Akiko Kato3 Thomas Mattern14 Renata Medeiros56 Jennifer E Stockdale5Marc N Kuumlmmel7 Paco Bustamante89 Josabel Belliure10 Jesuacutes Benzal11 Roger Colominas-Ciuroacute2Javier Meneacutendez-Blaacutezquez2 Sven Griep7 Alexander Goesmann7 William O C Symondson5 and Petra Quillfeldt1
Abstract
Background Energy landscapes provide an approach to the mechanistic basis of spatial ecology and decision-making in animals This is based on the quantification of the variation in the energy costs of movements through agiven environment as well as how these costs vary in time and for different animal populations Organisms asdiverse as fish mammals and birds will move in areas of the energy landscape that result in minimised costs andmaximised energy gain Recently energy landscapes have been used to link energy gain and variable energy costsof foraging to breeding success revealing their potential use for understanding demographic changes
Methods Using GPS-temperature-depth and tri-axial accelerometer loggers stable isotope and molecular analysesof the diet and leucocyte counts we studied the response of gentoo (Pygoscelis papua) and chinstrap (Pygoscelisantarcticus) penguins to different energy landscapes and resources We compared species and gentoo penguinpopulations with contrasting population trends
Results Between populations gentoo penguins from Livingston Island (Antarctica) a site with positive populationtrends foraged in energy landscape sectors that implied lower foraging costs per energy gained compared withthose around New Island (FalklandMalvinas Islands sub-Antarctic) a breeding site with fluctuating energy costs offoraging breeding success and populations Between species chinstrap penguins foraged in sectors of the energylandscape with lower foraging costs per bottom time a proxy for energy gain They also showed lowerphysiological stress as revealed by leucocyte counts and higher breeding success than gentoo penguins In termsof diet we found a flexible foraging ecology in gentoo penguins but a narrow foraging niche for chinstraps
Conclusions The lower foraging costs incurred by the gentoo penguins from Livingston may favour a higherbreeding success that would explain the speciesrsquo positive population trend in the Antarctic Peninsula The lowerforaging costs in chinstrap penguins may also explain their higher breeding success compared to gentoos fromAntarctica but not their negative population trend Altogether our results suggest a link between energylandscapes and breeding success mediated by the physiological condition
Keywords Antarctica Breeding success Chinstrap penguin Pygoscelis antarcticus Energy costs Energy landscapesGentoo penguin Pygoscelis papua Physiological condition Physiological stress Population trends Sub-Antarctic
copy The Author(s) 2021 Open Access This article is licensed under a Creative Commons Attribution 40 International Licensewhich permits use sharing adaptation distribution and reproduction in any medium or format as long as you giveappropriate credit to the original author(s) and the source provide a link to the Creative Commons licence and indicate ifchanges were made The images or other third party material in this article are included in the articles Creative Commonslicence unless indicated otherwise in a credit line to the material If material is not included in the articles Creative Commonslicence and your intended use is not permitted by statutory regulation or exceeds the permitted use you will need to obtainpermission directly from the copyright holder To view a copy of this licence visit httpcreativecommonsorglicensesby40The Creative Commons Public Domain Dedication waiver (httpcreativecommonsorgpublicdomainzero10) applies to thedata made available in this article unless otherwise stated in a credit line to the data
Correspondence juanfmasellobiouni-giessende1Department of Animal Ecology amp Systematics Justus Liebig UniversityGiessen Heinrich-Buff-Ring 26 D-35392 Giessen GermanyFull list of author information is available at the end of the article
Masello et al Movement Ecology (2021) 924 httpsdoiorg101186s40462-021-00255-9
BackgroundThe current degree of anthropogenic space use bothat sea and land and climate change make it impera-tive to understand animal movement if meaningfulconservation and management measures are to betaken [1ndash3] Animals move to find critical resources[4] but increasingly they have to negotiate habitatsthat are intensively-used fragmented impoverishedor modified by climate change which may determineindividual survival and thus population dynamics andpersistence [5ndash7] Simultaneously a growing availabil-ity of high-resolution animal tracking technologies hasgreatly enhanced our ability to describe animal move-ments [4 8 9] which in turns guides and refinesconservation and management measures [10 11]Moreover current technologies offer a unique oppor-tunity to explore pioneering questions in ecology andto explain in depth the causes and fundamentalmechanisms of movement patterns and their signifi-cance for ecological and evolutionary processes [8 912]The first systematic attempts to understand the role of
behaviour in the distribution of animals originated fromoptimal foraging theory [13 14] In this context animalsshould exhibit behaviours that maximize energetic effi-ciency selecting patches where the gain per unit cost ishigh and the energy expenditure to reach them is mini-mized As movement accounts for such a large propor-tion of animal energy budgets energetic constraints withrespect to space use migration and foraging range areforeseeable factors [15ndash17] Unnecessary movementsand resulting energy deficits might increase the risk ofpredation reduce body condition increase physiologicalstress affect fitness and since the sum of individual re-sponses is ultimately reflected at the population-level bethe cause of population declines [12 18ndash22] Animalmovement has also been investigated in terms of thephysical mechanics of motion (biomechanical paradigm)the movement-related decisions made by the individuals(cognitive paradigm) and the theories of random walkdiffusion and anomalous diffusion (random paradigm)[6] More recently the paradigm of energy landscape hasopened a new approach to the mechanistic basis ofspatial ecology and decision-making in wild animals[12] The energy landscape paradigm (sensu Wilsonet al) [23] allows the quantification of the variation inthe energy costs of the movement through a given envir-onment [12] as well as how these costs vary in time andfor different animal populations moving there [21] usingfor instance environmentally dependent costs of trans-port generated by parameters such as incline substratetype vegetation current speed or direction [24] Re-search conducted in organisms as diverse as fish mam-mals and birds showed that animals will move in areas
of the energy landscape that result in minimized costsand maximised energy gain [19 21 23 25ndash27]In seabirds variable oceanographic conditions and fluc-
tuating food availability can affect the costs of moving andenergy landscapes capture this variation successfully [21]For instance considering the energetic costs and durationof flights dive and inter-dive phases Wilson et al [23]found that imperial cormorants Phalacrocorax atriceps se-lected foraging areas that varied greatly in the distancefrom the breeding colony and in water depth but alwaysindicated minimal energetic cost of movement comparedwith other areas in the available landscape Likewiseevaluating the daily energy requirements of an individualusing the biophysical properties of bodies (body shape andits heat flux) exposed to specific microclimatic conditions(sea surface temperature SST air temperature cloudcover relative humidity and wind speed) Ameacutelineau et al[27] found that little auks Alle alle targeted areas withmoderately elevated energy landscapes in winter In gen-too penguins Pygoscelis papua (hereafter gentoos) whenconsidering mass-specific costs of foraging to dive to aparticular depth plus commuting to a certain distanceand energy gained in terms of diving bottom time the en-ergy landscapes around two nearby colonies variedstrongly between years Yet the birds consistently usedthe areas of the energy landscape that resulted in lowerforaging costs However for these gentoos the breedingsuccess was low in a year of higher energy expenditurewhile it was high during a year of lower energy expend-iture suggesting the usefulness of energy landscapes tounderstand demographic changes and their consequencesfor conservation [21]We combined information from previous work on the
energy landscape in gentoos [21] with novel data on move-ment and diet and 1) studied the response of moving ani-mals to different energy landscapes and resources and 2)compared populations with contrasting population trendsGentoos are facing strong environmental change both inAntarctic and sub-Antarctic regions The Antarctic Penin-sula is one of the places where current environmentalchange is fastest [28] In both regions gentoos are knownto show considerable plasticity in their diet diving and for-aging behaviour [29 30] providing a buffer against changesin prey availability [31] However gentoos exhibit strikinglydifferent population trends in sub-Antarctic and Antarcticpopulations Since 1990 gentoos at the FalklandMalvinasIslands showed a great degree of inter-annual variability inthe number of breeding individuals which has been relatedto the Southern Oscillation Index (SOI) and the El NintildeoSouthern Oscillation (ENSO) yet the underlying mecha-nisms remain unknown [32] In contrast gentoos have beenincreasing at breeding colonies along the Antarctic Penin-sula and expanded southwards since 1979 [33ndash35] Thispositive population trend was understood as gentoos being
Masello et al Movement Ecology (2021) 924 Page 2 of 25
the lsquowinnersrsquo among Pygoscelis penguins of the reduction inthe sea-ice cover in the region because it positively affectsits winter survival (sea-ice hypothesis) [36] An alternativehypothesis postulated that penguin population dynamics inAntarctica were instead controlled through ldquotop-downrdquo fac-tors such as competition for prey [37] while another relatedhypothesis suggested a link between penguin populationtrends and changes in the abundance of their main preyAntarctic krill Euphausia superba [38] However it hasbeen shown that sea-ice cover and krill abundance are in-terrelated [39 40] Even more other aspects need to beconsidered such as fine-scale spatial heterogeneity in popu-lation dynamics observed on the Antarctic Peninsula [41]intra-specific competition [40] and adaptive shifts introphic position [42] But regardless of this research nostudy has yet considered the cost of foraging The energylandscape approach could provide a way to better under-stand the ecological processes involved as the energeticbalance between costs and benefits will affect how andwhich foraging areas are selected or avoided and the condi-tion of the birds which in turn will affect reproductive suc-cess and ultimately population dynamicsIn our present study we tested the following hypotheses
a) in optimal sites (Antarctic Peninsula and islands aroundit) gentoos forage in sectors of the energy landscapes
where low energy is required b) in suboptimal breedingsites like the FalklandMalvinas Islands (fluctuating popu-lations) gentoos are forced to forage in more expensiveconditions in the poorer years and c) foraging in areas ofthe energy landscapes that result in minimized energeticcosts will lead to better individual condition as shown byphysiological parameters such as leucocyte counts Tounderstand our results in a wider context we also investi-gated the diet and the energy landscape in chinstrap pen-guins Pygoscelis antarcticus (hereafter chinstraps) anAntarctic species with currently declining populations [3543 44] We tested the hypothesis that d) chinstraps showhigher energy expenditure than Antarctic gentoos
MethodsStudy sites and speciesWe collected data on three penguin populations gentoosfrom an Antarctic and a sub-Antarctic breeding site andchinstraps from an Antarctic breeding site We studied apopulation of gentoos breeding at a colony located in DevilsPoint Byers Peninsula Livingston Island South ShetlandIslands maritime Antarctica (hereafter Livingston 3000nests 62deg40primeS 61deg13primeW Fig 1) [45] Byers is characterisedby a high biological diversity due to relatively mild climaticconditions and a large ice-free area in summer [45] This
Fig 1 Overview of the location of the studied gentoo penguin Pygoscelis papua colonies at Devils Point Byers Peninsula Livingston Island SouthShetland Islands maritime Antarctica and New Island FalklandMalvinas Islands and the chinstrap penguin Pygoscelis antarcticus colony atVapour Col rookery Deception Island South Shetland Islands maritime Antarctica
Masello et al Movement Ecology (2021) 924 Page 3 of 25
breeding population is located in an optimal breeding siteas gentoos are increasing in numbers in this location in thelast decades [45] following the population increase andarea expansion in this region [33 41] We furthermore in-vestigated energy landscapes of chinstraps at Vapour Colrookery on the west side of Deception Island South Shet-land Islands (hereafter Deception 20000 breeding pairs63deg 00primeS 62deg40primeW Fig 1) [43] a species declining on theAntarctic Peninsula [41 44] We further studied the for-aging strategies and mechanism of gentoos of a fluctuatingpopulation New Island in the FalklandMalvinas Islands(hereafter New Island) [21 32] On New Island we investi-gated two breeding colonies one located at the North End(around 5000 breeding pairs 51deg 41402prime S 61deg 15003prime W)and one at the South End (around 2000 breeding pairs 51deg44677prime S 61deg17683prime W) [46] The data previously obtainedat New Island [21] as well as samples analysed in currentstudy are used for the comparisons between optimal andsuboptimal breeding sites
Instrumentation and fieldwork proceduresWe simultaneously deployed a combination of GPS-temperature-depth (GPS-TD earthampOCEAN Technolo-gies Kiel) and micro tri-axial accelerometer loggers(Axy-2 Technosmart Europe Rome Italy) or Axy-Trekloggers only (including GPS accelerometer and bothpressure and temperature sensors) on the penguins dur-ing chick guard For sample sizes per study site and
species see Table 1 We captured the birds mostly byhand in the nests with the occasional help of a hook at-tached to a rod [21] or a long-handle net [47] To pro-tect them from predators we also captured the chicksduring the handling of the adult We kept handling timemostly below 15min and always below 20min We tookextreme care to minimize stress to the captured birdscovering the head during handling in order to minimizethe risk of adults regurgitating During this procedurenone of the birds regurgitated We attached the loggerson the adult penguin with adhesive Tesareg 4651 tape [21]The loggers used (GPS-TD 75 to 145 g and Axy-2 19 gAxy-Trek 60 g) represented a maximum of a 3 of theadult gentoo body mass (mean for Livingston 52128 plusmn4782 g n = 25) or 4 of the adult chinstrap body mass(mean for Deception 37435 plusmn 4254 g n = 20) and had ashape that matched the body contour to reduce drag[48] In a previous study [49] we showed that handlingand short-term logger attachments like the ones in thisstudy showed limited effect on the behaviour and physi-ology of the birds After the deployment procedure andimmediately before the release of the adult bird wereturned the chicks to the nest and released the adultssome 20m from their nests All birds returned to theirnests and attended their chicks shortly after being re-leased The loggers recorded detailed position (longitudelatitude sampling interval 5 min) dive depth (reso-lution 35 cm sampling interval 1 s) time of day and
Table 1 Parameters of foraging trips used for the calculations of energy landscapes
Gentoo Chinstrap
Dec 2013 Dec 2014 Dec 2016 Jan 2017
New I South New I South New I North Livingston I Deception I
Short trips Long trips
Individuals tagged 16 8 8 26 18
Number of complete trips 13 4 6 26 19 18
Median trip length [km] 1256 b
(874ndash1618)887 a b
(408ndash1447)591 a (522ndash617) 271 c (199ndash334) 666 a (592ndash710) 377 d (217ndash495)
Kruskal-Wallis χ2 = 721 df = 5 P lt 0001
Median maximum distancefrom colony [km]
669 b (632ndash756) 477 a b
(237ndash756)296 a b (198ndash451) 11 c (86ndash134) 257 a (235ndash321) 155 d (87ndash202)
Kruskal-Wallis χ2 = 753 df = 5 P lt 0001
Median trip duration [min] 17273 a
(10624ndash24326)15796 a
(7652ndash25080)1129 a
(8503ndash15389)5034 b
(3732ndash6417)1049 a
(8661ndash1182)5955 b
(3712ndash6416)
Kruskal-Wallis χ2 = 67 df = 5 P lt 0001
Median start time offoraging (local time)
034146 c
(030546ndash141814)164926 a b
(114702ndash182555)091550 a b c
(031424ndash171355)145248 a
(101034ndash174536)093141 b c
(031005ndash160029)153853 a
(071619ndash183434)
Kruskal-Wallis χ2 = 173 df = 5 P lt 0001
The data correspond to gentoo penguins Pygoscelis papua breeding at New Island (FalklandMalvinas Islands) during chick guard (December) in 2013 and 2014gentoo penguins breeding at Devils Point Byers Peninsula Livingston Island South Shetland Islands Antarctica during chick guard (December 2016) andchinstrap penguins Pygoscelis antarcticus breeding at Vapour Col rookery Deception Island South Shetland Islands Antarctica during chick guard (January 2017)See also Figs S7 and S8 in Additional file 1Note Sample sizes vary with respect to deployments as not all parameters could be calculated for all individuals mainly due to some batteries running outbefore the finalization of an ongoing trip Statistically significant values are marked bold Dunnrsquos homogenous subgroups are indicated in superscriptsimilar letters
Masello et al Movement Ecology (2021) 924 Page 4 of 25
acceleration (sampling interval 50 Hz) measured in threedirections (x y z ie surge sway heave) [21] The de-vices operated for three to 9 days and had to be recov-ered to access recorded data We recaptured the birds intheir nests After device removal we measured flipperand bill length bill depth and body mass and collectedblood samples (200 μl) from the foot (Antarctica) or thebrachial (New Island) vein and four small feathers fromthe lower back of the adults Blood and feather sampleswere used for the study of stable isotopes (see Stable iso-tope analysis of the diet below) and molecular sexing(following standard methods) [50] As in previous stud-ies [21 51] we detected no adverse effects related toblood sampling One drop of blood was smeared and airdried on a glass slide directly after sampling and fixedwith absolute methanol and stained with Giemsa dyelater in the laboratory [52] Blood smears were used fordifferential leucocyte counts (see Condition parametersbelow) Additionally we collected fresh scat samples op-portunistically during the handling of the birds as wellas from randomly located ice or rock substrates aroundthe penguin colonies immediately after defecation Toavoid external contamination we took special care tocollect the central part of the scat and not the part thatwas in direct contact with the substrates We kept scatsamples cool with ice packs during fieldwork froze themonce back at the field station and transported frozenuntil processed in the laboratory
Spatial and temporal dataWe downloaded tri-axial acceleration data and GPS filescomprising location (WGS84) and time and a separatefile containing dive depth and water temperature datafrom the recovered loggers (Table 1) Sample sizes(Table 1) varied due to logger failures that prevented toproduce complete data sets for some individuals Fail-ures corresponded to 1) loggers damaged by salt waterreaching the electronic components 2) broken GPS an-tennas and 3) batteries that were unexpectedly depletedAs in previous studies [21 51] we defined foraging tripsfrom the time when the birds departed from the colonyto the sea until returning to the colony To obtain bathy-metric data for Antarctica we used the InternationalBathymetric Chart of the Southern Ocean (IBCSO) [53]while for the FalklandMalvinas Islands we used ba-thymetry data from the global sea floor topography fromsatellite altimetry and ship depth soundings (GlobalTopography) [21 54] We used QGIS 34 (QGIS Devel-opment Team) to plot and analyse positional data of thetrips performed by the birds We calculated trip lengthas the total cumulative linear distance between all pos-itional fixes along the foraging trip outside of the col-ony For each trip we determined the maximumdistance from the colony as the linear grand circle
distance between the furthest point of the recorded tripand the geographical coordinates of the departure col-ony determined by GPS [21 51] We calculated tripduration as the time difference between the onset of thefirst dive performed after leaving and the end of the lastdive event before arriving back at the colony For theidentification of foraging dives we used purpose-writtenscripts in Matlab (The Mathworks Inc Nattick USA)and in IGOR Pro 63 (WaveMetrics Lake OswegoUSA) Following Mattern et al [55] and in order toavoid depth measurement inaccuracy in the upper partof the water column we accepted dive events only whendepths gt 3 m were reached We defined the bottomphase as a period of the dive between a steady pressureincrease at the beginning of the dive (ie descent) andthe continuous pressure decrease indicating the pen-guinsrsquo ascent back to the surface [55 56] We also calcu-lated the maximum depth (in m) reached during a diveevent (hereafter event maximum depth) and the numberof dive events during a particular foraging trip For eachdive we calculated a geographical position either byusing the half way point between GPS fixes recorded im-mediately before and after the dive or by calculating therelative position along a linear interpolated line betweenthe last fix obtained and before the first fix after the diveoccurred based on the time the dive occurred relative tothese fixes Because in previous studies we found thatgentoos at New Island take both benthic and pelagicprey [21 51] we split the foraging dives performed bythe individuals in benthic and pelagic ones for furtheranalyses We did this by calculating the index of benthicdiving behaviour developed by Tremblay amp Cherel [56]This method assumes that benthic divers dive serially toa specific depth and therefore consecutive dives reachthe same depth zone These are called intra-depth zone(IDZ) dives [56] As in previous studies we defined theIDZ as the depth plusmn 10 of the maximum depth reachedby the preceding dive [21] During the current studygentoos performed a varying proportion of benthic andpelagic dives which we considered in following analysesAs the inspection of histograms showed that the data forpelagic dives was left shifted we used the median divedepth per colony per year for further calculations involv-ing pelagic dives (Table 2 Additional file 1 Figs S1 S2)We show the distribution of benthic and pelagic dives inFigs S3 S4 (Additional file 1) We also calculated themedian number of dives performed during the foragingtrips (Table 2) In previous studies [21 51] we foundthat gentoos showed no sexual differences in foragingbehaviour parameters Gentoos from Livingston showedalso no sexual differences in foraging (Additional file 1Figs S5) Therefore in this study we pooled the data ofmales and females We used the nonparametric fixedkernel density estimator to determine the 50 (core
Masello et al Movement Ecology (2021) 924 Page 5 of 25
area) and 95 (home range) density contour areas (esti-mated foraging range) [57 58] of dive locations (ie GPSposition at the onset of a dive event) Kernel densities in-dicate the places in a foraging trip where birds spentmost of their time [57] For these calculations we usedboth the Geospatial Modelling Environment (SpatialEcology LLC httpwwwspatialecologycomgme) andQGIS 34 (QGIS Development Team)As for trip and dive parameters (Tables 1 and 2) nor-
mality and equality of variance were not satisfied (P lt005 Additional file 1 Figs S7 S8) we investigated dif-ferences using the KruskalndashWallis test (one-wayANOVA on ranks) and Dunnrsquos homogenous subgroupsimplemented in the R package dunntest v135 (R Devel-opment Core Team httpswwwr-projectorg) [59]
Calculation of energyUsing tri-axial acceleration data (Additional file 1 FigS6) we quantified energy landscapes as the mass-specifictotal cost of foraging including diving and commutingrelative to the bottom time which we selected as a proxyof energy gained from feeding We considered the differ-ent proportion of benthic and pelagic dives carried out
by the studied penguins With the data obtained fromthe deployed penguins we calculated the energy land-scapes for a grid of the marine area around the islandswith the breeding colonies for which detailed bathymet-ric data was available We carried out the quantificationas in Masello et al [21] to allow comparisons andfollowed a series of steps
Step 1 calculation of the overall dynamic body accelerationSince the major variable factor in modulating energy ex-penditure in vertebrates is movement and measurementsof body acceleration correlate with energy expenditure(reviewed in [60]) we used tri-axial acceleration data tocalculate the Overall Dynamic Body Acceleration(ODBA) for all first foraging trips of the deployed indi-viduals ODBA is a linear proxy for metabolic energythat can be further converted into energy expenditure[16 23 60 61] but see also [62] As in previous studies[21 51] only the first foraging trip of each individualwas included in the calculations to avoid individuals withmore than one trip having more weight in the analysesand to allow comparisons
Table 2 Dive parameters used for the calculations of energy landscapes
Gentoo Chinstrap
Dec 2013 Dec 2014 Dec 2016 Jan 2017
New I South New I South New I North Livingston I Deception I
Short trip Long trip
Maximum dive depth [m] 1883 1782 1563 799 1099 1119
Median dive depth of pelagic dives [m] 158 e (3ndash1859) 127 ab (3ndash1766) 211 c (3ndash1565) 149 a (3ndash799) 154 b
76 d (70ndash81) 54 ab (34ndash67) 37 a (33ndash50) 52 a (47ndash61) 74 cd (61ndash76) 69 bc (57ndash76)
Kruskal-Wallis χ2 = 246 df = 5 P lt 0001
Median number of dives perforaging trip (MND)
283 a c
(202ndash337)291 a b c (193ndash471) 298 a b c (241ndash331) 215 a (156ndash268) 402 b (299ndash744) 369 c
(205ndash497)
Kruskal-Wallis χ2 = 196 df = 5 P = 0002
Median dive duration (DD)benthic dives [s]
156 a (142ndash177) 155 a (150ndash199) 176 a (157ndash202) 81 b (71ndash96) 90 b (82ndash95) 70 c (60ndash85)
Kruskal-Wallis χ2 = 612 df = 5 P lt 0001
Median dive duration (DD)pelagic dives [s]
103 a (92ndash119) 123 a b (117ndash125) 130 a (127ndash138) 67 c (63ndash73) 83 b (72ndash88) 55 d (51ndash69)
Kruskal-Wallis χ2 = 698 df = 5 P lt 0001
Minimum benthic bottomtime (mBBT) [s]
2 3 2 2 3 2
Parameters correspond to gentoo penguins Pygoscelis papua breeding at New Island (FalklandMalvinas Islands) during chick guard (December) in 2013 and 2014gentoo penguins breeding at Devils Point Byers Peninsula Livingston Island South Shetland Islands Antarctica during chick guard (December 2016) andchinstrap penguins Pygoscelis antarcticus breeding at Vapour Col rookery Deception Island South Shetland Islands Antarctica during chick guard (January 2017)Only the first foraging trip of each individual was included in the calculations in order to avoid individuals with more than one trip having more weight in theanalyses See also Figs S1 to S4 in Additional file 1Notes Statistically significant values are marked bold Dunnrsquos homogenous subgroups are indicated in superscript similar letters
Masello et al Movement Ecology (2021) 924 Page 6 of 25
We calculated ODBA (expressed as gravitational forceg) using a purpose-written script for IGOR Pro 63(WaveMetrics Lake Oswego USA) and the sum of theabsolute values of dynamic acceleration from each of thethree spatial axes (ie surge sway and heave samplinginterval 50 Hz) after subtracting the static acceleration(= smoothed acceleration smoothing window 1 s) fromthe raw acceleration values following Wilson et al [23]
Ax Ay and Az are the derived dynamic accelerations atany point in time corresponding to the three orthogonalaxes of the Axy-2 or the Axy-Trek acceleration loggersdeployed on the penguins
Step 2 calculation of benthic and pelagic ODBAsIn diving seabirds power costs during dive vary with thedepth exploited [63 64] and penguins take both benthicand pelagic prey [21 51 65] For both reasons we splitthe foraging dives performed by the individuals in ben-thic and pelagic ones calculated the corresponding ben-thic and pelagic ODBAs and interpolated them for theavailable bathymetric data points around the breedingcoloniesFor this step we first investigated the relationship be-
tween the ODBAs calculated in Step 1 and penguinsrsquomaximum dive depth We found that the sum of ODBAduring the dives carried out by the penguins was relatedto the maximum dive depth they reached (070 lt R2 lt078 see also Additional file 1 Figs S9-S12) Howeverusing a general additive model implemented in the Rpackage GAM [66] we found that this relationship dif-fered between benthic and pelagic dives both for gentoosand chinstraps (Additional file 1 Table S1) Thus wedetermined the regressions with the best fit for the dif-ferent dive types benthic and pelagic in SigmaPlot 10(Systat Software San Jose USA) We provide the regres-sion descriptions and corresponding parameters in TableS2 (Additional file 1) We used the regressions betweenthe sum of ODBA during the dive of the deployed pen-guins and the maximum dive depth (Additional file 1Table S2) together with the bathymetric data pointsfrom IBCSO [53] to calculate benthic ODBAs for a gridof the marine area around the penguin colonies (ap-proximately 100 km around the islands n = 8130 gridspatial resolution as in IBCSO 500 times 500 m based on apolar stereographic projection) separately for each spe-cies To calculate the pelagic ODBA we used the regres-sions (Additional file 1 Table S2) and the median divedepth (Table 2) as pelagic dive depth data were not nor-mally distributed but left-shifted
Step 3 calculation of the cost of travellingIn seabirds like penguins which cover large distances toreach their foraging grounds it is important to includethe energy cost of travelling for any calculations of thecost of foraging In previous work [21 51] we found thatgentoos performed foraging trips of up to 282 km whileup to 139 km were reported for chinstraps [67] We firstcalculated the distance between each point in the marinearea grid around the islands with the penguin breedingcolonies (see Step 2) with the Geospatial Modelling En-vironment and QGIS 34 Using this distance and themean swimming speed previously calculated for gentoos(23 m sminus 1) [68] we were able to calculate the travel timeneeded for the birds to reach each of the 8130 locationsaround the islands for which bathymetric data wereavailable The travel time (TT in s) and their minimummetabolic cost of transportation previously determinedin a swim canal and at sea (161W kgminus 1) [68 69]allowed us subsequently to calculate the minimum costof travelling (CT in J kgminus 1) to each location in the gridused to construct the energy landscapes
CT frac14 TT161 W kg‐1 eth2THORN
Step 4 calculation of the cost of a diveTo quantify the cost of a dive including the cost of thepursuit of prey during a dive we first had to measure itsenergy expenditure The rate of oxygen consumption Vo
(in ml minminus 1) is an indirect measure of energy expend-iture commonly used under laboratory conditions (forexamples see [60]) but difficult if not impossible to usein diving seabirds like penguins An alternative tech-nique for free-ranging animals is to use ODBAs as a cali-brated proxy for the rate of oxygen consumption Vo [6170] which can be used to calculate the total energy ex-penditure during a divePrevious research demonstrated a linear relationship
between ODBA and energy expenditure in all species ex-amined to date (summarised in [23] but see [62 71])Following the method developed by Wilson et al [70]and tested by Halsey et al [61] in several species we firstcalculated Vo
Vo frac14 916thornODBA1658 for gentooseth THORNor Vo
frac14 715thornODBA1204 for chinstrapseth THORN eth3THORN
We calculated the intercept and slope in (3) also fol-lowing Halsey et al [61] These authors found that theintercept and the slope for the relationship betweenODBA and Vo (in ml minminus 1) in all species studiedcould be calculated as intercept y = 275 BM073 (R2 =089) slope y = 352 BM094 (R2 = 094) with BM beingthe mean adult body mass in kg
Masello et al Movement Ecology (2021) 924 Page 7 of 25
The uptake of 1 l of oxygen can be converted into anenergy expenditure estimate of approximately 20 kJ [72]such that 1 ml O2min equals 0333 J sminus 1 Finally to de-rive the energy expenditure (in J kgminus 1 sminus 1) relative to thebody mass of the penguins (also called mass-specificpower MP eg [21 23]) we divided the energy expend-iture by the mean weight of the penguins (gentoos 52kg chinstraps 37 kg individuals measured in thisstudy)
MP frac14 Vo0333=BM eth4THORN
The equation in (4) allowed us to calculate the MPseparately for benthic dives (MPbenthic using benthicODBA from Step 2 in Eq 3) and pelagic dives (MPpelagicusing pelagic ODBA from Step 2 in Eq 3) for each pointin the grid around the islands used to construct the en-ergy landscapes
Step 5 integrating the cost of the actual number of divesperformedSubsequently we calculated the MP for each point ofthe marine arearsquos grid around the islands with the stud-ied breeding colonies for the number of benthic and pe-lagic dives carried out by the penguins In the case ofchinstraps we used the median number of dives per for-aging trip (MND Table 2) together with the mean diveduration (DD duration in s of the dive event Table 2)assuming a gradient of bottom depths from 3m (mini-mum depth consider a dive see the justification inSpatial and temporal data) to the maximum depth (=bathymetric depth) for benthic dives and a gradient ofbottom depths from 3m to median dive depth for pela-gic dives as follows
MPMNDpelagic frac14 DDpelagic MPpelagic 3 m deptheth THORN thornMPpelagic MND=2pPD
eth6THORN
where pBD is the mean proportion of benthic dives andpPD the mean proportion of pelagic dives (Table 2) in-cluded accounting for the proportion of benthic and pe-lagic dive in a single foraging tripIn the case of gentoos which in addition to pelagic
and benthic dives performed short and long trips andshowed a relationship between the number of dives andthe maximum distance from the colony during a for-aging trip (Additional file 1 Fig S13) we used the re-gression in Table S3 (Additional file 1) to computeMND
Step 6 integrating the cost of diving and commutingThe parameters calculated in Step 5 together with previ-ous calculations of CT (Step 4) allowed us to calculatethe total cost of foraging (TCF in J kgminus 1) as
CT is multiplied by two to account for the return tothe breeding colony
Step 7 calculating the energy gained during foragingPrevious studies on several penguin species havefound a positive relationship between bottom times(duration in s of bottom dive phase) and prey cap-ture Southern rockhoppers Eudyptes chrysocome havebeen found to maximise bottom time which in thisspecies equalled feeding time [56] chinstraps showeda positive linear relationship between bottom timeand the number of underwater beak-opening eventsduring dives and that most (86 n = 4910 events) ofbeak-openings occurred during the bottom times [73]king Aptenodytes patagonicus and Adeacutelie Pygoscelisadeliae penguins ingested prey mostly during the bot-tom phase of diving [74] and little penguin Eudyp-tula minor showed longer bottom times associatedwith dives where prey was captured [75] Thus sev-eral studies have successfully used bottom time as aproxy for prey acquisition and energy gained both inpenguins [21 76] and other seabirds [77] To buildenergy landscapes that also include the energy gainedduring foraging we calculated bottom times andminimum benthic bottom times (mBBT Table 2)The bottom times from the first foraging trip of eachindividual showed a relationship with maximum divedepth This relationship also differed between benthicand pelagic dives (GAM Additional file 1 Table S4)Again here we determined the regressions with thebest fit for the different dive types in SigmaPlot 100(Additional file 1 Table S5 Figs S14-S17) The re-gressions between bottom time and maximum divedepth (Additional file 1 Table S5) allowed us to cal-culate the sum of benthic bottom time (BBT) foreach point of the grid of the marine area around theislands with the studied breeding colonies used toconstruct the energy landscapes separately for eachspecies For pelagic bottom times (PBT) we used thecorresponding regressions (Additional file 1 Table S5)and the median dive depth per species (Table 2) Tocalculate the total bottom time (TBT in s) we tookinto account that the birds start diving close to thecolony (as also found in [21 51]) and increase divedepth while gaining distance A mean is calculatedand the mean multiplied per MND
Masello et al Movement Ecology (2021) 924 Page 8 of 25
We also included pBD and pPD here to account forthe proportion of benthic and pelagic dive in a singleforaging trip
Step 8 construction of the energy landscapesFinally dividing TCF (7) by TBT (8) we were able tocalculate the total relative cost (TRC in J kgminus 1 sminus 1)which is the mass-specific total cost of foraging (divingplus commuting) relative to the energy gained UsingTRC values calculated for the grid of the marine areaaround the islands with the breeding colonies we con-structed the energy landscape by applying the inversedistance weighted (IDW) interpolation in to the result-ing data grid As in our previous study [21] the IDWinterpolation was chosen as 1) a large set of samplevalues was available and 2) the sample data points rep-resented the minimum and maximum values in our sur-face [78] In brief the energy landscapes here presentedare based on the bathymetry of the area and the totalcost of foraging (diving plus commuting) relative to thebottom time (= energy gained in J kgminus 1 sminus 1) and takeinto account the different proportion of benthic and pe-lagic dives carried out by the penguins
Molecular analysis of the dietWe collected a total of 247 faecal samples from gentoosfrom the colony at Livingston chinstraps from the col-ony at Deception two colonies at New Island and po-tential prey samples to obtain detailed information ondiet composition (Additional file 1 Tables S6 and S7)Details on deoxyribonucleic acid (DNA) extractionprimers used polymerase chain reaction (PCR) amplifi-cations library preparations and next generation se-quencing (NGS) are provided in the Additional File 1(Table S8 and Additional Methods)We used the raw Illumina sequence data to produce a
list of molecular operational taxonomic units (MOTUs)Bioinformatics analyses included the following stepsassessing sequence quality with FASTQC (httpwwwbioinformaticsbabrahamacukprojectsfastqc) adapterand quality trimming of the paired-end reads withTRIMMOMATIC (minimum quality score of 20 over asliding window of 4 bp) [79] merging of the overlappingpaired-end read pairs using FLASH [80] transformingsequence files to FASTA with the FASTX-Toolkit(httphannonlabcshledufastx_toolkit) and extractingamplicons in MOTHUR [81] We used USEARCH [82]to remove identical replicates (dereplicate derep_full-length) to detect and to remove chimeric sequences(uchime_denovo) and to cluster sequences into molecu-lar operational taxonomic units (MOTUs) Using theBLASTn algorithm [83] we matched MOTU sequences
to reference sequences in the National Center for Bio-technology Information (NCBI) GenBank nucleotidedatabase using a cut-off of 90 minimum sequenceidentity and a maximum e-value of 000001 For the bio-informatics analyses of the samples from Antarctica wecarried out all those analyses using a custom workflowin GALAXY (httpswwwcomputationalbiouni-giessendegalaxy) [84] As next step we manually discardedMOTUs that corresponded to regular fieldwork contam-inants in faecal samples such as bacteria soil fungi hu-man or predator DNA We based taxonomic assignmenton the percentage similarity of the query and the refer-ence sequences Since short fragments are less likely tocontain reliable taxonomic information we only retainedsequences with a minimum length of 190 bp and aBLASTn assignment match greater than 98 [85 86]We assigned MOTUs to species-level in cases when allretained hits of a MOTU with the same quality criteria(sequence identity sequence length e-value) corre-sponded to the same species if not we assigned theMOTU to the lowest shared taxonomic level eg genusor family as in Kleinschmidt et al [87] We performedfurther filter steps to avoid contaminationfalse positivesand to obtain reliable data [88] as follows we acceptedMOTUs in a sample only if they contained a minimumof 10 sequences or accounted for gt 1 of the maximumtotal of hits Additionally we also discarded taxa withvery distant or ecologically irrelevant distribution ranges(eg deserts) Negative controls were included and didnot show any contaminations For each taxonomicallevel found we calculated the frequency of occurrence(FO) [89] To visualize differences in diet compositionsfor the penguin species and for adults and chicks weperformed non-metric multidimensional scaling(NMDS) with the function metaMDS in the R packageVEGAN [90] NMDS uses rank orders to collapse infor-mation from multiple dimensions into usually two-dimensions to facilitate visualization and interpretationand is generally considered as the most robust uncon-strained ordination method in community ecology [9192] The function metaMDS allowed us to investigatethe agreement between the two-dimension configurationand the original configuration through a stress param-eter If the stress is lt 005 the agreement is excellent lt01 is very good lt 02 provides a good representation Inour models the stress was always lt 004 (excellent) Weperformed permutational multivariate analysis of vari-ance using distance matrices (PERMANOVA) with thefunction adonis and checked for the multivariate homo-geneity of group dispersions (variances) with the func-tion betadisper We also used the functions ordihull andordiellipse to add convex hulls and ellipses to the NMDSplots and improve visualization To compare the dietcomposition for a certain number of sampled
Masello et al Movement Ecology (2021) 924 Page 9 of 25
individuals we additionally used species accumulationcurves (SAC) with the function specaccum in the Rpackage VEGAN [90]
Stable isotope analysis of the dietWe analysed carbon (δ13C) and nitrogen (δ15N) stableisotope ratios of red blood cells Stable isotope ratiosallowed us to compare the diet the penguins fed duringthe study period as red blood cells have a half-life of ca30 days [93] We carried out carbon and nitrogen isotopeanalyses on 065ndash075 mg sample aliquots weighed intotin cups Subsequently we determined carbon and nitro-gen isotope ratios by a mass spectrometer (Delta V Pluswith a Conflo IV interface Thermo Scientific BremenGermany) coupled to an elemental analyser (Flash 2000Thermo Scientific Milan Italy) at the LIENSs laboratoryfrom the University of La Rochelle France Replicatemeasurements of internal laboratory standards indicatedmeasurement errors lt 015 permil for δ13C and δ15N Re-sults are expressed in the δ unit notation as deviationsfrom standards (Vienna Pee Dee Belemnite for δ13C andN2 in air for δ15N) following the formula δ13C orδ15N = [(RsampleRstandard) - 1] times 103 where R is 13C12Cor 15N14N respectively Internal laboratory standards(acetanilide) were used to check accuracy Measurementerrors were lt 015permil for both δ13C and δ15NWe compared the isotopic niches of penguins using
SIAR (Stable Isotope Analyses in R) [94] and SIBER(Stable Isotope Bayesian Ellipses in R) [95] The loca-tion of the centroid (mean δ13C mean δ15N) indicateswhere the niche is centred in isotope space We useda Bayesian approach based on multivariate ellipsemetrics to calculate the Bayesian standard ellipse area(SEAb) which represents the core isotope niche widthas described by Jackson et al [95] In addition wecalculated standard ellipse areas based on MaximumLikelihood (SEA) and corrected for sample size(SEAc) We depicted ellipses using the drawellipsecommand of the R package PLOTRIX [96] with thelengths of the two semi-major axes and the angle ofthe semi-major axis of the ellipse with the x-axis asparameters To describe the spread of the data pointswe calculated parameters as described by Laymanet al [97] As proxies of intra-population trophic di-versity we also calculated the mean distance to cen-troid (CD) and the mean nearest-neighbour distance(NND) We give information on the trophic length ofthe community as the δ15N range (NR) and providean estimate of the diversity of basal resources by theδ13C range (CR) We split the data from gentoos intomale and female adults and first and second hatchedchicks but due to low samples size we were not ableto split chinstrap data
Condition parametersThe ratio of two types of leucocytes the heterophils andlymphocytes (HL ratio) has been successfully used asan indicator of physiological status and effort (high ra-tios = high stress) [98 99] Following Merino et al [100]differential leucocyte counts were carried out with alight microscope (times 1000) in parts of the blood smearswhere erythrocytes had separated in a monolayer Thesamples were crossed from down to up to minimize dif-ferences in the thickness of the blood smear Leucocyteswere counted following Dein [101] and Hawkey andDennett [102] A total of 100 leucocytes were counted ineach smear thus obtaining percentages of the differentof leucocyte types and the HL ratio
Additional dataWe obtained the location of other gentoo and chinstrappenguin colonies in the South Shetland Islands Antarc-tica from the Mapping Application for Penguin Popula-tions and Projected Dynamics [103] and Naveen et al[104] and the locations of Fur Seal Arctocephalusgazella colonies from Hucke-Gaete et al [105] Wedownloaded Antarctic Krill Euphausia superba abun-dance data for the sector between 60 and 65degS and 55ndash65degW from KRILLBASE [106] and obtained AntarcticKrill catches for the Commission for the Conservationof Antarctic Marine Living Resources (CCAMLR) Area48 from the Krill Fishery Report 2018 [107] Breedingsuccess data corresponds to the number of chicks pernest at the cregraveche and was obtained as part of ongoingprojects (Vapour Col rookery Deception [43 108] andAB unpubl Data New Island [21] and PQ unpubl Data) or from studies in the West Antarctic Peninsula regionthat followed the same methodology we used (Peter-mann Island [109] Goudier Island [110]) Other avail-able studies for the region were excluded as theirmethodology clearly differed from the one here usedDue to logistics limitations of our expedition to Antarc-tica breeding success data at Livingston could not begathered
ResultsForaging trips and dive parametersIn Antarctica both gentoos and chinstraps foraged rela-tively close to their own colonies (Fig 2) using the col-onyrsquos lsquohinterlandrsquo (sensu Cairns [111]) and henceavoided areas closer to the neighbouring colonies andthose from potential predators (Additional file 1 FigS18) and performed trips with the usual loop shape (Fig2) Gentoos from Livingston performed short (199ndash334km) and long (592ndash71 km) trips which strongly differedin both length (median short trip 271 km long trips666 km Table 1 Fig 2a) and in the extent of the coreareas and home ranges used (Fig 2b Additional file 1
Masello et al Movement Ecology (2021) 924 Page 10 of 25
Fig S19) The short trips carried out by gentoos fromLivingston were shorter than any of the trips performedby New Island birds (minimum trip 408 km) while thelong trips were similar to those carried out by New Is-land birds in 2014 (median South 887 North 591 km)
but substantially different than the much longer tripsperformed by New Island birds during 2013 (median1256 km Table 1) The trips performed by chinstrapsfrom Deception (median 377 km) were intermediate be-tween the long and short trips from gentoos from
Fig 2 Foraging trips (a) and kernel density distribution of dive locations (b) Data from gentoo penguins Pygoscelis papua breeding at DevilsPoint Byers Peninsula Livingston Island South Shetland Islands during chick guard (December 2016) and chinstrap penguins Pygoscelisantarcticus breeding at Vapour Col rookery Deception Island South Shetland Islands during chick guard (January 2017) Trip lines are colourcoded Dark grey first recorded trips red second trips yellow third trips green fourth trips pink fifth trips The 50 core areas are denoted byblack lines while 95 home ranges by yellow lines Kernels from gentoo penguins are further coded for short (dashed lines) and long trips (solidlines) Kernels from chinstrap penguins are denoted by solid lines only as no distinction between short and long trips could be found Depth (inm) is based on data from the International Bathymetric Chart of the Southern Ocean (IBCSO) [53]
Masello et al Movement Ecology (2021) 924 Page 11 of 25
Livingston (Table 1) Other related trip parameters areprovided in Table 1In Antarctica the maximum dive depth was recorded
in chinstraps (1119 m Table 2) However maximumdive depth achieved by both gentoos (1099 m) and chin-straps from Antarctica were lower than those from gen-toos from New Island (1883 m Table 2) regardless ofthe much deeper waters present in marine areas close toLivingston and Deception (up to 1000m depth Fig 2)When we considered the depth of the pelagic dives sep-arately we found that chinstraps dived less deep (me-dian 123 m) than gentoos (median long trips 154 mshort trips 149 m) This is in line with the higher pro-portion of benthic dives carried out by chinstraps (31)in comparison with gentoo long trips (26) Gentoosfrom Livingston carried out the highest number of divesper foraging trip during their long trips (median 402 di-ves) followed by the chinstraps (369 dives) During shorttrips gentoos from Livingston carried out a similarnumber of dives per foraging trip (215 dives) as the birdsfrom New Island (medians ranging from 283 to 298 di-ves Table 2)
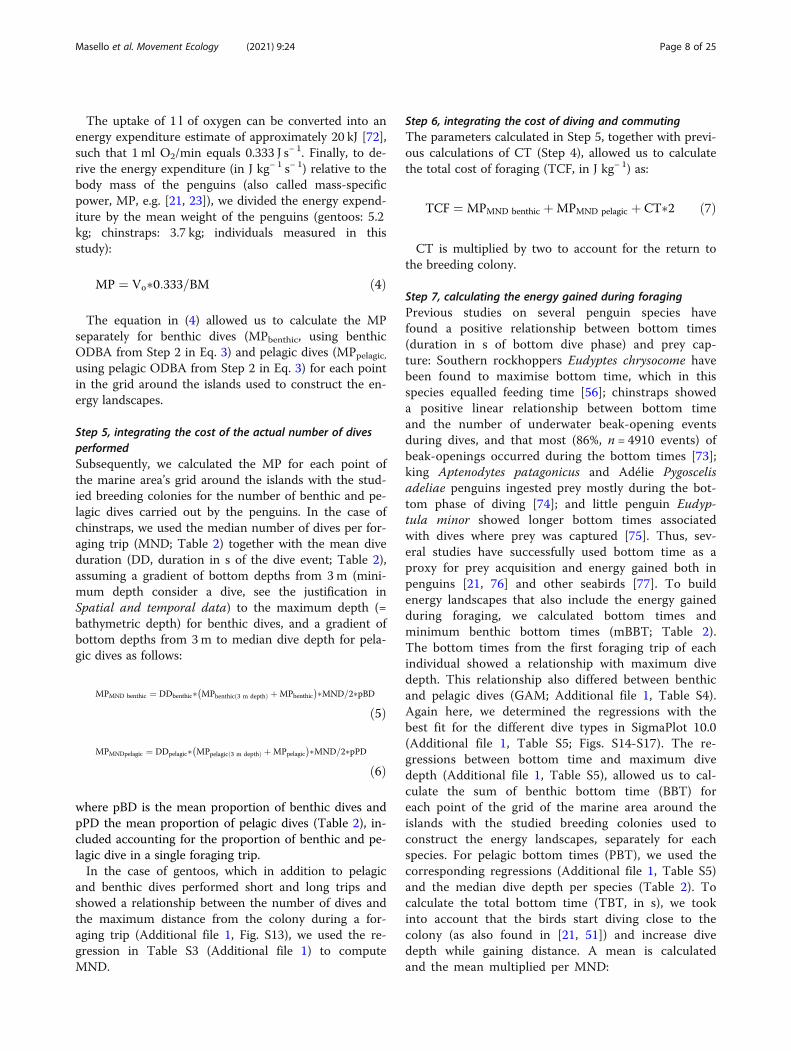
Calculation of energyGentoos from Livingston used areas of the energy land-scape that resulted in the lowest foraging costs relativeto energy gain during foraging (up to 1376 J kgminus 1 sminus 1)avoiding areas equally distant where the costs werehigher (150 to 160 J kgminus 1 sminus 1 Fig 3a) Moreover the en-ergy landscapes in the marine areas around Livingston(Fig 3a) implied much lower costs than those aroundNew Island (up to 232 J kgminus 1 sminus 1 Additional file 1 FigsS20 to S22) During short trips gentoos from Livingstonincurred in foraging costs per bottom time gain with amedian value of 1152 J kgminus 1 sminus 1 (949 to 1367 Fig 4a)The median foraging cost per bottom time gain duringthe long trips performed by gentoos from Livingstonwas 1305 J kgminus 1 sminus 1 (953 to 1376 Fig 4b) In the caseof New Island gentoos incurred in variable foragingcosts per bottom time gain 1) South End colony 20131671 (1061 to 2320 Fig 4d) 2) South End 2014 1127(787 to 1831 Fig 4e) 3) North End 2014 990 (829 to1519 Fig 4f) (medians and ranges in J kgminus 1 sminus 1) In thisway the foraging costs per bottom time gain of the shorttrips were lower than those of the long trips while thosefrom New Island South 2013 were the highest and thosefrom New Island North End 2014 the lowest (Kruskal-Wallis χ2 = 23852 df = 5 P lt 0001 pairwise analysesin Additional file 1 Table S9)Chinstraps used marine areas around Deception where
the foraging costs per bottom time gain were below 105 Jkgminus 1 sminus 1 (median 965 range 808 to 1037 Figs 3b and4c) Chinstraps incurred significantly lower foraging costsper bottom time gain than the gentoos from Livingston
(up to 1376 J kgminus 1 sminus 1) or those from New Island South2013 and 2014 (up to 232) but similar to those from NewIsland North 2014 (up to 1519) (pairwise Kruskal-Wallisrank sum test in Additional file 1 Table S9 all P-values lt0001 except for New Island North P = 0364)
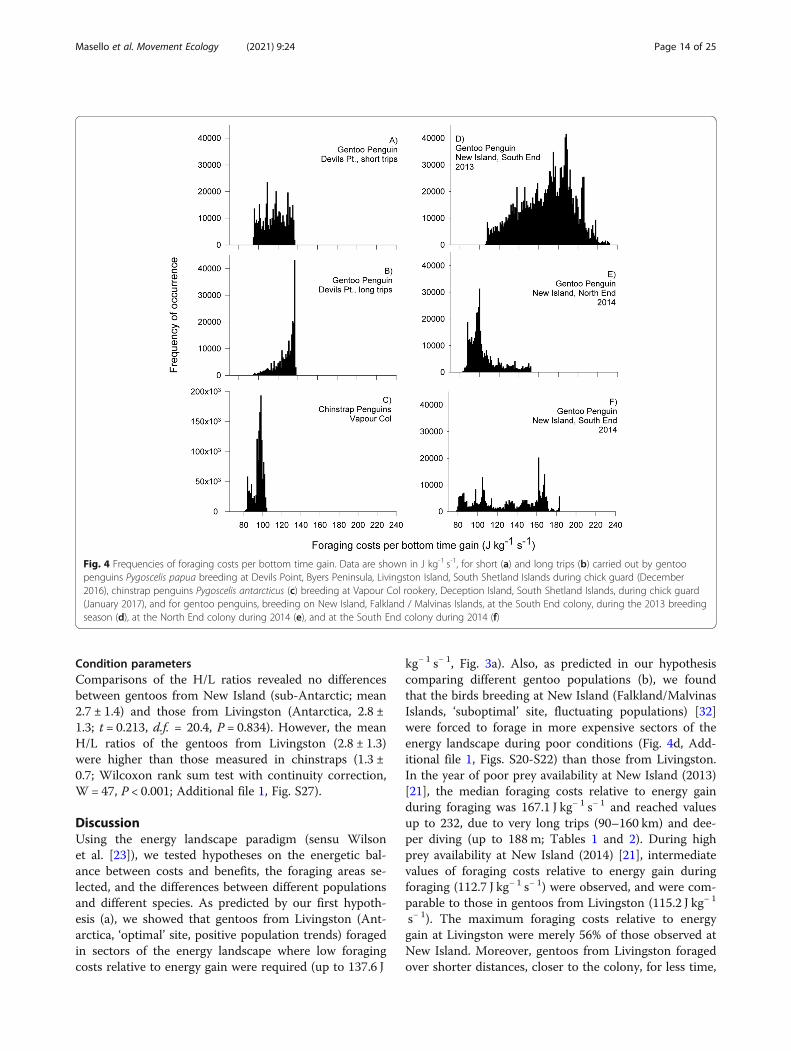
Molecular analysis of the dietGentoos from Livingston (Antarctica) and from New Is-land (sub-Antarctic) consumed different prey with thebirds from Antarctica consuming a less diverse diet(Table 3 Additional file 1 Table S10) When consider-ing the quantitative data from Antarctic penguins wefound that chinstraps had a more restricted diet thangentoos preying mainly on Antarctic Krill while gentoosfrom Antarctica in addition to Antarctic Krill includedfish more frequently (NMDS F601 = 37 P lt 0023 wherethe species explained 6 of the overall variation R2 =0059 Table 3 Additional file 1 Fig S23) When consid-ering age in our analyses we found that the diet com-position differed among the groups (adult gentoo chickgentoo adult chinstrap chick chinstrap F603 = 22 P =0028 R2 = 010 Additional file 1 Fig S24) Gentoochicks had a slightly richer diet composition than adultsas they were fed more frequently with fish (Fig 5aTable 3) In chinstraps chicks were fed more frequentlywith Thysanoessa macrura which is taken only very oc-casionally in adults and adults had a richer diet compos-ition by consuming occasionally some fish (Fig 5bTable 3) However permutation tests were not signifi-cant when gentoos (F241 = 14 P = 0203 R2 = 0059) orchinstraps (F351 = 11 P = 0254 R2 = 0032) were ana-lysed apart (Additional file 1 Figs S25 S26)
Stable isotope analysis of the dietMean isotope values differed among the Antarcticpenguin groups (Kruskal Wallis ANOVA for δ13Cχ2 = 351 df = 5 P lt 0001 for δ15N χ2 = 469 df =5 P lt 0001 Fig 5c Additional file 1 Table S11) Ingentoos the differences in δ13C signature were relatedto higher values in adult males than in chicks (Fig5c Additional file 1 Table S11) indicating a morebenthic diet for adults as also shown by the analysesof dive parameters in Table 2 Gentoos had also sig-nificantly higher δ13C than chinstraps (Fig 5c Add-itional file 1 Table S11) indicating again a morebenthic diet for gentoos in line with the significantdifferences in dive parameters (Table 2) In the caseof δ15N the differences among the groups were re-lated to higher values in chinstrap adults than in theirchicks (Fig 5c Additional file 1 Table S11) which isin line with the observation that chinstrap chickswere only fed with Euphausiacea (Table 3 Additionalfile 1 Fig S26) All niche metrics (Fig 5c Additionalfile 1 Table S11) were larger in gentoos than in
Masello et al Movement Ecology (2021) 924 Page 12 of 25
chinstraps indicating a higher variability in the feed-ing ecology among gentoos as also suggested by thedetected prey and their frequency of occurrence(Table 3) and the diet composition obtained usingNMDS (Additional file 1 Fig S23) Within speciesgentoo males and chicks had larger niche metricsthan females while no differences were observed be-tween first and second chicks and between chinstrap
adults and chicks (Additional file 1 Table S11) Add-itionally niche metrics from the gentoos from Ant-arctica (Additional file 1 Table S11) were mostlylarger than those from the previously studied gentoosfrom New Island except in the case of New IslandSouth during December 2013 to which they weresimilar (Additional file 1 Table S12 Masello et al2017)
Fig 3 Gentoo and chinstrap penguin energy landscapes Energy landscapes based on the bathymetry around Livingston Island South ShetlandIslands and the mass-specific total cost of foraging (diving plus commuting) by gentoo penguins Pygoscelis papua (a) and chinstrap penguinsPygoscelis antarcticus (b) relative to the bottom time (in J kgminus1 sminus1) considering the different proportion of benthic and pelagic dives carried outby the penguins The energy landscape categories have been defined to make them easy comparable with the ones used for gentoo penguinsfrom New Island FalklandMalvinas Islands in [21] The colony is marked by a triangle The location of the dives performed by the tracked birds isplotted in semi-transparent black circles for those corresponding to gentoo short trips and in white circles for those corresponding to gentoolong trips and semi-transparent black circles for chinstraps
Masello et al Movement Ecology (2021) 924 Page 13 of 25
Condition parametersComparisons of the HL ratios revealed no differencesbetween gentoos from New Island (sub-Antarctic mean27 plusmn 14) and those from Livingston (Antarctica 28 plusmn13 t = 0213 df = 204 P = 0834) However the meanHL ratios of the gentoos from Livingston (28 plusmn 13)were higher than those measured in chinstraps (13 plusmn07 Wilcoxon rank sum test with continuity correctionW = 47 P lt 0001 Additional file 1 Fig S27)
DiscussionUsing the energy landscape paradigm (sensu Wilsonet al [23]) we tested hypotheses on the energetic bal-ance between costs and benefits the foraging areas se-lected and the differences between different populationsand different species As predicted by our first hypoth-esis (a) we showed that gentoos from Livingston (Ant-arctica lsquooptimalrsquo site positive population trends) foragedin sectors of the energy landscape where low foragingcosts relative to energy gain were required (up to 1376 J
kgminus 1 sminus 1 Fig 3a) Also as predicted in our hypothesiscomparing different gentoo populations (b) we foundthat the birds breeding at New Island (FalklandMalvinasIslands lsquosuboptimalrsquo site fluctuating populations) [32]were forced to forage in more expensive sectors of theenergy landscape during poor conditions (Fig 4d Add-itional file 1 Figs S20-S22) than those from LivingstonIn the year of poor prey availability at New Island (2013)[21] the median foraging costs relative to energy gainduring foraging was 1671 J kgminus 1 sminus 1 and reached valuesup to 232 due to very long trips (90ndash160 km) and dee-per diving (up to 188 m Tables 1 and 2) During highprey availability at New Island (2014) [21] intermediatevalues of foraging costs relative to energy gain duringforaging (1127 J kgminus 1 sminus 1) were observed and were com-parable to those in gentoos from Livingston (1152 J kgminus 1
sminus 1) The maximum foraging costs relative to energygain at Livingston were merely 56 of those observed atNew Island Moreover gentoos from Livingston foragedover shorter distances closer to the colony for less time
Fig 4 Frequencies of foraging costs per bottom time gain Data are shown in J kg-1 s-1 for short (a) and long trips (b) carried out by gentoopenguins Pygoscelis papua breeding at Devils Point Byers Peninsula Livingston Island South Shetland Islands during chick guard (December2016) chinstrap penguins Pygoscelis antarcticus (c) breeding at Vapour Col rookery Deception Island South Shetland Islands during chick guard(January 2017) and for gentoo penguins breeding on New Island Falkland Malvinas Islands at the South End colony during the 2013 breedingseason (d) at the North End colony during 2014 (e) and at the South End colony during 2014 (f)
Masello et al Movement Ecology (2021) 924 Page 14 of 25
Table 3 Detected prey and their frequency of occurrence in scat samplesTaxa Gentoo Chinstrap
Dec 2013 Dec 2014 Dec 2016 Jan 2017
New I South New I South New I North Livingston I Deception I
Adults Firstchicks
Secondchicks
Unk All a All a Adult()
Firstchicks ()
Secondchicks ()
Adults()
Firstchicks ()
Secondchicks ()
n = 17(17)
n = 24(19)
n = 15(14)
n = 17(14)
n = 32(31)
n = 29(29)
n = 36(16)
n = 11(6)
n = 5(3)
n = 19(18)
n = 23(10)
n = 23(8)
Arthropoda Crustacea Malacostraca
Amphipoda Hyperiidae
Themisto sp ndash ndash ndash D D D ndash ndash ndash ndash ndash ndash
Decapoda
Pandalidae (shrimps)
Pandalus sp ndash ndash ndash D D D ndash ndash ndash ndash ndash ndash
Galatheidae
Munida gregarialobster krill
ndash ndash ndash D D D ndash ndash ndash ndash ndash ndash
Masello et al Movement Ecology (2021) 924 Page 15 of 25
and dived less deep for shorter times than those fromNew Island (Tables 1 and 2) In a previous study [21]we showed that when the energy landscape was charac-terized by lower foraging costs per energy gain (2014)the breeding success was high (129 chicks per nest)while during a year of high foraging costs (2013) breed-ing success was low (086 see also Additional file 1Table S13) Moreover published records of breeding suc-cess in gentoos show a remarkable pattern on the WestAntarctic Peninsula 84 of records (16 of 19) fall above themark of one (1) chick per nest while on New Island thishappens only in 40 (2 of 5) of the years suggesting a gen-erally better breeding success for Antarctic gentoos irre-spective of naturally occurring inter-annual oscillations(Fig 6) [21 109 110] All things considered the aboveresults are in line with our previous findings linkingenergy gain and variable energy costs of foraging tobreeding success [21] and suggest that the lower for-aging costs incurred by the gentoos from the Antarc-tic Peninsula could favour a higher breeding successthat in turn would explain the positive populationtrend of the species in the region offering a plausible
link between energy requirements and population dy-namics (see also [20] and references therein)A recent study [112] found that gentoos at sub-
Antarctic Marion Island alternated trips of relativelyshort and long durations with short trips likely associ-ated to self-maintenance and longer trips associated tochick provisioning Carpenter-Kling et al [112] postu-lated that gentoos may be using this strategy of alternateshort and long trips as a result of suboptimal feedingconditions related to environmental change Howeverwe did not find this behaviour at New Island a lsquosubopti-malrsquo site (Masello et al 2010 2017) while we found thatgentoos performed short (20 to 33 km) and long trips(59 to 71 km) at Livingston an lsquooptimalrsquo site (Tables 1and 2 Fig 3a) Median dive depths and numbers of di-ves per trip were comparable (Additional file 1 Fig S28)and thus the swim distance had a major influence onthe foraging costs relative to energy gain An alternativeexplanation for this foraging behaviour could be that itallows gentoos to use the areas of the energy landscapethat resulted in lower foraging costs which show a bi-modal distribution around the colony at Livingston
Table 3 Detected prey and their frequency of occurrence in scat samples (Continued)Taxa Gentoo Chinstrap
Dec 2013 Dec 2014 Dec 2016 Jan 2017
New I South New I South New I North Livingston I Deception I
Agonidae (alligatorfishes) D D D D D D ndash ndash ndash ndash ndash ndash
Psychrolutidae (blobfishes)
Psychrolutes sp D D ndash D D ndash ndash ndash ndash ndash ndash ndash
Data correspond to gentoo penguins Pygoscelis papua breeding at New Island FalklandMalvinas Islands during chick guard (December) in 2013 and 2014gentoo penguins breeding at Devils Point Byers Peninsula Livingston Island South Shetland Islands Antarctica during chick guard (December 2016) andchinstrap penguins Pygoscelis antarcticus breeding at Vapour Col rookery Deception Island South Shetland Islands Antarctica during chick guard (January 2017)Sample sizes 1) n = number of DNA extractions from scat samples and 2) in brackets the number of successfully amplified samples Unk age unknown samplesobtained at the colony First chicks first hatched chick Second chicks second hatched chick a Samples from 2014 were not split by age group due to smallsample sizes in most of the know age categories (see Additional file 1 Table S6) Samples from New Island are pooled (see Additional file 1 Additional MethodsMolecular analysis of the diet) and thus frequency of occurrence cannot be calculated Instead prey species detected are denoted with lsquoDrsquo Best blast results foreach detected taxa and corresponding accession number the identity with the blast reference sequence the sequence length and the bitscore are provided inAdditional file 1 Table S10
Masello et al Movement Ecology (2021) 924 Page 16 of 25
(green areas in Fig 3a) Also in this case the energylandscape paradigm offers a plausible explanation for aparticular animal behaviourOur results do not support our hypothesis that
chinstraps should show higher energy expenditurethan Antarctic gentoos (between-species differences inenergy expenditure hypothesis d) Contrary to ourexpectations based on long-term population trendschinstraps actually incurred lower foraging costs perbottom time gain than the gentoos from Livingston(Figs 3a b and 4 a-c) However our results suggestalso in this case a link between energy landscapesand breeding success 148 chicks per nest reachedthe cregraveche stage in chinstraps at Deception duringthe studied season (AB unpubl data) and this valuewas higher than most records for gentoos in the re-gion (Fig 6) The lower foraging costs per energygain experienced by the chinstraps from Deceptionduring this study could have allowed them to achievea higher breeding success regardless of the long-termpopulation trend [109] but see [113] suggesting thatthe driver of population decline in this species doesnot operate during the breeding season [43]
Another pattern arose from the foraging behaviourof Deception chinstraps At that island chinstrapsbreed in eight different colonies where up to 62500pairs breed (Additional file 1 Fig S18) [44 104] Allbut one of the trips performed by chinstraps fromVapour Col rookery occurred outside the lsquohinterlandrsquo(sensu Cairns [111]) of the other colonies of this spe-cies located on Deception suggesting a potentialavoidance of those areas (Additional file 1 Fig S18)Lima amp Estay [40] found that the population dynam-ics of chinstraps at the nearby King George Island isparticularly regulated by intra-specific competitionand the combined effects of Antarctic krill abundanceand sea-ice cover Our results appear to support thisview As previously found [65 114ndash118] both ourmolecular and isotopic analyses showed that chin-straps particularly their chicks had a more restricteddiet than gentoos (Tables 3 and 4 Figs 5a c Add-itional file 1 Fig S23) Thus in the case of chin-straps intra-specific competition the narrow foragingniche (Fig 5c) and declining Antarctic krill abun-dances (Additional file 1 Fig S29) [38] could explainthe population trends of the species [35 44]
Fig 5 Prey consumed by the penguins a shows the species accumulation curves corresponding to the prey consumed by adult and chickgentoo penguins Pygoscelis papua from the colony at Devils Point Byers Peninsula Livingston Island South Shetland Islands during chick guard(December 2016) and b by adult and chick chinstrap penguins Pygoscelis antarcticus breeding at Vapour Col rookery Deception Island SouthShetland Islands during chick guard (January 2017) c illustrates the isotopic niches based on δ13C and δ15N Values were measured in red bloodcells of adult and chick gentoo penguins from the colony at Devils Point and of adult and chick chinstrap penguins Pygoscelis antarcticusbreeding at Vapour Col rookery
Masello et al Movement Ecology (2021) 924 Page 17 of 25
In a previous study on gentoos [21] we showed theimportance of nonlethal effects of predation as a way ofbetter understanding animal movement Several speciesof pinnipeds prey on penguins [119 120] including Ant-arctic fur seals Arctocephalus gazella Weddell seals Lep-tonychotes weddellii and leopard seal Hydrurga leptonyxAntarctic fur seals have been observed patrolling thegentoo colony at Livingston Weddell Seals have beenfound in the vicinity of this colony and leopard sealssuccessfully predated chinstraps during our fieldwork(JFM AB pers observ) Furthermore Antarctic fur seals
breed in a large colony located close to the studied gen-too colony at Livingston (Additional file 1 Fig S18)Still in this study we were not able to detect noticeablesigns of active avoidance of particular areas in relation-ship to potential predators as we previously observedfor the gentoos from New Island [21 51] One explan-ation for this could be related to another large gentoocolony located at Barclay Bay halfway between our stud-ied colony and the large Antarctic fur seal colony onCape Shirreff and San Telmo Islets Livingston (Add-itional file 1 Fig S18) [45 105] The foraging trips per-formed by gentoos from Livingston could have avoidedthe lsquohinterlandrsquo of their conspecific large colony at Bar-clay Bay (and potentially three chinstrap colonies alsopresent in this location) avoiding at the same time theAntarctic fur seal colony located further to the east(Additional file 1 Fig S18) However foraging data fromthe gentoos at Barclay Bay would be needed to ascertainthis interpretationCurrent environmental changes in the Antarctic Pen-
insula [28] could affect animal physiological condition[99] But individuals may buffer challenging externalconditions by behaviourally adjusting their exposure tocosts and supplies of energy [20] Moreover Greacutemilletet al [22] demonstrated in Adeacutelie penguins Pygoscelisadeliae a relationship between individual condition andthe rates of energy expenditure As challenging environ-mental conditions could lead to greater energy expend-iture and reduced individual condition [21 98] and alink between energetics individual condition and fitnesshas long been postulated (reviewed in [22]) we investi-gated physiological condition in our deployed penguinsWe expected that foraging in areas of the energy land-scapes with low energetic costs would lead to better in-dividual condition (hypothesis c) Concerning
Fig 6 Gentoo and chinstrap penguin breeding success Datacorrespond to the number of chicks per nest recorded at cregraveche forthe chinstrap penguins Pygoscelis antarcticus breeding at Vapour Colrookery Deception Island South Shetland Islands gentoo penguinsPygoscelis papua from New Island FalklandMalvinas Islands andPetermann Island [109] and Goudier Island [110] in the WestAntarctic Peninsula The horizontal black line marks the value of one(1) chick per nest
Table 4 Diet and isotopic niche metrics
Gentoo female adults Gentoo male adults Gentoo first chicks Gentoo second chicks Chinstrap adults Chinstrap chicks
N 10 15 24 24 6 11
δ13C -2512plusmn049ab -2484plusmn040 a -2543plusmn054 bc -2548plusmn053bc -2598plusmn015 cd -2656plusmn009 d
δ15N 826plusmn041a 848plusmn065 a 813plusmn064 a 815plusmn066 a 798plusmn010 ab 736plusmn017 b
SEA 048 074 072 075 004 005
SEAc 055 080 075 078 005 006
SEAb 051 072 074 077 004 005
NR 165 245 224 264 031 058
CR 148 162 171 200 039 034
CD 055 062 070 070 017 017
NND 033 029 016 020 012 010
Data correspond to gentoo penguins Pygoscelis papua breeding at Devils Point Byers Peninsula Livingston Island South Shetland Islands Antarctica during chickguard (December 2016) and chinstrap penguins Pygoscelis antarcticus breeding at Vapour Col rookery Deception Island South Shetland Islands Antarctica duringchick guard (January 2017)Dunn tests were used for pairwise comparisons and homogenous subsets are marked with superscript letters SEA area of the standard ellipse (isotope nichewidth) SEAc as SEA corrected for sample size SEAb Bayesian standard ellipse area NR trophic length (range in δ15N) CR diversity of basal resources (range inδ13C) CD niche width 2 (mean distance to centroid) NND mean nearest neighbour distance
Masello et al Movement Ecology (2021) 924 Page 18 of 25
populations we found no differences in HL ratios be-tween gentoos from Livingston (lsquooptimalrsquo site) and NewIsland (lsquosuboptimalrsquo) however this probably happenedbecause the samples from New Island were taken duringthe favourable conditions of 2014 (see also Additionalfile 1 Table S13) [21] Unfortunately samples from NewIsland during the unfavourable year 2013 were not avail-able leaving this a matter for future investigations Butin support of our hypothesis the HL ratios of the chin-straps were lower than those measured in gentoos fromLivingston (Additional file 1 Fig S27) suggesting thatforaging in areas of the energy landscapes that result inminimised energetic costs (Figs 3b 4c) could lead tolower physiological stress and better individual condi-tion which could help to achieve a higher breeding suc-cess as in chinstraps during our study (Fig 6) HigherHL ratios values in gentoos compared to chinstrapshave been found in several populations of both speciesalong the Antarctic Peninsula [47 121] supporting ourinterpretation of our results However other factors thatcan affect HL ratios such as the presence of parasitesandor pathogens could also explain differences betweenthe speciesTo make the current study fully comparable with our
previous work on penguins [21] we followed the ap-proach of Wilson et al [23] to energy landscapes How-ever more recently the definition of the energylandscape has expanded to include the effect of mediaflow on movement costs [12 122] Water current flowcould have an effect on the energetic cost of penguinscommuting to and from the foraging sites and shouldnot be overlooked in future research
ConclusionWe applied energy landscapes to compare the foragingof penguins from colonies with different populationtrends At all sites penguins foraged in sectors of the en-ergy landscape where low energy was required Howeverwhen conditions were poorer the birds were forced toforage in more expensive parts of the energy landscapeOur results also showed that lower foraging costs mayfavour a higher breeding success that would explain thepositive population trend by the gentoo penguins fromLivingston in the Antarctic Peninsula and the higherbreeding success in chinstraps from Deception com-pared to gentoos Foraging in areas of the energy land-scapes that result in minimised energetic costs wasassociated with lower physiological stress and higherbreeding success The energy landscape approach mayhelp to improve our understanding of the relationshipbetween energy requirements individual condition andbreeding success and thus between animal movementand complex ecological processes
AbbreviationsANOVA Analysis of variance BBT Sum of benthic bottom time BM Meanadult body mass in kg CCAMLR Commission for the Conservation ofAntarctic Marine Living Resources CD Mean distance to centroid CR δ13Crange CT Cost of travelling DD Mean dive duration DDbenthic Mean diveduration for benthic dives DDpelagic Mean dive duration for pelagic divesDNA Deoxyribonucleic acid ENSO El Nintildeo Southern OscillationFO Frequency of occurrence GPS-TD Global Positioning System-temperature-depth HL Heterophils and lymphocytes ratioIBCSO International Bathymetric Chart of the Southern Ocean IDZ Intra-depth zone IDW Inverse distance weighted interpolation mBBT Minimumbenthic bottom times MND Median number of dives per foraging tripMNDbenthic Median number of benthic dives per foraging tripMNDpelagic Median number of pelagic dives per foraging tripMOTUs Molecular operational taxonomic units MP Mass-specific powerMPbenthic Mass-specific power for benthic dives MPpelagic Mass-specificpower for pelagic dives NASA National Aeronautics and SpaceAdministration NCBI National Center for Biotechnology InformationNE North End colony NGS Next generation sequencing NMDS Non-metricmultidimensional scaling NND Mean nearest-neighbour distance NR δ15Nrange ODBA Overall Dynamic Body Acceleration pBD Mean proportion ofbenthic dives PBT Pelagic bottom times PCR Polymerase chain reactionPERMANOVA Permutational multivariate analysis of variance using distancematrices pPD Mean proportion of pelagic dives SAC Species accumulationcurves SE South End colony SEA Standard ellipse areas SEAb Bayesianstandard ellipse area SEAc Standard ellipse areas corrected for sample sizeSIAR Stable Isotope Analyses in R SIBER Stable Isotope Bayesian Ellipses in RSOI Southern Oscillation Index TBT Total bottom time TCF Total cost offoraging TRC Total relative cost TT Travel time Vo Rate of oxygenconsumption
Supplementary InformationThe online version contains supplementary material available at httpsdoiorg101186s40462-021-00255-9
Additional file 1 Table S1 Results of a General Additive Model (GAM)investigating the sum of Overall Dynamic Body Acceleration (ODBA)during dive as a function of maximum dive depth with the intra-depthzone (IDZ foraging dives performed by the individuals split in benthicand pelagic) as factor Gentoo penguins Pygoscelis papua were breedingat Devils Point Byers Peninsula Livingston Island South Shetland IslandsAntarctica while chinstrap penguins Pygoscelis antarcticus were breedingat Vapour Col rookery Deception Island South Shetland Islands Antarc-tica Data was obtained during chick guard Table S2 The relationshipbetween the sum of Overall Dynamic Body Acceleration (ODBA) duringdive and maximum dive depth for benthic and pelagic dives (based onthe index of benthic diving behaviour intra-depth zone IDZ) Gentoopenguins Pygoscelis papua were breeding at Devils Point Byers PeninsulaLivingston Island South Shetland Islands Antarctica while chinstrap pen-guins Pygoscelis antarcticus were breeding at Vapour Col rookery Decep-tion Island South Shetland Islands Antarctica Data was obtained duringchick guard Table S3 The relationship between the number of divesper trip and the maximum distance from the colony during a foragingtrip carried out by gentoo penguin Pygoscelis papua breeding at DevilsPoint Byers Peninsula Livingston Island South Shetland Islands Antarc-tica (chick guard December 2016) See also Figure S11 Table S4 Re-sults of a General Additive Model (GAM) investigating the bottom time asa function of event maximum depth (maximum depth [m] reached dur-ing dive event) with the intra-depth zone (IDZ foraging dives performedby the individuals split in benthic and pelagic) as factor Gentoo pen-guins Pygoscelis papua were breeding at Devils Point Byers Peninsula Liv-ingston Island South Shetland Islands Antarctica while chinstrappenguins Pygoscelis antarcticus were breeding at Vapour Col rookery De-ception Island South Shetland Islands Antarctica Data was obtained dur-ing chick guard Table S5 The relationship between bottom time andevent maximum depth for benthic and pelagic dives (based on the indexof benthic diving behaviour intra-depth zone IDZ) Gentoo penguinsPygoscelis papua were breeding at Devils Point Byers Peninsula Living-ston Island South Shetland Islands Antarctica while chinstrap penguins
Masello et al Movement Ecology (2021) 924 Page 19 of 25
Pygoscelis antarcticus were breeding at Vapour Col rookery Deception Is-land South Shetland Islands Antarctica Data was obtained during chickguard Table S6 The number of DNA extractions from scat samples ofgentoo penguins Pygoscelis papua breeding at New Island FalklandMal-vinas Islands during chick guard (December) in 2013 and 2014 gentoopenguins breeding at Byers Peninsula Livingston Island Antarctica dur-ing chick guard (December 2016) and chinstrap penguins Pygoscelis ant-arcticus breeding at Vapour Col rookery Deception Island South ShetlandIslands Antarctica during chick guard (January 2017) Table S7 Controlsamples for the molecular detection of prey in scat samples from thestudied penguins Table S8 List of primers used in this study for the de-tection of prey species in scat samples from gentoo penguins Pygoscelispapua and chinstrap penguins Pygoscelis antarcticus Table S9 Compari-son of total foraging costs per bottom time gain (J kgminus 1 sminus 1) usingKruskal-Wallis rank sum test The groups tested correspond to gentoopenguins Pygoscelis papua breeding at New Island FalklandMalvinasIslands during chick guard (December) in 2013 and 2014 gentoo pen-guins breeding at Devils Point Byers Peninsula Livingston Island SouthShetland Islands Antarctica during chick guard (December 2016) andchinstrap penguins Pygoscelis antarcticus breeding at Vapour Col rookeryDeception Island South Shetland Islands Antarctica during chick guard(January 2017) Table S10 Best blast results for each detected taxa andcorresponding accession number the identity with the blast reference se-quence the sequence length and the bitscore from gentoo penguinsPygoscelis papua breeding at New Island FalklandMalvinas Islands dur-ing chick guard (December) in 2013 and 2014 gentoo penguins breedingat Devils Point Byers Peninsula Livingston Island South Shetland IslandsAntarctica during chick guard (December 2016) and chinstrap penguinsPygoscelis antarcticus breeding at Vapour Col rookery Deception IslandSouth Shetland Islands Antarctica during chick guard (January 2017)Table S11 Diet and isotopic niche metrics Data correspond to gentoopenguins Pygoscelis papua breeding at Devils Point Byers Peninsula Liv-ingston Island South Shetland Islands Antarctica during chick guard (De-cember 2016) and chinstrap penguins Pygoscelis antarcticus breeding atVapour Col rookery Deception Island South Shetland Islands Antarcticaduring chick guard (January 2017) Table S12 Isotopic niche metrics ofgentoo penguins Pygoscelis papua breeding at New Island FalklandMal-vinas Islands during chick guard (December) in 2013 and 2014 Parame-ters are based on carbon (δ13C) and nitrogen (δ15N) stable isotopes ofchick feather samples as a marker of breeding season foraging ecologyfrom two colonies at New Island and two breeding seasons calculatedwith the SIAR package SE South End colony NE North End colony Forfurther details see Masello et al (2017) Table S13 Gentoo penguinsPygoscelis papua breeding success at New Island FalklandMalvinasIslands The number of chicks corresponds to cregraveche stage For furtherdetails on the colonies see Masello et al (2010 2017) Figure S1 The dis-tribution of dive depth data during benthic (A) and pelagic (B) foragingdives by gentoo penguin Pygoscelis papua breeding at Devils Point ByersPeninsula Livingston Island South Shetland Islands Antarctica duringchick guard (December 2016) Benthic and pelagic dives are defined withthe use of the index of benthic diving behaviour intra-depth zone (IDZ)Figure S2 The distribution of dive depth data during benthic (A) andpelagic (B) foraging dives by chinstrap penguins Pygoscelis antarcticusbreeding at Vapour Col rookery Deception Island South Shetland IslandsAntarctica during chick guard (January 2017) Benthic and pelagic divesare defined with the use of the index of benthic diving behaviour intra-depth zone (IDZ) Figure S3 Example of the distribution in differentdepths of benthic (A) and pelagic (B) dives carried out by gentoo pen-guin Pygoscelis papua breeding at Devils Point Byers Peninsula Living-ston Island South Shetland Islands Antarctica during chick guard(December 2016) Depth (in m) is based on data from the InternationalBathymetric Chart of the Southern Ocean (IBCSO Arndt et al 2013) Fig-ure S4 Example of the distribution in different depths of benthic (A) andpelagic (B) dives carried out by chinstrap penguins Pygoscelis antarcticusbreeding at Vapour Col rookery Deception Island South Shetland IslandsAntarctica during chick guard (January 2017) Depth (in m) is based ondata from the International Bathymetric Chart of the Southern Ocean(IBCSO Arndt et al 2013) Figure S5 Foraging trips by female (red bur-gundy) and male (yellow) gentoo penguins Pygoscelis papua breeding atDevils Point Byers Peninsula Livingston Island South Shetland Islands
Antarctica during chick guard (December 2016) (A) and chinstrap pen-guins Pygoscelis antarcticus breeding at Vapour Col rookery Deception Is-land South Shetland Islands Antarctica during chick guard (January2017) (B) Depth (m) is based on data from the International BathymetricChart of the Southern Ocean (IBCSO Arndt et al 2013) Figure S6 Ex-ample of dive profiles and tri-axial acceleration data during three con-secutive dives by gentoo penguins Pygoscelis papua breeding at DevilsPoint Byers Peninsula Livingston Island South Shetland Islands Antarc-tica during chick guard (December 2016) Acceleration data correspondto each of the three spatial axes x surge (green) y heave (red) and zsway (blue) Dive depth is given in metres and 0 (zero) corresponds tothe water surface Figure S7 The distribution of foraging parameter dataused for the calculations of energy landscapes in gentoo penguins Pygos-celis papua breeding at Devils Point Byers Peninsula Livingston IslandSouth Shetland Islands Antarctica during chick guard (December 2016)See also Table 1 Figure S8 The distribution of foraging parameter dataused for the calculations of energy landscapes in chinstrap penguinsPygoscelis antarcticus breeding at Vapour Col rookery Deception IslandSouth Shetland Islands Antarctica during chick guard (January 2017) Seealso Table 1 Figure S9 The relationship between the sum of Overall Dy-namic Body Acceleration (ODBA) during dive and maximum dive depthfor benthic dives (based on the index of benthic diving behaviour intra-depth zone IDZ) carried out by gentoo penguin Pygoscelis papua breed-ing at Devils Point Byers Peninsula Livingston Island Antarctica duringchick guard (December 2016) Details for the regression curve are givenin Table S2 Figure S10 The relationship between the sum of OverallDynamic Body Acceleration (ODBA) during dive and maximum divedepth for pelagic dives (based on the index of benthic diving behaviourintra-depth zone IDZ) carried out by gentoo penguin Pygoscelis papuabreeding at Byers Peninsula Livingston Island Antarctica during chickguard (December 2016) Details for the regression curve are given inTable S2 Figure S11 The relationship between the sum of Overall Dy-namic Body Acceleration (ODBA) during dive and maximum dive depthfor benthic dives (based on the index of benthic diving behaviour intra-depth zone IDZ) carried out by chinstrap penguins Pygoscelis antarcticusbreeding at Vapour Col rookery Deception Island South Shetland IslandsAntarctica during chick guard (January 2017) Details for the regressioncurve are given in Table S2 Figure S12 The relationship between thesum of Overall Dynamic Body Acceleration (ODBA) during dive and max-imum dive depth for pelagic dives (based on the index of benthic divingbehaviour intra-depth zone IDZ) carried out by chinstrap penguinsPygoscelis antarcticus breeding at Vapour Col rookery Deception IslandSouth Shetland Islands Antarctica during chick guard (January 2017) De-tails for the regression curve are given in Table S2 Figure S13 The rela-tionship between the number of dives per trip and the maximumdistance from the colony during a foraging trip carried out by gentoopenguin Pygoscelis papua breeding at Byers Peninsula Livingston IslandAntarctica (chick guard December 2016) Details for the regression curveare given in Table S3 Figure S14 The relationship between the bot-tom time and the event maximum depth for benthic dives (based on theindex of benthic diving behaviour intra-depth zone IDZ) carried out bygentoo penguin Pygoscelis papua breeding at Byers Peninsula LivingstonIsland Antarctica during chick guard (December 2016) Details for the re-gression curve are given in Table S4 Figure S15 The relationship be-tween the bottom time and the event maximum depth for pelagic dives(based on the index of benthic diving behaviour intra-depth zone IDZ)carried out by gentoo penguin Pygoscelis papua breeding at Byers Penin-sula Livingston Island Antarctica during chick guard (December 2016)Details for the regression curve are given in Table S4 Figure S16 Therelationship between the bottom time and the event maximum depthfor benthic dives (based on the index of benthic diving behaviour intra-depth zone IDZ) carried out by chinstrap penguins Pygoscelis antarcticusbreeding at Vapour Col rookery Deception Island South Shetland IslandsAntarctica during chick guard (January 2017) Details for the regressioncurve are given in Table S4 Figure S17 The relationship between thebottom time and the event maximum depth for pelagic dives (based onthe index of benthic diving behaviour intra-depth zone IDZ) carried outby chinstrap penguins Pygoscelis antarcticus breeding at Vapour Col rook-ery Deception Island South Shetland Islands Antarctica during chickguard (January 2017) Details for the regression curve are given in Table
Masello et al Movement Ecology (2021) 924 Page 20 of 25
S4 Figure S18 Location and size of other colonies of gentoo penguinsPygoscelis papua (degrees of red dots) chinstrap penguins Pygoscelis ant-arcticus (degrees of blue dots) and Antarctic Fur Seals Arctocephalusgazella (degrees of brown dots) in the South Shetland Islands AntarcticaThe locations and size of the Fur Seal colonies were obtained fromHucke-Gaete et al (2004) while those from the penguin colonies wereobtained from Naveen et al (2000) and the Mapping Application for Pen-guin Populations and Projected Dynamics (MAPPPD) (Humphries et al2017) available at httpwwwpenguinmapcom Size for penguins pairsSize for fur seals individuals Foraging trip coded as in Fig 2a FigureS19 Kernel density distribution of dive locations and bathymetry The50 core areas are denoted by black lines while 95 home ranges byyellow lines Kernel density distributions represent the places where thepenguins spent most of their forging time Data from gentoo penguinsPygoscelis papua breeding at Devils Point Byers Peninsula Livingston Is-land South Shetland Islands Antarctica during chick guard (December2016) is further coded in short (dashed lines) and long trips (solid lines)Data from chinstrap penguins Pygoscelis antarcticus breeding at VapourCol rookery Deception Island South Shetland Islands Antarctica duringchick guard (January 2017) is denoted by solid lines only as no distinc-tion between short and long trips could be found Depth (in m) is basedon data from the International Bathymetric Chart of the Southern Ocean(IBCSO Arndt et al 2013) Figure S20 Energy landscapes based on thebathymetry around New Island FalklandMalvinas Islands and the mass-specific total cost of foraging (diving plus commuting) by gentoo pen-guins Pygoscelis papua relative to the bottom time (in J kgminus 1 sminus 1) consid-ering the different proportion of benthic and pelagic dives carried out bythe penguins from the South End colony during the 2013 breeding sea-son For further details see Masello et al (2017) Figure S21 Energy land-scapes based on the bathymetry around New Island FalklandMalvinasIslands and the mass-specific total cost of foraging (diving plus commut-ing) by gentoo penguins Pygoscelis papua relative to the bottom time (inJ kgminus 1 sminus 1) considering the different proportion of benthic and pelagicdives carried out by the penguins from the South End colony during the2014 breeding season For further details see Masello et al (2017) FigureS22 Energy landscapes based on the bathymetry around New IslandFalklandMalvinas Islands and the mass-specific total cost of foraging(diving plus commuting) by gentoo penguins Pygoscelis papua relative tothe bottom time (in J kgminus 1 sminus 1) considering the different proportion ofbenthic and pelagic dives carried out by the penguins from the NorthEnd colony during the 2014 breeding season For further details seeMasello et al (2017) Figure S23 Diet composition using non-metricmultidimensional scaling (NMDS) of molecular operational taxonomicunits (MOTUs) Data corresponds to gentoo penguins Pygoscelis papua atDevils Point Byers Peninsula Livingston Island South Shetland IslandsAntarctica during chick guard (Dec 2016) and chinstrap penguins Pygos-celis antarcticus at Vapour Col rookery Deception Island South ShetlandIslands Antarctica during chick guard (Jan 2017) A) includes the identityof the prey consumed while B) the ellipses and C) the convex hulls con-necting similar categories Gentoo black dots and lines and dark greyshade Chinstrap royal blue dots and lines and royal blue shade FigureS24 Diet composition using non-metric multidimensional scaling(NMDS) of molecular operational taxonomic units (MOTUs) Data corre-sponds to gentoo penguins Pygoscelis papua at Devils Point Byers Penin-sula Livingston Island South Shetland Islands Antarctica during chickguard (Dec 2016) and chinstrap penguins Pygoscelis antarcticus at VapourCol rookery Deception Island South Shetland Islands Antarctica duringchick guard (Jan 2017) A) includes the identity of the prey consumedwhile B) the ellipses and C) the convex hulls connecting similar categor-ies The categories included are gentoo adults (back and dark grey) gen-too chicks (red) chinstrap adults (royal blue) and chinstrap chicks (cyannot visible A) and C) Figure S25 Diet composition using non-metricmultidimensional scaling (NMDS) of molecular operational taxonomicunits (MOTUs) Data corresponds to gentoo penguins Pygoscelis papua atDevils Point Byers Peninsula Livingston Island South Shetland IslandsAntarctica during chick guard (Dec 2016) A) includes the identity of theprey consumed while B) the ellipses and C) the convex hulls connectingsimilar categories The categories included are adults (black and darkgrey) and chicks (red) Figure S26 Diet composition using non-metricmultidimensional scaling (NMDS) of molecular operational taxonomic
units (MOTUs) Data corresponds to chinstrap penguins Pygoscelis antarc-ticus at Vapour Col rookery Deception Island South Shetland Islands Ant-arctica during chick guard (Jan 2017) A) includes the identity of the preyconsumed while B) the ellipses and C) the convex hulls connecting simi-lar categories The categories included are adults (royal blue) and chicks(cyan) Figure S27 Boxplot of the ratio of two types of leucocytes theheterophils and lymphocytes (HL ratio) belonging to chinstrap penguinsPygoscelis antarcticus at Vapour Col rookery Deception Island South Shet-land Islands Antarctica during chick guard (Jan 2017) and gentoo pen-guins Pygoscelis papua at Devils Point Byers Peninsula Livingston IslandSouth Shetland Islands Antarctica during chick guard (Dec 2016) Box-plots include medians whiskers indicating variability outside the upperand lower quartiles and outliers (circles) Figure S28 Dive depth of pela-gic dives corresponding to gentoo penguins Pygoscelis papua breedingat New Island (FalklandMalvinas Islands) during chick guard (December)in 2013 and 2014 gentoo penguins breeding at Devils Point Byers Penin-sula Livingston Island South Shetland Islands Antarctica during chickguard (December 2016) and chinstrap penguins Pygoscelis antarcticusbreeding at Vapour Col rookery Deception Island South Shetland IslandsAntarctica during chick guard (January 2017) Figure S29 Standardisedabundance of the Antarctic Krill Euphausia superba obtained from theKRILLBASE (Atkinson et al 2017) for the sector between 60 and 65degS and55ndash65degW (A) and Antarctic Krill catches for the CCAMLR Area 48 (B) Add-itional Methods Molecular analysis of the diet Additional References
AcknowledgmentsWe would like to thank Intildeaki Irastorza Miguel Ojeda Jordi Felipe theAntarctic stations Juan Carlos I and Gabriel de Castilla personnel (Australsummer 2016-2017) the RV Sarmiento de Gamboa crew (Austral summer2016-2017) the Unidad de Tecnologiacutea Marina ndash CSIC (Spain) New IslandConservation Trust Ian Maria and Georgina Strange Sylvia Kuhn (Max PlanckInstitute for Ornithology Germany) Melanie Marx Julia Sommerfeld Chris-toph Kaula Jessica Winter (Justus Liebig University Giessen) Richard Phillipsand Pauline Sackett (British Antarctic Survey UK) Paul Brickle (South AtlanticEnvironmental Research Institute Falkland Islands) Andreas Bange MikakoSaito Giselle Hazell and Leiv Poncet for their contributions to the fieldworkand logistics Jan Erik Arndt provided the data from the International Bathy-metric Chart of the Southern Ocean (IBCSO) Simeon Hill provided useful ad-vice to obtain krill abundance information Tobias Zimmermann for theirsupport in the development of the custom workflow in GALAXY The authorsare grateful to G Guillou from the Plateforme Analyses Isotopiques of LIENSsfor running the stable isotope analysis
Authorsrsquo contributionsJFM PQ and AB conceived and designed the study PQ JFM AB WOCS RMAG and PB were involved in securing funding for the study AB secured thenecessary logistics in Antarctica JFM AB JoB and JeB carried out thefieldwork JFM RM PB RC-C and JM-B carried out the lab work JFM PQ AKTM RM JES MNK SG and AG were involved in analyses of the data JFMdrafted the manuscript All authors provided editorial comments on a draftmanuscript and have approved the final manuscript
FundingJFM work was supported by the Deutsche Forschungsgemeinschaft (DFGGermany) in the framework of the priority programme ldquoAntarctic Researchwith comparative investigations in Arctic ice areasrdquo SPP 1158 by thefollowing grant MA 25746ndash1 Martin Wikelski (Max Planck Institute of AnimalBehaviour Radolfzell Germany) provided the earthampOcean GPS-TD data log-gers AB was supported by the grant CTM2015ndash64720-R from the SpanishAgency of Research (Spain) Diet analyses from New Island were funded by aResearch Grant (NBAF967) for lab work at the Biomolecular Analysis Facility -Sheffield (NBAF-S) Centre for Ecology amp Hydrology Natural Environment Re-search Council (NERC) UK (to WOCS RM and JFM) Funding for the oper-ation and maintenance of the local Galaxy server is provided by the GermanFederal Ministry of Education and Research (BMBF) project ldquoBielefeld-GieszligenCenter for Microbial Bioinformatics-BiGirdquo (grant 031A533) within the GermanNetwork for Bioinformatics Infrastructure (de NBI) Thanks to the CPER (Con-trat de Projet Etat-Reacutegion) and the FEDER (Fonds Europeacuteen de Deacuteveloppe-ment Reacutegional) for funding the IRMS of LIENSs laboratory The IUF (Institut
Masello et al Movement Ecology (2021) 924 Page 21 of 25
Universitaire de France) is acknowledged for its support to PB as a SeniorMember Open Access funding enabled and organized by Projekt DEAL
Availability of data and materialsThe GPS-TD and tri-axial acceleration data supporting the conclusions of thisarticle are archived in the Movebank repository (IDs 1108578788132500849549 246072457 246072308 httpswwwmovebankorg) All otherdatasets supporting the conclusions of this article are included or citedwithin the article and its Additional file 1
Declarations
Ethics approval and consent to participatePermission to work in Antarctic locations and for penguin handling wasgiven by the Spanish Polar Committee The CSIC ethical commissionapproved the field procedures Fieldwork on New Island was approved bythe Falkland Islands Government (Environmental Planning Office) throughthe Research Licence R06 2011
Consent for publicationNot applicable
Competing interestsThe authors declare that they have no competing interests
Author details1Department of Animal Ecology amp Systematics Justus Liebig UniversityGiessen Heinrich-Buff-Ring 26 D-35392 Giessen Germany 2DepartmentEcologiacutea Evolutiva Museo Nacional de Ciencias Naturales CSIC CJoseacuteGutieacuterrez Abascal 2 28006 Madrid Spain 3Centre drsquoEtudes Biologiques deChizeacute UMR7372 CNRS-Universiteacute La Rochelle 79360 Villiers en Bois France4New Zealand Penguin Initiative PO Box 6319 Dunedin 9022 New Zealand5Cardiff School of Biosciences Cardiff University The Sir Martin EvansBuilding Museum Av Cardiff CF10 3AX UK 6Cardiff School of DentistryHeath Park Cardiff CF14 4XY UK 7Institute for Bioinformatics amp SystemsBiology Justus Liebig University Giessen Heinrich-Buff-Ring 58 D-35392Giessen Germany 8Littoral Environnement et Socieacuteteacutes (LIENSs) UMR 7266CNRS-Universiteacute de La Rochelle 17000 La Rochelle France 9InstitutUniversitaire de France (IUF) 1 rue Descartes 75005 Paris France 10GLOCEE -Global Change Ecology and Evolution Group Universidad de Alcalaacute MadridSpain 11Estacioacuten Experimental de Zonas Aacuteridas CSIC Almeriacutea Spain
Received 29 October 2020 Accepted 17 March 2021
References1 Allen AM Singh NJ Linking movement ecology with wildlife management
and conservation Front Ecol Evol 20163e155 httpsdoiorg103389fevo201500155
2 Doherty TS Driscoll DA Coupling movement and landscape ecology foranimal conservation in production landscapes Proc R Soc B 2018285e20172272 httpdxdoiorg101098rspb20172272
3 Ripple WJ Wolf C Newsome TM Barnard P Moomaw WR World scientistsrsquowarning of a climate emergency BioScience 2020708ndash12 httpsdoiorg101093bioscibiz088
4 Kays R Crofoot MC Jetz W Wikelski M Terrestrial animal tracking as an eyeon life and planet Science 2015348aaa2478 httpsdoiorg101126scienceaaa2478
5 Foley JA DeFries R Asner GP Barford C Bonan G Carpenter SR et al Globalconsequences of land use Science 2005309(5734)570ndash4 httpsdoiorg101126science1111772
6 Nathan R Getz WM Revilla E Holyoak M Kadmon R Saltz D et al A movementecology paradigm for unifying organismal movement research Proc Natl Acad SciU S A 2008105(49)19052ndash9 httpsdoiorg101073pnas0800375105
7 Dugger KM Ballard G Ainley DG Lyver POB Schine C Adeacutelie penguinscoping with environmental change results from a natural experiment atthe edge of their breeding range Front Ecol Evol 20142art68 httpsdoiorg103389fevo201400068
8 Hays GC Ferreira LC Sequeira AMM Meekan MG Duarte CM Bailey H et alKey questions in marine megafauna movement ecology Trends Ecol Evol201631(6)463ndash75 httpsdoiorg101016jtree201602015
9 Loacutepez-Loacutepez P Individual-based tracking systems in ornithology welcome to theera of big data Ardeola 20166303ndash36 httpsdoiorg1013157arla6312016rp5
10 Augeacute AA Dias MP Lascelles B Baylis AMM Black A Boersma PD et alFramework for mapping key areas for marine megafauna to inform marinespatial planning the Falkland Islands case study Mar Pol 20189261ndash72httpsdoiorg101016jmarpol201802017
11 Baylis AMM Tierney M Orben RA Warwick-Evans V Wakefield E Grecian WJet al Important at-sea areas of colonial breeding marine predators on thesouthern Patagonian shelf Sci Rep 20199(1)8517 httpsdoiorg101038s41598-019-44695-1
12 Gallagher AJ Creel S Wilson RP Cooke SJ Energy landscapes and thelandscape of fear Trends Ecol Evol 201732(2)88ndash96 httpsdoiorg101016jtree201610010
13 MacArthur RH Pianka ER On the optimal use of a patchy environment AmNat 1966100(916)603ndash10 httpsdoiorg101086282454
14 Schoener TW Theory of feeding strategies Annu Rev Ecol Syst 19712(1)369ndash404 httpsdoiorg101146annureves02110171002101
15 Thorpe SKS Crompton RH Alexander RM Orangutans use compliantbranches to lower the energetic cost of locomotion Biol Lett 20073(3)253ndash6 httpsdoiorg101098rsbl20070049
16 Wilson RP Shepard ELC Liebsch N Prying into the intimate details ofanimal lives use of a daily diary on animals Endanger Species Res 2008423ndash37 httpsdoiorg103354esr00064
17 Lempidakis E Wilson RP Luckman A Metcalfe RS What can knowledge ofthe energy landscape tell us about animal movement trajectories and spaceuse A case study with humans J Theo Biol 201857101ndash11 httpsdoiorg101016jjtbi201808024
18 Gaillard J-M Hebblewhite M Loison A Fuller M Powell R Basille M et alHabitatndashperformance relationships finding the right metric at a givenspatial scale Phil Trans R Soc B 2010365(1550)2255ndash65 httpsdoiorg101098rstb20100085
19 Mosser AA Avgar T Brown GS Walker CS Fryxell JM Towards an energeticlandscape broad-scale accelerometry in woodland caribou J Anim Ecol201483(4)916ndash22 httpsdoiorg1011111365-265612187
20 Long RA Bowyer RT Porter WP Mathewson P Monteith KL Findholt SLet al Linking habitat selection to fitness-related traits in herbivores the roleof the energy landscape Oecologia 2016181(3)709ndash20 httpsdoiorg101007s00442-016-3604-7
21 Masello JF Kato A Sommerfeld J Mattern T Quillfeldt P How animalsdistribute themselves in space variable energy landscapes Front Zool 201714art33 httpsdoiorg101186s12983-017-0219-8
22 Greacutemillet D Lescroeumll A Ballard G Dugger KM Massaro M Porzig EL et alEnergetic fitness field metabolic rates assessed via 3D accelerometrycomplement conventional fitness metrics Funct Ecol 201832(5)1203ndash13httpsdoiorg1011111365-243513074
23 Wilson RP Quintana F Hobson VJ Construction of energylandscapes can clarify the movement and distribution of foraginganimals Proc R Soc B 2012279(1730)975ndash80 httpsdoiorg101098rspb20111544
24 Shepard ELC Wilson RP Rees WG Grundy E Lambertucci SA Simon BVEnergy landscapes shape animal movement ecology Am Nat 2013182(3)298ndash312 httpsdoiorg101086671257
25 Wall J Douglas-Hamilton I Vollrath F Elephants avoid costlymountaineering Curr Biol 200616527ndash9
26 Brownscombe JW Gutowsky LF Danylchuk AJ Cooke SJ Foragingbehaviour and activity of a marine benthivorous fish estimated using tri-axial accelerometer biologgers Mar Ecol Prog Ser 2014505241ndash51 httpsdoiorg103354meps10786
27 Ameacutelineau F Fort J Mathewson P Speirs D Courbin N Perret S et alEnergyscapes and prey fields shape a North Atlantic seabird winteringhotspot under climate change R Soc Open Sci 20185(1)171883 httpsdoiorg101098rsos171883
28 Convey P Peck LS Antarctic environmental change and biologicalresponses Sci Adv 20195eaaz0888 httpsdoiorg101126sciadvaaz0888
29 Hinke JT Salwicka K Trivelpiece SG Watters GM Trivelpiece WZ Divergentresponses of Pygoscelis penguins reveal a common environmental driverOecologia 2007153(4)845ndash55 httpsdoiorg101007s00442-007-0781-4
30 Handley JM Baylis AM Brickle P Pistorius P Temporal variation in the dietof gentoo penguins at the Falkland Islands Polar Biol 201639(2)283ndash96httpsdoiorg101007s00300-015-1781-1
Masello et al Movement Ecology (2021) 924 Page 22 of 25
31 Miller AK Karnovsky NJ Trivelpiece WZ Flexible foraging strategies ofgentoo penguins Pygoscelis papua over 5 years in the South ShetlandIslands Antarctica Mar Biol 2009156(12)2527ndash37 httpsdoiorg101007s00227-009-1277-z
32 Baylis AMM Zuur AF Brickle P Pistorius PA Climate as a driver ofpopulation variability in breeding Gentoo penguins Pygoscelis papua at theFalkland Islands Ibis 2012154(1)30ndash41 httpsdoiorg101111j1474-919X201101179x
33 Lynch HJ Naveen R Fagan WF Censuses of penguin blue-eyed shagPhalacrocorax atriceps and southern giant petrel Macronectes giganteuspopulations on the Antarctic Peninsula 2001ndash2007 Mar Ornithol 20083683ndash97
34 Schofield O Ducklow HW Martinson DG Meredith MP Moline MA FraserWR How do polar marine ecosystems respond to rapid climate changeScience 2010328(5985)1520ndash3 httpsdoiorg101126science1185779
35 Clucas GV Dunn MJ Dyke G Emslie SD Naveen R Polito MJ et al Areversal of fortunes climate change lsquowinnersrsquo and lsquolosersrsquo in Antarcticpeninsula penguins Sci Rep 201445024 httpsdoiorg101038srep05024
36 Fraser WR Trivelpiece WZ Ainley DG Trivelpiece SG Increases in Antarcticpenguin populations reduced competition with whales or a loss of sea icedue to environmental warming Polar Biol 199211525ndash31 httpsdoiorg101007BF00237945
37 Ainley D Ballard G Ackley S Blight LK Eastman JT Emslie SD et alParadigm lost or is top-down forcing no longer significant in the Antarcticmarine ecosystem Antarct Sci 200719(3)283ndash90 httpsdoiorg101017S095410200700051X
38 Trivelpiece WZ Hinke JT Miller AK Reiss CS Trivelpiece SG Watters GMVariability in krill biomass links harvesting and climate warming to penguinpopulation changes in Antarctica Proc Natl Acad Sci U S A 2011108(18)7625ndash8 httpsdoiorg101073pnas1016560108
39 Atkinson A Siegel V Pakhomov E Rothery P Long-term decline in krill stockand increase in salps within the Southern Ocean Nature 2004432(7013)100ndash3 httpsdoiorg101038nature02996
40 Lima M Estay S Warming effects in the western Antarctic Peninsulaecosystem the role of population dynamic models for explaining andpredicting penguin trends Popul Ecol 201355(4)557ndash65 httpsdoiorg101007s10144-013-0386-1
41 Lynch HJ Naveen R Trathan PN Fagan WF Spatially integrated assessmentreveals widespread changes in penguin populations on the AntarcticPeninsula Ecology 201293(6)1367ndash77 httpsdoiorg10189011-15881
42 McMahon KW Michelson CI Hart T McCarthy MD Patterson WP Polito MJDivergent trophic responses of sympatric penguin species to historicanthropogenic exploitation and recent climate change Proc Natl Acad SciU S A 2019116(51)25721ndash7 httpsdoiorg101073pnas1913093116
43 Barbosa A Benzal J De Leoacuten A Moreno J Population decline of chinstrap penguins(Pygoscelis antarctica) on Deception Island South Shetlands Antarctica Polar Biol201235(9)1453ndash7 httpsdoiorg101007s00300-012-1196-1
44 Naveen R Lynch HJ Forrest S Mueller T Polito M First direct site-widepenguin survey at Deception Island Antarctica suggests significant declinesin breeding chinstrap penguins Polar Biol 2012351879ndash88 httpsdoiorg101007s00300-012-1230-3
45 Gil-Delgado JA Gonzaacutelez-Soliacutes J Barbosa A Populations of breeding birds inByers Peninsula Livingston Island South Shetland Islands Antarct Sci 201325(Special Issue 02)303ndash6 httpsdoiorg101017S0954102012000752
46 Strange I Catry P Strange G Quillfeldt P New Island Falkland Islands ASouth Atlantic wildlife sanctuary for conservation management New IslandConservation Trust 2007
47 Barbosa A Merino S Benzal J Martinez J Garciacutea-Fraile S Geographicvariation in the immunoglobulin levels in pygoscelid penguins Polar Biol200730219ndash25 httpsdoiorg101007s00300-006-0175-9
48 Bannasch R Wilson R Culik B Hydrodynamic aspects of design andattachment of a back-mounted device in penguins J Exp Biol 199419483ndash96
49 Ludynia K Dehnhard N Poisbleau M Demongin L Masello JF Quillfeldt PEvaluating the impact of handling and logger attachment on foragingparameters and physiology in southern Rockhopper penguins PLoS One20127(11)e50429 httpsdoiorg101371journalpone0050429
50 Griffiths R Double M Orr K Dawson R A DNA test to sex most birds MolEcol 19987(8)1071ndash6 httpsdoiorg101046j1365-294x199800389x
51 Masello JF Mundry R Poisbleau M Demongin L Voigt CC Wikelski M et alDiving seabirds share foraging space and time within and among speciesEcosphere 20101art19 httpsdoiorg101890ES10-001031
52 Palacios MJ Valera F Colominas-Ciuroacute R Barbosa A Cellular and humoralimmunity in two highly demanding energetic life stages reproduction andmoulting in the chinstrap penguin J Ornithol 2018159(1)283ndash90 httpsdoiorg101007s10336-017-1499-7
53 Arndt JE Schenke HW Jakobsson M Nitsche FO Buys G Goleb YBet al The International Bathymetric Chart of the Southern Ocean(IBCSO) Version 10mdasha new bathymetric compilation covering circum-Antarctic waters Geophys Res Lett 2013403111ndash7 httpsdoiorg101002grl50413
54 Smith WH Sandwell DT Global Sea floor topography from satellite altimetryand ship depth soundings Science 1997277(5334)1956ndash62 httpsdoiorg101126science27753341956
55 Mattern T Ellenberg U Houston DM Davis LS Consistent foraging routesand benthic foraging behaviour in yellow-eyed penguins Mar Ecol ProgSer 2007343295ndash306 httpsdoiorg103354meps06954
56 Tremblay Y Cherel Y Benthic and pelagic dives a new foraging behaviourin rockhopper penguins Mar Ecol Prog Ser 2000204257ndash67 httpsdoiorg103354meps204257
57 Wood AG Naef-Daenzer B Prince PA Croxall JP Quantifying habitat use insatellite-tracked pelagic seabirds application of kernel estimation toalbatross location J Avian Biol 200031(3)278ndash86 httpsdoiorg101034j1600-048X2000310302x
58 Laver PN Kelly MJ A critical review of home range studies J Wildl Manag200872(1)290ndash8 httpsdoiorg1021932005-589
59 Dinno A dunntest Dunnrsquos test of multiple comparisons using rank sums Rpackage version 135 2017 httpscranr-projectorgwebpackagesdunntestindexhtml Accessed 28 Oct 2020
60 Gleiss AC Wilson RP Shepard EL Making overall dynamic body accelerationwork on the theory of acceleration as a proxy for energy expenditureMethods Ecol Evol 20112(1)23ndash33 httpsdoiorg101111j2041-210X201000057x
61 Halsey LG Shepard ELC Quintana F Goacutemez Laich A Green JA Wilson RPThe relationship between oxygen consumption and body acceleration in arange of species Comp Biochem Physiol Part A 2009152(2)197ndash202httpsdoiorg101016jcbpa200809021
62 Wilson RP Boumlrger L Holton MD Scantlebury DM Goacutemez-Laich A QuintanaF et al Estimates for energy expenditure in free-living animals usingacceleration proxies a reappraisal J Anim Ecol 202089(1)161ndash72 httpsdoiorg1011111365-265613040
63 Quintana F Wilson RP Yorio P Dive depth and plumage air in wettablebirds the extraordinary case of the imperial cormorant Mar Ecol Prog Ser2007334299ndash310 httpsdoiorg103354meps334299
64 Shepard ELC Wilson RP Quintana F Goacutemez Laich A Forman DW Pushedfor time or saving on fuel fine-scale energy budgets shed light oncurrencies in a diving bird Proc R Soc B 2009276(1670)3149ndash55 httpsdoiorg101098rspb20090683
65 Rombolaacute EF Marschoff E Coria N Inter-annual variability in chinstrappenguin diet at South Shetland and South Orkneys Islands Polar Biol 201033(6)799ndash806 httpsdoiorg101007s00300-009-0757-4
66 Hastie T gam Generalized additive models R package version 1161 2019httpsCRANR-projectorgpackage=gam Accessed 28 Oct 2020
67 Lowther AD Trathan P Tarroux A Lydersen C Kovacs KM The relationshipbetween coastal weather and foraging behaviour of chinstrap penguinsPygoscelis antarctica ICES J Mar Sci 201875(6)1940ndash8 httpsdoiorg101093icesjmsfsy061
68 Culik B Wilson R Dannfeld R Adelung D Spairani H Coria NRC Pygoscelidpenguins in a swim canal Polar Biol 199111277ndash82 httpsdoiorg101007BF00238463
69 Davis RW Croxall JP OConnell MJ The reproductive energetics ofGentoo (Pygoscelis papua) and macaroni (Eudyptes chrysolophus)penguins at South Georgia J Anim Ecol 198958(1)59ndash74 httpsdoiorg1023074986
70 Wilson RP White CR Quintana F Halsey LG Liebsch N Martin GR et alMoving towards acceleration for estimates of activity-specific metabolic ratein free-living animals the case of the cormorant J Anim Ecol 200675(5)1081ndash90 httpsdoiorg101111j1365-2656200601127x
71 Elliott KH Measurement of flying and diving metabolic rate in wild animalsreview and recommendations Comp Biochem Physiol Part A 201620263ndash77 httpsdoiorg101016jcbpa201605025
72 Heldmaier G Neuweiler G Roumlssler W Vergleichende TierphysiologieSpringer 2013
Masello et al Movement Ecology (2021) 924 Page 23 of 25
73 Takahashi A Dunn M Trathan P Croxall J Wilson RP Sato K et al Krill-feeding behaviour in a chinstrap penguin compared to fish-eating inMagellanic penguins a pilot study Mar Ornithol 20043247ndash54
74 Bost CA Handrich Y Butler PJ Fahlman A Halsey LG Woakes AJ et alChanges in dive profiles as an indicator of feeding success in king andAdelie penguins Deep-Sea Res II 200754(3-4)248ndash55 httpsdoiorg101016jdsr2200611007
75 Carroll G Slip D Jonsen I Harcourt R Supervised accelerometry analysis canidentify prey capture by penguins at sea J Exp Biol 2014217(24)4295ndash302httpsdoiorg101242jeb113076
76 Puumltz K Rey AR Huin N Schiavini A Puumltz A Luthi BH Diving characteristics ofsouthern rockhopper penguins (Eudyptes c chrysocome) in the SouthwestAtlantic Mar Biol 2006149(2)125ndash37 httpsdoiorg101007s00227-005-0179-y
77 Elliott KH Davoren GK Gaston AJ Time allocation by a deep-diving birdreflects prey type and energy gain Anim Behav 200875(4)1301ndash10 httpsdoiorg101016janbehav200709024
78 Johnston K Ver Hoef JM Krivoruchko K Lucas N Using ArcGIS geostatisticalanalyst Esri Redlands 2001
79 Bolger AM Lohse M Usadel B Trimmomatic a flexible trimmer for Illuminasequence data Bioinformatics 201430(15)2114ndash20 httpsdoiorg101093bioinformaticsbtu170
80 Magoč T Salzberg SL FLASH fast length adjustment of short reads toimprove genome assemblies Bioinformatics 201127(21)2957ndash63 httpsdoiorg101093bioinformaticsbtr507
81 Schloss PD Westcott SL Ryabin T Hall JR Hartmann M Hollister EB et alIntroducing mothur open-source platform-independent community-supportedsoftware for describing and comparing microbial communities Appl EnvironMicrobiol 200975(23)7537ndash41 httpsdoiorg101128AEM01541-09
82 Edgar RC Search and clustering orders of magnitude faster than BLASTBioinformatics 201026(19)2460ndash1 httpsdoiorg101093bioinformaticsbtq461
83 Altschul SF Gish W Miller W Myers EW Lipman DJ Basic local alignment searchtool J Mol Biol 1990215(3)403ndash10 httpsdoiorg101016S0022-2836(05)80360-2
84 Afgan E Baker D Batut B van den Beek M Bouvier D Čech M et al Thegalaxy platform for accessible reproducible and collaborative biomedicalanalyses 2018 update Nucleic Acids Res 201846(W1)W537ndashW44 httpsdoiorg101093nargky379
85 Deagle BE Kirkwood R Jarman SN Analysis of Australian fur seal diet bypyrosequencing prey DNA in faeces Mol Ecol 200918(9)2022ndash38 httpsdoiorg101111j1365-294X200904158x
86 Vesterinen EJ Lilley T Laine VN Wahlberg N Next generation sequencingof fecal DNA reveals the dietary diversity of the widespread insectivorouspredator Daubentonrsquos bat (Myotis daubentonii) in southwestern FinlandPLoS One 20138(11)e82168 httpsdoiorg101371journalpone0082168
87 Kleinschmidt B Burger C Dorsch M Nehls G Heinaumlnen S Morkūnas J et alThe diet of red-throated divers (Gavia stellata) overwintering in the GermanBight (North Sea) analysed using molecular diagnostics Mar Biol 2019166e77
88 Crisol-Martiacutenez E Moreno-Moyano LT Wormington KR Brown PH Stanley D Usingnext-generation sequencing to contrast the diet and explore pest-reduction servicesof sympatric bird species in macadamia orchards in Australia PLoS One 201611(3)e0150159 httpsdoiorg101371journalpone0150159
89 Barrett RT Camphuysen K Anker-Nilssen T Chardine JW Furness RW GartheS et al Diet studies of seabirds a review and recommendations ICES J MarSci 200764(9)1675ndash91 httpsdoiorg101093icesjmsfsm152
90 Oksanen J Blanchet FG Kindt R Legendre P Minchin PR OrsquoHara R et alvegan community ecology package R package version 20ndash2 2012 httpscranr-projectorgwebpackagesveganindexhtml Accessed 28 Oct 2020
91 Faith DP Minchin PR Belbin L Compositional dissimilarity as a robustmeasure of ecological distance Vegetatio 198769(1-3)57ndash68 httpsdoiorg101007BF00038687
92 Minchin PR An evaluation of the relative robustness of techniques forecological ordination Vegetatio 198769(1-3)89ndash107 httpsdoiorg101007BF00038690
93 Hobson KA Clark R Turnover of 13C in cellular and plasma fractions ofblood implications for nondestructive sampling in avian dietary studiesAuk 1993110(3)638ndash41 httpsdoiorg1023074088430
94 Parnell A Inger R Bearhop S Jackson AL Stable isotope analysis in R (SIAR) 2013httpcranr-projectorgwebpackagessiarindexhtml Accessed 28 Oct 2020
95 Jackson AL Inger R Parnell AC Bearhop S Comparing isotopic niche widthsamong and within communities SIBER ndash stable isotope Bayesian ellipses inR J Anim Ecol 201180(3)595ndash602 httpsdoiorg101111j1365-2656201101806x
96 Lemon J Plotrix a package in the red light district of R R-news 200668ndash1297 Layman CA Arrington DA Montantildea CG Post DM Can stable isotope ratios
provide for community-wide measures of trophic structure Ecology 200788(1)42ndash8 httpsdoiorg1018900012-9658(2007)88[42CSIRPF]20CO2
98 Davis AK Maney DL Maerz JC The use of leukocyte profiles to measurestress in vertebrates a review for ecologists Funct Ecol 200822(5)760ndash72httpsdoiorg101111j1365-2435200801467x
99 Plischke A Quillfeldt P Lubjuhn T Merino S Masello JF Leucocytes in adultburrowing parrots Cyanoliseus patagonus in the wild variation betweencontrasting breeding seasons gender and condition J Ornithol 2010151(2)347ndash54 httpsdoiorg101007s10336-009-0461-8
100 Merino S Martiacutenez J Moslashller AP Sanabria L de Lope F Peacuterez J et alPhytohaemagglutinin injection assay and physiological stress in nestlinghouse martins Anim Behav 199958(1)219ndash22 httpsdoiorg101006anbe19991127
101 Dein FJ Hematology In Harrison GJ Harrison WR editors Clinical avianmedicine and surgery W B Saunders Company 1986 p 174ndash91
102 Hawkey CM Dennet PB A colour atlas of comparative veterinaryhaematology Wolfe 1989
103 Humphries GRW Naveen R Schwaller M Che-Castaldo C McDowall PSchrimpf M et al Mapping application for penguin populations andprojected dynamics (MAPPPD) data and tools for dynamic managementand decision support Polar Rec 201753(2)160ndash6 httpsdoiorg101017S0032247417000055
104 Naveen R Forrest S Dagit R Blight L Trivelpiece W Trivelpiece S Censusesof penguin blue-eyed shag and southern giant petrel populations in theAntarctic Peninsula region 1994ndash2000 Polar Rec 200036(199)323ndash34httpsdoiorg101017S0032247400016818
105 Hucke-Gaete R Osman LP Moreno CA Torres D Examining naturalpopulation growth from near extinction the case of the Antarctic fur seal atthe South Shetlands Antarctica Polar Biol 200427(5)304ndash11 httpsdoiorg101007s00300-003-0587-8
106 Atkinson A Hill SL Pakhomov EA Siegel V Anadon R Sanae C et al KRILLBASE a circumpolar database of Antarctic krill and salp numerical densities1926-2016 Earth Sys Sci Data 20179(1)193ndash210 httpsdoiorg105194essd-9-193-2017
107 CCAMLR Krill fishery report 2018 Commission for the Conservation ofAntarctic Marine Living Resources 2018
108 Vintildeuela J Moreno J Carrascal LM Sanz JJ Amat JA Ferrer M et al Theeffect of hatching date on parental care chick growth and chick mortalityin the chinstrap penguin Pygoscelis antarctica J Zool 1996240(1)51ndash8httpsdoiorg101111j1469-79981996tb05485x
109 Lynch H Fagan W Naveen R Population trends and reproductive success ata frequently visited penguin colony on the western Antarctic PeninsulaPolar Biol 201033(4)493ndash503 httpsdoiorg101007s00300-009-0726-y
110 Dunn MJ Forcada J Jackson JA Waluda CM Nichol C Trathan PN A long-term study of gentoo penguin (Pygoscelis papua) population trends at amajor Antarctic tourist site Goudier Island Port Lockroy Biodivers Conserv201928(1)37ndash53 httpsdoiorg101007s10531-018-1635-6
111 Cairns DK The regulation of seabird colony size a hinterland model AmNat 1989134(1)141ndash6 httpsdoiorg101086284970
112 Carpenter-Kling T Handley JM Green DB Reisinger RR Makhado ABCrawford RJM et al A novel foraging strategy in gentoo penguins breedingat sub-Antarctic Marion Island Mar Biol 2017164(2)33 httpsdoiorg101007s00227-016-3066-9
113 BirdLife International IUCN red list for birds 2020 httpwwwbirdlifeorgAccessed 28 Oct 2020
114 Polito MJ Trivelpiece WZ Karnovsky NJ Ng E Patterson WP Emslie SDIntegrating stomach content and stable isotope analyses to quantify thediets of pygoscelid penguins PLoS One 20116(10)e26642 httpsdoiorg101371journalpone0026642
115 Polito MJ Trivelpiece WZ Patterson WP Karnovsky NJ Reiss CS Emslie SDContrasting specialist and generalist patterns facilitate foraging nichepartitioning in sympatric populations of Pygoscelis penguins Mar Ecol ProgSer 2015519221ndash37 httpsdoiorg103354meps11095
116 Herman RW Valls FCL Hart T Petry MV Trivelpiece WZ Polito MJ Seasonalconsistency and individual variation in foraging strategies differ among andwithin Pygoscelis penguin species in the Antarctic peninsula region MarBiol 2017164(5)115 httpsdoiorg101007s00227-017-3142-9
117 Dimitrijević D Paiva VH Ramos JA Seco J Ceia FR Chipev N et al Isotopicniches of sympatric Gentoo and chinstrap penguins evidence of
Masello et al Movement Ecology (2021) 924 Page 24 of 25
competition for Antarctic krill Polar Biol 201841(9)1655ndash69 httpsdoiorg101007s00300-018-2306-5
118 Panasiuk A Wawrzynek-Borejko J Musiał A Korczak-Abshire M Pygoscelispenguin diets on King George Island South Shetland Islands with a specialfocus on the krill Euphausia superba Antarct Sci 202032(1)21ndash8 httpsdoiorg101017S0954102019000543
119 du Toit M Bartlett P Bester M Roux J Seabird predation by individual sealsat Ichaboe Island Namibia S Afr J Wildl Res 20043445ndash54 httpshdlhandlenet10520EJC117184
120 Visser IN Drennan MP White RW MacLean SF Lagerstrom LC Francis JMAntarctic fur seals (Arctocephalus gazella) observed predating Adeacutelie(Pygoscelis adeliae) and chinstrap penguins (P antarctica) AntarcticPeninsula Aquat Mamm 200834(2)193ndash9 httpsdoiorg101578AM3422008193
121 DrsquoAmico VL Bertellotti M Benzal J Coria N Vidal V Diaz JI et al Leukocytecounts in different populations of Antarctic Pygoscelid penguins along theAntarctic Peninsula Polar Biol 201639(2)199ndash206 httpsdoiorg101007s00300-015-1771-3
122 Shepard E Cole E-L Neate A Lempidakis E Ross A Wind prevents cliff-breeding birds from accessing nests through loss of flight control eLife20198e43842 httpsdoiorg107554eLife43842
Publisherrsquos NoteSpringer Nature remains neutral with regard to jurisdictional claims inpublished maps and institutional affiliations
Masello et al Movement Ecology (2021) 924 Page 25 of 25
Abstract
Background
Methods
Results
Conclusions
Background
Methods
Study sites and species
Instrumentation and fieldwork procedures
Spatial and temporal data
Calculation of energy
Step 1 calculation of the overall dynamic body acceleration
Step 2 calculation of benthic and pelagic ODBAs
Step 3 calculation of the cost of travelling
Step 4 calculation of the cost of a dive
Step 5 integrating the cost of the actual number of dives performed
Step 6 integrating the cost of diving and commuting
Step 7 calculating the energy gained during foraging
Step 8 construction of the energy landscapes
Molecular analysis of the diet
Stable isotope analysis of the diet
Condition parameters
Additional data
Results
Foraging trips and dive parameters
Calculation of energy
Molecular analysis of the diet
Stable isotope analysis of the diet
Condition parameters
Discussion
Conclusion
Abbreviations
Supplementary Information
Acknowledgments
Authorsrsquo contributions
Funding
Availability of data and materials
Declarations
Ethics approval and consent to participate
Consent for publication
Competing interests
Author details
References
Publisherrsquos Note
BackgroundThe current degree of anthropogenic space use bothat sea and land and climate change make it impera-tive to understand animal movement if meaningfulconservation and management measures are to betaken [1ndash3] Animals move to find critical resources[4] but increasingly they have to negotiate habitatsthat are intensively-used fragmented impoverishedor modified by climate change which may determineindividual survival and thus population dynamics andpersistence [5ndash7] Simultaneously a growing availabil-ity of high-resolution animal tracking technologies hasgreatly enhanced our ability to describe animal move-ments [4 8 9] which in turns guides and refinesconservation and management measures [10 11]Moreover current technologies offer a unique oppor-tunity to explore pioneering questions in ecology andto explain in depth the causes and fundamentalmechanisms of movement patterns and their signifi-cance for ecological and evolutionary processes [8 912]The first systematic attempts to understand the role of
behaviour in the distribution of animals originated fromoptimal foraging theory [13 14] In this context animalsshould exhibit behaviours that maximize energetic effi-ciency selecting patches where the gain per unit cost ishigh and the energy expenditure to reach them is mini-mized As movement accounts for such a large propor-tion of animal energy budgets energetic constraints withrespect to space use migration and foraging range areforeseeable factors [15ndash17] Unnecessary movementsand resulting energy deficits might increase the risk ofpredation reduce body condition increase physiologicalstress affect fitness and since the sum of individual re-sponses is ultimately reflected at the population-level bethe cause of population declines [12 18ndash22] Animalmovement has also been investigated in terms of thephysical mechanics of motion (biomechanical paradigm)the movement-related decisions made by the individuals(cognitive paradigm) and the theories of random walkdiffusion and anomalous diffusion (random paradigm)[6] More recently the paradigm of energy landscape hasopened a new approach to the mechanistic basis ofspatial ecology and decision-making in wild animals[12] The energy landscape paradigm (sensu Wilsonet al) [23] allows the quantification of the variation inthe energy costs of the movement through a given envir-onment [12] as well as how these costs vary in time andfor different animal populations moving there [21] usingfor instance environmentally dependent costs of trans-port generated by parameters such as incline substratetype vegetation current speed or direction [24] Re-search conducted in organisms as diverse as fish mam-mals and birds showed that animals will move in areas
of the energy landscape that result in minimized costsand maximised energy gain [19 21 23 25ndash27]In seabirds variable oceanographic conditions and fluc-
tuating food availability can affect the costs of moving andenergy landscapes capture this variation successfully [21]For instance considering the energetic costs and durationof flights dive and inter-dive phases Wilson et al [23]found that imperial cormorants Phalacrocorax atriceps se-lected foraging areas that varied greatly in the distancefrom the breeding colony and in water depth but alwaysindicated minimal energetic cost of movement comparedwith other areas in the available landscape Likewiseevaluating the daily energy requirements of an individualusing the biophysical properties of bodies (body shape andits heat flux) exposed to specific microclimatic conditions(sea surface temperature SST air temperature cloudcover relative humidity and wind speed) Ameacutelineau et al[27] found that little auks Alle alle targeted areas withmoderately elevated energy landscapes in winter In gen-too penguins Pygoscelis papua (hereafter gentoos) whenconsidering mass-specific costs of foraging to dive to aparticular depth plus commuting to a certain distanceand energy gained in terms of diving bottom time the en-ergy landscapes around two nearby colonies variedstrongly between years Yet the birds consistently usedthe areas of the energy landscape that resulted in lowerforaging costs However for these gentoos the breedingsuccess was low in a year of higher energy expenditurewhile it was high during a year of lower energy expend-iture suggesting the usefulness of energy landscapes tounderstand demographic changes and their consequencesfor conservation [21]We combined information from previous work on the
energy landscape in gentoos [21] with novel data on move-ment and diet and 1) studied the response of moving ani-mals to different energy landscapes and resources and 2)compared populations with contrasting population trendsGentoos are facing strong environmental change both inAntarctic and sub-Antarctic regions The Antarctic Penin-sula is one of the places where current environmentalchange is fastest [28] In both regions gentoos are knownto show considerable plasticity in their diet diving and for-aging behaviour [29 30] providing a buffer against changesin prey availability [31] However gentoos exhibit strikinglydifferent population trends in sub-Antarctic and Antarcticpopulations Since 1990 gentoos at the FalklandMalvinasIslands showed a great degree of inter-annual variability inthe number of breeding individuals which has been relatedto the Southern Oscillation Index (SOI) and the El NintildeoSouthern Oscillation (ENSO) yet the underlying mecha-nisms remain unknown [32] In contrast gentoos have beenincreasing at breeding colonies along the Antarctic Penin-sula and expanded southwards since 1979 [33ndash35] Thispositive population trend was understood as gentoos being
Masello et al Movement Ecology (2021) 924 Page 2 of 25
the lsquowinnersrsquo among Pygoscelis penguins of the reduction inthe sea-ice cover in the region because it positively affectsits winter survival (sea-ice hypothesis) [36] An alternativehypothesis postulated that penguin population dynamics inAntarctica were instead controlled through ldquotop-downrdquo fac-tors such as competition for prey [37] while another relatedhypothesis suggested a link between penguin populationtrends and changes in the abundance of their main preyAntarctic krill Euphausia superba [38] However it hasbeen shown that sea-ice cover and krill abundance are in-terrelated [39 40] Even more other aspects need to beconsidered such as fine-scale spatial heterogeneity in popu-lation dynamics observed on the Antarctic Peninsula [41]intra-specific competition [40] and adaptive shifts introphic position [42] But regardless of this research nostudy has yet considered the cost of foraging The energylandscape approach could provide a way to better under-stand the ecological processes involved as the energeticbalance between costs and benefits will affect how andwhich foraging areas are selected or avoided and the condi-tion of the birds which in turn will affect reproductive suc-cess and ultimately population dynamicsIn our present study we tested the following hypotheses
a) in optimal sites (Antarctic Peninsula and islands aroundit) gentoos forage in sectors of the energy landscapes
where low energy is required b) in suboptimal breedingsites like the FalklandMalvinas Islands (fluctuating popu-lations) gentoos are forced to forage in more expensiveconditions in the poorer years and c) foraging in areas ofthe energy landscapes that result in minimized energeticcosts will lead to better individual condition as shown byphysiological parameters such as leucocyte counts Tounderstand our results in a wider context we also investi-gated the diet and the energy landscape in chinstrap pen-guins Pygoscelis antarcticus (hereafter chinstraps) anAntarctic species with currently declining populations [3543 44] We tested the hypothesis that d) chinstraps showhigher energy expenditure than Antarctic gentoos
MethodsStudy sites and speciesWe collected data on three penguin populations gentoosfrom an Antarctic and a sub-Antarctic breeding site andchinstraps from an Antarctic breeding site We studied apopulation of gentoos breeding at a colony located in DevilsPoint Byers Peninsula Livingston Island South ShetlandIslands maritime Antarctica (hereafter Livingston 3000nests 62deg40primeS 61deg13primeW Fig 1) [45] Byers is characterisedby a high biological diversity due to relatively mild climaticconditions and a large ice-free area in summer [45] This
Fig 1 Overview of the location of the studied gentoo penguin Pygoscelis papua colonies at Devils Point Byers Peninsula Livingston Island SouthShetland Islands maritime Antarctica and New Island FalklandMalvinas Islands and the chinstrap penguin Pygoscelis antarcticus colony atVapour Col rookery Deception Island South Shetland Islands maritime Antarctica
Masello et al Movement Ecology (2021) 924 Page 3 of 25
breeding population is located in an optimal breeding siteas gentoos are increasing in numbers in this location in thelast decades [45] following the population increase andarea expansion in this region [33 41] We furthermore in-vestigated energy landscapes of chinstraps at Vapour Colrookery on the west side of Deception Island South Shet-land Islands (hereafter Deception 20000 breeding pairs63deg 00primeS 62deg40primeW Fig 1) [43] a species declining on theAntarctic Peninsula [41 44] We further studied the for-aging strategies and mechanism of gentoos of a fluctuatingpopulation New Island in the FalklandMalvinas Islands(hereafter New Island) [21 32] On New Island we investi-gated two breeding colonies one located at the North End(around 5000 breeding pairs 51deg 41402prime S 61deg 15003prime W)and one at the South End (around 2000 breeding pairs 51deg44677prime S 61deg17683prime W) [46] The data previously obtainedat New Island [21] as well as samples analysed in currentstudy are used for the comparisons between optimal andsuboptimal breeding sites
Instrumentation and fieldwork proceduresWe simultaneously deployed a combination of GPS-temperature-depth (GPS-TD earthampOCEAN Technolo-gies Kiel) and micro tri-axial accelerometer loggers(Axy-2 Technosmart Europe Rome Italy) or Axy-Trekloggers only (including GPS accelerometer and bothpressure and temperature sensors) on the penguins dur-ing chick guard For sample sizes per study site and
species see Table 1 We captured the birds mostly byhand in the nests with the occasional help of a hook at-tached to a rod [21] or a long-handle net [47] To pro-tect them from predators we also captured the chicksduring the handling of the adult We kept handling timemostly below 15min and always below 20min We tookextreme care to minimize stress to the captured birdscovering the head during handling in order to minimizethe risk of adults regurgitating During this procedurenone of the birds regurgitated We attached the loggerson the adult penguin with adhesive Tesareg 4651 tape [21]The loggers used (GPS-TD 75 to 145 g and Axy-2 19 gAxy-Trek 60 g) represented a maximum of a 3 of theadult gentoo body mass (mean for Livingston 52128 plusmn4782 g n = 25) or 4 of the adult chinstrap body mass(mean for Deception 37435 plusmn 4254 g n = 20) and had ashape that matched the body contour to reduce drag[48] In a previous study [49] we showed that handlingand short-term logger attachments like the ones in thisstudy showed limited effect on the behaviour and physi-ology of the birds After the deployment procedure andimmediately before the release of the adult bird wereturned the chicks to the nest and released the adultssome 20m from their nests All birds returned to theirnests and attended their chicks shortly after being re-leased The loggers recorded detailed position (longitudelatitude sampling interval 5 min) dive depth (reso-lution 35 cm sampling interval 1 s) time of day and
Table 1 Parameters of foraging trips used for the calculations of energy landscapes
Gentoo Chinstrap
Dec 2013 Dec 2014 Dec 2016 Jan 2017
New I South New I South New I North Livingston I Deception I
Short trips Long trips
Individuals tagged 16 8 8 26 18
Number of complete trips 13 4 6 26 19 18
Median trip length [km] 1256 b
(874ndash1618)887 a b
(408ndash1447)591 a (522ndash617) 271 c (199ndash334) 666 a (592ndash710) 377 d (217ndash495)
Kruskal-Wallis χ2 = 721 df = 5 P lt 0001
Median maximum distancefrom colony [km]
669 b (632ndash756) 477 a b
(237ndash756)296 a b (198ndash451) 11 c (86ndash134) 257 a (235ndash321) 155 d (87ndash202)
Kruskal-Wallis χ2 = 753 df = 5 P lt 0001
Median trip duration [min] 17273 a
(10624ndash24326)15796 a
(7652ndash25080)1129 a
(8503ndash15389)5034 b
(3732ndash6417)1049 a
(8661ndash1182)5955 b
(3712ndash6416)
Kruskal-Wallis χ2 = 67 df = 5 P lt 0001
Median start time offoraging (local time)
034146 c
(030546ndash141814)164926 a b
(114702ndash182555)091550 a b c
(031424ndash171355)145248 a
(101034ndash174536)093141 b c
(031005ndash160029)153853 a
(071619ndash183434)
Kruskal-Wallis χ2 = 173 df = 5 P lt 0001
The data correspond to gentoo penguins Pygoscelis papua breeding at New Island (FalklandMalvinas Islands) during chick guard (December) in 2013 and 2014gentoo penguins breeding at Devils Point Byers Peninsula Livingston Island South Shetland Islands Antarctica during chick guard (December 2016) andchinstrap penguins Pygoscelis antarcticus breeding at Vapour Col rookery Deception Island South Shetland Islands Antarctica during chick guard (January 2017)See also Figs S7 and S8 in Additional file 1Note Sample sizes vary with respect to deployments as not all parameters could be calculated for all individuals mainly due to some batteries running outbefore the finalization of an ongoing trip Statistically significant values are marked bold Dunnrsquos homogenous subgroups are indicated in superscriptsimilar letters
Masello et al Movement Ecology (2021) 924 Page 4 of 25
acceleration (sampling interval 50 Hz) measured in threedirections (x y z ie surge sway heave) [21] The de-vices operated for three to 9 days and had to be recov-ered to access recorded data We recaptured the birds intheir nests After device removal we measured flipperand bill length bill depth and body mass and collectedblood samples (200 μl) from the foot (Antarctica) or thebrachial (New Island) vein and four small feathers fromthe lower back of the adults Blood and feather sampleswere used for the study of stable isotopes (see Stable iso-tope analysis of the diet below) and molecular sexing(following standard methods) [50] As in previous stud-ies [21 51] we detected no adverse effects related toblood sampling One drop of blood was smeared and airdried on a glass slide directly after sampling and fixedwith absolute methanol and stained with Giemsa dyelater in the laboratory [52] Blood smears were used fordifferential leucocyte counts (see Condition parametersbelow) Additionally we collected fresh scat samples op-portunistically during the handling of the birds as wellas from randomly located ice or rock substrates aroundthe penguin colonies immediately after defecation Toavoid external contamination we took special care tocollect the central part of the scat and not the part thatwas in direct contact with the substrates We kept scatsamples cool with ice packs during fieldwork froze themonce back at the field station and transported frozenuntil processed in the laboratory
Spatial and temporal dataWe downloaded tri-axial acceleration data and GPS filescomprising location (WGS84) and time and a separatefile containing dive depth and water temperature datafrom the recovered loggers (Table 1) Sample sizes(Table 1) varied due to logger failures that prevented toproduce complete data sets for some individuals Fail-ures corresponded to 1) loggers damaged by salt waterreaching the electronic components 2) broken GPS an-tennas and 3) batteries that were unexpectedly depletedAs in previous studies [21 51] we defined foraging tripsfrom the time when the birds departed from the colonyto the sea until returning to the colony To obtain bathy-metric data for Antarctica we used the InternationalBathymetric Chart of the Southern Ocean (IBCSO) [53]while for the FalklandMalvinas Islands we used ba-thymetry data from the global sea floor topography fromsatellite altimetry and ship depth soundings (GlobalTopography) [21 54] We used QGIS 34 (QGIS Devel-opment Team) to plot and analyse positional data of thetrips performed by the birds We calculated trip lengthas the total cumulative linear distance between all pos-itional fixes along the foraging trip outside of the col-ony For each trip we determined the maximumdistance from the colony as the linear grand circle
distance between the furthest point of the recorded tripand the geographical coordinates of the departure col-ony determined by GPS [21 51] We calculated tripduration as the time difference between the onset of thefirst dive performed after leaving and the end of the lastdive event before arriving back at the colony For theidentification of foraging dives we used purpose-writtenscripts in Matlab (The Mathworks Inc Nattick USA)and in IGOR Pro 63 (WaveMetrics Lake OswegoUSA) Following Mattern et al [55] and in order toavoid depth measurement inaccuracy in the upper partof the water column we accepted dive events only whendepths gt 3 m were reached We defined the bottomphase as a period of the dive between a steady pressureincrease at the beginning of the dive (ie descent) andthe continuous pressure decrease indicating the pen-guinsrsquo ascent back to the surface [55 56] We also calcu-lated the maximum depth (in m) reached during a diveevent (hereafter event maximum depth) and the numberof dive events during a particular foraging trip For eachdive we calculated a geographical position either byusing the half way point between GPS fixes recorded im-mediately before and after the dive or by calculating therelative position along a linear interpolated line betweenthe last fix obtained and before the first fix after the diveoccurred based on the time the dive occurred relative tothese fixes Because in previous studies we found thatgentoos at New Island take both benthic and pelagicprey [21 51] we split the foraging dives performed bythe individuals in benthic and pelagic ones for furtheranalyses We did this by calculating the index of benthicdiving behaviour developed by Tremblay amp Cherel [56]This method assumes that benthic divers dive serially toa specific depth and therefore consecutive dives reachthe same depth zone These are called intra-depth zone(IDZ) dives [56] As in previous studies we defined theIDZ as the depth plusmn 10 of the maximum depth reachedby the preceding dive [21] During the current studygentoos performed a varying proportion of benthic andpelagic dives which we considered in following analysesAs the inspection of histograms showed that the data forpelagic dives was left shifted we used the median divedepth per colony per year for further calculations involv-ing pelagic dives (Table 2 Additional file 1 Figs S1 S2)We show the distribution of benthic and pelagic dives inFigs S3 S4 (Additional file 1) We also calculated themedian number of dives performed during the foragingtrips (Table 2) In previous studies [21 51] we foundthat gentoos showed no sexual differences in foragingbehaviour parameters Gentoos from Livingston showedalso no sexual differences in foraging (Additional file 1Figs S5) Therefore in this study we pooled the data ofmales and females We used the nonparametric fixedkernel density estimator to determine the 50 (core
Masello et al Movement Ecology (2021) 924 Page 5 of 25
area) and 95 (home range) density contour areas (esti-mated foraging range) [57 58] of dive locations (ie GPSposition at the onset of a dive event) Kernel densities in-dicate the places in a foraging trip where birds spentmost of their time [57] For these calculations we usedboth the Geospatial Modelling Environment (SpatialEcology LLC httpwwwspatialecologycomgme) andQGIS 34 (QGIS Development Team)As for trip and dive parameters (Tables 1 and 2) nor-
mality and equality of variance were not satisfied (P lt005 Additional file 1 Figs S7 S8) we investigated dif-ferences using the KruskalndashWallis test (one-wayANOVA on ranks) and Dunnrsquos homogenous subgroupsimplemented in the R package dunntest v135 (R Devel-opment Core Team httpswwwr-projectorg) [59]
Calculation of energyUsing tri-axial acceleration data (Additional file 1 FigS6) we quantified energy landscapes as the mass-specifictotal cost of foraging including diving and commutingrelative to the bottom time which we selected as a proxyof energy gained from feeding We considered the differ-ent proportion of benthic and pelagic dives carried out
by the studied penguins With the data obtained fromthe deployed penguins we calculated the energy land-scapes for a grid of the marine area around the islandswith the breeding colonies for which detailed bathymet-ric data was available We carried out the quantificationas in Masello et al [21] to allow comparisons andfollowed a series of steps
Step 1 calculation of the overall dynamic body accelerationSince the major variable factor in modulating energy ex-penditure in vertebrates is movement and measurementsof body acceleration correlate with energy expenditure(reviewed in [60]) we used tri-axial acceleration data tocalculate the Overall Dynamic Body Acceleration(ODBA) for all first foraging trips of the deployed indi-viduals ODBA is a linear proxy for metabolic energythat can be further converted into energy expenditure[16 23 60 61] but see also [62] As in previous studies[21 51] only the first foraging trip of each individualwas included in the calculations to avoid individuals withmore than one trip having more weight in the analysesand to allow comparisons
Table 2 Dive parameters used for the calculations of energy landscapes
Gentoo Chinstrap
Dec 2013 Dec 2014 Dec 2016 Jan 2017
New I South New I South New I North Livingston I Deception I
Short trip Long trip
Maximum dive depth [m] 1883 1782 1563 799 1099 1119
Median dive depth of pelagic dives [m] 158 e (3ndash1859) 127 ab (3ndash1766) 211 c (3ndash1565) 149 a (3ndash799) 154 b
76 d (70ndash81) 54 ab (34ndash67) 37 a (33ndash50) 52 a (47ndash61) 74 cd (61ndash76) 69 bc (57ndash76)
Kruskal-Wallis χ2 = 246 df = 5 P lt 0001
Median number of dives perforaging trip (MND)
283 a c
(202ndash337)291 a b c (193ndash471) 298 a b c (241ndash331) 215 a (156ndash268) 402 b (299ndash744) 369 c
(205ndash497)
Kruskal-Wallis χ2 = 196 df = 5 P = 0002
Median dive duration (DD)benthic dives [s]
156 a (142ndash177) 155 a (150ndash199) 176 a (157ndash202) 81 b (71ndash96) 90 b (82ndash95) 70 c (60ndash85)
Kruskal-Wallis χ2 = 612 df = 5 P lt 0001
Median dive duration (DD)pelagic dives [s]
103 a (92ndash119) 123 a b (117ndash125) 130 a (127ndash138) 67 c (63ndash73) 83 b (72ndash88) 55 d (51ndash69)
Kruskal-Wallis χ2 = 698 df = 5 P lt 0001
Minimum benthic bottomtime (mBBT) [s]
2 3 2 2 3 2
Parameters correspond to gentoo penguins Pygoscelis papua breeding at New Island (FalklandMalvinas Islands) during chick guard (December) in 2013 and 2014gentoo penguins breeding at Devils Point Byers Peninsula Livingston Island South Shetland Islands Antarctica during chick guard (December 2016) andchinstrap penguins Pygoscelis antarcticus breeding at Vapour Col rookery Deception Island South Shetland Islands Antarctica during chick guard (January 2017)Only the first foraging trip of each individual was included in the calculations in order to avoid individuals with more than one trip having more weight in theanalyses See also Figs S1 to S4 in Additional file 1Notes Statistically significant values are marked bold Dunnrsquos homogenous subgroups are indicated in superscript similar letters
Masello et al Movement Ecology (2021) 924 Page 6 of 25
We calculated ODBA (expressed as gravitational forceg) using a purpose-written script for IGOR Pro 63(WaveMetrics Lake Oswego USA) and the sum of theabsolute values of dynamic acceleration from each of thethree spatial axes (ie surge sway and heave samplinginterval 50 Hz) after subtracting the static acceleration(= smoothed acceleration smoothing window 1 s) fromthe raw acceleration values following Wilson et al [23]
Ax Ay and Az are the derived dynamic accelerations atany point in time corresponding to the three orthogonalaxes of the Axy-2 or the Axy-Trek acceleration loggersdeployed on the penguins
Step 2 calculation of benthic and pelagic ODBAsIn diving seabirds power costs during dive vary with thedepth exploited [63 64] and penguins take both benthicand pelagic prey [21 51 65] For both reasons we splitthe foraging dives performed by the individuals in ben-thic and pelagic ones calculated the corresponding ben-thic and pelagic ODBAs and interpolated them for theavailable bathymetric data points around the breedingcoloniesFor this step we first investigated the relationship be-
tween the ODBAs calculated in Step 1 and penguinsrsquomaximum dive depth We found that the sum of ODBAduring the dives carried out by the penguins was relatedto the maximum dive depth they reached (070 lt R2 lt078 see also Additional file 1 Figs S9-S12) Howeverusing a general additive model implemented in the Rpackage GAM [66] we found that this relationship dif-fered between benthic and pelagic dives both for gentoosand chinstraps (Additional file 1 Table S1) Thus wedetermined the regressions with the best fit for the dif-ferent dive types benthic and pelagic in SigmaPlot 10(Systat Software San Jose USA) We provide the regres-sion descriptions and corresponding parameters in TableS2 (Additional file 1) We used the regressions betweenthe sum of ODBA during the dive of the deployed pen-guins and the maximum dive depth (Additional file 1Table S2) together with the bathymetric data pointsfrom IBCSO [53] to calculate benthic ODBAs for a gridof the marine area around the penguin colonies (ap-proximately 100 km around the islands n = 8130 gridspatial resolution as in IBCSO 500 times 500 m based on apolar stereographic projection) separately for each spe-cies To calculate the pelagic ODBA we used the regres-sions (Additional file 1 Table S2) and the median divedepth (Table 2) as pelagic dive depth data were not nor-mally distributed but left-shifted
Step 3 calculation of the cost of travellingIn seabirds like penguins which cover large distances toreach their foraging grounds it is important to includethe energy cost of travelling for any calculations of thecost of foraging In previous work [21 51] we found thatgentoos performed foraging trips of up to 282 km whileup to 139 km were reported for chinstraps [67] We firstcalculated the distance between each point in the marinearea grid around the islands with the penguin breedingcolonies (see Step 2) with the Geospatial Modelling En-vironment and QGIS 34 Using this distance and themean swimming speed previously calculated for gentoos(23 m sminus 1) [68] we were able to calculate the travel timeneeded for the birds to reach each of the 8130 locationsaround the islands for which bathymetric data wereavailable The travel time (TT in s) and their minimummetabolic cost of transportation previously determinedin a swim canal and at sea (161W kgminus 1) [68 69]allowed us subsequently to calculate the minimum costof travelling (CT in J kgminus 1) to each location in the gridused to construct the energy landscapes
CT frac14 TT161 W kg‐1 eth2THORN
Step 4 calculation of the cost of a diveTo quantify the cost of a dive including the cost of thepursuit of prey during a dive we first had to measure itsenergy expenditure The rate of oxygen consumption Vo
(in ml minminus 1) is an indirect measure of energy expend-iture commonly used under laboratory conditions (forexamples see [60]) but difficult if not impossible to usein diving seabirds like penguins An alternative tech-nique for free-ranging animals is to use ODBAs as a cali-brated proxy for the rate of oxygen consumption Vo [6170] which can be used to calculate the total energy ex-penditure during a divePrevious research demonstrated a linear relationship
between ODBA and energy expenditure in all species ex-amined to date (summarised in [23] but see [62 71])Following the method developed by Wilson et al [70]and tested by Halsey et al [61] in several species we firstcalculated Vo
Vo frac14 916thornODBA1658 for gentooseth THORNor Vo
frac14 715thornODBA1204 for chinstrapseth THORN eth3THORN
We calculated the intercept and slope in (3) also fol-lowing Halsey et al [61] These authors found that theintercept and the slope for the relationship betweenODBA and Vo (in ml minminus 1) in all species studiedcould be calculated as intercept y = 275 BM073 (R2 =089) slope y = 352 BM094 (R2 = 094) with BM beingthe mean adult body mass in kg
Masello et al Movement Ecology (2021) 924 Page 7 of 25
The uptake of 1 l of oxygen can be converted into anenergy expenditure estimate of approximately 20 kJ [72]such that 1 ml O2min equals 0333 J sminus 1 Finally to de-rive the energy expenditure (in J kgminus 1 sminus 1) relative to thebody mass of the penguins (also called mass-specificpower MP eg [21 23]) we divided the energy expend-iture by the mean weight of the penguins (gentoos 52kg chinstraps 37 kg individuals measured in thisstudy)
MP frac14 Vo0333=BM eth4THORN
The equation in (4) allowed us to calculate the MPseparately for benthic dives (MPbenthic using benthicODBA from Step 2 in Eq 3) and pelagic dives (MPpelagicusing pelagic ODBA from Step 2 in Eq 3) for each pointin the grid around the islands used to construct the en-ergy landscapes
Step 5 integrating the cost of the actual number of divesperformedSubsequently we calculated the MP for each point ofthe marine arearsquos grid around the islands with the stud-ied breeding colonies for the number of benthic and pe-lagic dives carried out by the penguins In the case ofchinstraps we used the median number of dives per for-aging trip (MND Table 2) together with the mean diveduration (DD duration in s of the dive event Table 2)assuming a gradient of bottom depths from 3m (mini-mum depth consider a dive see the justification inSpatial and temporal data) to the maximum depth (=bathymetric depth) for benthic dives and a gradient ofbottom depths from 3m to median dive depth for pela-gic dives as follows
MPMNDpelagic frac14 DDpelagic MPpelagic 3 m deptheth THORN thornMPpelagic MND=2pPD
eth6THORN
where pBD is the mean proportion of benthic dives andpPD the mean proportion of pelagic dives (Table 2) in-cluded accounting for the proportion of benthic and pe-lagic dive in a single foraging tripIn the case of gentoos which in addition to pelagic
and benthic dives performed short and long trips andshowed a relationship between the number of dives andthe maximum distance from the colony during a for-aging trip (Additional file 1 Fig S13) we used the re-gression in Table S3 (Additional file 1) to computeMND
Step 6 integrating the cost of diving and commutingThe parameters calculated in Step 5 together with previ-ous calculations of CT (Step 4) allowed us to calculatethe total cost of foraging (TCF in J kgminus 1) as
CT is multiplied by two to account for the return tothe breeding colony
Step 7 calculating the energy gained during foragingPrevious studies on several penguin species havefound a positive relationship between bottom times(duration in s of bottom dive phase) and prey cap-ture Southern rockhoppers Eudyptes chrysocome havebeen found to maximise bottom time which in thisspecies equalled feeding time [56] chinstraps showeda positive linear relationship between bottom timeand the number of underwater beak-opening eventsduring dives and that most (86 n = 4910 events) ofbeak-openings occurred during the bottom times [73]king Aptenodytes patagonicus and Adeacutelie Pygoscelisadeliae penguins ingested prey mostly during the bot-tom phase of diving [74] and little penguin Eudyp-tula minor showed longer bottom times associatedwith dives where prey was captured [75] Thus sev-eral studies have successfully used bottom time as aproxy for prey acquisition and energy gained both inpenguins [21 76] and other seabirds [77] To buildenergy landscapes that also include the energy gainedduring foraging we calculated bottom times andminimum benthic bottom times (mBBT Table 2)The bottom times from the first foraging trip of eachindividual showed a relationship with maximum divedepth This relationship also differed between benthicand pelagic dives (GAM Additional file 1 Table S4)Again here we determined the regressions with thebest fit for the different dive types in SigmaPlot 100(Additional file 1 Table S5 Figs S14-S17) The re-gressions between bottom time and maximum divedepth (Additional file 1 Table S5) allowed us to cal-culate the sum of benthic bottom time (BBT) foreach point of the grid of the marine area around theislands with the studied breeding colonies used toconstruct the energy landscapes separately for eachspecies For pelagic bottom times (PBT) we used thecorresponding regressions (Additional file 1 Table S5)and the median dive depth per species (Table 2) Tocalculate the total bottom time (TBT in s) we tookinto account that the birds start diving close to thecolony (as also found in [21 51]) and increase divedepth while gaining distance A mean is calculatedand the mean multiplied per MND
Masello et al Movement Ecology (2021) 924 Page 8 of 25
We also included pBD and pPD here to account forthe proportion of benthic and pelagic dive in a singleforaging trip
Step 8 construction of the energy landscapesFinally dividing TCF (7) by TBT (8) we were able tocalculate the total relative cost (TRC in J kgminus 1 sminus 1)which is the mass-specific total cost of foraging (divingplus commuting) relative to the energy gained UsingTRC values calculated for the grid of the marine areaaround the islands with the breeding colonies we con-structed the energy landscape by applying the inversedistance weighted (IDW) interpolation in to the result-ing data grid As in our previous study [21] the IDWinterpolation was chosen as 1) a large set of samplevalues was available and 2) the sample data points rep-resented the minimum and maximum values in our sur-face [78] In brief the energy landscapes here presentedare based on the bathymetry of the area and the totalcost of foraging (diving plus commuting) relative to thebottom time (= energy gained in J kgminus 1 sminus 1) and takeinto account the different proportion of benthic and pe-lagic dives carried out by the penguins
Molecular analysis of the dietWe collected a total of 247 faecal samples from gentoosfrom the colony at Livingston chinstraps from the col-ony at Deception two colonies at New Island and po-tential prey samples to obtain detailed information ondiet composition (Additional file 1 Tables S6 and S7)Details on deoxyribonucleic acid (DNA) extractionprimers used polymerase chain reaction (PCR) amplifi-cations library preparations and next generation se-quencing (NGS) are provided in the Additional File 1(Table S8 and Additional Methods)We used the raw Illumina sequence data to produce a
list of molecular operational taxonomic units (MOTUs)Bioinformatics analyses included the following stepsassessing sequence quality with FASTQC (httpwwwbioinformaticsbabrahamacukprojectsfastqc) adapterand quality trimming of the paired-end reads withTRIMMOMATIC (minimum quality score of 20 over asliding window of 4 bp) [79] merging of the overlappingpaired-end read pairs using FLASH [80] transformingsequence files to FASTA with the FASTX-Toolkit(httphannonlabcshledufastx_toolkit) and extractingamplicons in MOTHUR [81] We used USEARCH [82]to remove identical replicates (dereplicate derep_full-length) to detect and to remove chimeric sequences(uchime_denovo) and to cluster sequences into molecu-lar operational taxonomic units (MOTUs) Using theBLASTn algorithm [83] we matched MOTU sequences
to reference sequences in the National Center for Bio-technology Information (NCBI) GenBank nucleotidedatabase using a cut-off of 90 minimum sequenceidentity and a maximum e-value of 000001 For the bio-informatics analyses of the samples from Antarctica wecarried out all those analyses using a custom workflowin GALAXY (httpswwwcomputationalbiouni-giessendegalaxy) [84] As next step we manually discardedMOTUs that corresponded to regular fieldwork contam-inants in faecal samples such as bacteria soil fungi hu-man or predator DNA We based taxonomic assignmenton the percentage similarity of the query and the refer-ence sequences Since short fragments are less likely tocontain reliable taxonomic information we only retainedsequences with a minimum length of 190 bp and aBLASTn assignment match greater than 98 [85 86]We assigned MOTUs to species-level in cases when allretained hits of a MOTU with the same quality criteria(sequence identity sequence length e-value) corre-sponded to the same species if not we assigned theMOTU to the lowest shared taxonomic level eg genusor family as in Kleinschmidt et al [87] We performedfurther filter steps to avoid contaminationfalse positivesand to obtain reliable data [88] as follows we acceptedMOTUs in a sample only if they contained a minimumof 10 sequences or accounted for gt 1 of the maximumtotal of hits Additionally we also discarded taxa withvery distant or ecologically irrelevant distribution ranges(eg deserts) Negative controls were included and didnot show any contaminations For each taxonomicallevel found we calculated the frequency of occurrence(FO) [89] To visualize differences in diet compositionsfor the penguin species and for adults and chicks weperformed non-metric multidimensional scaling(NMDS) with the function metaMDS in the R packageVEGAN [90] NMDS uses rank orders to collapse infor-mation from multiple dimensions into usually two-dimensions to facilitate visualization and interpretationand is generally considered as the most robust uncon-strained ordination method in community ecology [9192] The function metaMDS allowed us to investigatethe agreement between the two-dimension configurationand the original configuration through a stress param-eter If the stress is lt 005 the agreement is excellent lt01 is very good lt 02 provides a good representation Inour models the stress was always lt 004 (excellent) Weperformed permutational multivariate analysis of vari-ance using distance matrices (PERMANOVA) with thefunction adonis and checked for the multivariate homo-geneity of group dispersions (variances) with the func-tion betadisper We also used the functions ordihull andordiellipse to add convex hulls and ellipses to the NMDSplots and improve visualization To compare the dietcomposition for a certain number of sampled
Masello et al Movement Ecology (2021) 924 Page 9 of 25
individuals we additionally used species accumulationcurves (SAC) with the function specaccum in the Rpackage VEGAN [90]
Stable isotope analysis of the dietWe analysed carbon (δ13C) and nitrogen (δ15N) stableisotope ratios of red blood cells Stable isotope ratiosallowed us to compare the diet the penguins fed duringthe study period as red blood cells have a half-life of ca30 days [93] We carried out carbon and nitrogen isotopeanalyses on 065ndash075 mg sample aliquots weighed intotin cups Subsequently we determined carbon and nitro-gen isotope ratios by a mass spectrometer (Delta V Pluswith a Conflo IV interface Thermo Scientific BremenGermany) coupled to an elemental analyser (Flash 2000Thermo Scientific Milan Italy) at the LIENSs laboratoryfrom the University of La Rochelle France Replicatemeasurements of internal laboratory standards indicatedmeasurement errors lt 015 permil for δ13C and δ15N Re-sults are expressed in the δ unit notation as deviationsfrom standards (Vienna Pee Dee Belemnite for δ13C andN2 in air for δ15N) following the formula δ13C orδ15N = [(RsampleRstandard) - 1] times 103 where R is 13C12Cor 15N14N respectively Internal laboratory standards(acetanilide) were used to check accuracy Measurementerrors were lt 015permil for both δ13C and δ15NWe compared the isotopic niches of penguins using
SIAR (Stable Isotope Analyses in R) [94] and SIBER(Stable Isotope Bayesian Ellipses in R) [95] The loca-tion of the centroid (mean δ13C mean δ15N) indicateswhere the niche is centred in isotope space We useda Bayesian approach based on multivariate ellipsemetrics to calculate the Bayesian standard ellipse area(SEAb) which represents the core isotope niche widthas described by Jackson et al [95] In addition wecalculated standard ellipse areas based on MaximumLikelihood (SEA) and corrected for sample size(SEAc) We depicted ellipses using the drawellipsecommand of the R package PLOTRIX [96] with thelengths of the two semi-major axes and the angle ofthe semi-major axis of the ellipse with the x-axis asparameters To describe the spread of the data pointswe calculated parameters as described by Laymanet al [97] As proxies of intra-population trophic di-versity we also calculated the mean distance to cen-troid (CD) and the mean nearest-neighbour distance(NND) We give information on the trophic length ofthe community as the δ15N range (NR) and providean estimate of the diversity of basal resources by theδ13C range (CR) We split the data from gentoos intomale and female adults and first and second hatchedchicks but due to low samples size we were not ableto split chinstrap data
Condition parametersThe ratio of two types of leucocytes the heterophils andlymphocytes (HL ratio) has been successfully used asan indicator of physiological status and effort (high ra-tios = high stress) [98 99] Following Merino et al [100]differential leucocyte counts were carried out with alight microscope (times 1000) in parts of the blood smearswhere erythrocytes had separated in a monolayer Thesamples were crossed from down to up to minimize dif-ferences in the thickness of the blood smear Leucocyteswere counted following Dein [101] and Hawkey andDennett [102] A total of 100 leucocytes were counted ineach smear thus obtaining percentages of the differentof leucocyte types and the HL ratio
Additional dataWe obtained the location of other gentoo and chinstrappenguin colonies in the South Shetland Islands Antarc-tica from the Mapping Application for Penguin Popula-tions and Projected Dynamics [103] and Naveen et al[104] and the locations of Fur Seal Arctocephalusgazella colonies from Hucke-Gaete et al [105] Wedownloaded Antarctic Krill Euphausia superba abun-dance data for the sector between 60 and 65degS and 55ndash65degW from KRILLBASE [106] and obtained AntarcticKrill catches for the Commission for the Conservationof Antarctic Marine Living Resources (CCAMLR) Area48 from the Krill Fishery Report 2018 [107] Breedingsuccess data corresponds to the number of chicks pernest at the cregraveche and was obtained as part of ongoingprojects (Vapour Col rookery Deception [43 108] andAB unpubl Data New Island [21] and PQ unpubl Data) or from studies in the West Antarctic Peninsula regionthat followed the same methodology we used (Peter-mann Island [109] Goudier Island [110]) Other avail-able studies for the region were excluded as theirmethodology clearly differed from the one here usedDue to logistics limitations of our expedition to Antarc-tica breeding success data at Livingston could not begathered
ResultsForaging trips and dive parametersIn Antarctica both gentoos and chinstraps foraged rela-tively close to their own colonies (Fig 2) using the col-onyrsquos lsquohinterlandrsquo (sensu Cairns [111]) and henceavoided areas closer to the neighbouring colonies andthose from potential predators (Additional file 1 FigS18) and performed trips with the usual loop shape (Fig2) Gentoos from Livingston performed short (199ndash334km) and long (592ndash71 km) trips which strongly differedin both length (median short trip 271 km long trips666 km Table 1 Fig 2a) and in the extent of the coreareas and home ranges used (Fig 2b Additional file 1
Masello et al Movement Ecology (2021) 924 Page 10 of 25
Fig S19) The short trips carried out by gentoos fromLivingston were shorter than any of the trips performedby New Island birds (minimum trip 408 km) while thelong trips were similar to those carried out by New Is-land birds in 2014 (median South 887 North 591 km)
but substantially different than the much longer tripsperformed by New Island birds during 2013 (median1256 km Table 1) The trips performed by chinstrapsfrom Deception (median 377 km) were intermediate be-tween the long and short trips from gentoos from
Fig 2 Foraging trips (a) and kernel density distribution of dive locations (b) Data from gentoo penguins Pygoscelis papua breeding at DevilsPoint Byers Peninsula Livingston Island South Shetland Islands during chick guard (December 2016) and chinstrap penguins Pygoscelisantarcticus breeding at Vapour Col rookery Deception Island South Shetland Islands during chick guard (January 2017) Trip lines are colourcoded Dark grey first recorded trips red second trips yellow third trips green fourth trips pink fifth trips The 50 core areas are denoted byblack lines while 95 home ranges by yellow lines Kernels from gentoo penguins are further coded for short (dashed lines) and long trips (solidlines) Kernels from chinstrap penguins are denoted by solid lines only as no distinction between short and long trips could be found Depth (inm) is based on data from the International Bathymetric Chart of the Southern Ocean (IBCSO) [53]
Masello et al Movement Ecology (2021) 924 Page 11 of 25
Livingston (Table 1) Other related trip parameters areprovided in Table 1In Antarctica the maximum dive depth was recorded
in chinstraps (1119 m Table 2) However maximumdive depth achieved by both gentoos (1099 m) and chin-straps from Antarctica were lower than those from gen-toos from New Island (1883 m Table 2) regardless ofthe much deeper waters present in marine areas close toLivingston and Deception (up to 1000m depth Fig 2)When we considered the depth of the pelagic dives sep-arately we found that chinstraps dived less deep (me-dian 123 m) than gentoos (median long trips 154 mshort trips 149 m) This is in line with the higher pro-portion of benthic dives carried out by chinstraps (31)in comparison with gentoo long trips (26) Gentoosfrom Livingston carried out the highest number of divesper foraging trip during their long trips (median 402 di-ves) followed by the chinstraps (369 dives) During shorttrips gentoos from Livingston carried out a similarnumber of dives per foraging trip (215 dives) as the birdsfrom New Island (medians ranging from 283 to 298 di-ves Table 2)
Calculation of energyGentoos from Livingston used areas of the energy land-scape that resulted in the lowest foraging costs relativeto energy gain during foraging (up to 1376 J kgminus 1 sminus 1)avoiding areas equally distant where the costs werehigher (150 to 160 J kgminus 1 sminus 1 Fig 3a) Moreover the en-ergy landscapes in the marine areas around Livingston(Fig 3a) implied much lower costs than those aroundNew Island (up to 232 J kgminus 1 sminus 1 Additional file 1 FigsS20 to S22) During short trips gentoos from Livingstonincurred in foraging costs per bottom time gain with amedian value of 1152 J kgminus 1 sminus 1 (949 to 1367 Fig 4a)The median foraging cost per bottom time gain duringthe long trips performed by gentoos from Livingstonwas 1305 J kgminus 1 sminus 1 (953 to 1376 Fig 4b) In the caseof New Island gentoos incurred in variable foragingcosts per bottom time gain 1) South End colony 20131671 (1061 to 2320 Fig 4d) 2) South End 2014 1127(787 to 1831 Fig 4e) 3) North End 2014 990 (829 to1519 Fig 4f) (medians and ranges in J kgminus 1 sminus 1) In thisway the foraging costs per bottom time gain of the shorttrips were lower than those of the long trips while thosefrom New Island South 2013 were the highest and thosefrom New Island North End 2014 the lowest (Kruskal-Wallis χ2 = 23852 df = 5 P lt 0001 pairwise analysesin Additional file 1 Table S9)Chinstraps used marine areas around Deception where
the foraging costs per bottom time gain were below 105 Jkgminus 1 sminus 1 (median 965 range 808 to 1037 Figs 3b and4c) Chinstraps incurred significantly lower foraging costsper bottom time gain than the gentoos from Livingston
(up to 1376 J kgminus 1 sminus 1) or those from New Island South2013 and 2014 (up to 232) but similar to those from NewIsland North 2014 (up to 1519) (pairwise Kruskal-Wallisrank sum test in Additional file 1 Table S9 all P-values lt0001 except for New Island North P = 0364)
Molecular analysis of the dietGentoos from Livingston (Antarctica) and from New Is-land (sub-Antarctic) consumed different prey with thebirds from Antarctica consuming a less diverse diet(Table 3 Additional file 1 Table S10) When consider-ing the quantitative data from Antarctic penguins wefound that chinstraps had a more restricted diet thangentoos preying mainly on Antarctic Krill while gentoosfrom Antarctica in addition to Antarctic Krill includedfish more frequently (NMDS F601 = 37 P lt 0023 wherethe species explained 6 of the overall variation R2 =0059 Table 3 Additional file 1 Fig S23) When consid-ering age in our analyses we found that the diet com-position differed among the groups (adult gentoo chickgentoo adult chinstrap chick chinstrap F603 = 22 P =0028 R2 = 010 Additional file 1 Fig S24) Gentoochicks had a slightly richer diet composition than adultsas they were fed more frequently with fish (Fig 5aTable 3) In chinstraps chicks were fed more frequentlywith Thysanoessa macrura which is taken only very oc-casionally in adults and adults had a richer diet compos-ition by consuming occasionally some fish (Fig 5bTable 3) However permutation tests were not signifi-cant when gentoos (F241 = 14 P = 0203 R2 = 0059) orchinstraps (F351 = 11 P = 0254 R2 = 0032) were ana-lysed apart (Additional file 1 Figs S25 S26)
Stable isotope analysis of the dietMean isotope values differed among the Antarcticpenguin groups (Kruskal Wallis ANOVA for δ13Cχ2 = 351 df = 5 P lt 0001 for δ15N χ2 = 469 df =5 P lt 0001 Fig 5c Additional file 1 Table S11) Ingentoos the differences in δ13C signature were relatedto higher values in adult males than in chicks (Fig5c Additional file 1 Table S11) indicating a morebenthic diet for adults as also shown by the analysesof dive parameters in Table 2 Gentoos had also sig-nificantly higher δ13C than chinstraps (Fig 5c Add-itional file 1 Table S11) indicating again a morebenthic diet for gentoos in line with the significantdifferences in dive parameters (Table 2) In the caseof δ15N the differences among the groups were re-lated to higher values in chinstrap adults than in theirchicks (Fig 5c Additional file 1 Table S11) which isin line with the observation that chinstrap chickswere only fed with Euphausiacea (Table 3 Additionalfile 1 Fig S26) All niche metrics (Fig 5c Additionalfile 1 Table S11) were larger in gentoos than in
Masello et al Movement Ecology (2021) 924 Page 12 of 25
chinstraps indicating a higher variability in the feed-ing ecology among gentoos as also suggested by thedetected prey and their frequency of occurrence(Table 3) and the diet composition obtained usingNMDS (Additional file 1 Fig S23) Within speciesgentoo males and chicks had larger niche metricsthan females while no differences were observed be-tween first and second chicks and between chinstrap
adults and chicks (Additional file 1 Table S11) Add-itionally niche metrics from the gentoos from Ant-arctica (Additional file 1 Table S11) were mostlylarger than those from the previously studied gentoosfrom New Island except in the case of New IslandSouth during December 2013 to which they weresimilar (Additional file 1 Table S12 Masello et al2017)
Fig 3 Gentoo and chinstrap penguin energy landscapes Energy landscapes based on the bathymetry around Livingston Island South ShetlandIslands and the mass-specific total cost of foraging (diving plus commuting) by gentoo penguins Pygoscelis papua (a) and chinstrap penguinsPygoscelis antarcticus (b) relative to the bottom time (in J kgminus1 sminus1) considering the different proportion of benthic and pelagic dives carried outby the penguins The energy landscape categories have been defined to make them easy comparable with the ones used for gentoo penguinsfrom New Island FalklandMalvinas Islands in [21] The colony is marked by a triangle The location of the dives performed by the tracked birds isplotted in semi-transparent black circles for those corresponding to gentoo short trips and in white circles for those corresponding to gentoolong trips and semi-transparent black circles for chinstraps
Masello et al Movement Ecology (2021) 924 Page 13 of 25
Condition parametersComparisons of the HL ratios revealed no differencesbetween gentoos from New Island (sub-Antarctic mean27 plusmn 14) and those from Livingston (Antarctica 28 plusmn13 t = 0213 df = 204 P = 0834) However the meanHL ratios of the gentoos from Livingston (28 plusmn 13)were higher than those measured in chinstraps (13 plusmn07 Wilcoxon rank sum test with continuity correctionW = 47 P lt 0001 Additional file 1 Fig S27)
DiscussionUsing the energy landscape paradigm (sensu Wilsonet al [23]) we tested hypotheses on the energetic bal-ance between costs and benefits the foraging areas se-lected and the differences between different populationsand different species As predicted by our first hypoth-esis (a) we showed that gentoos from Livingston (Ant-arctica lsquooptimalrsquo site positive population trends) foragedin sectors of the energy landscape where low foragingcosts relative to energy gain were required (up to 1376 J
kgminus 1 sminus 1 Fig 3a) Also as predicted in our hypothesiscomparing different gentoo populations (b) we foundthat the birds breeding at New Island (FalklandMalvinasIslands lsquosuboptimalrsquo site fluctuating populations) [32]were forced to forage in more expensive sectors of theenergy landscape during poor conditions (Fig 4d Add-itional file 1 Figs S20-S22) than those from LivingstonIn the year of poor prey availability at New Island (2013)[21] the median foraging costs relative to energy gainduring foraging was 1671 J kgminus 1 sminus 1 and reached valuesup to 232 due to very long trips (90ndash160 km) and dee-per diving (up to 188 m Tables 1 and 2) During highprey availability at New Island (2014) [21] intermediatevalues of foraging costs relative to energy gain duringforaging (1127 J kgminus 1 sminus 1) were observed and were com-parable to those in gentoos from Livingston (1152 J kgminus 1
sminus 1) The maximum foraging costs relative to energygain at Livingston were merely 56 of those observed atNew Island Moreover gentoos from Livingston foragedover shorter distances closer to the colony for less time
Fig 4 Frequencies of foraging costs per bottom time gain Data are shown in J kg-1 s-1 for short (a) and long trips (b) carried out by gentoopenguins Pygoscelis papua breeding at Devils Point Byers Peninsula Livingston Island South Shetland Islands during chick guard (December2016) chinstrap penguins Pygoscelis antarcticus (c) breeding at Vapour Col rookery Deception Island South Shetland Islands during chick guard(January 2017) and for gentoo penguins breeding on New Island Falkland Malvinas Islands at the South End colony during the 2013 breedingseason (d) at the North End colony during 2014 (e) and at the South End colony during 2014 (f)
Masello et al Movement Ecology (2021) 924 Page 14 of 25
Table 3 Detected prey and their frequency of occurrence in scat samplesTaxa Gentoo Chinstrap
Dec 2013 Dec 2014 Dec 2016 Jan 2017
New I South New I South New I North Livingston I Deception I
Adults Firstchicks
Secondchicks
Unk All a All a Adult()
Firstchicks ()
Secondchicks ()
Adults()
Firstchicks ()
Secondchicks ()
n = 17(17)
n = 24(19)
n = 15(14)
n = 17(14)
n = 32(31)
n = 29(29)
n = 36(16)
n = 11(6)
n = 5(3)
n = 19(18)
n = 23(10)
n = 23(8)
Arthropoda Crustacea Malacostraca
Amphipoda Hyperiidae
Themisto sp ndash ndash ndash D D D ndash ndash ndash ndash ndash ndash
Decapoda
Pandalidae (shrimps)
Pandalus sp ndash ndash ndash D D D ndash ndash ndash ndash ndash ndash
Galatheidae
Munida gregarialobster krill
ndash ndash ndash D D D ndash ndash ndash ndash ndash ndash
Masello et al Movement Ecology (2021) 924 Page 15 of 25
and dived less deep for shorter times than those fromNew Island (Tables 1 and 2) In a previous study [21]we showed that when the energy landscape was charac-terized by lower foraging costs per energy gain (2014)the breeding success was high (129 chicks per nest)while during a year of high foraging costs (2013) breed-ing success was low (086 see also Additional file 1Table S13) Moreover published records of breeding suc-cess in gentoos show a remarkable pattern on the WestAntarctic Peninsula 84 of records (16 of 19) fall above themark of one (1) chick per nest while on New Island thishappens only in 40 (2 of 5) of the years suggesting a gen-erally better breeding success for Antarctic gentoos irre-spective of naturally occurring inter-annual oscillations(Fig 6) [21 109 110] All things considered the aboveresults are in line with our previous findings linkingenergy gain and variable energy costs of foraging tobreeding success [21] and suggest that the lower for-aging costs incurred by the gentoos from the Antarc-tic Peninsula could favour a higher breeding successthat in turn would explain the positive populationtrend of the species in the region offering a plausible
link between energy requirements and population dy-namics (see also [20] and references therein)A recent study [112] found that gentoos at sub-
Antarctic Marion Island alternated trips of relativelyshort and long durations with short trips likely associ-ated to self-maintenance and longer trips associated tochick provisioning Carpenter-Kling et al [112] postu-lated that gentoos may be using this strategy of alternateshort and long trips as a result of suboptimal feedingconditions related to environmental change Howeverwe did not find this behaviour at New Island a lsquosubopti-malrsquo site (Masello et al 2010 2017) while we found thatgentoos performed short (20 to 33 km) and long trips(59 to 71 km) at Livingston an lsquooptimalrsquo site (Tables 1and 2 Fig 3a) Median dive depths and numbers of di-ves per trip were comparable (Additional file 1 Fig S28)and thus the swim distance had a major influence onthe foraging costs relative to energy gain An alternativeexplanation for this foraging behaviour could be that itallows gentoos to use the areas of the energy landscapethat resulted in lower foraging costs which show a bi-modal distribution around the colony at Livingston
Table 3 Detected prey and their frequency of occurrence in scat samples (Continued)Taxa Gentoo Chinstrap
Dec 2013 Dec 2014 Dec 2016 Jan 2017
New I South New I South New I North Livingston I Deception I
Agonidae (alligatorfishes) D D D D D D ndash ndash ndash ndash ndash ndash
Psychrolutidae (blobfishes)
Psychrolutes sp D D ndash D D ndash ndash ndash ndash ndash ndash ndash
Data correspond to gentoo penguins Pygoscelis papua breeding at New Island FalklandMalvinas Islands during chick guard (December) in 2013 and 2014gentoo penguins breeding at Devils Point Byers Peninsula Livingston Island South Shetland Islands Antarctica during chick guard (December 2016) andchinstrap penguins Pygoscelis antarcticus breeding at Vapour Col rookery Deception Island South Shetland Islands Antarctica during chick guard (January 2017)Sample sizes 1) n = number of DNA extractions from scat samples and 2) in brackets the number of successfully amplified samples Unk age unknown samplesobtained at the colony First chicks first hatched chick Second chicks second hatched chick a Samples from 2014 were not split by age group due to smallsample sizes in most of the know age categories (see Additional file 1 Table S6) Samples from New Island are pooled (see Additional file 1 Additional MethodsMolecular analysis of the diet) and thus frequency of occurrence cannot be calculated Instead prey species detected are denoted with lsquoDrsquo Best blast results foreach detected taxa and corresponding accession number the identity with the blast reference sequence the sequence length and the bitscore are provided inAdditional file 1 Table S10
Masello et al Movement Ecology (2021) 924 Page 16 of 25
(green areas in Fig 3a) Also in this case the energylandscape paradigm offers a plausible explanation for aparticular animal behaviourOur results do not support our hypothesis that
chinstraps should show higher energy expenditurethan Antarctic gentoos (between-species differences inenergy expenditure hypothesis d) Contrary to ourexpectations based on long-term population trendschinstraps actually incurred lower foraging costs perbottom time gain than the gentoos from Livingston(Figs 3a b and 4 a-c) However our results suggestalso in this case a link between energy landscapesand breeding success 148 chicks per nest reachedthe cregraveche stage in chinstraps at Deception duringthe studied season (AB unpubl data) and this valuewas higher than most records for gentoos in the re-gion (Fig 6) The lower foraging costs per energygain experienced by the chinstraps from Deceptionduring this study could have allowed them to achievea higher breeding success regardless of the long-termpopulation trend [109] but see [113] suggesting thatthe driver of population decline in this species doesnot operate during the breeding season [43]
Another pattern arose from the foraging behaviourof Deception chinstraps At that island chinstrapsbreed in eight different colonies where up to 62500pairs breed (Additional file 1 Fig S18) [44 104] Allbut one of the trips performed by chinstraps fromVapour Col rookery occurred outside the lsquohinterlandrsquo(sensu Cairns [111]) of the other colonies of this spe-cies located on Deception suggesting a potentialavoidance of those areas (Additional file 1 Fig S18)Lima amp Estay [40] found that the population dynam-ics of chinstraps at the nearby King George Island isparticularly regulated by intra-specific competitionand the combined effects of Antarctic krill abundanceand sea-ice cover Our results appear to support thisview As previously found [65 114ndash118] both ourmolecular and isotopic analyses showed that chin-straps particularly their chicks had a more restricteddiet than gentoos (Tables 3 and 4 Figs 5a c Add-itional file 1 Fig S23) Thus in the case of chin-straps intra-specific competition the narrow foragingniche (Fig 5c) and declining Antarctic krill abun-dances (Additional file 1 Fig S29) [38] could explainthe population trends of the species [35 44]
Fig 5 Prey consumed by the penguins a shows the species accumulation curves corresponding to the prey consumed by adult and chickgentoo penguins Pygoscelis papua from the colony at Devils Point Byers Peninsula Livingston Island South Shetland Islands during chick guard(December 2016) and b by adult and chick chinstrap penguins Pygoscelis antarcticus breeding at Vapour Col rookery Deception Island SouthShetland Islands during chick guard (January 2017) c illustrates the isotopic niches based on δ13C and δ15N Values were measured in red bloodcells of adult and chick gentoo penguins from the colony at Devils Point and of adult and chick chinstrap penguins Pygoscelis antarcticusbreeding at Vapour Col rookery
Masello et al Movement Ecology (2021) 924 Page 17 of 25
In a previous study on gentoos [21] we showed theimportance of nonlethal effects of predation as a way ofbetter understanding animal movement Several speciesof pinnipeds prey on penguins [119 120] including Ant-arctic fur seals Arctocephalus gazella Weddell seals Lep-tonychotes weddellii and leopard seal Hydrurga leptonyxAntarctic fur seals have been observed patrolling thegentoo colony at Livingston Weddell Seals have beenfound in the vicinity of this colony and leopard sealssuccessfully predated chinstraps during our fieldwork(JFM AB pers observ) Furthermore Antarctic fur seals
breed in a large colony located close to the studied gen-too colony at Livingston (Additional file 1 Fig S18)Still in this study we were not able to detect noticeablesigns of active avoidance of particular areas in relation-ship to potential predators as we previously observedfor the gentoos from New Island [21 51] One explan-ation for this could be related to another large gentoocolony located at Barclay Bay halfway between our stud-ied colony and the large Antarctic fur seal colony onCape Shirreff and San Telmo Islets Livingston (Add-itional file 1 Fig S18) [45 105] The foraging trips per-formed by gentoos from Livingston could have avoidedthe lsquohinterlandrsquo of their conspecific large colony at Bar-clay Bay (and potentially three chinstrap colonies alsopresent in this location) avoiding at the same time theAntarctic fur seal colony located further to the east(Additional file 1 Fig S18) However foraging data fromthe gentoos at Barclay Bay would be needed to ascertainthis interpretationCurrent environmental changes in the Antarctic Pen-
insula [28] could affect animal physiological condition[99] But individuals may buffer challenging externalconditions by behaviourally adjusting their exposure tocosts and supplies of energy [20] Moreover Greacutemilletet al [22] demonstrated in Adeacutelie penguins Pygoscelisadeliae a relationship between individual condition andthe rates of energy expenditure As challenging environ-mental conditions could lead to greater energy expend-iture and reduced individual condition [21 98] and alink between energetics individual condition and fitnesshas long been postulated (reviewed in [22]) we investi-gated physiological condition in our deployed penguinsWe expected that foraging in areas of the energy land-scapes with low energetic costs would lead to better in-dividual condition (hypothesis c) Concerning
Fig 6 Gentoo and chinstrap penguin breeding success Datacorrespond to the number of chicks per nest recorded at cregraveche forthe chinstrap penguins Pygoscelis antarcticus breeding at Vapour Colrookery Deception Island South Shetland Islands gentoo penguinsPygoscelis papua from New Island FalklandMalvinas Islands andPetermann Island [109] and Goudier Island [110] in the WestAntarctic Peninsula The horizontal black line marks the value of one(1) chick per nest
Table 4 Diet and isotopic niche metrics
Gentoo female adults Gentoo male adults Gentoo first chicks Gentoo second chicks Chinstrap adults Chinstrap chicks
N 10 15 24 24 6 11
δ13C -2512plusmn049ab -2484plusmn040 a -2543plusmn054 bc -2548plusmn053bc -2598plusmn015 cd -2656plusmn009 d
δ15N 826plusmn041a 848plusmn065 a 813plusmn064 a 815plusmn066 a 798plusmn010 ab 736plusmn017 b
SEA 048 074 072 075 004 005
SEAc 055 080 075 078 005 006
SEAb 051 072 074 077 004 005
NR 165 245 224 264 031 058
CR 148 162 171 200 039 034
CD 055 062 070 070 017 017
NND 033 029 016 020 012 010
Data correspond to gentoo penguins Pygoscelis papua breeding at Devils Point Byers Peninsula Livingston Island South Shetland Islands Antarctica during chickguard (December 2016) and chinstrap penguins Pygoscelis antarcticus breeding at Vapour Col rookery Deception Island South Shetland Islands Antarctica duringchick guard (January 2017)Dunn tests were used for pairwise comparisons and homogenous subsets are marked with superscript letters SEA area of the standard ellipse (isotope nichewidth) SEAc as SEA corrected for sample size SEAb Bayesian standard ellipse area NR trophic length (range in δ15N) CR diversity of basal resources (range inδ13C) CD niche width 2 (mean distance to centroid) NND mean nearest neighbour distance
Masello et al Movement Ecology (2021) 924 Page 18 of 25
populations we found no differences in HL ratios be-tween gentoos from Livingston (lsquooptimalrsquo site) and NewIsland (lsquosuboptimalrsquo) however this probably happenedbecause the samples from New Island were taken duringthe favourable conditions of 2014 (see also Additionalfile 1 Table S13) [21] Unfortunately samples from NewIsland during the unfavourable year 2013 were not avail-able leaving this a matter for future investigations Butin support of our hypothesis the HL ratios of the chin-straps were lower than those measured in gentoos fromLivingston (Additional file 1 Fig S27) suggesting thatforaging in areas of the energy landscapes that result inminimised energetic costs (Figs 3b 4c) could lead tolower physiological stress and better individual condi-tion which could help to achieve a higher breeding suc-cess as in chinstraps during our study (Fig 6) HigherHL ratios values in gentoos compared to chinstrapshave been found in several populations of both speciesalong the Antarctic Peninsula [47 121] supporting ourinterpretation of our results However other factors thatcan affect HL ratios such as the presence of parasitesandor pathogens could also explain differences betweenthe speciesTo make the current study fully comparable with our
previous work on penguins [21] we followed the ap-proach of Wilson et al [23] to energy landscapes How-ever more recently the definition of the energylandscape has expanded to include the effect of mediaflow on movement costs [12 122] Water current flowcould have an effect on the energetic cost of penguinscommuting to and from the foraging sites and shouldnot be overlooked in future research
ConclusionWe applied energy landscapes to compare the foragingof penguins from colonies with different populationtrends At all sites penguins foraged in sectors of the en-ergy landscape where low energy was required Howeverwhen conditions were poorer the birds were forced toforage in more expensive parts of the energy landscapeOur results also showed that lower foraging costs mayfavour a higher breeding success that would explain thepositive population trend by the gentoo penguins fromLivingston in the Antarctic Peninsula and the higherbreeding success in chinstraps from Deception com-pared to gentoos Foraging in areas of the energy land-scapes that result in minimised energetic costs wasassociated with lower physiological stress and higherbreeding success The energy landscape approach mayhelp to improve our understanding of the relationshipbetween energy requirements individual condition andbreeding success and thus between animal movementand complex ecological processes
AbbreviationsANOVA Analysis of variance BBT Sum of benthic bottom time BM Meanadult body mass in kg CCAMLR Commission for the Conservation ofAntarctic Marine Living Resources CD Mean distance to centroid CR δ13Crange CT Cost of travelling DD Mean dive duration DDbenthic Mean diveduration for benthic dives DDpelagic Mean dive duration for pelagic divesDNA Deoxyribonucleic acid ENSO El Nintildeo Southern OscillationFO Frequency of occurrence GPS-TD Global Positioning System-temperature-depth HL Heterophils and lymphocytes ratioIBCSO International Bathymetric Chart of the Southern Ocean IDZ Intra-depth zone IDW Inverse distance weighted interpolation mBBT Minimumbenthic bottom times MND Median number of dives per foraging tripMNDbenthic Median number of benthic dives per foraging tripMNDpelagic Median number of pelagic dives per foraging tripMOTUs Molecular operational taxonomic units MP Mass-specific powerMPbenthic Mass-specific power for benthic dives MPpelagic Mass-specificpower for pelagic dives NASA National Aeronautics and SpaceAdministration NCBI National Center for Biotechnology InformationNE North End colony NGS Next generation sequencing NMDS Non-metricmultidimensional scaling NND Mean nearest-neighbour distance NR δ15Nrange ODBA Overall Dynamic Body Acceleration pBD Mean proportion ofbenthic dives PBT Pelagic bottom times PCR Polymerase chain reactionPERMANOVA Permutational multivariate analysis of variance using distancematrices pPD Mean proportion of pelagic dives SAC Species accumulationcurves SE South End colony SEA Standard ellipse areas SEAb Bayesianstandard ellipse area SEAc Standard ellipse areas corrected for sample sizeSIAR Stable Isotope Analyses in R SIBER Stable Isotope Bayesian Ellipses in RSOI Southern Oscillation Index TBT Total bottom time TCF Total cost offoraging TRC Total relative cost TT Travel time Vo Rate of oxygenconsumption
Supplementary InformationThe online version contains supplementary material available at httpsdoiorg101186s40462-021-00255-9
Additional file 1 Table S1 Results of a General Additive Model (GAM)investigating the sum of Overall Dynamic Body Acceleration (ODBA)during dive as a function of maximum dive depth with the intra-depthzone (IDZ foraging dives performed by the individuals split in benthicand pelagic) as factor Gentoo penguins Pygoscelis papua were breedingat Devils Point Byers Peninsula Livingston Island South Shetland IslandsAntarctica while chinstrap penguins Pygoscelis antarcticus were breedingat Vapour Col rookery Deception Island South Shetland Islands Antarc-tica Data was obtained during chick guard Table S2 The relationshipbetween the sum of Overall Dynamic Body Acceleration (ODBA) duringdive and maximum dive depth for benthic and pelagic dives (based onthe index of benthic diving behaviour intra-depth zone IDZ) Gentoopenguins Pygoscelis papua were breeding at Devils Point Byers PeninsulaLivingston Island South Shetland Islands Antarctica while chinstrap pen-guins Pygoscelis antarcticus were breeding at Vapour Col rookery Decep-tion Island South Shetland Islands Antarctica Data was obtained duringchick guard Table S3 The relationship between the number of divesper trip and the maximum distance from the colony during a foragingtrip carried out by gentoo penguin Pygoscelis papua breeding at DevilsPoint Byers Peninsula Livingston Island South Shetland Islands Antarc-tica (chick guard December 2016) See also Figure S11 Table S4 Re-sults of a General Additive Model (GAM) investigating the bottom time asa function of event maximum depth (maximum depth [m] reached dur-ing dive event) with the intra-depth zone (IDZ foraging dives performedby the individuals split in benthic and pelagic) as factor Gentoo pen-guins Pygoscelis papua were breeding at Devils Point Byers Peninsula Liv-ingston Island South Shetland Islands Antarctica while chinstrappenguins Pygoscelis antarcticus were breeding at Vapour Col rookery De-ception Island South Shetland Islands Antarctica Data was obtained dur-ing chick guard Table S5 The relationship between bottom time andevent maximum depth for benthic and pelagic dives (based on the indexof benthic diving behaviour intra-depth zone IDZ) Gentoo penguinsPygoscelis papua were breeding at Devils Point Byers Peninsula Living-ston Island South Shetland Islands Antarctica while chinstrap penguins
Masello et al Movement Ecology (2021) 924 Page 19 of 25
Pygoscelis antarcticus were breeding at Vapour Col rookery Deception Is-land South Shetland Islands Antarctica Data was obtained during chickguard Table S6 The number of DNA extractions from scat samples ofgentoo penguins Pygoscelis papua breeding at New Island FalklandMal-vinas Islands during chick guard (December) in 2013 and 2014 gentoopenguins breeding at Byers Peninsula Livingston Island Antarctica dur-ing chick guard (December 2016) and chinstrap penguins Pygoscelis ant-arcticus breeding at Vapour Col rookery Deception Island South ShetlandIslands Antarctica during chick guard (January 2017) Table S7 Controlsamples for the molecular detection of prey in scat samples from thestudied penguins Table S8 List of primers used in this study for the de-tection of prey species in scat samples from gentoo penguins Pygoscelispapua and chinstrap penguins Pygoscelis antarcticus Table S9 Compari-son of total foraging costs per bottom time gain (J kgminus 1 sminus 1) usingKruskal-Wallis rank sum test The groups tested correspond to gentoopenguins Pygoscelis papua breeding at New Island FalklandMalvinasIslands during chick guard (December) in 2013 and 2014 gentoo pen-guins breeding at Devils Point Byers Peninsula Livingston Island SouthShetland Islands Antarctica during chick guard (December 2016) andchinstrap penguins Pygoscelis antarcticus breeding at Vapour Col rookeryDeception Island South Shetland Islands Antarctica during chick guard(January 2017) Table S10 Best blast results for each detected taxa andcorresponding accession number the identity with the blast reference se-quence the sequence length and the bitscore from gentoo penguinsPygoscelis papua breeding at New Island FalklandMalvinas Islands dur-ing chick guard (December) in 2013 and 2014 gentoo penguins breedingat Devils Point Byers Peninsula Livingston Island South Shetland IslandsAntarctica during chick guard (December 2016) and chinstrap penguinsPygoscelis antarcticus breeding at Vapour Col rookery Deception IslandSouth Shetland Islands Antarctica during chick guard (January 2017)Table S11 Diet and isotopic niche metrics Data correspond to gentoopenguins Pygoscelis papua breeding at Devils Point Byers Peninsula Liv-ingston Island South Shetland Islands Antarctica during chick guard (De-cember 2016) and chinstrap penguins Pygoscelis antarcticus breeding atVapour Col rookery Deception Island South Shetland Islands Antarcticaduring chick guard (January 2017) Table S12 Isotopic niche metrics ofgentoo penguins Pygoscelis papua breeding at New Island FalklandMal-vinas Islands during chick guard (December) in 2013 and 2014 Parame-ters are based on carbon (δ13C) and nitrogen (δ15N) stable isotopes ofchick feather samples as a marker of breeding season foraging ecologyfrom two colonies at New Island and two breeding seasons calculatedwith the SIAR package SE South End colony NE North End colony Forfurther details see Masello et al (2017) Table S13 Gentoo penguinsPygoscelis papua breeding success at New Island FalklandMalvinasIslands The number of chicks corresponds to cregraveche stage For furtherdetails on the colonies see Masello et al (2010 2017) Figure S1 The dis-tribution of dive depth data during benthic (A) and pelagic (B) foragingdives by gentoo penguin Pygoscelis papua breeding at Devils Point ByersPeninsula Livingston Island South Shetland Islands Antarctica duringchick guard (December 2016) Benthic and pelagic dives are defined withthe use of the index of benthic diving behaviour intra-depth zone (IDZ)Figure S2 The distribution of dive depth data during benthic (A) andpelagic (B) foraging dives by chinstrap penguins Pygoscelis antarcticusbreeding at Vapour Col rookery Deception Island South Shetland IslandsAntarctica during chick guard (January 2017) Benthic and pelagic divesare defined with the use of the index of benthic diving behaviour intra-depth zone (IDZ) Figure S3 Example of the distribution in differentdepths of benthic (A) and pelagic (B) dives carried out by gentoo pen-guin Pygoscelis papua breeding at Devils Point Byers Peninsula Living-ston Island South Shetland Islands Antarctica during chick guard(December 2016) Depth (in m) is based on data from the InternationalBathymetric Chart of the Southern Ocean (IBCSO Arndt et al 2013) Fig-ure S4 Example of the distribution in different depths of benthic (A) andpelagic (B) dives carried out by chinstrap penguins Pygoscelis antarcticusbreeding at Vapour Col rookery Deception Island South Shetland IslandsAntarctica during chick guard (January 2017) Depth (in m) is based ondata from the International Bathymetric Chart of the Southern Ocean(IBCSO Arndt et al 2013) Figure S5 Foraging trips by female (red bur-gundy) and male (yellow) gentoo penguins Pygoscelis papua breeding atDevils Point Byers Peninsula Livingston Island South Shetland Islands
Antarctica during chick guard (December 2016) (A) and chinstrap pen-guins Pygoscelis antarcticus breeding at Vapour Col rookery Deception Is-land South Shetland Islands Antarctica during chick guard (January2017) (B) Depth (m) is based on data from the International BathymetricChart of the Southern Ocean (IBCSO Arndt et al 2013) Figure S6 Ex-ample of dive profiles and tri-axial acceleration data during three con-secutive dives by gentoo penguins Pygoscelis papua breeding at DevilsPoint Byers Peninsula Livingston Island South Shetland Islands Antarc-tica during chick guard (December 2016) Acceleration data correspondto each of the three spatial axes x surge (green) y heave (red) and zsway (blue) Dive depth is given in metres and 0 (zero) corresponds tothe water surface Figure S7 The distribution of foraging parameter dataused for the calculations of energy landscapes in gentoo penguins Pygos-celis papua breeding at Devils Point Byers Peninsula Livingston IslandSouth Shetland Islands Antarctica during chick guard (December 2016)See also Table 1 Figure S8 The distribution of foraging parameter dataused for the calculations of energy landscapes in chinstrap penguinsPygoscelis antarcticus breeding at Vapour Col rookery Deception IslandSouth Shetland Islands Antarctica during chick guard (January 2017) Seealso Table 1 Figure S9 The relationship between the sum of Overall Dy-namic Body Acceleration (ODBA) during dive and maximum dive depthfor benthic dives (based on the index of benthic diving behaviour intra-depth zone IDZ) carried out by gentoo penguin Pygoscelis papua breed-ing at Devils Point Byers Peninsula Livingston Island Antarctica duringchick guard (December 2016) Details for the regression curve are givenin Table S2 Figure S10 The relationship between the sum of OverallDynamic Body Acceleration (ODBA) during dive and maximum divedepth for pelagic dives (based on the index of benthic diving behaviourintra-depth zone IDZ) carried out by gentoo penguin Pygoscelis papuabreeding at Byers Peninsula Livingston Island Antarctica during chickguard (December 2016) Details for the regression curve are given inTable S2 Figure S11 The relationship between the sum of Overall Dy-namic Body Acceleration (ODBA) during dive and maximum dive depthfor benthic dives (based on the index of benthic diving behaviour intra-depth zone IDZ) carried out by chinstrap penguins Pygoscelis antarcticusbreeding at Vapour Col rookery Deception Island South Shetland IslandsAntarctica during chick guard (January 2017) Details for the regressioncurve are given in Table S2 Figure S12 The relationship between thesum of Overall Dynamic Body Acceleration (ODBA) during dive and max-imum dive depth for pelagic dives (based on the index of benthic divingbehaviour intra-depth zone IDZ) carried out by chinstrap penguinsPygoscelis antarcticus breeding at Vapour Col rookery Deception IslandSouth Shetland Islands Antarctica during chick guard (January 2017) De-tails for the regression curve are given in Table S2 Figure S13 The rela-tionship between the number of dives per trip and the maximumdistance from the colony during a foraging trip carried out by gentoopenguin Pygoscelis papua breeding at Byers Peninsula Livingston IslandAntarctica (chick guard December 2016) Details for the regression curveare given in Table S3 Figure S14 The relationship between the bot-tom time and the event maximum depth for benthic dives (based on theindex of benthic diving behaviour intra-depth zone IDZ) carried out bygentoo penguin Pygoscelis papua breeding at Byers Peninsula LivingstonIsland Antarctica during chick guard (December 2016) Details for the re-gression curve are given in Table S4 Figure S15 The relationship be-tween the bottom time and the event maximum depth for pelagic dives(based on the index of benthic diving behaviour intra-depth zone IDZ)carried out by gentoo penguin Pygoscelis papua breeding at Byers Penin-sula Livingston Island Antarctica during chick guard (December 2016)Details for the regression curve are given in Table S4 Figure S16 Therelationship between the bottom time and the event maximum depthfor benthic dives (based on the index of benthic diving behaviour intra-depth zone IDZ) carried out by chinstrap penguins Pygoscelis antarcticusbreeding at Vapour Col rookery Deception Island South Shetland IslandsAntarctica during chick guard (January 2017) Details for the regressioncurve are given in Table S4 Figure S17 The relationship between thebottom time and the event maximum depth for pelagic dives (based onthe index of benthic diving behaviour intra-depth zone IDZ) carried outby chinstrap penguins Pygoscelis antarcticus breeding at Vapour Col rook-ery Deception Island South Shetland Islands Antarctica during chickguard (January 2017) Details for the regression curve are given in Table
Masello et al Movement Ecology (2021) 924 Page 20 of 25
S4 Figure S18 Location and size of other colonies of gentoo penguinsPygoscelis papua (degrees of red dots) chinstrap penguins Pygoscelis ant-arcticus (degrees of blue dots) and Antarctic Fur Seals Arctocephalusgazella (degrees of brown dots) in the South Shetland Islands AntarcticaThe locations and size of the Fur Seal colonies were obtained fromHucke-Gaete et al (2004) while those from the penguin colonies wereobtained from Naveen et al (2000) and the Mapping Application for Pen-guin Populations and Projected Dynamics (MAPPPD) (Humphries et al2017) available at httpwwwpenguinmapcom Size for penguins pairsSize for fur seals individuals Foraging trip coded as in Fig 2a FigureS19 Kernel density distribution of dive locations and bathymetry The50 core areas are denoted by black lines while 95 home ranges byyellow lines Kernel density distributions represent the places where thepenguins spent most of their forging time Data from gentoo penguinsPygoscelis papua breeding at Devils Point Byers Peninsula Livingston Is-land South Shetland Islands Antarctica during chick guard (December2016) is further coded in short (dashed lines) and long trips (solid lines)Data from chinstrap penguins Pygoscelis antarcticus breeding at VapourCol rookery Deception Island South Shetland Islands Antarctica duringchick guard (January 2017) is denoted by solid lines only as no distinc-tion between short and long trips could be found Depth (in m) is basedon data from the International Bathymetric Chart of the Southern Ocean(IBCSO Arndt et al 2013) Figure S20 Energy landscapes based on thebathymetry around New Island FalklandMalvinas Islands and the mass-specific total cost of foraging (diving plus commuting) by gentoo pen-guins Pygoscelis papua relative to the bottom time (in J kgminus 1 sminus 1) consid-ering the different proportion of benthic and pelagic dives carried out bythe penguins from the South End colony during the 2013 breeding sea-son For further details see Masello et al (2017) Figure S21 Energy land-scapes based on the bathymetry around New Island FalklandMalvinasIslands and the mass-specific total cost of foraging (diving plus commut-ing) by gentoo penguins Pygoscelis papua relative to the bottom time (inJ kgminus 1 sminus 1) considering the different proportion of benthic and pelagicdives carried out by the penguins from the South End colony during the2014 breeding season For further details see Masello et al (2017) FigureS22 Energy landscapes based on the bathymetry around New IslandFalklandMalvinas Islands and the mass-specific total cost of foraging(diving plus commuting) by gentoo penguins Pygoscelis papua relative tothe bottom time (in J kgminus 1 sminus 1) considering the different proportion ofbenthic and pelagic dives carried out by the penguins from the NorthEnd colony during the 2014 breeding season For further details seeMasello et al (2017) Figure S23 Diet composition using non-metricmultidimensional scaling (NMDS) of molecular operational taxonomicunits (MOTUs) Data corresponds to gentoo penguins Pygoscelis papua atDevils Point Byers Peninsula Livingston Island South Shetland IslandsAntarctica during chick guard (Dec 2016) and chinstrap penguins Pygos-celis antarcticus at Vapour Col rookery Deception Island South ShetlandIslands Antarctica during chick guard (Jan 2017) A) includes the identityof the prey consumed while B) the ellipses and C) the convex hulls con-necting similar categories Gentoo black dots and lines and dark greyshade Chinstrap royal blue dots and lines and royal blue shade FigureS24 Diet composition using non-metric multidimensional scaling(NMDS) of molecular operational taxonomic units (MOTUs) Data corre-sponds to gentoo penguins Pygoscelis papua at Devils Point Byers Penin-sula Livingston Island South Shetland Islands Antarctica during chickguard (Dec 2016) and chinstrap penguins Pygoscelis antarcticus at VapourCol rookery Deception Island South Shetland Islands Antarctica duringchick guard (Jan 2017) A) includes the identity of the prey consumedwhile B) the ellipses and C) the convex hulls connecting similar categor-ies The categories included are gentoo adults (back and dark grey) gen-too chicks (red) chinstrap adults (royal blue) and chinstrap chicks (cyannot visible A) and C) Figure S25 Diet composition using non-metricmultidimensional scaling (NMDS) of molecular operational taxonomicunits (MOTUs) Data corresponds to gentoo penguins Pygoscelis papua atDevils Point Byers Peninsula Livingston Island South Shetland IslandsAntarctica during chick guard (Dec 2016) A) includes the identity of theprey consumed while B) the ellipses and C) the convex hulls connectingsimilar categories The categories included are adults (black and darkgrey) and chicks (red) Figure S26 Diet composition using non-metricmultidimensional scaling (NMDS) of molecular operational taxonomic
units (MOTUs) Data corresponds to chinstrap penguins Pygoscelis antarc-ticus at Vapour Col rookery Deception Island South Shetland Islands Ant-arctica during chick guard (Jan 2017) A) includes the identity of the preyconsumed while B) the ellipses and C) the convex hulls connecting simi-lar categories The categories included are adults (royal blue) and chicks(cyan) Figure S27 Boxplot of the ratio of two types of leucocytes theheterophils and lymphocytes (HL ratio) belonging to chinstrap penguinsPygoscelis antarcticus at Vapour Col rookery Deception Island South Shet-land Islands Antarctica during chick guard (Jan 2017) and gentoo pen-guins Pygoscelis papua at Devils Point Byers Peninsula Livingston IslandSouth Shetland Islands Antarctica during chick guard (Dec 2016) Box-plots include medians whiskers indicating variability outside the upperand lower quartiles and outliers (circles) Figure S28 Dive depth of pela-gic dives corresponding to gentoo penguins Pygoscelis papua breedingat New Island (FalklandMalvinas Islands) during chick guard (December)in 2013 and 2014 gentoo penguins breeding at Devils Point Byers Penin-sula Livingston Island South Shetland Islands Antarctica during chickguard (December 2016) and chinstrap penguins Pygoscelis antarcticusbreeding at Vapour Col rookery Deception Island South Shetland IslandsAntarctica during chick guard (January 2017) Figure S29 Standardisedabundance of the Antarctic Krill Euphausia superba obtained from theKRILLBASE (Atkinson et al 2017) for the sector between 60 and 65degS and55ndash65degW (A) and Antarctic Krill catches for the CCAMLR Area 48 (B) Add-itional Methods Molecular analysis of the diet Additional References
AcknowledgmentsWe would like to thank Intildeaki Irastorza Miguel Ojeda Jordi Felipe theAntarctic stations Juan Carlos I and Gabriel de Castilla personnel (Australsummer 2016-2017) the RV Sarmiento de Gamboa crew (Austral summer2016-2017) the Unidad de Tecnologiacutea Marina ndash CSIC (Spain) New IslandConservation Trust Ian Maria and Georgina Strange Sylvia Kuhn (Max PlanckInstitute for Ornithology Germany) Melanie Marx Julia Sommerfeld Chris-toph Kaula Jessica Winter (Justus Liebig University Giessen) Richard Phillipsand Pauline Sackett (British Antarctic Survey UK) Paul Brickle (South AtlanticEnvironmental Research Institute Falkland Islands) Andreas Bange MikakoSaito Giselle Hazell and Leiv Poncet for their contributions to the fieldworkand logistics Jan Erik Arndt provided the data from the International Bathy-metric Chart of the Southern Ocean (IBCSO) Simeon Hill provided useful ad-vice to obtain krill abundance information Tobias Zimmermann for theirsupport in the development of the custom workflow in GALAXY The authorsare grateful to G Guillou from the Plateforme Analyses Isotopiques of LIENSsfor running the stable isotope analysis
Authorsrsquo contributionsJFM PQ and AB conceived and designed the study PQ JFM AB WOCS RMAG and PB were involved in securing funding for the study AB secured thenecessary logistics in Antarctica JFM AB JoB and JeB carried out thefieldwork JFM RM PB RC-C and JM-B carried out the lab work JFM PQ AKTM RM JES MNK SG and AG were involved in analyses of the data JFMdrafted the manuscript All authors provided editorial comments on a draftmanuscript and have approved the final manuscript
FundingJFM work was supported by the Deutsche Forschungsgemeinschaft (DFGGermany) in the framework of the priority programme ldquoAntarctic Researchwith comparative investigations in Arctic ice areasrdquo SPP 1158 by thefollowing grant MA 25746ndash1 Martin Wikelski (Max Planck Institute of AnimalBehaviour Radolfzell Germany) provided the earthampOcean GPS-TD data log-gers AB was supported by the grant CTM2015ndash64720-R from the SpanishAgency of Research (Spain) Diet analyses from New Island were funded by aResearch Grant (NBAF967) for lab work at the Biomolecular Analysis Facility -Sheffield (NBAF-S) Centre for Ecology amp Hydrology Natural Environment Re-search Council (NERC) UK (to WOCS RM and JFM) Funding for the oper-ation and maintenance of the local Galaxy server is provided by the GermanFederal Ministry of Education and Research (BMBF) project ldquoBielefeld-GieszligenCenter for Microbial Bioinformatics-BiGirdquo (grant 031A533) within the GermanNetwork for Bioinformatics Infrastructure (de NBI) Thanks to the CPER (Con-trat de Projet Etat-Reacutegion) and the FEDER (Fonds Europeacuteen de Deacuteveloppe-ment Reacutegional) for funding the IRMS of LIENSs laboratory The IUF (Institut
Masello et al Movement Ecology (2021) 924 Page 21 of 25
Universitaire de France) is acknowledged for its support to PB as a SeniorMember Open Access funding enabled and organized by Projekt DEAL
Availability of data and materialsThe GPS-TD and tri-axial acceleration data supporting the conclusions of thisarticle are archived in the Movebank repository (IDs 1108578788132500849549 246072457 246072308 httpswwwmovebankorg) All otherdatasets supporting the conclusions of this article are included or citedwithin the article and its Additional file 1
Declarations
Ethics approval and consent to participatePermission to work in Antarctic locations and for penguin handling wasgiven by the Spanish Polar Committee The CSIC ethical commissionapproved the field procedures Fieldwork on New Island was approved bythe Falkland Islands Government (Environmental Planning Office) throughthe Research Licence R06 2011
Consent for publicationNot applicable
Competing interestsThe authors declare that they have no competing interests
Author details1Department of Animal Ecology amp Systematics Justus Liebig UniversityGiessen Heinrich-Buff-Ring 26 D-35392 Giessen Germany 2DepartmentEcologiacutea Evolutiva Museo Nacional de Ciencias Naturales CSIC CJoseacuteGutieacuterrez Abascal 2 28006 Madrid Spain 3Centre drsquoEtudes Biologiques deChizeacute UMR7372 CNRS-Universiteacute La Rochelle 79360 Villiers en Bois France4New Zealand Penguin Initiative PO Box 6319 Dunedin 9022 New Zealand5Cardiff School of Biosciences Cardiff University The Sir Martin EvansBuilding Museum Av Cardiff CF10 3AX UK 6Cardiff School of DentistryHeath Park Cardiff CF14 4XY UK 7Institute for Bioinformatics amp SystemsBiology Justus Liebig University Giessen Heinrich-Buff-Ring 58 D-35392Giessen Germany 8Littoral Environnement et Socieacuteteacutes (LIENSs) UMR 7266CNRS-Universiteacute de La Rochelle 17000 La Rochelle France 9InstitutUniversitaire de France (IUF) 1 rue Descartes 75005 Paris France 10GLOCEE -Global Change Ecology and Evolution Group Universidad de Alcalaacute MadridSpain 11Estacioacuten Experimental de Zonas Aacuteridas CSIC Almeriacutea Spain
Received 29 October 2020 Accepted 17 March 2021
References1 Allen AM Singh NJ Linking movement ecology with wildlife management
and conservation Front Ecol Evol 20163e155 httpsdoiorg103389fevo201500155
2 Doherty TS Driscoll DA Coupling movement and landscape ecology foranimal conservation in production landscapes Proc R Soc B 2018285e20172272 httpdxdoiorg101098rspb20172272
3 Ripple WJ Wolf C Newsome TM Barnard P Moomaw WR World scientistsrsquowarning of a climate emergency BioScience 2020708ndash12 httpsdoiorg101093bioscibiz088
4 Kays R Crofoot MC Jetz W Wikelski M Terrestrial animal tracking as an eyeon life and planet Science 2015348aaa2478 httpsdoiorg101126scienceaaa2478
5 Foley JA DeFries R Asner GP Barford C Bonan G Carpenter SR et al Globalconsequences of land use Science 2005309(5734)570ndash4 httpsdoiorg101126science1111772
6 Nathan R Getz WM Revilla E Holyoak M Kadmon R Saltz D et al A movementecology paradigm for unifying organismal movement research Proc Natl Acad SciU S A 2008105(49)19052ndash9 httpsdoiorg101073pnas0800375105
7 Dugger KM Ballard G Ainley DG Lyver POB Schine C Adeacutelie penguinscoping with environmental change results from a natural experiment atthe edge of their breeding range Front Ecol Evol 20142art68 httpsdoiorg103389fevo201400068
8 Hays GC Ferreira LC Sequeira AMM Meekan MG Duarte CM Bailey H et alKey questions in marine megafauna movement ecology Trends Ecol Evol201631(6)463ndash75 httpsdoiorg101016jtree201602015
9 Loacutepez-Loacutepez P Individual-based tracking systems in ornithology welcome to theera of big data Ardeola 20166303ndash36 httpsdoiorg1013157arla6312016rp5
10 Augeacute AA Dias MP Lascelles B Baylis AMM Black A Boersma PD et alFramework for mapping key areas for marine megafauna to inform marinespatial planning the Falkland Islands case study Mar Pol 20189261ndash72httpsdoiorg101016jmarpol201802017
11 Baylis AMM Tierney M Orben RA Warwick-Evans V Wakefield E Grecian WJet al Important at-sea areas of colonial breeding marine predators on thesouthern Patagonian shelf Sci Rep 20199(1)8517 httpsdoiorg101038s41598-019-44695-1
12 Gallagher AJ Creel S Wilson RP Cooke SJ Energy landscapes and thelandscape of fear Trends Ecol Evol 201732(2)88ndash96 httpsdoiorg101016jtree201610010
13 MacArthur RH Pianka ER On the optimal use of a patchy environment AmNat 1966100(916)603ndash10 httpsdoiorg101086282454
14 Schoener TW Theory of feeding strategies Annu Rev Ecol Syst 19712(1)369ndash404 httpsdoiorg101146annureves02110171002101
15 Thorpe SKS Crompton RH Alexander RM Orangutans use compliantbranches to lower the energetic cost of locomotion Biol Lett 20073(3)253ndash6 httpsdoiorg101098rsbl20070049
16 Wilson RP Shepard ELC Liebsch N Prying into the intimate details ofanimal lives use of a daily diary on animals Endanger Species Res 2008423ndash37 httpsdoiorg103354esr00064
17 Lempidakis E Wilson RP Luckman A Metcalfe RS What can knowledge ofthe energy landscape tell us about animal movement trajectories and spaceuse A case study with humans J Theo Biol 201857101ndash11 httpsdoiorg101016jjtbi201808024
18 Gaillard J-M Hebblewhite M Loison A Fuller M Powell R Basille M et alHabitatndashperformance relationships finding the right metric at a givenspatial scale Phil Trans R Soc B 2010365(1550)2255ndash65 httpsdoiorg101098rstb20100085
19 Mosser AA Avgar T Brown GS Walker CS Fryxell JM Towards an energeticlandscape broad-scale accelerometry in woodland caribou J Anim Ecol201483(4)916ndash22 httpsdoiorg1011111365-265612187
20 Long RA Bowyer RT Porter WP Mathewson P Monteith KL Findholt SLet al Linking habitat selection to fitness-related traits in herbivores the roleof the energy landscape Oecologia 2016181(3)709ndash20 httpsdoiorg101007s00442-016-3604-7
21 Masello JF Kato A Sommerfeld J Mattern T Quillfeldt P How animalsdistribute themselves in space variable energy landscapes Front Zool 201714art33 httpsdoiorg101186s12983-017-0219-8
22 Greacutemillet D Lescroeumll A Ballard G Dugger KM Massaro M Porzig EL et alEnergetic fitness field metabolic rates assessed via 3D accelerometrycomplement conventional fitness metrics Funct Ecol 201832(5)1203ndash13httpsdoiorg1011111365-243513074
23 Wilson RP Quintana F Hobson VJ Construction of energylandscapes can clarify the movement and distribution of foraginganimals Proc R Soc B 2012279(1730)975ndash80 httpsdoiorg101098rspb20111544
24 Shepard ELC Wilson RP Rees WG Grundy E Lambertucci SA Simon BVEnergy landscapes shape animal movement ecology Am Nat 2013182(3)298ndash312 httpsdoiorg101086671257
25 Wall J Douglas-Hamilton I Vollrath F Elephants avoid costlymountaineering Curr Biol 200616527ndash9
26 Brownscombe JW Gutowsky LF Danylchuk AJ Cooke SJ Foragingbehaviour and activity of a marine benthivorous fish estimated using tri-axial accelerometer biologgers Mar Ecol Prog Ser 2014505241ndash51 httpsdoiorg103354meps10786
27 Ameacutelineau F Fort J Mathewson P Speirs D Courbin N Perret S et alEnergyscapes and prey fields shape a North Atlantic seabird winteringhotspot under climate change R Soc Open Sci 20185(1)171883 httpsdoiorg101098rsos171883
28 Convey P Peck LS Antarctic environmental change and biologicalresponses Sci Adv 20195eaaz0888 httpsdoiorg101126sciadvaaz0888
29 Hinke JT Salwicka K Trivelpiece SG Watters GM Trivelpiece WZ Divergentresponses of Pygoscelis penguins reveal a common environmental driverOecologia 2007153(4)845ndash55 httpsdoiorg101007s00442-007-0781-4
30 Handley JM Baylis AM Brickle P Pistorius P Temporal variation in the dietof gentoo penguins at the Falkland Islands Polar Biol 201639(2)283ndash96httpsdoiorg101007s00300-015-1781-1
Masello et al Movement Ecology (2021) 924 Page 22 of 25
31 Miller AK Karnovsky NJ Trivelpiece WZ Flexible foraging strategies ofgentoo penguins Pygoscelis papua over 5 years in the South ShetlandIslands Antarctica Mar Biol 2009156(12)2527ndash37 httpsdoiorg101007s00227-009-1277-z
32 Baylis AMM Zuur AF Brickle P Pistorius PA Climate as a driver ofpopulation variability in breeding Gentoo penguins Pygoscelis papua at theFalkland Islands Ibis 2012154(1)30ndash41 httpsdoiorg101111j1474-919X201101179x
33 Lynch HJ Naveen R Fagan WF Censuses of penguin blue-eyed shagPhalacrocorax atriceps and southern giant petrel Macronectes giganteuspopulations on the Antarctic Peninsula 2001ndash2007 Mar Ornithol 20083683ndash97
34 Schofield O Ducklow HW Martinson DG Meredith MP Moline MA FraserWR How do polar marine ecosystems respond to rapid climate changeScience 2010328(5985)1520ndash3 httpsdoiorg101126science1185779
35 Clucas GV Dunn MJ Dyke G Emslie SD Naveen R Polito MJ et al Areversal of fortunes climate change lsquowinnersrsquo and lsquolosersrsquo in Antarcticpeninsula penguins Sci Rep 201445024 httpsdoiorg101038srep05024
36 Fraser WR Trivelpiece WZ Ainley DG Trivelpiece SG Increases in Antarcticpenguin populations reduced competition with whales or a loss of sea icedue to environmental warming Polar Biol 199211525ndash31 httpsdoiorg101007BF00237945
37 Ainley D Ballard G Ackley S Blight LK Eastman JT Emslie SD et alParadigm lost or is top-down forcing no longer significant in the Antarcticmarine ecosystem Antarct Sci 200719(3)283ndash90 httpsdoiorg101017S095410200700051X
38 Trivelpiece WZ Hinke JT Miller AK Reiss CS Trivelpiece SG Watters GMVariability in krill biomass links harvesting and climate warming to penguinpopulation changes in Antarctica Proc Natl Acad Sci U S A 2011108(18)7625ndash8 httpsdoiorg101073pnas1016560108
39 Atkinson A Siegel V Pakhomov E Rothery P Long-term decline in krill stockand increase in salps within the Southern Ocean Nature 2004432(7013)100ndash3 httpsdoiorg101038nature02996
40 Lima M Estay S Warming effects in the western Antarctic Peninsulaecosystem the role of population dynamic models for explaining andpredicting penguin trends Popul Ecol 201355(4)557ndash65 httpsdoiorg101007s10144-013-0386-1
41 Lynch HJ Naveen R Trathan PN Fagan WF Spatially integrated assessmentreveals widespread changes in penguin populations on the AntarcticPeninsula Ecology 201293(6)1367ndash77 httpsdoiorg10189011-15881
42 McMahon KW Michelson CI Hart T McCarthy MD Patterson WP Polito MJDivergent trophic responses of sympatric penguin species to historicanthropogenic exploitation and recent climate change Proc Natl Acad SciU S A 2019116(51)25721ndash7 httpsdoiorg101073pnas1913093116
43 Barbosa A Benzal J De Leoacuten A Moreno J Population decline of chinstrap penguins(Pygoscelis antarctica) on Deception Island South Shetlands Antarctica Polar Biol201235(9)1453ndash7 httpsdoiorg101007s00300-012-1196-1
44 Naveen R Lynch HJ Forrest S Mueller T Polito M First direct site-widepenguin survey at Deception Island Antarctica suggests significant declinesin breeding chinstrap penguins Polar Biol 2012351879ndash88 httpsdoiorg101007s00300-012-1230-3
45 Gil-Delgado JA Gonzaacutelez-Soliacutes J Barbosa A Populations of breeding birds inByers Peninsula Livingston Island South Shetland Islands Antarct Sci 201325(Special Issue 02)303ndash6 httpsdoiorg101017S0954102012000752
46 Strange I Catry P Strange G Quillfeldt P New Island Falkland Islands ASouth Atlantic wildlife sanctuary for conservation management New IslandConservation Trust 2007
47 Barbosa A Merino S Benzal J Martinez J Garciacutea-Fraile S Geographicvariation in the immunoglobulin levels in pygoscelid penguins Polar Biol200730219ndash25 httpsdoiorg101007s00300-006-0175-9
48 Bannasch R Wilson R Culik B Hydrodynamic aspects of design andattachment of a back-mounted device in penguins J Exp Biol 199419483ndash96
49 Ludynia K Dehnhard N Poisbleau M Demongin L Masello JF Quillfeldt PEvaluating the impact of handling and logger attachment on foragingparameters and physiology in southern Rockhopper penguins PLoS One20127(11)e50429 httpsdoiorg101371journalpone0050429
50 Griffiths R Double M Orr K Dawson R A DNA test to sex most birds MolEcol 19987(8)1071ndash6 httpsdoiorg101046j1365-294x199800389x
51 Masello JF Mundry R Poisbleau M Demongin L Voigt CC Wikelski M et alDiving seabirds share foraging space and time within and among speciesEcosphere 20101art19 httpsdoiorg101890ES10-001031
52 Palacios MJ Valera F Colominas-Ciuroacute R Barbosa A Cellular and humoralimmunity in two highly demanding energetic life stages reproduction andmoulting in the chinstrap penguin J Ornithol 2018159(1)283ndash90 httpsdoiorg101007s10336-017-1499-7
53 Arndt JE Schenke HW Jakobsson M Nitsche FO Buys G Goleb YBet al The International Bathymetric Chart of the Southern Ocean(IBCSO) Version 10mdasha new bathymetric compilation covering circum-Antarctic waters Geophys Res Lett 2013403111ndash7 httpsdoiorg101002grl50413
54 Smith WH Sandwell DT Global Sea floor topography from satellite altimetryand ship depth soundings Science 1997277(5334)1956ndash62 httpsdoiorg101126science27753341956
55 Mattern T Ellenberg U Houston DM Davis LS Consistent foraging routesand benthic foraging behaviour in yellow-eyed penguins Mar Ecol ProgSer 2007343295ndash306 httpsdoiorg103354meps06954
56 Tremblay Y Cherel Y Benthic and pelagic dives a new foraging behaviourin rockhopper penguins Mar Ecol Prog Ser 2000204257ndash67 httpsdoiorg103354meps204257
57 Wood AG Naef-Daenzer B Prince PA Croxall JP Quantifying habitat use insatellite-tracked pelagic seabirds application of kernel estimation toalbatross location J Avian Biol 200031(3)278ndash86 httpsdoiorg101034j1600-048X2000310302x
58 Laver PN Kelly MJ A critical review of home range studies J Wildl Manag200872(1)290ndash8 httpsdoiorg1021932005-589
59 Dinno A dunntest Dunnrsquos test of multiple comparisons using rank sums Rpackage version 135 2017 httpscranr-projectorgwebpackagesdunntestindexhtml Accessed 28 Oct 2020
60 Gleiss AC Wilson RP Shepard EL Making overall dynamic body accelerationwork on the theory of acceleration as a proxy for energy expenditureMethods Ecol Evol 20112(1)23ndash33 httpsdoiorg101111j2041-210X201000057x
61 Halsey LG Shepard ELC Quintana F Goacutemez Laich A Green JA Wilson RPThe relationship between oxygen consumption and body acceleration in arange of species Comp Biochem Physiol Part A 2009152(2)197ndash202httpsdoiorg101016jcbpa200809021
62 Wilson RP Boumlrger L Holton MD Scantlebury DM Goacutemez-Laich A QuintanaF et al Estimates for energy expenditure in free-living animals usingacceleration proxies a reappraisal J Anim Ecol 202089(1)161ndash72 httpsdoiorg1011111365-265613040
63 Quintana F Wilson RP Yorio P Dive depth and plumage air in wettablebirds the extraordinary case of the imperial cormorant Mar Ecol Prog Ser2007334299ndash310 httpsdoiorg103354meps334299
64 Shepard ELC Wilson RP Quintana F Goacutemez Laich A Forman DW Pushedfor time or saving on fuel fine-scale energy budgets shed light oncurrencies in a diving bird Proc R Soc B 2009276(1670)3149ndash55 httpsdoiorg101098rspb20090683
65 Rombolaacute EF Marschoff E Coria N Inter-annual variability in chinstrappenguin diet at South Shetland and South Orkneys Islands Polar Biol 201033(6)799ndash806 httpsdoiorg101007s00300-009-0757-4
66 Hastie T gam Generalized additive models R package version 1161 2019httpsCRANR-projectorgpackage=gam Accessed 28 Oct 2020
67 Lowther AD Trathan P Tarroux A Lydersen C Kovacs KM The relationshipbetween coastal weather and foraging behaviour of chinstrap penguinsPygoscelis antarctica ICES J Mar Sci 201875(6)1940ndash8 httpsdoiorg101093icesjmsfsy061
68 Culik B Wilson R Dannfeld R Adelung D Spairani H Coria NRC Pygoscelidpenguins in a swim canal Polar Biol 199111277ndash82 httpsdoiorg101007BF00238463
69 Davis RW Croxall JP OConnell MJ The reproductive energetics ofGentoo (Pygoscelis papua) and macaroni (Eudyptes chrysolophus)penguins at South Georgia J Anim Ecol 198958(1)59ndash74 httpsdoiorg1023074986
70 Wilson RP White CR Quintana F Halsey LG Liebsch N Martin GR et alMoving towards acceleration for estimates of activity-specific metabolic ratein free-living animals the case of the cormorant J Anim Ecol 200675(5)1081ndash90 httpsdoiorg101111j1365-2656200601127x
71 Elliott KH Measurement of flying and diving metabolic rate in wild animalsreview and recommendations Comp Biochem Physiol Part A 201620263ndash77 httpsdoiorg101016jcbpa201605025
72 Heldmaier G Neuweiler G Roumlssler W Vergleichende TierphysiologieSpringer 2013
Masello et al Movement Ecology (2021) 924 Page 23 of 25
73 Takahashi A Dunn M Trathan P Croxall J Wilson RP Sato K et al Krill-feeding behaviour in a chinstrap penguin compared to fish-eating inMagellanic penguins a pilot study Mar Ornithol 20043247ndash54
74 Bost CA Handrich Y Butler PJ Fahlman A Halsey LG Woakes AJ et alChanges in dive profiles as an indicator of feeding success in king andAdelie penguins Deep-Sea Res II 200754(3-4)248ndash55 httpsdoiorg101016jdsr2200611007
75 Carroll G Slip D Jonsen I Harcourt R Supervised accelerometry analysis canidentify prey capture by penguins at sea J Exp Biol 2014217(24)4295ndash302httpsdoiorg101242jeb113076
76 Puumltz K Rey AR Huin N Schiavini A Puumltz A Luthi BH Diving characteristics ofsouthern rockhopper penguins (Eudyptes c chrysocome) in the SouthwestAtlantic Mar Biol 2006149(2)125ndash37 httpsdoiorg101007s00227-005-0179-y
77 Elliott KH Davoren GK Gaston AJ Time allocation by a deep-diving birdreflects prey type and energy gain Anim Behav 200875(4)1301ndash10 httpsdoiorg101016janbehav200709024
78 Johnston K Ver Hoef JM Krivoruchko K Lucas N Using ArcGIS geostatisticalanalyst Esri Redlands 2001
79 Bolger AM Lohse M Usadel B Trimmomatic a flexible trimmer for Illuminasequence data Bioinformatics 201430(15)2114ndash20 httpsdoiorg101093bioinformaticsbtu170
80 Magoč T Salzberg SL FLASH fast length adjustment of short reads toimprove genome assemblies Bioinformatics 201127(21)2957ndash63 httpsdoiorg101093bioinformaticsbtr507
81 Schloss PD Westcott SL Ryabin T Hall JR Hartmann M Hollister EB et alIntroducing mothur open-source platform-independent community-supportedsoftware for describing and comparing microbial communities Appl EnvironMicrobiol 200975(23)7537ndash41 httpsdoiorg101128AEM01541-09
82 Edgar RC Search and clustering orders of magnitude faster than BLASTBioinformatics 201026(19)2460ndash1 httpsdoiorg101093bioinformaticsbtq461
83 Altschul SF Gish W Miller W Myers EW Lipman DJ Basic local alignment searchtool J Mol Biol 1990215(3)403ndash10 httpsdoiorg101016S0022-2836(05)80360-2
84 Afgan E Baker D Batut B van den Beek M Bouvier D Čech M et al Thegalaxy platform for accessible reproducible and collaborative biomedicalanalyses 2018 update Nucleic Acids Res 201846(W1)W537ndashW44 httpsdoiorg101093nargky379
85 Deagle BE Kirkwood R Jarman SN Analysis of Australian fur seal diet bypyrosequencing prey DNA in faeces Mol Ecol 200918(9)2022ndash38 httpsdoiorg101111j1365-294X200904158x
86 Vesterinen EJ Lilley T Laine VN Wahlberg N Next generation sequencingof fecal DNA reveals the dietary diversity of the widespread insectivorouspredator Daubentonrsquos bat (Myotis daubentonii) in southwestern FinlandPLoS One 20138(11)e82168 httpsdoiorg101371journalpone0082168
87 Kleinschmidt B Burger C Dorsch M Nehls G Heinaumlnen S Morkūnas J et alThe diet of red-throated divers (Gavia stellata) overwintering in the GermanBight (North Sea) analysed using molecular diagnostics Mar Biol 2019166e77
88 Crisol-Martiacutenez E Moreno-Moyano LT Wormington KR Brown PH Stanley D Usingnext-generation sequencing to contrast the diet and explore pest-reduction servicesof sympatric bird species in macadamia orchards in Australia PLoS One 201611(3)e0150159 httpsdoiorg101371journalpone0150159
89 Barrett RT Camphuysen K Anker-Nilssen T Chardine JW Furness RW GartheS et al Diet studies of seabirds a review and recommendations ICES J MarSci 200764(9)1675ndash91 httpsdoiorg101093icesjmsfsm152
90 Oksanen J Blanchet FG Kindt R Legendre P Minchin PR OrsquoHara R et alvegan community ecology package R package version 20ndash2 2012 httpscranr-projectorgwebpackagesveganindexhtml Accessed 28 Oct 2020
91 Faith DP Minchin PR Belbin L Compositional dissimilarity as a robustmeasure of ecological distance Vegetatio 198769(1-3)57ndash68 httpsdoiorg101007BF00038687
92 Minchin PR An evaluation of the relative robustness of techniques forecological ordination Vegetatio 198769(1-3)89ndash107 httpsdoiorg101007BF00038690
93 Hobson KA Clark R Turnover of 13C in cellular and plasma fractions ofblood implications for nondestructive sampling in avian dietary studiesAuk 1993110(3)638ndash41 httpsdoiorg1023074088430
94 Parnell A Inger R Bearhop S Jackson AL Stable isotope analysis in R (SIAR) 2013httpcranr-projectorgwebpackagessiarindexhtml Accessed 28 Oct 2020
95 Jackson AL Inger R Parnell AC Bearhop S Comparing isotopic niche widthsamong and within communities SIBER ndash stable isotope Bayesian ellipses inR J Anim Ecol 201180(3)595ndash602 httpsdoiorg101111j1365-2656201101806x
96 Lemon J Plotrix a package in the red light district of R R-news 200668ndash1297 Layman CA Arrington DA Montantildea CG Post DM Can stable isotope ratios
provide for community-wide measures of trophic structure Ecology 200788(1)42ndash8 httpsdoiorg1018900012-9658(2007)88[42CSIRPF]20CO2
98 Davis AK Maney DL Maerz JC The use of leukocyte profiles to measurestress in vertebrates a review for ecologists Funct Ecol 200822(5)760ndash72httpsdoiorg101111j1365-2435200801467x
99 Plischke A Quillfeldt P Lubjuhn T Merino S Masello JF Leucocytes in adultburrowing parrots Cyanoliseus patagonus in the wild variation betweencontrasting breeding seasons gender and condition J Ornithol 2010151(2)347ndash54 httpsdoiorg101007s10336-009-0461-8
100 Merino S Martiacutenez J Moslashller AP Sanabria L de Lope F Peacuterez J et alPhytohaemagglutinin injection assay and physiological stress in nestlinghouse martins Anim Behav 199958(1)219ndash22 httpsdoiorg101006anbe19991127
101 Dein FJ Hematology In Harrison GJ Harrison WR editors Clinical avianmedicine and surgery W B Saunders Company 1986 p 174ndash91
102 Hawkey CM Dennet PB A colour atlas of comparative veterinaryhaematology Wolfe 1989
103 Humphries GRW Naveen R Schwaller M Che-Castaldo C McDowall PSchrimpf M et al Mapping application for penguin populations andprojected dynamics (MAPPPD) data and tools for dynamic managementand decision support Polar Rec 201753(2)160ndash6 httpsdoiorg101017S0032247417000055
104 Naveen R Forrest S Dagit R Blight L Trivelpiece W Trivelpiece S Censusesof penguin blue-eyed shag and southern giant petrel populations in theAntarctic Peninsula region 1994ndash2000 Polar Rec 200036(199)323ndash34httpsdoiorg101017S0032247400016818
105 Hucke-Gaete R Osman LP Moreno CA Torres D Examining naturalpopulation growth from near extinction the case of the Antarctic fur seal atthe South Shetlands Antarctica Polar Biol 200427(5)304ndash11 httpsdoiorg101007s00300-003-0587-8
106 Atkinson A Hill SL Pakhomov EA Siegel V Anadon R Sanae C et al KRILLBASE a circumpolar database of Antarctic krill and salp numerical densities1926-2016 Earth Sys Sci Data 20179(1)193ndash210 httpsdoiorg105194essd-9-193-2017
107 CCAMLR Krill fishery report 2018 Commission for the Conservation ofAntarctic Marine Living Resources 2018
108 Vintildeuela J Moreno J Carrascal LM Sanz JJ Amat JA Ferrer M et al Theeffect of hatching date on parental care chick growth and chick mortalityin the chinstrap penguin Pygoscelis antarctica J Zool 1996240(1)51ndash8httpsdoiorg101111j1469-79981996tb05485x
109 Lynch H Fagan W Naveen R Population trends and reproductive success ata frequently visited penguin colony on the western Antarctic PeninsulaPolar Biol 201033(4)493ndash503 httpsdoiorg101007s00300-009-0726-y
110 Dunn MJ Forcada J Jackson JA Waluda CM Nichol C Trathan PN A long-term study of gentoo penguin (Pygoscelis papua) population trends at amajor Antarctic tourist site Goudier Island Port Lockroy Biodivers Conserv201928(1)37ndash53 httpsdoiorg101007s10531-018-1635-6
111 Cairns DK The regulation of seabird colony size a hinterland model AmNat 1989134(1)141ndash6 httpsdoiorg101086284970
112 Carpenter-Kling T Handley JM Green DB Reisinger RR Makhado ABCrawford RJM et al A novel foraging strategy in gentoo penguins breedingat sub-Antarctic Marion Island Mar Biol 2017164(2)33 httpsdoiorg101007s00227-016-3066-9
113 BirdLife International IUCN red list for birds 2020 httpwwwbirdlifeorgAccessed 28 Oct 2020
114 Polito MJ Trivelpiece WZ Karnovsky NJ Ng E Patterson WP Emslie SDIntegrating stomach content and stable isotope analyses to quantify thediets of pygoscelid penguins PLoS One 20116(10)e26642 httpsdoiorg101371journalpone0026642
115 Polito MJ Trivelpiece WZ Patterson WP Karnovsky NJ Reiss CS Emslie SDContrasting specialist and generalist patterns facilitate foraging nichepartitioning in sympatric populations of Pygoscelis penguins Mar Ecol ProgSer 2015519221ndash37 httpsdoiorg103354meps11095
116 Herman RW Valls FCL Hart T Petry MV Trivelpiece WZ Polito MJ Seasonalconsistency and individual variation in foraging strategies differ among andwithin Pygoscelis penguin species in the Antarctic peninsula region MarBiol 2017164(5)115 httpsdoiorg101007s00227-017-3142-9
117 Dimitrijević D Paiva VH Ramos JA Seco J Ceia FR Chipev N et al Isotopicniches of sympatric Gentoo and chinstrap penguins evidence of
Masello et al Movement Ecology (2021) 924 Page 24 of 25
competition for Antarctic krill Polar Biol 201841(9)1655ndash69 httpsdoiorg101007s00300-018-2306-5
118 Panasiuk A Wawrzynek-Borejko J Musiał A Korczak-Abshire M Pygoscelispenguin diets on King George Island South Shetland Islands with a specialfocus on the krill Euphausia superba Antarct Sci 202032(1)21ndash8 httpsdoiorg101017S0954102019000543
119 du Toit M Bartlett P Bester M Roux J Seabird predation by individual sealsat Ichaboe Island Namibia S Afr J Wildl Res 20043445ndash54 httpshdlhandlenet10520EJC117184
120 Visser IN Drennan MP White RW MacLean SF Lagerstrom LC Francis JMAntarctic fur seals (Arctocephalus gazella) observed predating Adeacutelie(Pygoscelis adeliae) and chinstrap penguins (P antarctica) AntarcticPeninsula Aquat Mamm 200834(2)193ndash9 httpsdoiorg101578AM3422008193
121 DrsquoAmico VL Bertellotti M Benzal J Coria N Vidal V Diaz JI et al Leukocytecounts in different populations of Antarctic Pygoscelid penguins along theAntarctic Peninsula Polar Biol 201639(2)199ndash206 httpsdoiorg101007s00300-015-1771-3
122 Shepard E Cole E-L Neate A Lempidakis E Ross A Wind prevents cliff-breeding birds from accessing nests through loss of flight control eLife20198e43842 httpsdoiorg107554eLife43842
Publisherrsquos NoteSpringer Nature remains neutral with regard to jurisdictional claims inpublished maps and institutional affiliations
Masello et al Movement Ecology (2021) 924 Page 25 of 25
Abstract
Background
Methods
Results
Conclusions
Background
Methods
Study sites and species
Instrumentation and fieldwork procedures
Spatial and temporal data
Calculation of energy
Step 1 calculation of the overall dynamic body acceleration
Step 2 calculation of benthic and pelagic ODBAs
Step 3 calculation of the cost of travelling
Step 4 calculation of the cost of a dive
Step 5 integrating the cost of the actual number of dives performed
Step 6 integrating the cost of diving and commuting
Step 7 calculating the energy gained during foraging
Step 8 construction of the energy landscapes
Molecular analysis of the diet
Stable isotope analysis of the diet
Condition parameters
Additional data
Results
Foraging trips and dive parameters
Calculation of energy
Molecular analysis of the diet
Stable isotope analysis of the diet
Condition parameters
Discussion
Conclusion
Abbreviations
Supplementary Information
Acknowledgments
Authorsrsquo contributions
Funding
Availability of data and materials
Declarations
Ethics approval and consent to participate
Consent for publication
Competing interests
Author details
References
Publisherrsquos Note
The uptake of 1 l of oxygen can be converted into anenergy expenditure estimate of approximately 20 kJ [72]such that 1 ml O2min equals 0333 J sminus 1 Finally to de-rive the energy expenditure (in J kgminus 1 sminus 1) relative to thebody mass of the penguins (also called mass-specificpower MP eg [21 23]) we divided the energy expend-iture by the mean weight of the penguins (gentoos 52kg chinstraps 37 kg individuals measured in thisstudy)
MP frac14 Vo0333=BM eth4THORN
The equation in (4) allowed us to calculate the MPseparately for benthic dives (MPbenthic using benthicODBA from Step 2 in Eq 3) and pelagic dives (MPpelagicusing pelagic ODBA from Step 2 in Eq 3) for each pointin the grid around the islands used to construct the en-ergy landscapes
Step 5 integrating the cost of the actual number of divesperformedSubsequently we calculated the MP for each point ofthe marine arearsquos grid around the islands with the stud-ied breeding colonies for the number of benthic and pe-lagic dives carried out by the penguins In the case ofchinstraps we used the median number of dives per for-aging trip (MND Table 2) together with the mean diveduration (DD duration in s of the dive event Table 2)assuming a gradient of bottom depths from 3m (mini-mum depth consider a dive see the justification inSpatial and temporal data) to the maximum depth (=bathymetric depth) for benthic dives and a gradient ofbottom depths from 3m to median dive depth for pela-gic dives as follows
MPMNDpelagic frac14 DDpelagic MPpelagic 3 m deptheth THORN thornMPpelagic MND=2pPD
eth6THORN
where pBD is the mean proportion of benthic dives andpPD the mean proportion of pelagic dives (Table 2) in-cluded accounting for the proportion of benthic and pe-lagic dive in a single foraging tripIn the case of gentoos which in addition to pelagic
and benthic dives performed short and long trips andshowed a relationship between the number of dives andthe maximum distance from the colony during a for-aging trip (Additional file 1 Fig S13) we used the re-gression in Table S3 (Additional file 1) to computeMND
Step 6 integrating the cost of diving and commutingThe parameters calculated in Step 5 together with previ-ous calculations of CT (Step 4) allowed us to calculatethe total cost of foraging (TCF in J kgminus 1) as
CT is multiplied by two to account for the return tothe breeding colony
Step 7 calculating the energy gained during foragingPrevious studies on several penguin species havefound a positive relationship between bottom times(duration in s of bottom dive phase) and prey cap-ture Southern rockhoppers Eudyptes chrysocome havebeen found to maximise bottom time which in thisspecies equalled feeding time [56] chinstraps showeda positive linear relationship between bottom timeand the number of underwater beak-opening eventsduring dives and that most (86 n = 4910 events) ofbeak-openings occurred during the bottom times [73]king Aptenodytes patagonicus and Adeacutelie Pygoscelisadeliae penguins ingested prey mostly during the bot-tom phase of diving [74] and little penguin Eudyp-tula minor showed longer bottom times associatedwith dives where prey was captured [75] Thus sev-eral studies have successfully used bottom time as aproxy for prey acquisition and energy gained both inpenguins [21 76] and other seabirds [77] To buildenergy landscapes that also include the energy gainedduring foraging we calculated bottom times andminimum benthic bottom times (mBBT Table 2)The bottom times from the first foraging trip of eachindividual showed a relationship with maximum divedepth This relationship also differed between benthicand pelagic dives (GAM Additional file 1 Table S4)Again here we determined the regressions with thebest fit for the different dive types in SigmaPlot 100(Additional file 1 Table S5 Figs S14-S17) The re-gressions between bottom time and maximum divedepth (Additional file 1 Table S5) allowed us to cal-culate the sum of benthic bottom time (BBT) foreach point of the grid of the marine area around theislands with the studied breeding colonies used toconstruct the energy landscapes separately for eachspecies For pelagic bottom times (PBT) we used thecorresponding regressions (Additional file 1 Table S5)and the median dive depth per species (Table 2) Tocalculate the total bottom time (TBT in s) we tookinto account that the birds start diving close to thecolony (as also found in [21 51]) and increase divedepth while gaining distance A mean is calculatedand the mean multiplied per MND
Masello et al Movement Ecology (2021) 924 Page 8 of 25
We also included pBD and pPD here to account forthe proportion of benthic and pelagic dive in a singleforaging trip
Step 8 construction of the energy landscapesFinally dividing TCF (7) by TBT (8) we were able tocalculate the total relative cost (TRC in J kgminus 1 sminus 1)which is the mass-specific total cost of foraging (divingplus commuting) relative to the energy gained UsingTRC values calculated for the grid of the marine areaaround the islands with the breeding colonies we con-structed the energy landscape by applying the inversedistance weighted (IDW) interpolation in to the result-ing data grid As in our previous study [21] the IDWinterpolation was chosen as 1) a large set of samplevalues was available and 2) the sample data points rep-resented the minimum and maximum values in our sur-face [78] In brief the energy landscapes here presentedare based on the bathymetry of the area and the totalcost of foraging (diving plus commuting) relative to thebottom time (= energy gained in J kgminus 1 sminus 1) and takeinto account the different proportion of benthic and pe-lagic dives carried out by the penguins
Molecular analysis of the dietWe collected a total of 247 faecal samples from gentoosfrom the colony at Livingston chinstraps from the col-ony at Deception two colonies at New Island and po-tential prey samples to obtain detailed information ondiet composition (Additional file 1 Tables S6 and S7)Details on deoxyribonucleic acid (DNA) extractionprimers used polymerase chain reaction (PCR) amplifi-cations library preparations and next generation se-quencing (NGS) are provided in the Additional File 1(Table S8 and Additional Methods)We used the raw Illumina sequence data to produce a
list of molecular operational taxonomic units (MOTUs)Bioinformatics analyses included the following stepsassessing sequence quality with FASTQC (httpwwwbioinformaticsbabrahamacukprojectsfastqc) adapterand quality trimming of the paired-end reads withTRIMMOMATIC (minimum quality score of 20 over asliding window of 4 bp) [79] merging of the overlappingpaired-end read pairs using FLASH [80] transformingsequence files to FASTA with the FASTX-Toolkit(httphannonlabcshledufastx_toolkit) and extractingamplicons in MOTHUR [81] We used USEARCH [82]to remove identical replicates (dereplicate derep_full-length) to detect and to remove chimeric sequences(uchime_denovo) and to cluster sequences into molecu-lar operational taxonomic units (MOTUs) Using theBLASTn algorithm [83] we matched MOTU sequences
to reference sequences in the National Center for Bio-technology Information (NCBI) GenBank nucleotidedatabase using a cut-off of 90 minimum sequenceidentity and a maximum e-value of 000001 For the bio-informatics analyses of the samples from Antarctica wecarried out all those analyses using a custom workflowin GALAXY (httpswwwcomputationalbiouni-giessendegalaxy) [84] As next step we manually discardedMOTUs that corresponded to regular fieldwork contam-inants in faecal samples such as bacteria soil fungi hu-man or predator DNA We based taxonomic assignmenton the percentage similarity of the query and the refer-ence sequences Since short fragments are less likely tocontain reliable taxonomic information we only retainedsequences with a minimum length of 190 bp and aBLASTn assignment match greater than 98 [85 86]We assigned MOTUs to species-level in cases when allretained hits of a MOTU with the same quality criteria(sequence identity sequence length e-value) corre-sponded to the same species if not we assigned theMOTU to the lowest shared taxonomic level eg genusor family as in Kleinschmidt et al [87] We performedfurther filter steps to avoid contaminationfalse positivesand to obtain reliable data [88] as follows we acceptedMOTUs in a sample only if they contained a minimumof 10 sequences or accounted for gt 1 of the maximumtotal of hits Additionally we also discarded taxa withvery distant or ecologically irrelevant distribution ranges(eg deserts) Negative controls were included and didnot show any contaminations For each taxonomicallevel found we calculated the frequency of occurrence(FO) [89] To visualize differences in diet compositionsfor the penguin species and for adults and chicks weperformed non-metric multidimensional scaling(NMDS) with the function metaMDS in the R packageVEGAN [90] NMDS uses rank orders to collapse infor-mation from multiple dimensions into usually two-dimensions to facilitate visualization and interpretationand is generally considered as the most robust uncon-strained ordination method in community ecology [9192] The function metaMDS allowed us to investigatethe agreement between the two-dimension configurationand the original configuration through a stress param-eter If the stress is lt 005 the agreement is excellent lt01 is very good lt 02 provides a good representation Inour models the stress was always lt 004 (excellent) Weperformed permutational multivariate analysis of vari-ance using distance matrices (PERMANOVA) with thefunction adonis and checked for the multivariate homo-geneity of group dispersions (variances) with the func-tion betadisper We also used the functions ordihull andordiellipse to add convex hulls and ellipses to the NMDSplots and improve visualization To compare the dietcomposition for a certain number of sampled
Masello et al Movement Ecology (2021) 924 Page 9 of 25
individuals we additionally used species accumulationcurves (SAC) with the function specaccum in the Rpackage VEGAN [90]
Stable isotope analysis of the dietWe analysed carbon (δ13C) and nitrogen (δ15N) stableisotope ratios of red blood cells Stable isotope ratiosallowed us to compare the diet the penguins fed duringthe study period as red blood cells have a half-life of ca30 days [93] We carried out carbon and nitrogen isotopeanalyses on 065ndash075 mg sample aliquots weighed intotin cups Subsequently we determined carbon and nitro-gen isotope ratios by a mass spectrometer (Delta V Pluswith a Conflo IV interface Thermo Scientific BremenGermany) coupled to an elemental analyser (Flash 2000Thermo Scientific Milan Italy) at the LIENSs laboratoryfrom the University of La Rochelle France Replicatemeasurements of internal laboratory standards indicatedmeasurement errors lt 015 permil for δ13C and δ15N Re-sults are expressed in the δ unit notation as deviationsfrom standards (Vienna Pee Dee Belemnite for δ13C andN2 in air for δ15N) following the formula δ13C orδ15N = [(RsampleRstandard) - 1] times 103 where R is 13C12Cor 15N14N respectively Internal laboratory standards(acetanilide) were used to check accuracy Measurementerrors were lt 015permil for both δ13C and δ15NWe compared the isotopic niches of penguins using
SIAR (Stable Isotope Analyses in R) [94] and SIBER(Stable Isotope Bayesian Ellipses in R) [95] The loca-tion of the centroid (mean δ13C mean δ15N) indicateswhere the niche is centred in isotope space We useda Bayesian approach based on multivariate ellipsemetrics to calculate the Bayesian standard ellipse area(SEAb) which represents the core isotope niche widthas described by Jackson et al [95] In addition wecalculated standard ellipse areas based on MaximumLikelihood (SEA) and corrected for sample size(SEAc) We depicted ellipses using the drawellipsecommand of the R package PLOTRIX [96] with thelengths of the two semi-major axes and the angle ofthe semi-major axis of the ellipse with the x-axis asparameters To describe the spread of the data pointswe calculated parameters as described by Laymanet al [97] As proxies of intra-population trophic di-versity we also calculated the mean distance to cen-troid (CD) and the mean nearest-neighbour distance(NND) We give information on the trophic length ofthe community as the δ15N range (NR) and providean estimate of the diversity of basal resources by theδ13C range (CR) We split the data from gentoos intomale and female adults and first and second hatchedchicks but due to low samples size we were not ableto split chinstrap data
Condition parametersThe ratio of two types of leucocytes the heterophils andlymphocytes (HL ratio) has been successfully used asan indicator of physiological status and effort (high ra-tios = high stress) [98 99] Following Merino et al [100]differential leucocyte counts were carried out with alight microscope (times 1000) in parts of the blood smearswhere erythrocytes had separated in a monolayer Thesamples were crossed from down to up to minimize dif-ferences in the thickness of the blood smear Leucocyteswere counted following Dein [101] and Hawkey andDennett [102] A total of 100 leucocytes were counted ineach smear thus obtaining percentages of the differentof leucocyte types and the HL ratio
Additional dataWe obtained the location of other gentoo and chinstrappenguin colonies in the South Shetland Islands Antarc-tica from the Mapping Application for Penguin Popula-tions and Projected Dynamics [103] and Naveen et al[104] and the locations of Fur Seal Arctocephalusgazella colonies from Hucke-Gaete et al [105] Wedownloaded Antarctic Krill Euphausia superba abun-dance data for the sector between 60 and 65degS and 55ndash65degW from KRILLBASE [106] and obtained AntarcticKrill catches for the Commission for the Conservationof Antarctic Marine Living Resources (CCAMLR) Area48 from the Krill Fishery Report 2018 [107] Breedingsuccess data corresponds to the number of chicks pernest at the cregraveche and was obtained as part of ongoingprojects (Vapour Col rookery Deception [43 108] andAB unpubl Data New Island [21] and PQ unpubl Data) or from studies in the West Antarctic Peninsula regionthat followed the same methodology we used (Peter-mann Island [109] Goudier Island [110]) Other avail-able studies for the region were excluded as theirmethodology clearly differed from the one here usedDue to logistics limitations of our expedition to Antarc-tica breeding success data at Livingston could not begathered
ResultsForaging trips and dive parametersIn Antarctica both gentoos and chinstraps foraged rela-tively close to their own colonies (Fig 2) using the col-onyrsquos lsquohinterlandrsquo (sensu Cairns [111]) and henceavoided areas closer to the neighbouring colonies andthose from potential predators (Additional file 1 FigS18) and performed trips with the usual loop shape (Fig2) Gentoos from Livingston performed short (199ndash334km) and long (592ndash71 km) trips which strongly differedin both length (median short trip 271 km long trips666 km Table 1 Fig 2a) and in the extent of the coreareas and home ranges used (Fig 2b Additional file 1
Masello et al Movement Ecology (2021) 924 Page 10 of 25
Fig S19) The short trips carried out by gentoos fromLivingston were shorter than any of the trips performedby New Island birds (minimum trip 408 km) while thelong trips were similar to those carried out by New Is-land birds in 2014 (median South 887 North 591 km)
but substantially different than the much longer tripsperformed by New Island birds during 2013 (median1256 km Table 1) The trips performed by chinstrapsfrom Deception (median 377 km) were intermediate be-tween the long and short trips from gentoos from
Fig 2 Foraging trips (a) and kernel density distribution of dive locations (b) Data from gentoo penguins Pygoscelis papua breeding at DevilsPoint Byers Peninsula Livingston Island South Shetland Islands during chick guard (December 2016) and chinstrap penguins Pygoscelisantarcticus breeding at Vapour Col rookery Deception Island South Shetland Islands during chick guard (January 2017) Trip lines are colourcoded Dark grey first recorded trips red second trips yellow third trips green fourth trips pink fifth trips The 50 core areas are denoted byblack lines while 95 home ranges by yellow lines Kernels from gentoo penguins are further coded for short (dashed lines) and long trips (solidlines) Kernels from chinstrap penguins are denoted by solid lines only as no distinction between short and long trips could be found Depth (inm) is based on data from the International Bathymetric Chart of the Southern Ocean (IBCSO) [53]
Masello et al Movement Ecology (2021) 924 Page 11 of 25
Livingston (Table 1) Other related trip parameters areprovided in Table 1In Antarctica the maximum dive depth was recorded
in chinstraps (1119 m Table 2) However maximumdive depth achieved by both gentoos (1099 m) and chin-straps from Antarctica were lower than those from gen-toos from New Island (1883 m Table 2) regardless ofthe much deeper waters present in marine areas close toLivingston and Deception (up to 1000m depth Fig 2)When we considered the depth of the pelagic dives sep-arately we found that chinstraps dived less deep (me-dian 123 m) than gentoos (median long trips 154 mshort trips 149 m) This is in line with the higher pro-portion of benthic dives carried out by chinstraps (31)in comparison with gentoo long trips (26) Gentoosfrom Livingston carried out the highest number of divesper foraging trip during their long trips (median 402 di-ves) followed by the chinstraps (369 dives) During shorttrips gentoos from Livingston carried out a similarnumber of dives per foraging trip (215 dives) as the birdsfrom New Island (medians ranging from 283 to 298 di-ves Table 2)
Calculation of energyGentoos from Livingston used areas of the energy land-scape that resulted in the lowest foraging costs relativeto energy gain during foraging (up to 1376 J kgminus 1 sminus 1)avoiding areas equally distant where the costs werehigher (150 to 160 J kgminus 1 sminus 1 Fig 3a) Moreover the en-ergy landscapes in the marine areas around Livingston(Fig 3a) implied much lower costs than those aroundNew Island (up to 232 J kgminus 1 sminus 1 Additional file 1 FigsS20 to S22) During short trips gentoos from Livingstonincurred in foraging costs per bottom time gain with amedian value of 1152 J kgminus 1 sminus 1 (949 to 1367 Fig 4a)The median foraging cost per bottom time gain duringthe long trips performed by gentoos from Livingstonwas 1305 J kgminus 1 sminus 1 (953 to 1376 Fig 4b) In the caseof New Island gentoos incurred in variable foragingcosts per bottom time gain 1) South End colony 20131671 (1061 to 2320 Fig 4d) 2) South End 2014 1127(787 to 1831 Fig 4e) 3) North End 2014 990 (829 to1519 Fig 4f) (medians and ranges in J kgminus 1 sminus 1) In thisway the foraging costs per bottom time gain of the shorttrips were lower than those of the long trips while thosefrom New Island South 2013 were the highest and thosefrom New Island North End 2014 the lowest (Kruskal-Wallis χ2 = 23852 df = 5 P lt 0001 pairwise analysesin Additional file 1 Table S9)Chinstraps used marine areas around Deception where
the foraging costs per bottom time gain were below 105 Jkgminus 1 sminus 1 (median 965 range 808 to 1037 Figs 3b and4c) Chinstraps incurred significantly lower foraging costsper bottom time gain than the gentoos from Livingston
(up to 1376 J kgminus 1 sminus 1) or those from New Island South2013 and 2014 (up to 232) but similar to those from NewIsland North 2014 (up to 1519) (pairwise Kruskal-Wallisrank sum test in Additional file 1 Table S9 all P-values lt0001 except for New Island North P = 0364)
Molecular analysis of the dietGentoos from Livingston (Antarctica) and from New Is-land (sub-Antarctic) consumed different prey with thebirds from Antarctica consuming a less diverse diet(Table 3 Additional file 1 Table S10) When consider-ing the quantitative data from Antarctic penguins wefound that chinstraps had a more restricted diet thangentoos preying mainly on Antarctic Krill while gentoosfrom Antarctica in addition to Antarctic Krill includedfish more frequently (NMDS F601 = 37 P lt 0023 wherethe species explained 6 of the overall variation R2 =0059 Table 3 Additional file 1 Fig S23) When consid-ering age in our analyses we found that the diet com-position differed among the groups (adult gentoo chickgentoo adult chinstrap chick chinstrap F603 = 22 P =0028 R2 = 010 Additional file 1 Fig S24) Gentoochicks had a slightly richer diet composition than adultsas they were fed more frequently with fish (Fig 5aTable 3) In chinstraps chicks were fed more frequentlywith Thysanoessa macrura which is taken only very oc-casionally in adults and adults had a richer diet compos-ition by consuming occasionally some fish (Fig 5bTable 3) However permutation tests were not signifi-cant when gentoos (F241 = 14 P = 0203 R2 = 0059) orchinstraps (F351 = 11 P = 0254 R2 = 0032) were ana-lysed apart (Additional file 1 Figs S25 S26)
Stable isotope analysis of the dietMean isotope values differed among the Antarcticpenguin groups (Kruskal Wallis ANOVA for δ13Cχ2 = 351 df = 5 P lt 0001 for δ15N χ2 = 469 df =5 P lt 0001 Fig 5c Additional file 1 Table S11) Ingentoos the differences in δ13C signature were relatedto higher values in adult males than in chicks (Fig5c Additional file 1 Table S11) indicating a morebenthic diet for adults as also shown by the analysesof dive parameters in Table 2 Gentoos had also sig-nificantly higher δ13C than chinstraps (Fig 5c Add-itional file 1 Table S11) indicating again a morebenthic diet for gentoos in line with the significantdifferences in dive parameters (Table 2) In the caseof δ15N the differences among the groups were re-lated to higher values in chinstrap adults than in theirchicks (Fig 5c Additional file 1 Table S11) which isin line with the observation that chinstrap chickswere only fed with Euphausiacea (Table 3 Additionalfile 1 Fig S26) All niche metrics (Fig 5c Additionalfile 1 Table S11) were larger in gentoos than in
Masello et al Movement Ecology (2021) 924 Page 12 of 25
chinstraps indicating a higher variability in the feed-ing ecology among gentoos as also suggested by thedetected prey and their frequency of occurrence(Table 3) and the diet composition obtained usingNMDS (Additional file 1 Fig S23) Within speciesgentoo males and chicks had larger niche metricsthan females while no differences were observed be-tween first and second chicks and between chinstrap
adults and chicks (Additional file 1 Table S11) Add-itionally niche metrics from the gentoos from Ant-arctica (Additional file 1 Table S11) were mostlylarger than those from the previously studied gentoosfrom New Island except in the case of New IslandSouth during December 2013 to which they weresimilar (Additional file 1 Table S12 Masello et al2017)
Fig 3 Gentoo and chinstrap penguin energy landscapes Energy landscapes based on the bathymetry around Livingston Island South ShetlandIslands and the mass-specific total cost of foraging (diving plus commuting) by gentoo penguins Pygoscelis papua (a) and chinstrap penguinsPygoscelis antarcticus (b) relative to the bottom time (in J kgminus1 sminus1) considering the different proportion of benthic and pelagic dives carried outby the penguins The energy landscape categories have been defined to make them easy comparable with the ones used for gentoo penguinsfrom New Island FalklandMalvinas Islands in [21] The colony is marked by a triangle The location of the dives performed by the tracked birds isplotted in semi-transparent black circles for those corresponding to gentoo short trips and in white circles for those corresponding to gentoolong trips and semi-transparent black circles for chinstraps
Masello et al Movement Ecology (2021) 924 Page 13 of 25
Condition parametersComparisons of the HL ratios revealed no differencesbetween gentoos from New Island (sub-Antarctic mean27 plusmn 14) and those from Livingston (Antarctica 28 plusmn13 t = 0213 df = 204 P = 0834) However the meanHL ratios of the gentoos from Livingston (28 plusmn 13)were higher than those measured in chinstraps (13 plusmn07 Wilcoxon rank sum test with continuity correctionW = 47 P lt 0001 Additional file 1 Fig S27)
DiscussionUsing the energy landscape paradigm (sensu Wilsonet al [23]) we tested hypotheses on the energetic bal-ance between costs and benefits the foraging areas se-lected and the differences between different populationsand different species As predicted by our first hypoth-esis (a) we showed that gentoos from Livingston (Ant-arctica lsquooptimalrsquo site positive population trends) foragedin sectors of the energy landscape where low foragingcosts relative to energy gain were required (up to 1376 J
kgminus 1 sminus 1 Fig 3a) Also as predicted in our hypothesiscomparing different gentoo populations (b) we foundthat the birds breeding at New Island (FalklandMalvinasIslands lsquosuboptimalrsquo site fluctuating populations) [32]were forced to forage in more expensive sectors of theenergy landscape during poor conditions (Fig 4d Add-itional file 1 Figs S20-S22) than those from LivingstonIn the year of poor prey availability at New Island (2013)[21] the median foraging costs relative to energy gainduring foraging was 1671 J kgminus 1 sminus 1 and reached valuesup to 232 due to very long trips (90ndash160 km) and dee-per diving (up to 188 m Tables 1 and 2) During highprey availability at New Island (2014) [21] intermediatevalues of foraging costs relative to energy gain duringforaging (1127 J kgminus 1 sminus 1) were observed and were com-parable to those in gentoos from Livingston (1152 J kgminus 1
sminus 1) The maximum foraging costs relative to energygain at Livingston were merely 56 of those observed atNew Island Moreover gentoos from Livingston foragedover shorter distances closer to the colony for less time
Fig 4 Frequencies of foraging costs per bottom time gain Data are shown in J kg-1 s-1 for short (a) and long trips (b) carried out by gentoopenguins Pygoscelis papua breeding at Devils Point Byers Peninsula Livingston Island South Shetland Islands during chick guard (December2016) chinstrap penguins Pygoscelis antarcticus (c) breeding at Vapour Col rookery Deception Island South Shetland Islands during chick guard(January 2017) and for gentoo penguins breeding on New Island Falkland Malvinas Islands at the South End colony during the 2013 breedingseason (d) at the North End colony during 2014 (e) and at the South End colony during 2014 (f)
Masello et al Movement Ecology (2021) 924 Page 14 of 25
Table 3 Detected prey and their frequency of occurrence in scat samplesTaxa Gentoo Chinstrap
Dec 2013 Dec 2014 Dec 2016 Jan 2017
New I South New I South New I North Livingston I Deception I
Adults Firstchicks
Secondchicks
Unk All a All a Adult()
Firstchicks ()
Secondchicks ()
Adults()
Firstchicks ()
Secondchicks ()
n = 17(17)
n = 24(19)
n = 15(14)
n = 17(14)
n = 32(31)
n = 29(29)
n = 36(16)
n = 11(6)
n = 5(3)
n = 19(18)
n = 23(10)
n = 23(8)
Arthropoda Crustacea Malacostraca
Amphipoda Hyperiidae
Themisto sp ndash ndash ndash D D D ndash ndash ndash ndash ndash ndash
Decapoda
Pandalidae (shrimps)
Pandalus sp ndash ndash ndash D D D ndash ndash ndash ndash ndash ndash
Galatheidae
Munida gregarialobster krill
ndash ndash ndash D D D ndash ndash ndash ndash ndash ndash
Masello et al Movement Ecology (2021) 924 Page 15 of 25
and dived less deep for shorter times than those fromNew Island (Tables 1 and 2) In a previous study [21]we showed that when the energy landscape was charac-terized by lower foraging costs per energy gain (2014)the breeding success was high (129 chicks per nest)while during a year of high foraging costs (2013) breed-ing success was low (086 see also Additional file 1Table S13) Moreover published records of breeding suc-cess in gentoos show a remarkable pattern on the WestAntarctic Peninsula 84 of records (16 of 19) fall above themark of one (1) chick per nest while on New Island thishappens only in 40 (2 of 5) of the years suggesting a gen-erally better breeding success for Antarctic gentoos irre-spective of naturally occurring inter-annual oscillations(Fig 6) [21 109 110] All things considered the aboveresults are in line with our previous findings linkingenergy gain and variable energy costs of foraging tobreeding success [21] and suggest that the lower for-aging costs incurred by the gentoos from the Antarc-tic Peninsula could favour a higher breeding successthat in turn would explain the positive populationtrend of the species in the region offering a plausible
link between energy requirements and population dy-namics (see also [20] and references therein)A recent study [112] found that gentoos at sub-
Antarctic Marion Island alternated trips of relativelyshort and long durations with short trips likely associ-ated to self-maintenance and longer trips associated tochick provisioning Carpenter-Kling et al [112] postu-lated that gentoos may be using this strategy of alternateshort and long trips as a result of suboptimal feedingconditions related to environmental change Howeverwe did not find this behaviour at New Island a lsquosubopti-malrsquo site (Masello et al 2010 2017) while we found thatgentoos performed short (20 to 33 km) and long trips(59 to 71 km) at Livingston an lsquooptimalrsquo site (Tables 1and 2 Fig 3a) Median dive depths and numbers of di-ves per trip were comparable (Additional file 1 Fig S28)and thus the swim distance had a major influence onthe foraging costs relative to energy gain An alternativeexplanation for this foraging behaviour could be that itallows gentoos to use the areas of the energy landscapethat resulted in lower foraging costs which show a bi-modal distribution around the colony at Livingston
Table 3 Detected prey and their frequency of occurrence in scat samples (Continued)Taxa Gentoo Chinstrap
Dec 2013 Dec 2014 Dec 2016 Jan 2017
New I South New I South New I North Livingston I Deception I
Agonidae (alligatorfishes) D D D D D D ndash ndash ndash ndash ndash ndash
Psychrolutidae (blobfishes)
Psychrolutes sp D D ndash D D ndash ndash ndash ndash ndash ndash ndash
Data correspond to gentoo penguins Pygoscelis papua breeding at New Island FalklandMalvinas Islands during chick guard (December) in 2013 and 2014gentoo penguins breeding at Devils Point Byers Peninsula Livingston Island South Shetland Islands Antarctica during chick guard (December 2016) andchinstrap penguins Pygoscelis antarcticus breeding at Vapour Col rookery Deception Island South Shetland Islands Antarctica during chick guard (January 2017)Sample sizes 1) n = number of DNA extractions from scat samples and 2) in brackets the number of successfully amplified samples Unk age unknown samplesobtained at the colony First chicks first hatched chick Second chicks second hatched chick a Samples from 2014 were not split by age group due to smallsample sizes in most of the know age categories (see Additional file 1 Table S6) Samples from New Island are pooled (see Additional file 1 Additional MethodsMolecular analysis of the diet) and thus frequency of occurrence cannot be calculated Instead prey species detected are denoted with lsquoDrsquo Best blast results foreach detected taxa and corresponding accession number the identity with the blast reference sequence the sequence length and the bitscore are provided inAdditional file 1 Table S10
Masello et al Movement Ecology (2021) 924 Page 16 of 25
(green areas in Fig 3a) Also in this case the energylandscape paradigm offers a plausible explanation for aparticular animal behaviourOur results do not support our hypothesis that
chinstraps should show higher energy expenditurethan Antarctic gentoos (between-species differences inenergy expenditure hypothesis d) Contrary to ourexpectations based on long-term population trendschinstraps actually incurred lower foraging costs perbottom time gain than the gentoos from Livingston(Figs 3a b and 4 a-c) However our results suggestalso in this case a link between energy landscapesand breeding success 148 chicks per nest reachedthe cregraveche stage in chinstraps at Deception duringthe studied season (AB unpubl data) and this valuewas higher than most records for gentoos in the re-gion (Fig 6) The lower foraging costs per energygain experienced by the chinstraps from Deceptionduring this study could have allowed them to achievea higher breeding success regardless of the long-termpopulation trend [109] but see [113] suggesting thatthe driver of population decline in this species doesnot operate during the breeding season [43]
Another pattern arose from the foraging behaviourof Deception chinstraps At that island chinstrapsbreed in eight different colonies where up to 62500pairs breed (Additional file 1 Fig S18) [44 104] Allbut one of the trips performed by chinstraps fromVapour Col rookery occurred outside the lsquohinterlandrsquo(sensu Cairns [111]) of the other colonies of this spe-cies located on Deception suggesting a potentialavoidance of those areas (Additional file 1 Fig S18)Lima amp Estay [40] found that the population dynam-ics of chinstraps at the nearby King George Island isparticularly regulated by intra-specific competitionand the combined effects of Antarctic krill abundanceand sea-ice cover Our results appear to support thisview As previously found [65 114ndash118] both ourmolecular and isotopic analyses showed that chin-straps particularly their chicks had a more restricteddiet than gentoos (Tables 3 and 4 Figs 5a c Add-itional file 1 Fig S23) Thus in the case of chin-straps intra-specific competition the narrow foragingniche (Fig 5c) and declining Antarctic krill abun-dances (Additional file 1 Fig S29) [38] could explainthe population trends of the species [35 44]
Fig 5 Prey consumed by the penguins a shows the species accumulation curves corresponding to the prey consumed by adult and chickgentoo penguins Pygoscelis papua from the colony at Devils Point Byers Peninsula Livingston Island South Shetland Islands during chick guard(December 2016) and b by adult and chick chinstrap penguins Pygoscelis antarcticus breeding at Vapour Col rookery Deception Island SouthShetland Islands during chick guard (January 2017) c illustrates the isotopic niches based on δ13C and δ15N Values were measured in red bloodcells of adult and chick gentoo penguins from the colony at Devils Point and of adult and chick chinstrap penguins Pygoscelis antarcticusbreeding at Vapour Col rookery
Masello et al Movement Ecology (2021) 924 Page 17 of 25
In a previous study on gentoos [21] we showed theimportance of nonlethal effects of predation as a way ofbetter understanding animal movement Several speciesof pinnipeds prey on penguins [119 120] including Ant-arctic fur seals Arctocephalus gazella Weddell seals Lep-tonychotes weddellii and leopard seal Hydrurga leptonyxAntarctic fur seals have been observed patrolling thegentoo colony at Livingston Weddell Seals have beenfound in the vicinity of this colony and leopard sealssuccessfully predated chinstraps during our fieldwork(JFM AB pers observ) Furthermore Antarctic fur seals
breed in a large colony located close to the studied gen-too colony at Livingston (Additional file 1 Fig S18)Still in this study we were not able to detect noticeablesigns of active avoidance of particular areas in relation-ship to potential predators as we previously observedfor the gentoos from New Island [21 51] One explan-ation for this could be related to another large gentoocolony located at Barclay Bay halfway between our stud-ied colony and the large Antarctic fur seal colony onCape Shirreff and San Telmo Islets Livingston (Add-itional file 1 Fig S18) [45 105] The foraging trips per-formed by gentoos from Livingston could have avoidedthe lsquohinterlandrsquo of their conspecific large colony at Bar-clay Bay (and potentially three chinstrap colonies alsopresent in this location) avoiding at the same time theAntarctic fur seal colony located further to the east(Additional file 1 Fig S18) However foraging data fromthe gentoos at Barclay Bay would be needed to ascertainthis interpretationCurrent environmental changes in the Antarctic Pen-
insula [28] could affect animal physiological condition[99] But individuals may buffer challenging externalconditions by behaviourally adjusting their exposure tocosts and supplies of energy [20] Moreover Greacutemilletet al [22] demonstrated in Adeacutelie penguins Pygoscelisadeliae a relationship between individual condition andthe rates of energy expenditure As challenging environ-mental conditions could lead to greater energy expend-iture and reduced individual condition [21 98] and alink between energetics individual condition and fitnesshas long been postulated (reviewed in [22]) we investi-gated physiological condition in our deployed penguinsWe expected that foraging in areas of the energy land-scapes with low energetic costs would lead to better in-dividual condition (hypothesis c) Concerning
Fig 6 Gentoo and chinstrap penguin breeding success Datacorrespond to the number of chicks per nest recorded at cregraveche forthe chinstrap penguins Pygoscelis antarcticus breeding at Vapour Colrookery Deception Island South Shetland Islands gentoo penguinsPygoscelis papua from New Island FalklandMalvinas Islands andPetermann Island [109] and Goudier Island [110] in the WestAntarctic Peninsula The horizontal black line marks the value of one(1) chick per nest
Table 4 Diet and isotopic niche metrics
Gentoo female adults Gentoo male adults Gentoo first chicks Gentoo second chicks Chinstrap adults Chinstrap chicks
N 10 15 24 24 6 11
δ13C -2512plusmn049ab -2484plusmn040 a -2543plusmn054 bc -2548plusmn053bc -2598plusmn015 cd -2656plusmn009 d
δ15N 826plusmn041a 848plusmn065 a 813plusmn064 a 815plusmn066 a 798plusmn010 ab 736plusmn017 b
SEA 048 074 072 075 004 005
SEAc 055 080 075 078 005 006
SEAb 051 072 074 077 004 005
NR 165 245 224 264 031 058
CR 148 162 171 200 039 034
CD 055 062 070 070 017 017
NND 033 029 016 020 012 010
Data correspond to gentoo penguins Pygoscelis papua breeding at Devils Point Byers Peninsula Livingston Island South Shetland Islands Antarctica during chickguard (December 2016) and chinstrap penguins Pygoscelis antarcticus breeding at Vapour Col rookery Deception Island South Shetland Islands Antarctica duringchick guard (January 2017)Dunn tests were used for pairwise comparisons and homogenous subsets are marked with superscript letters SEA area of the standard ellipse (isotope nichewidth) SEAc as SEA corrected for sample size SEAb Bayesian standard ellipse area NR trophic length (range in δ15N) CR diversity of basal resources (range inδ13C) CD niche width 2 (mean distance to centroid) NND mean nearest neighbour distance
Masello et al Movement Ecology (2021) 924 Page 18 of 25
populations we found no differences in HL ratios be-tween gentoos from Livingston (lsquooptimalrsquo site) and NewIsland (lsquosuboptimalrsquo) however this probably happenedbecause the samples from New Island were taken duringthe favourable conditions of 2014 (see also Additionalfile 1 Table S13) [21] Unfortunately samples from NewIsland during the unfavourable year 2013 were not avail-able leaving this a matter for future investigations Butin support of our hypothesis the HL ratios of the chin-straps were lower than those measured in gentoos fromLivingston (Additional file 1 Fig S27) suggesting thatforaging in areas of the energy landscapes that result inminimised energetic costs (Figs 3b 4c) could lead tolower physiological stress and better individual condi-tion which could help to achieve a higher breeding suc-cess as in chinstraps during our study (Fig 6) HigherHL ratios values in gentoos compared to chinstrapshave been found in several populations of both speciesalong the Antarctic Peninsula [47 121] supporting ourinterpretation of our results However other factors thatcan affect HL ratios such as the presence of parasitesandor pathogens could also explain differences betweenthe speciesTo make the current study fully comparable with our
previous work on penguins [21] we followed the ap-proach of Wilson et al [23] to energy landscapes How-ever more recently the definition of the energylandscape has expanded to include the effect of mediaflow on movement costs [12 122] Water current flowcould have an effect on the energetic cost of penguinscommuting to and from the foraging sites and shouldnot be overlooked in future research
ConclusionWe applied energy landscapes to compare the foragingof penguins from colonies with different populationtrends At all sites penguins foraged in sectors of the en-ergy landscape where low energy was required Howeverwhen conditions were poorer the birds were forced toforage in more expensive parts of the energy landscapeOur results also showed that lower foraging costs mayfavour a higher breeding success that would explain thepositive population trend by the gentoo penguins fromLivingston in the Antarctic Peninsula and the higherbreeding success in chinstraps from Deception com-pared to gentoos Foraging in areas of the energy land-scapes that result in minimised energetic costs wasassociated with lower physiological stress and higherbreeding success The energy landscape approach mayhelp to improve our understanding of the relationshipbetween energy requirements individual condition andbreeding success and thus between animal movementand complex ecological processes
AbbreviationsANOVA Analysis of variance BBT Sum of benthic bottom time BM Meanadult body mass in kg CCAMLR Commission for the Conservation ofAntarctic Marine Living Resources CD Mean distance to centroid CR δ13Crange CT Cost of travelling DD Mean dive duration DDbenthic Mean diveduration for benthic dives DDpelagic Mean dive duration for pelagic divesDNA Deoxyribonucleic acid ENSO El Nintildeo Southern OscillationFO Frequency of occurrence GPS-TD Global Positioning System-temperature-depth HL Heterophils and lymphocytes ratioIBCSO International Bathymetric Chart of the Southern Ocean IDZ Intra-depth zone IDW Inverse distance weighted interpolation mBBT Minimumbenthic bottom times MND Median number of dives per foraging tripMNDbenthic Median number of benthic dives per foraging tripMNDpelagic Median number of pelagic dives per foraging tripMOTUs Molecular operational taxonomic units MP Mass-specific powerMPbenthic Mass-specific power for benthic dives MPpelagic Mass-specificpower for pelagic dives NASA National Aeronautics and SpaceAdministration NCBI National Center for Biotechnology InformationNE North End colony NGS Next generation sequencing NMDS Non-metricmultidimensional scaling NND Mean nearest-neighbour distance NR δ15Nrange ODBA Overall Dynamic Body Acceleration pBD Mean proportion ofbenthic dives PBT Pelagic bottom times PCR Polymerase chain reactionPERMANOVA Permutational multivariate analysis of variance using distancematrices pPD Mean proportion of pelagic dives SAC Species accumulationcurves SE South End colony SEA Standard ellipse areas SEAb Bayesianstandard ellipse area SEAc Standard ellipse areas corrected for sample sizeSIAR Stable Isotope Analyses in R SIBER Stable Isotope Bayesian Ellipses in RSOI Southern Oscillation Index TBT Total bottom time TCF Total cost offoraging TRC Total relative cost TT Travel time Vo Rate of oxygenconsumption
Supplementary InformationThe online version contains supplementary material available at httpsdoiorg101186s40462-021-00255-9
Additional file 1 Table S1 Results of a General Additive Model (GAM)investigating the sum of Overall Dynamic Body Acceleration (ODBA)during dive as a function of maximum dive depth with the intra-depthzone (IDZ foraging dives performed by the individuals split in benthicand pelagic) as factor Gentoo penguins Pygoscelis papua were breedingat Devils Point Byers Peninsula Livingston Island South Shetland IslandsAntarctica while chinstrap penguins Pygoscelis antarcticus were breedingat Vapour Col rookery Deception Island South Shetland Islands Antarc-tica Data was obtained during chick guard Table S2 The relationshipbetween the sum of Overall Dynamic Body Acceleration (ODBA) duringdive and maximum dive depth for benthic and pelagic dives (based onthe index of benthic diving behaviour intra-depth zone IDZ) Gentoopenguins Pygoscelis papua were breeding at Devils Point Byers PeninsulaLivingston Island South Shetland Islands Antarctica while chinstrap pen-guins Pygoscelis antarcticus were breeding at Vapour Col rookery Decep-tion Island South Shetland Islands Antarctica Data was obtained duringchick guard Table S3 The relationship between the number of divesper trip and the maximum distance from the colony during a foragingtrip carried out by gentoo penguin Pygoscelis papua breeding at DevilsPoint Byers Peninsula Livingston Island South Shetland Islands Antarc-tica (chick guard December 2016) See also Figure S11 Table S4 Re-sults of a General Additive Model (GAM) investigating the bottom time asa function of event maximum depth (maximum depth [m] reached dur-ing dive event) with the intra-depth zone (IDZ foraging dives performedby the individuals split in benthic and pelagic) as factor Gentoo pen-guins Pygoscelis papua were breeding at Devils Point Byers Peninsula Liv-ingston Island South Shetland Islands Antarctica while chinstrappenguins Pygoscelis antarcticus were breeding at Vapour Col rookery De-ception Island South Shetland Islands Antarctica Data was obtained dur-ing chick guard Table S5 The relationship between bottom time andevent maximum depth for benthic and pelagic dives (based on the indexof benthic diving behaviour intra-depth zone IDZ) Gentoo penguinsPygoscelis papua were breeding at Devils Point Byers Peninsula Living-ston Island South Shetland Islands Antarctica while chinstrap penguins
Masello et al Movement Ecology (2021) 924 Page 19 of 25
Pygoscelis antarcticus were breeding at Vapour Col rookery Deception Is-land South Shetland Islands Antarctica Data was obtained during chickguard Table S6 The number of DNA extractions from scat samples ofgentoo penguins Pygoscelis papua breeding at New Island FalklandMal-vinas Islands during chick guard (December) in 2013 and 2014 gentoopenguins breeding at Byers Peninsula Livingston Island Antarctica dur-ing chick guard (December 2016) and chinstrap penguins Pygoscelis ant-arcticus breeding at Vapour Col rookery Deception Island South ShetlandIslands Antarctica during chick guard (January 2017) Table S7 Controlsamples for the molecular detection of prey in scat samples from thestudied penguins Table S8 List of primers used in this study for the de-tection of prey species in scat samples from gentoo penguins Pygoscelispapua and chinstrap penguins Pygoscelis antarcticus Table S9 Compari-son of total foraging costs per bottom time gain (J kgminus 1 sminus 1) usingKruskal-Wallis rank sum test The groups tested correspond to gentoopenguins Pygoscelis papua breeding at New Island FalklandMalvinasIslands during chick guard (December) in 2013 and 2014 gentoo pen-guins breeding at Devils Point Byers Peninsula Livingston Island SouthShetland Islands Antarctica during chick guard (December 2016) andchinstrap penguins Pygoscelis antarcticus breeding at Vapour Col rookeryDeception Island South Shetland Islands Antarctica during chick guard(January 2017) Table S10 Best blast results for each detected taxa andcorresponding accession number the identity with the blast reference se-quence the sequence length and the bitscore from gentoo penguinsPygoscelis papua breeding at New Island FalklandMalvinas Islands dur-ing chick guard (December) in 2013 and 2014 gentoo penguins breedingat Devils Point Byers Peninsula Livingston Island South Shetland IslandsAntarctica during chick guard (December 2016) and chinstrap penguinsPygoscelis antarcticus breeding at Vapour Col rookery Deception IslandSouth Shetland Islands Antarctica during chick guard (January 2017)Table S11 Diet and isotopic niche metrics Data correspond to gentoopenguins Pygoscelis papua breeding at Devils Point Byers Peninsula Liv-ingston Island South Shetland Islands Antarctica during chick guard (De-cember 2016) and chinstrap penguins Pygoscelis antarcticus breeding atVapour Col rookery Deception Island South Shetland Islands Antarcticaduring chick guard (January 2017) Table S12 Isotopic niche metrics ofgentoo penguins Pygoscelis papua breeding at New Island FalklandMal-vinas Islands during chick guard (December) in 2013 and 2014 Parame-ters are based on carbon (δ13C) and nitrogen (δ15N) stable isotopes ofchick feather samples as a marker of breeding season foraging ecologyfrom two colonies at New Island and two breeding seasons calculatedwith the SIAR package SE South End colony NE North End colony Forfurther details see Masello et al (2017) Table S13 Gentoo penguinsPygoscelis papua breeding success at New Island FalklandMalvinasIslands The number of chicks corresponds to cregraveche stage For furtherdetails on the colonies see Masello et al (2010 2017) Figure S1 The dis-tribution of dive depth data during benthic (A) and pelagic (B) foragingdives by gentoo penguin Pygoscelis papua breeding at Devils Point ByersPeninsula Livingston Island South Shetland Islands Antarctica duringchick guard (December 2016) Benthic and pelagic dives are defined withthe use of the index of benthic diving behaviour intra-depth zone (IDZ)Figure S2 The distribution of dive depth data during benthic (A) andpelagic (B) foraging dives by chinstrap penguins Pygoscelis antarcticusbreeding at Vapour Col rookery Deception Island South Shetland IslandsAntarctica during chick guard (January 2017) Benthic and pelagic divesare defined with the use of the index of benthic diving behaviour intra-depth zone (IDZ) Figure S3 Example of the distribution in differentdepths of benthic (A) and pelagic (B) dives carried out by gentoo pen-guin Pygoscelis papua breeding at Devils Point Byers Peninsula Living-ston Island South Shetland Islands Antarctica during chick guard(December 2016) Depth (in m) is based on data from the InternationalBathymetric Chart of the Southern Ocean (IBCSO Arndt et al 2013) Fig-ure S4 Example of the distribution in different depths of benthic (A) andpelagic (B) dives carried out by chinstrap penguins Pygoscelis antarcticusbreeding at Vapour Col rookery Deception Island South Shetland IslandsAntarctica during chick guard (January 2017) Depth (in m) is based ondata from the International Bathymetric Chart of the Southern Ocean(IBCSO Arndt et al 2013) Figure S5 Foraging trips by female (red bur-gundy) and male (yellow) gentoo penguins Pygoscelis papua breeding atDevils Point Byers Peninsula Livingston Island South Shetland Islands
Antarctica during chick guard (December 2016) (A) and chinstrap pen-guins Pygoscelis antarcticus breeding at Vapour Col rookery Deception Is-land South Shetland Islands Antarctica during chick guard (January2017) (B) Depth (m) is based on data from the International BathymetricChart of the Southern Ocean (IBCSO Arndt et al 2013) Figure S6 Ex-ample of dive profiles and tri-axial acceleration data during three con-secutive dives by gentoo penguins Pygoscelis papua breeding at DevilsPoint Byers Peninsula Livingston Island South Shetland Islands Antarc-tica during chick guard (December 2016) Acceleration data correspondto each of the three spatial axes x surge (green) y heave (red) and zsway (blue) Dive depth is given in metres and 0 (zero) corresponds tothe water surface Figure S7 The distribution of foraging parameter dataused for the calculations of energy landscapes in gentoo penguins Pygos-celis papua breeding at Devils Point Byers Peninsula Livingston IslandSouth Shetland Islands Antarctica during chick guard (December 2016)See also Table 1 Figure S8 The distribution of foraging parameter dataused for the calculations of energy landscapes in chinstrap penguinsPygoscelis antarcticus breeding at Vapour Col rookery Deception IslandSouth Shetland Islands Antarctica during chick guard (January 2017) Seealso Table 1 Figure S9 The relationship between the sum of Overall Dy-namic Body Acceleration (ODBA) during dive and maximum dive depthfor benthic dives (based on the index of benthic diving behaviour intra-depth zone IDZ) carried out by gentoo penguin Pygoscelis papua breed-ing at Devils Point Byers Peninsula Livingston Island Antarctica duringchick guard (December 2016) Details for the regression curve are givenin Table S2 Figure S10 The relationship between the sum of OverallDynamic Body Acceleration (ODBA) during dive and maximum divedepth for pelagic dives (based on the index of benthic diving behaviourintra-depth zone IDZ) carried out by gentoo penguin Pygoscelis papuabreeding at Byers Peninsula Livingston Island Antarctica during chickguard (December 2016) Details for the regression curve are given inTable S2 Figure S11 The relationship between the sum of Overall Dy-namic Body Acceleration (ODBA) during dive and maximum dive depthfor benthic dives (based on the index of benthic diving behaviour intra-depth zone IDZ) carried out by chinstrap penguins Pygoscelis antarcticusbreeding at Vapour Col rookery Deception Island South Shetland IslandsAntarctica during chick guard (January 2017) Details for the regressioncurve are given in Table S2 Figure S12 The relationship between thesum of Overall Dynamic Body Acceleration (ODBA) during dive and max-imum dive depth for pelagic dives (based on the index of benthic divingbehaviour intra-depth zone IDZ) carried out by chinstrap penguinsPygoscelis antarcticus breeding at Vapour Col rookery Deception IslandSouth Shetland Islands Antarctica during chick guard (January 2017) De-tails for the regression curve are given in Table S2 Figure S13 The rela-tionship between the number of dives per trip and the maximumdistance from the colony during a foraging trip carried out by gentoopenguin Pygoscelis papua breeding at Byers Peninsula Livingston IslandAntarctica (chick guard December 2016) Details for the regression curveare given in Table S3 Figure S14 The relationship between the bot-tom time and the event maximum depth for benthic dives (based on theindex of benthic diving behaviour intra-depth zone IDZ) carried out bygentoo penguin Pygoscelis papua breeding at Byers Peninsula LivingstonIsland Antarctica during chick guard (December 2016) Details for the re-gression curve are given in Table S4 Figure S15 The relationship be-tween the bottom time and the event maximum depth for pelagic dives(based on the index of benthic diving behaviour intra-depth zone IDZ)carried out by gentoo penguin Pygoscelis papua breeding at Byers Penin-sula Livingston Island Antarctica during chick guard (December 2016)Details for the regression curve are given in Table S4 Figure S16 Therelationship between the bottom time and the event maximum depthfor benthic dives (based on the index of benthic diving behaviour intra-depth zone IDZ) carried out by chinstrap penguins Pygoscelis antarcticusbreeding at Vapour Col rookery Deception Island South Shetland IslandsAntarctica during chick guard (January 2017) Details for the regressioncurve are given in Table S4 Figure S17 The relationship between thebottom time and the event maximum depth for pelagic dives (based onthe index of benthic diving behaviour intra-depth zone IDZ) carried outby chinstrap penguins Pygoscelis antarcticus breeding at Vapour Col rook-ery Deception Island South Shetland Islands Antarctica during chickguard (January 2017) Details for the regression curve are given in Table
Masello et al Movement Ecology (2021) 924 Page 20 of 25
S4 Figure S18 Location and size of other colonies of gentoo penguinsPygoscelis papua (degrees of red dots) chinstrap penguins Pygoscelis ant-arcticus (degrees of blue dots) and Antarctic Fur Seals Arctocephalusgazella (degrees of brown dots) in the South Shetland Islands AntarcticaThe locations and size of the Fur Seal colonies were obtained fromHucke-Gaete et al (2004) while those from the penguin colonies wereobtained from Naveen et al (2000) and the Mapping Application for Pen-guin Populations and Projected Dynamics (MAPPPD) (Humphries et al2017) available at httpwwwpenguinmapcom Size for penguins pairsSize for fur seals individuals Foraging trip coded as in Fig 2a FigureS19 Kernel density distribution of dive locations and bathymetry The50 core areas are denoted by black lines while 95 home ranges byyellow lines Kernel density distributions represent the places where thepenguins spent most of their forging time Data from gentoo penguinsPygoscelis papua breeding at Devils Point Byers Peninsula Livingston Is-land South Shetland Islands Antarctica during chick guard (December2016) is further coded in short (dashed lines) and long trips (solid lines)Data from chinstrap penguins Pygoscelis antarcticus breeding at VapourCol rookery Deception Island South Shetland Islands Antarctica duringchick guard (January 2017) is denoted by solid lines only as no distinc-tion between short and long trips could be found Depth (in m) is basedon data from the International Bathymetric Chart of the Southern Ocean(IBCSO Arndt et al 2013) Figure S20 Energy landscapes based on thebathymetry around New Island FalklandMalvinas Islands and the mass-specific total cost of foraging (diving plus commuting) by gentoo pen-guins Pygoscelis papua relative to the bottom time (in J kgminus 1 sminus 1) consid-ering the different proportion of benthic and pelagic dives carried out bythe penguins from the South End colony during the 2013 breeding sea-son For further details see Masello et al (2017) Figure S21 Energy land-scapes based on the bathymetry around New Island FalklandMalvinasIslands and the mass-specific total cost of foraging (diving plus commut-ing) by gentoo penguins Pygoscelis papua relative to the bottom time (inJ kgminus 1 sminus 1) considering the different proportion of benthic and pelagicdives carried out by the penguins from the South End colony during the2014 breeding season For further details see Masello et al (2017) FigureS22 Energy landscapes based on the bathymetry around New IslandFalklandMalvinas Islands and the mass-specific total cost of foraging(diving plus commuting) by gentoo penguins Pygoscelis papua relative tothe bottom time (in J kgminus 1 sminus 1) considering the different proportion ofbenthic and pelagic dives carried out by the penguins from the NorthEnd colony during the 2014 breeding season For further details seeMasello et al (2017) Figure S23 Diet composition using non-metricmultidimensional scaling (NMDS) of molecular operational taxonomicunits (MOTUs) Data corresponds to gentoo penguins Pygoscelis papua atDevils Point Byers Peninsula Livingston Island South Shetland IslandsAntarctica during chick guard (Dec 2016) and chinstrap penguins Pygos-celis antarcticus at Vapour Col rookery Deception Island South ShetlandIslands Antarctica during chick guard (Jan 2017) A) includes the identityof the prey consumed while B) the ellipses and C) the convex hulls con-necting similar categories Gentoo black dots and lines and dark greyshade Chinstrap royal blue dots and lines and royal blue shade FigureS24 Diet composition using non-metric multidimensional scaling(NMDS) of molecular operational taxonomic units (MOTUs) Data corre-sponds to gentoo penguins Pygoscelis papua at Devils Point Byers Penin-sula Livingston Island South Shetland Islands Antarctica during chickguard (Dec 2016) and chinstrap penguins Pygoscelis antarcticus at VapourCol rookery Deception Island South Shetland Islands Antarctica duringchick guard (Jan 2017) A) includes the identity of the prey consumedwhile B) the ellipses and C) the convex hulls connecting similar categor-ies The categories included are gentoo adults (back and dark grey) gen-too chicks (red) chinstrap adults (royal blue) and chinstrap chicks (cyannot visible A) and C) Figure S25 Diet composition using non-metricmultidimensional scaling (NMDS) of molecular operational taxonomicunits (MOTUs) Data corresponds to gentoo penguins Pygoscelis papua atDevils Point Byers Peninsula Livingston Island South Shetland IslandsAntarctica during chick guard (Dec 2016) A) includes the identity of theprey consumed while B) the ellipses and C) the convex hulls connectingsimilar categories The categories included are adults (black and darkgrey) and chicks (red) Figure S26 Diet composition using non-metricmultidimensional scaling (NMDS) of molecular operational taxonomic
units (MOTUs) Data corresponds to chinstrap penguins Pygoscelis antarc-ticus at Vapour Col rookery Deception Island South Shetland Islands Ant-arctica during chick guard (Jan 2017) A) includes the identity of the preyconsumed while B) the ellipses and C) the convex hulls connecting simi-lar categories The categories included are adults (royal blue) and chicks(cyan) Figure S27 Boxplot of the ratio of two types of leucocytes theheterophils and lymphocytes (HL ratio) belonging to chinstrap penguinsPygoscelis antarcticus at Vapour Col rookery Deception Island South Shet-land Islands Antarctica during chick guard (Jan 2017) and gentoo pen-guins Pygoscelis papua at Devils Point Byers Peninsula Livingston IslandSouth Shetland Islands Antarctica during chick guard (Dec 2016) Box-plots include medians whiskers indicating variability outside the upperand lower quartiles and outliers (circles) Figure S28 Dive depth of pela-gic dives corresponding to gentoo penguins Pygoscelis papua breedingat New Island (FalklandMalvinas Islands) during chick guard (December)in 2013 and 2014 gentoo penguins breeding at Devils Point Byers Penin-sula Livingston Island South Shetland Islands Antarctica during chickguard (December 2016) and chinstrap penguins Pygoscelis antarcticusbreeding at Vapour Col rookery Deception Island South Shetland IslandsAntarctica during chick guard (January 2017) Figure S29 Standardisedabundance of the Antarctic Krill Euphausia superba obtained from theKRILLBASE (Atkinson et al 2017) for the sector between 60 and 65degS and55ndash65degW (A) and Antarctic Krill catches for the CCAMLR Area 48 (B) Add-itional Methods Molecular analysis of the diet Additional References
AcknowledgmentsWe would like to thank Intildeaki Irastorza Miguel Ojeda Jordi Felipe theAntarctic stations Juan Carlos I and Gabriel de Castilla personnel (Australsummer 2016-2017) the RV Sarmiento de Gamboa crew (Austral summer2016-2017) the Unidad de Tecnologiacutea Marina ndash CSIC (Spain) New IslandConservation Trust Ian Maria and Georgina Strange Sylvia Kuhn (Max PlanckInstitute for Ornithology Germany) Melanie Marx Julia Sommerfeld Chris-toph Kaula Jessica Winter (Justus Liebig University Giessen) Richard Phillipsand Pauline Sackett (British Antarctic Survey UK) Paul Brickle (South AtlanticEnvironmental Research Institute Falkland Islands) Andreas Bange MikakoSaito Giselle Hazell and Leiv Poncet for their contributions to the fieldworkand logistics Jan Erik Arndt provided the data from the International Bathy-metric Chart of the Southern Ocean (IBCSO) Simeon Hill provided useful ad-vice to obtain krill abundance information Tobias Zimmermann for theirsupport in the development of the custom workflow in GALAXY The authorsare grateful to G Guillou from the Plateforme Analyses Isotopiques of LIENSsfor running the stable isotope analysis
Authorsrsquo contributionsJFM PQ and AB conceived and designed the study PQ JFM AB WOCS RMAG and PB were involved in securing funding for the study AB secured thenecessary logistics in Antarctica JFM AB JoB and JeB carried out thefieldwork JFM RM PB RC-C and JM-B carried out the lab work JFM PQ AKTM RM JES MNK SG and AG were involved in analyses of the data JFMdrafted the manuscript All authors provided editorial comments on a draftmanuscript and have approved the final manuscript
FundingJFM work was supported by the Deutsche Forschungsgemeinschaft (DFGGermany) in the framework of the priority programme ldquoAntarctic Researchwith comparative investigations in Arctic ice areasrdquo SPP 1158 by thefollowing grant MA 25746ndash1 Martin Wikelski (Max Planck Institute of AnimalBehaviour Radolfzell Germany) provided the earthampOcean GPS-TD data log-gers AB was supported by the grant CTM2015ndash64720-R from the SpanishAgency of Research (Spain) Diet analyses from New Island were funded by aResearch Grant (NBAF967) for lab work at the Biomolecular Analysis Facility -Sheffield (NBAF-S) Centre for Ecology amp Hydrology Natural Environment Re-search Council (NERC) UK (to WOCS RM and JFM) Funding for the oper-ation and maintenance of the local Galaxy server is provided by the GermanFederal Ministry of Education and Research (BMBF) project ldquoBielefeld-GieszligenCenter for Microbial Bioinformatics-BiGirdquo (grant 031A533) within the GermanNetwork for Bioinformatics Infrastructure (de NBI) Thanks to the CPER (Con-trat de Projet Etat-Reacutegion) and the FEDER (Fonds Europeacuteen de Deacuteveloppe-ment Reacutegional) for funding the IRMS of LIENSs laboratory The IUF (Institut
Masello et al Movement Ecology (2021) 924 Page 21 of 25
Universitaire de France) is acknowledged for its support to PB as a SeniorMember Open Access funding enabled and organized by Projekt DEAL
Availability of data and materialsThe GPS-TD and tri-axial acceleration data supporting the conclusions of thisarticle are archived in the Movebank repository (IDs 1108578788132500849549 246072457 246072308 httpswwwmovebankorg) All otherdatasets supporting the conclusions of this article are included or citedwithin the article and its Additional file 1
Declarations
Ethics approval and consent to participatePermission to work in Antarctic locations and for penguin handling wasgiven by the Spanish Polar Committee The CSIC ethical commissionapproved the field procedures Fieldwork on New Island was approved bythe Falkland Islands Government (Environmental Planning Office) throughthe Research Licence R06 2011
Consent for publicationNot applicable
Competing interestsThe authors declare that they have no competing interests
Author details1Department of Animal Ecology amp Systematics Justus Liebig UniversityGiessen Heinrich-Buff-Ring 26 D-35392 Giessen Germany 2DepartmentEcologiacutea Evolutiva Museo Nacional de Ciencias Naturales CSIC CJoseacuteGutieacuterrez Abascal 2 28006 Madrid Spain 3Centre drsquoEtudes Biologiques deChizeacute UMR7372 CNRS-Universiteacute La Rochelle 79360 Villiers en Bois France4New Zealand Penguin Initiative PO Box 6319 Dunedin 9022 New Zealand5Cardiff School of Biosciences Cardiff University The Sir Martin EvansBuilding Museum Av Cardiff CF10 3AX UK 6Cardiff School of DentistryHeath Park Cardiff CF14 4XY UK 7Institute for Bioinformatics amp SystemsBiology Justus Liebig University Giessen Heinrich-Buff-Ring 58 D-35392Giessen Germany 8Littoral Environnement et Socieacuteteacutes (LIENSs) UMR 7266CNRS-Universiteacute de La Rochelle 17000 La Rochelle France 9InstitutUniversitaire de France (IUF) 1 rue Descartes 75005 Paris France 10GLOCEE -Global Change Ecology and Evolution Group Universidad de Alcalaacute MadridSpain 11Estacioacuten Experimental de Zonas Aacuteridas CSIC Almeriacutea Spain
Received 29 October 2020 Accepted 17 March 2021
References1 Allen AM Singh NJ Linking movement ecology with wildlife management
and conservation Front Ecol Evol 20163e155 httpsdoiorg103389fevo201500155
2 Doherty TS Driscoll DA Coupling movement and landscape ecology foranimal conservation in production landscapes Proc R Soc B 2018285e20172272 httpdxdoiorg101098rspb20172272
3 Ripple WJ Wolf C Newsome TM Barnard P Moomaw WR World scientistsrsquowarning of a climate emergency BioScience 2020708ndash12 httpsdoiorg101093bioscibiz088
4 Kays R Crofoot MC Jetz W Wikelski M Terrestrial animal tracking as an eyeon life and planet Science 2015348aaa2478 httpsdoiorg101126scienceaaa2478
5 Foley JA DeFries R Asner GP Barford C Bonan G Carpenter SR et al Globalconsequences of land use Science 2005309(5734)570ndash4 httpsdoiorg101126science1111772
6 Nathan R Getz WM Revilla E Holyoak M Kadmon R Saltz D et al A movementecology paradigm for unifying organismal movement research Proc Natl Acad SciU S A 2008105(49)19052ndash9 httpsdoiorg101073pnas0800375105
7 Dugger KM Ballard G Ainley DG Lyver POB Schine C Adeacutelie penguinscoping with environmental change results from a natural experiment atthe edge of their breeding range Front Ecol Evol 20142art68 httpsdoiorg103389fevo201400068
8 Hays GC Ferreira LC Sequeira AMM Meekan MG Duarte CM Bailey H et alKey questions in marine megafauna movement ecology Trends Ecol Evol201631(6)463ndash75 httpsdoiorg101016jtree201602015
9 Loacutepez-Loacutepez P Individual-based tracking systems in ornithology welcome to theera of big data Ardeola 20166303ndash36 httpsdoiorg1013157arla6312016rp5
10 Augeacute AA Dias MP Lascelles B Baylis AMM Black A Boersma PD et alFramework for mapping key areas for marine megafauna to inform marinespatial planning the Falkland Islands case study Mar Pol 20189261ndash72httpsdoiorg101016jmarpol201802017
11 Baylis AMM Tierney M Orben RA Warwick-Evans V Wakefield E Grecian WJet al Important at-sea areas of colonial breeding marine predators on thesouthern Patagonian shelf Sci Rep 20199(1)8517 httpsdoiorg101038s41598-019-44695-1
12 Gallagher AJ Creel S Wilson RP Cooke SJ Energy landscapes and thelandscape of fear Trends Ecol Evol 201732(2)88ndash96 httpsdoiorg101016jtree201610010
13 MacArthur RH Pianka ER On the optimal use of a patchy environment AmNat 1966100(916)603ndash10 httpsdoiorg101086282454
14 Schoener TW Theory of feeding strategies Annu Rev Ecol Syst 19712(1)369ndash404 httpsdoiorg101146annureves02110171002101
15 Thorpe SKS Crompton RH Alexander RM Orangutans use compliantbranches to lower the energetic cost of locomotion Biol Lett 20073(3)253ndash6 httpsdoiorg101098rsbl20070049
16 Wilson RP Shepard ELC Liebsch N Prying into the intimate details ofanimal lives use of a daily diary on animals Endanger Species Res 2008423ndash37 httpsdoiorg103354esr00064
17 Lempidakis E Wilson RP Luckman A Metcalfe RS What can knowledge ofthe energy landscape tell us about animal movement trajectories and spaceuse A case study with humans J Theo Biol 201857101ndash11 httpsdoiorg101016jjtbi201808024
18 Gaillard J-M Hebblewhite M Loison A Fuller M Powell R Basille M et alHabitatndashperformance relationships finding the right metric at a givenspatial scale Phil Trans R Soc B 2010365(1550)2255ndash65 httpsdoiorg101098rstb20100085
19 Mosser AA Avgar T Brown GS Walker CS Fryxell JM Towards an energeticlandscape broad-scale accelerometry in woodland caribou J Anim Ecol201483(4)916ndash22 httpsdoiorg1011111365-265612187
20 Long RA Bowyer RT Porter WP Mathewson P Monteith KL Findholt SLet al Linking habitat selection to fitness-related traits in herbivores the roleof the energy landscape Oecologia 2016181(3)709ndash20 httpsdoiorg101007s00442-016-3604-7
21 Masello JF Kato A Sommerfeld J Mattern T Quillfeldt P How animalsdistribute themselves in space variable energy landscapes Front Zool 201714art33 httpsdoiorg101186s12983-017-0219-8
22 Greacutemillet D Lescroeumll A Ballard G Dugger KM Massaro M Porzig EL et alEnergetic fitness field metabolic rates assessed via 3D accelerometrycomplement conventional fitness metrics Funct Ecol 201832(5)1203ndash13httpsdoiorg1011111365-243513074
23 Wilson RP Quintana F Hobson VJ Construction of energylandscapes can clarify the movement and distribution of foraginganimals Proc R Soc B 2012279(1730)975ndash80 httpsdoiorg101098rspb20111544
24 Shepard ELC Wilson RP Rees WG Grundy E Lambertucci SA Simon BVEnergy landscapes shape animal movement ecology Am Nat 2013182(3)298ndash312 httpsdoiorg101086671257
25 Wall J Douglas-Hamilton I Vollrath F Elephants avoid costlymountaineering Curr Biol 200616527ndash9
26 Brownscombe JW Gutowsky LF Danylchuk AJ Cooke SJ Foragingbehaviour and activity of a marine benthivorous fish estimated using tri-axial accelerometer biologgers Mar Ecol Prog Ser 2014505241ndash51 httpsdoiorg103354meps10786
27 Ameacutelineau F Fort J Mathewson P Speirs D Courbin N Perret S et alEnergyscapes and prey fields shape a North Atlantic seabird winteringhotspot under climate change R Soc Open Sci 20185(1)171883 httpsdoiorg101098rsos171883
28 Convey P Peck LS Antarctic environmental change and biologicalresponses Sci Adv 20195eaaz0888 httpsdoiorg101126sciadvaaz0888
29 Hinke JT Salwicka K Trivelpiece SG Watters GM Trivelpiece WZ Divergentresponses of Pygoscelis penguins reveal a common environmental driverOecologia 2007153(4)845ndash55 httpsdoiorg101007s00442-007-0781-4
30 Handley JM Baylis AM Brickle P Pistorius P Temporal variation in the dietof gentoo penguins at the Falkland Islands Polar Biol 201639(2)283ndash96httpsdoiorg101007s00300-015-1781-1
Masello et al Movement Ecology (2021) 924 Page 22 of 25
31 Miller AK Karnovsky NJ Trivelpiece WZ Flexible foraging strategies ofgentoo penguins Pygoscelis papua over 5 years in the South ShetlandIslands Antarctica Mar Biol 2009156(12)2527ndash37 httpsdoiorg101007s00227-009-1277-z
32 Baylis AMM Zuur AF Brickle P Pistorius PA Climate as a driver ofpopulation variability in breeding Gentoo penguins Pygoscelis papua at theFalkland Islands Ibis 2012154(1)30ndash41 httpsdoiorg101111j1474-919X201101179x
33 Lynch HJ Naveen R Fagan WF Censuses of penguin blue-eyed shagPhalacrocorax atriceps and southern giant petrel Macronectes giganteuspopulations on the Antarctic Peninsula 2001ndash2007 Mar Ornithol 20083683ndash97
34 Schofield O Ducklow HW Martinson DG Meredith MP Moline MA FraserWR How do polar marine ecosystems respond to rapid climate changeScience 2010328(5985)1520ndash3 httpsdoiorg101126science1185779
35 Clucas GV Dunn MJ Dyke G Emslie SD Naveen R Polito MJ et al Areversal of fortunes climate change lsquowinnersrsquo and lsquolosersrsquo in Antarcticpeninsula penguins Sci Rep 201445024 httpsdoiorg101038srep05024
36 Fraser WR Trivelpiece WZ Ainley DG Trivelpiece SG Increases in Antarcticpenguin populations reduced competition with whales or a loss of sea icedue to environmental warming Polar Biol 199211525ndash31 httpsdoiorg101007BF00237945
37 Ainley D Ballard G Ackley S Blight LK Eastman JT Emslie SD et alParadigm lost or is top-down forcing no longer significant in the Antarcticmarine ecosystem Antarct Sci 200719(3)283ndash90 httpsdoiorg101017S095410200700051X
38 Trivelpiece WZ Hinke JT Miller AK Reiss CS Trivelpiece SG Watters GMVariability in krill biomass links harvesting and climate warming to penguinpopulation changes in Antarctica Proc Natl Acad Sci U S A 2011108(18)7625ndash8 httpsdoiorg101073pnas1016560108
39 Atkinson A Siegel V Pakhomov E Rothery P Long-term decline in krill stockand increase in salps within the Southern Ocean Nature 2004432(7013)100ndash3 httpsdoiorg101038nature02996
40 Lima M Estay S Warming effects in the western Antarctic Peninsulaecosystem the role of population dynamic models for explaining andpredicting penguin trends Popul Ecol 201355(4)557ndash65 httpsdoiorg101007s10144-013-0386-1
41 Lynch HJ Naveen R Trathan PN Fagan WF Spatially integrated assessmentreveals widespread changes in penguin populations on the AntarcticPeninsula Ecology 201293(6)1367ndash77 httpsdoiorg10189011-15881
42 McMahon KW Michelson CI Hart T McCarthy MD Patterson WP Polito MJDivergent trophic responses of sympatric penguin species to historicanthropogenic exploitation and recent climate change Proc Natl Acad SciU S A 2019116(51)25721ndash7 httpsdoiorg101073pnas1913093116
43 Barbosa A Benzal J De Leoacuten A Moreno J Population decline of chinstrap penguins(Pygoscelis antarctica) on Deception Island South Shetlands Antarctica Polar Biol201235(9)1453ndash7 httpsdoiorg101007s00300-012-1196-1
44 Naveen R Lynch HJ Forrest S Mueller T Polito M First direct site-widepenguin survey at Deception Island Antarctica suggests significant declinesin breeding chinstrap penguins Polar Biol 2012351879ndash88 httpsdoiorg101007s00300-012-1230-3
45 Gil-Delgado JA Gonzaacutelez-Soliacutes J Barbosa A Populations of breeding birds inByers Peninsula Livingston Island South Shetland Islands Antarct Sci 201325(Special Issue 02)303ndash6 httpsdoiorg101017S0954102012000752
46 Strange I Catry P Strange G Quillfeldt P New Island Falkland Islands ASouth Atlantic wildlife sanctuary for conservation management New IslandConservation Trust 2007
47 Barbosa A Merino S Benzal J Martinez J Garciacutea-Fraile S Geographicvariation in the immunoglobulin levels in pygoscelid penguins Polar Biol200730219ndash25 httpsdoiorg101007s00300-006-0175-9
48 Bannasch R Wilson R Culik B Hydrodynamic aspects of design andattachment of a back-mounted device in penguins J Exp Biol 199419483ndash96
49 Ludynia K Dehnhard N Poisbleau M Demongin L Masello JF Quillfeldt PEvaluating the impact of handling and logger attachment on foragingparameters and physiology in southern Rockhopper penguins PLoS One20127(11)e50429 httpsdoiorg101371journalpone0050429
50 Griffiths R Double M Orr K Dawson R A DNA test to sex most birds MolEcol 19987(8)1071ndash6 httpsdoiorg101046j1365-294x199800389x
51 Masello JF Mundry R Poisbleau M Demongin L Voigt CC Wikelski M et alDiving seabirds share foraging space and time within and among speciesEcosphere 20101art19 httpsdoiorg101890ES10-001031
52 Palacios MJ Valera F Colominas-Ciuroacute R Barbosa A Cellular and humoralimmunity in two highly demanding energetic life stages reproduction andmoulting in the chinstrap penguin J Ornithol 2018159(1)283ndash90 httpsdoiorg101007s10336-017-1499-7
53 Arndt JE Schenke HW Jakobsson M Nitsche FO Buys G Goleb YBet al The International Bathymetric Chart of the Southern Ocean(IBCSO) Version 10mdasha new bathymetric compilation covering circum-Antarctic waters Geophys Res Lett 2013403111ndash7 httpsdoiorg101002grl50413
54 Smith WH Sandwell DT Global Sea floor topography from satellite altimetryand ship depth soundings Science 1997277(5334)1956ndash62 httpsdoiorg101126science27753341956
55 Mattern T Ellenberg U Houston DM Davis LS Consistent foraging routesand benthic foraging behaviour in yellow-eyed penguins Mar Ecol ProgSer 2007343295ndash306 httpsdoiorg103354meps06954
56 Tremblay Y Cherel Y Benthic and pelagic dives a new foraging behaviourin rockhopper penguins Mar Ecol Prog Ser 2000204257ndash67 httpsdoiorg103354meps204257
57 Wood AG Naef-Daenzer B Prince PA Croxall JP Quantifying habitat use insatellite-tracked pelagic seabirds application of kernel estimation toalbatross location J Avian Biol 200031(3)278ndash86 httpsdoiorg101034j1600-048X2000310302x
58 Laver PN Kelly MJ A critical review of home range studies J Wildl Manag200872(1)290ndash8 httpsdoiorg1021932005-589
59 Dinno A dunntest Dunnrsquos test of multiple comparisons using rank sums Rpackage version 135 2017 httpscranr-projectorgwebpackagesdunntestindexhtml Accessed 28 Oct 2020
60 Gleiss AC Wilson RP Shepard EL Making overall dynamic body accelerationwork on the theory of acceleration as a proxy for energy expenditureMethods Ecol Evol 20112(1)23ndash33 httpsdoiorg101111j2041-210X201000057x
61 Halsey LG Shepard ELC Quintana F Goacutemez Laich A Green JA Wilson RPThe relationship between oxygen consumption and body acceleration in arange of species Comp Biochem Physiol Part A 2009152(2)197ndash202httpsdoiorg101016jcbpa200809021
62 Wilson RP Boumlrger L Holton MD Scantlebury DM Goacutemez-Laich A QuintanaF et al Estimates for energy expenditure in free-living animals usingacceleration proxies a reappraisal J Anim Ecol 202089(1)161ndash72 httpsdoiorg1011111365-265613040
63 Quintana F Wilson RP Yorio P Dive depth and plumage air in wettablebirds the extraordinary case of the imperial cormorant Mar Ecol Prog Ser2007334299ndash310 httpsdoiorg103354meps334299
64 Shepard ELC Wilson RP Quintana F Goacutemez Laich A Forman DW Pushedfor time or saving on fuel fine-scale energy budgets shed light oncurrencies in a diving bird Proc R Soc B 2009276(1670)3149ndash55 httpsdoiorg101098rspb20090683
65 Rombolaacute EF Marschoff E Coria N Inter-annual variability in chinstrappenguin diet at South Shetland and South Orkneys Islands Polar Biol 201033(6)799ndash806 httpsdoiorg101007s00300-009-0757-4
66 Hastie T gam Generalized additive models R package version 1161 2019httpsCRANR-projectorgpackage=gam Accessed 28 Oct 2020
67 Lowther AD Trathan P Tarroux A Lydersen C Kovacs KM The relationshipbetween coastal weather and foraging behaviour of chinstrap penguinsPygoscelis antarctica ICES J Mar Sci 201875(6)1940ndash8 httpsdoiorg101093icesjmsfsy061
68 Culik B Wilson R Dannfeld R Adelung D Spairani H Coria NRC Pygoscelidpenguins in a swim canal Polar Biol 199111277ndash82 httpsdoiorg101007BF00238463
69 Davis RW Croxall JP OConnell MJ The reproductive energetics ofGentoo (Pygoscelis papua) and macaroni (Eudyptes chrysolophus)penguins at South Georgia J Anim Ecol 198958(1)59ndash74 httpsdoiorg1023074986
70 Wilson RP White CR Quintana F Halsey LG Liebsch N Martin GR et alMoving towards acceleration for estimates of activity-specific metabolic ratein free-living animals the case of the cormorant J Anim Ecol 200675(5)1081ndash90 httpsdoiorg101111j1365-2656200601127x
71 Elliott KH Measurement of flying and diving metabolic rate in wild animalsreview and recommendations Comp Biochem Physiol Part A 201620263ndash77 httpsdoiorg101016jcbpa201605025
72 Heldmaier G Neuweiler G Roumlssler W Vergleichende TierphysiologieSpringer 2013
Masello et al Movement Ecology (2021) 924 Page 23 of 25
73 Takahashi A Dunn M Trathan P Croxall J Wilson RP Sato K et al Krill-feeding behaviour in a chinstrap penguin compared to fish-eating inMagellanic penguins a pilot study Mar Ornithol 20043247ndash54
74 Bost CA Handrich Y Butler PJ Fahlman A Halsey LG Woakes AJ et alChanges in dive profiles as an indicator of feeding success in king andAdelie penguins Deep-Sea Res II 200754(3-4)248ndash55 httpsdoiorg101016jdsr2200611007
75 Carroll G Slip D Jonsen I Harcourt R Supervised accelerometry analysis canidentify prey capture by penguins at sea J Exp Biol 2014217(24)4295ndash302httpsdoiorg101242jeb113076
76 Puumltz K Rey AR Huin N Schiavini A Puumltz A Luthi BH Diving characteristics ofsouthern rockhopper penguins (Eudyptes c chrysocome) in the SouthwestAtlantic Mar Biol 2006149(2)125ndash37 httpsdoiorg101007s00227-005-0179-y
77 Elliott KH Davoren GK Gaston AJ Time allocation by a deep-diving birdreflects prey type and energy gain Anim Behav 200875(4)1301ndash10 httpsdoiorg101016janbehav200709024
78 Johnston K Ver Hoef JM Krivoruchko K Lucas N Using ArcGIS geostatisticalanalyst Esri Redlands 2001
79 Bolger AM Lohse M Usadel B Trimmomatic a flexible trimmer for Illuminasequence data Bioinformatics 201430(15)2114ndash20 httpsdoiorg101093bioinformaticsbtu170
80 Magoč T Salzberg SL FLASH fast length adjustment of short reads toimprove genome assemblies Bioinformatics 201127(21)2957ndash63 httpsdoiorg101093bioinformaticsbtr507
81 Schloss PD Westcott SL Ryabin T Hall JR Hartmann M Hollister EB et alIntroducing mothur open-source platform-independent community-supportedsoftware for describing and comparing microbial communities Appl EnvironMicrobiol 200975(23)7537ndash41 httpsdoiorg101128AEM01541-09
82 Edgar RC Search and clustering orders of magnitude faster than BLASTBioinformatics 201026(19)2460ndash1 httpsdoiorg101093bioinformaticsbtq461
83 Altschul SF Gish W Miller W Myers EW Lipman DJ Basic local alignment searchtool J Mol Biol 1990215(3)403ndash10 httpsdoiorg101016S0022-2836(05)80360-2
84 Afgan E Baker D Batut B van den Beek M Bouvier D Čech M et al Thegalaxy platform for accessible reproducible and collaborative biomedicalanalyses 2018 update Nucleic Acids Res 201846(W1)W537ndashW44 httpsdoiorg101093nargky379
85 Deagle BE Kirkwood R Jarman SN Analysis of Australian fur seal diet bypyrosequencing prey DNA in faeces Mol Ecol 200918(9)2022ndash38 httpsdoiorg101111j1365-294X200904158x
86 Vesterinen EJ Lilley T Laine VN Wahlberg N Next generation sequencingof fecal DNA reveals the dietary diversity of the widespread insectivorouspredator Daubentonrsquos bat (Myotis daubentonii) in southwestern FinlandPLoS One 20138(11)e82168 httpsdoiorg101371journalpone0082168
87 Kleinschmidt B Burger C Dorsch M Nehls G Heinaumlnen S Morkūnas J et alThe diet of red-throated divers (Gavia stellata) overwintering in the GermanBight (North Sea) analysed using molecular diagnostics Mar Biol 2019166e77
88 Crisol-Martiacutenez E Moreno-Moyano LT Wormington KR Brown PH Stanley D Usingnext-generation sequencing to contrast the diet and explore pest-reduction servicesof sympatric bird species in macadamia orchards in Australia PLoS One 201611(3)e0150159 httpsdoiorg101371journalpone0150159
89 Barrett RT Camphuysen K Anker-Nilssen T Chardine JW Furness RW GartheS et al Diet studies of seabirds a review and recommendations ICES J MarSci 200764(9)1675ndash91 httpsdoiorg101093icesjmsfsm152
90 Oksanen J Blanchet FG Kindt R Legendre P Minchin PR OrsquoHara R et alvegan community ecology package R package version 20ndash2 2012 httpscranr-projectorgwebpackagesveganindexhtml Accessed 28 Oct 2020
91 Faith DP Minchin PR Belbin L Compositional dissimilarity as a robustmeasure of ecological distance Vegetatio 198769(1-3)57ndash68 httpsdoiorg101007BF00038687
92 Minchin PR An evaluation of the relative robustness of techniques forecological ordination Vegetatio 198769(1-3)89ndash107 httpsdoiorg101007BF00038690
93 Hobson KA Clark R Turnover of 13C in cellular and plasma fractions ofblood implications for nondestructive sampling in avian dietary studiesAuk 1993110(3)638ndash41 httpsdoiorg1023074088430
94 Parnell A Inger R Bearhop S Jackson AL Stable isotope analysis in R (SIAR) 2013httpcranr-projectorgwebpackagessiarindexhtml Accessed 28 Oct 2020
95 Jackson AL Inger R Parnell AC Bearhop S Comparing isotopic niche widthsamong and within communities SIBER ndash stable isotope Bayesian ellipses inR J Anim Ecol 201180(3)595ndash602 httpsdoiorg101111j1365-2656201101806x
96 Lemon J Plotrix a package in the red light district of R R-news 200668ndash1297 Layman CA Arrington DA Montantildea CG Post DM Can stable isotope ratios
provide for community-wide measures of trophic structure Ecology 200788(1)42ndash8 httpsdoiorg1018900012-9658(2007)88[42CSIRPF]20CO2
98 Davis AK Maney DL Maerz JC The use of leukocyte profiles to measurestress in vertebrates a review for ecologists Funct Ecol 200822(5)760ndash72httpsdoiorg101111j1365-2435200801467x
99 Plischke A Quillfeldt P Lubjuhn T Merino S Masello JF Leucocytes in adultburrowing parrots Cyanoliseus patagonus in the wild variation betweencontrasting breeding seasons gender and condition J Ornithol 2010151(2)347ndash54 httpsdoiorg101007s10336-009-0461-8
100 Merino S Martiacutenez J Moslashller AP Sanabria L de Lope F Peacuterez J et alPhytohaemagglutinin injection assay and physiological stress in nestlinghouse martins Anim Behav 199958(1)219ndash22 httpsdoiorg101006anbe19991127
101 Dein FJ Hematology In Harrison GJ Harrison WR editors Clinical avianmedicine and surgery W B Saunders Company 1986 p 174ndash91
102 Hawkey CM Dennet PB A colour atlas of comparative veterinaryhaematology Wolfe 1989
103 Humphries GRW Naveen R Schwaller M Che-Castaldo C McDowall PSchrimpf M et al Mapping application for penguin populations andprojected dynamics (MAPPPD) data and tools for dynamic managementand decision support Polar Rec 201753(2)160ndash6 httpsdoiorg101017S0032247417000055
104 Naveen R Forrest S Dagit R Blight L Trivelpiece W Trivelpiece S Censusesof penguin blue-eyed shag and southern giant petrel populations in theAntarctic Peninsula region 1994ndash2000 Polar Rec 200036(199)323ndash34httpsdoiorg101017S0032247400016818
105 Hucke-Gaete R Osman LP Moreno CA Torres D Examining naturalpopulation growth from near extinction the case of the Antarctic fur seal atthe South Shetlands Antarctica Polar Biol 200427(5)304ndash11 httpsdoiorg101007s00300-003-0587-8
106 Atkinson A Hill SL Pakhomov EA Siegel V Anadon R Sanae C et al KRILLBASE a circumpolar database of Antarctic krill and salp numerical densities1926-2016 Earth Sys Sci Data 20179(1)193ndash210 httpsdoiorg105194essd-9-193-2017
107 CCAMLR Krill fishery report 2018 Commission for the Conservation ofAntarctic Marine Living Resources 2018
108 Vintildeuela J Moreno J Carrascal LM Sanz JJ Amat JA Ferrer M et al Theeffect of hatching date on parental care chick growth and chick mortalityin the chinstrap penguin Pygoscelis antarctica J Zool 1996240(1)51ndash8httpsdoiorg101111j1469-79981996tb05485x
109 Lynch H Fagan W Naveen R Population trends and reproductive success ata frequently visited penguin colony on the western Antarctic PeninsulaPolar Biol 201033(4)493ndash503 httpsdoiorg101007s00300-009-0726-y
110 Dunn MJ Forcada J Jackson JA Waluda CM Nichol C Trathan PN A long-term study of gentoo penguin (Pygoscelis papua) population trends at amajor Antarctic tourist site Goudier Island Port Lockroy Biodivers Conserv201928(1)37ndash53 httpsdoiorg101007s10531-018-1635-6
111 Cairns DK The regulation of seabird colony size a hinterland model AmNat 1989134(1)141ndash6 httpsdoiorg101086284970
112 Carpenter-Kling T Handley JM Green DB Reisinger RR Makhado ABCrawford RJM et al A novel foraging strategy in gentoo penguins breedingat sub-Antarctic Marion Island Mar Biol 2017164(2)33 httpsdoiorg101007s00227-016-3066-9
113 BirdLife International IUCN red list for birds 2020 httpwwwbirdlifeorgAccessed 28 Oct 2020
114 Polito MJ Trivelpiece WZ Karnovsky NJ Ng E Patterson WP Emslie SDIntegrating stomach content and stable isotope analyses to quantify thediets of pygoscelid penguins PLoS One 20116(10)e26642 httpsdoiorg101371journalpone0026642
115 Polito MJ Trivelpiece WZ Patterson WP Karnovsky NJ Reiss CS Emslie SDContrasting specialist and generalist patterns facilitate foraging nichepartitioning in sympatric populations of Pygoscelis penguins Mar Ecol ProgSer 2015519221ndash37 httpsdoiorg103354meps11095
116 Herman RW Valls FCL Hart T Petry MV Trivelpiece WZ Polito MJ Seasonalconsistency and individual variation in foraging strategies differ among andwithin Pygoscelis penguin species in the Antarctic peninsula region MarBiol 2017164(5)115 httpsdoiorg101007s00227-017-3142-9
117 Dimitrijević D Paiva VH Ramos JA Seco J Ceia FR Chipev N et al Isotopicniches of sympatric Gentoo and chinstrap penguins evidence of
Masello et al Movement Ecology (2021) 924 Page 24 of 25
competition for Antarctic krill Polar Biol 201841(9)1655ndash69 httpsdoiorg101007s00300-018-2306-5
118 Panasiuk A Wawrzynek-Borejko J Musiał A Korczak-Abshire M Pygoscelispenguin diets on King George Island South Shetland Islands with a specialfocus on the krill Euphausia superba Antarct Sci 202032(1)21ndash8 httpsdoiorg101017S0954102019000543
119 du Toit M Bartlett P Bester M Roux J Seabird predation by individual sealsat Ichaboe Island Namibia S Afr J Wildl Res 20043445ndash54 httpshdlhandlenet10520EJC117184
120 Visser IN Drennan MP White RW MacLean SF Lagerstrom LC Francis JMAntarctic fur seals (Arctocephalus gazella) observed predating Adeacutelie(Pygoscelis adeliae) and chinstrap penguins (P antarctica) AntarcticPeninsula Aquat Mamm 200834(2)193ndash9 httpsdoiorg101578AM3422008193
121 DrsquoAmico VL Bertellotti M Benzal J Coria N Vidal V Diaz JI et al Leukocytecounts in different populations of Antarctic Pygoscelid penguins along theAntarctic Peninsula Polar Biol 201639(2)199ndash206 httpsdoiorg101007s00300-015-1771-3
122 Shepard E Cole E-L Neate A Lempidakis E Ross A Wind prevents cliff-breeding birds from accessing nests through loss of flight control eLife20198e43842 httpsdoiorg107554eLife43842
Publisherrsquos NoteSpringer Nature remains neutral with regard to jurisdictional claims inpublished maps and institutional affiliations
Masello et al Movement Ecology (2021) 924 Page 25 of 25
Abstract
Background
Methods
Results
Conclusions
Background
Methods
Study sites and species
Instrumentation and fieldwork procedures
Spatial and temporal data
Calculation of energy
Step 1 calculation of the overall dynamic body acceleration
Step 2 calculation of benthic and pelagic ODBAs
Step 3 calculation of the cost of travelling
Step 4 calculation of the cost of a dive
Step 5 integrating the cost of the actual number of dives performed
Step 6 integrating the cost of diving and commuting
Step 7 calculating the energy gained during foraging
Step 8 construction of the energy landscapes
Molecular analysis of the diet
Stable isotope analysis of the diet
Condition parameters
Additional data
Results
Foraging trips and dive parameters
Calculation of energy
Molecular analysis of the diet
Stable isotope analysis of the diet
Condition parameters
Discussion
Conclusion
Abbreviations
Supplementary Information
Acknowledgments
Authorsrsquo contributions
Funding
Availability of data and materials
Declarations
Ethics approval and consent to participate
Consent for publication
Competing interests
Author details
References
Publisherrsquos Note
competition for Antarctic krill Polar Biol 201841(9)1655ndash69 httpsdoiorg101007s00300-018-2306-5
118 Panasiuk A Wawrzynek-Borejko J Musiał A Korczak-Abshire M Pygoscelispenguin diets on King George Island South Shetland Islands with a specialfocus on the krill Euphausia superba Antarct Sci 202032(1)21ndash8 httpsdoiorg101017S0954102019000543
119 du Toit M Bartlett P Bester M Roux J Seabird predation by individual sealsat Ichaboe Island Namibia S Afr J Wildl Res 20043445ndash54 httpshdlhandlenet10520EJC117184
120 Visser IN Drennan MP White RW MacLean SF Lagerstrom LC Francis JMAntarctic fur seals (Arctocephalus gazella) observed predating Adeacutelie(Pygoscelis adeliae) and chinstrap penguins (P antarctica) AntarcticPeninsula Aquat Mamm 200834(2)193ndash9 httpsdoiorg101578AM3422008193
121 DrsquoAmico VL Bertellotti M Benzal J Coria N Vidal V Diaz JI et al Leukocytecounts in different populations of Antarctic Pygoscelid penguins along theAntarctic Peninsula Polar Biol 201639(2)199ndash206 httpsdoiorg101007s00300-015-1771-3
122 Shepard E Cole E-L Neate A Lempidakis E Ross A Wind prevents cliff-breeding birds from accessing nests through loss of flight control eLife20198e43842 httpsdoiorg107554eLife43842
Publisherrsquos NoteSpringer Nature remains neutral with regard to jurisdictional claims inpublished maps and institutional affiliations
Masello et al Movement Ecology (2021) 924 Page 25 of 25
Abstract
Background
Methods
Results
Conclusions
Background
Methods
Study sites and species
Instrumentation and fieldwork procedures
Spatial and temporal data
Calculation of energy
Step 1 calculation of the overall dynamic body acceleration
Step 2 calculation of benthic and pelagic ODBAs
Step 3 calculation of the cost of travelling
Step 4 calculation of the cost of a dive
Step 5 integrating the cost of the actual number of dives performed
Step 6 integrating the cost of diving and commuting
Step 7 calculating the energy gained during foraging