46
How can Human Resources impact Corporate Site Selection? Oliver Lawford Product Manager, EMSI
| Date post: | 17-Dec-2015 |
| Category: |
Documents |
| Upload: | shannon-dorsey |
| View: | 214 times |
| Download: | 0 times |

How can Human Resources impact Corporate Site Selection?Oliver LawfordProduct Manager, EMSI

2
Goals
1. Give you a framework to understand human capital issues within site selection process
2. Begin to show you how to apply strategic human capital data to influence site selections decisions.

Why is this important?
Reason One
New site selection or relocation are vital to business strategy.
-Technological Advances
-Human Capital Requirements
-New Products or Services
-New Markets
-New Distribution channels or suppliers
3
4
Why is this important?
Reason Two
Site Selection decisions are expensive, complicated, time consuming and hard to correct.
Why is this important?
Reason Three
In general, the most important site selection criteria are human capital issues.
Availability of skilled labor (1st)
Cost of labor (3rd)
5

6
"With organizations now focused on...entering new geographic markets,
human resources must arm its business leadership with the labor market essentials.
The right information can position a company in geographic locations where they
can improve their odds of success."
How does this affect HR?This is a perfect opportunity for HR and Talent Acquisition to have a significant impact on business outcomes.
Not just focused on operation efficiency.
7

8
Site Selection Process
9
Process
Phase Zero
Be aware of the overarching business strategy over the next five years.

Process
Phase One
Determine which criteria your business cares about and how much. These might include:
─ Workforce Requirements─ Land Requirements─ Customer Proximity─ Utility Costs─ Cost of Living─ Communications and Infrastructure
10
Process
Phase Two
Choose a particular location that best meets business needs. Keep 1-2 backup locations available.
Consult real estate advisory services, or real estate databases
Solicit information from communities regarding incentives (type, value and duration)
11
Process
Phase Three
Negotiation and final selection.
Brinksmanship!
12

13
Business Criteria

14
15
Business Criteria
What does a company like Tesla care about when building a Gigafactory?
1. Transport
2. Services
3. Finance
4. Workforce
5. Other
16
Transport Environment
Proximity to road and rail is a high priority in order to transport batteries back to California for final assembly
Proximity to water (medium)
Commute times (medium)
Proximity to major airport (low)
17
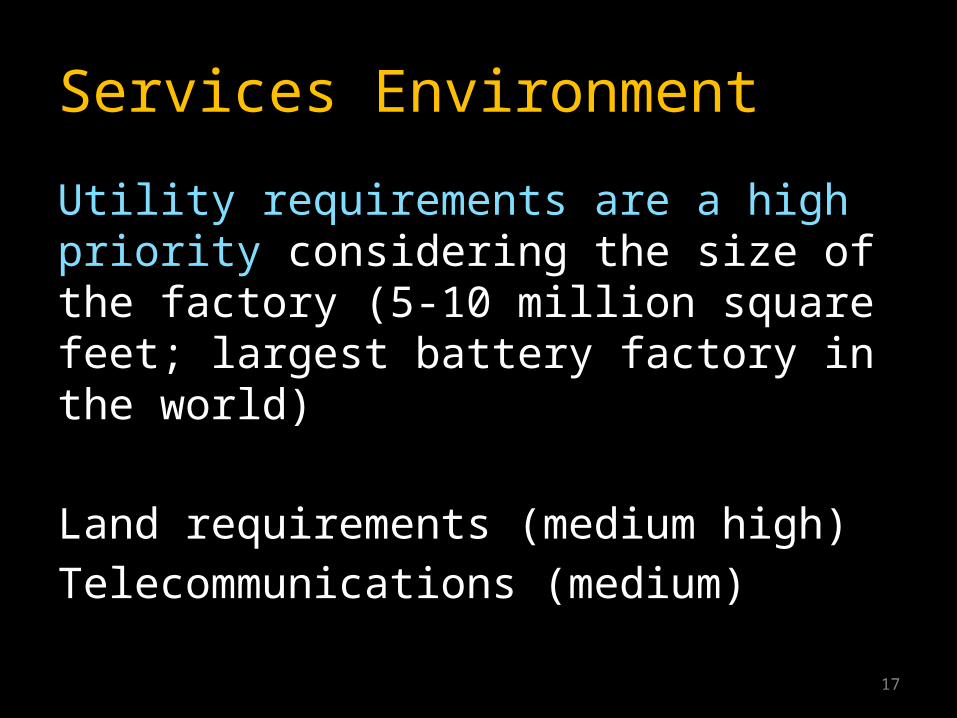
Services Environment
Utility requirements are a high priority considering the size of the factory (5-10 million square feet; largest battery factory in the world)
Land requirements (medium high)
Telecommunications (medium)
18
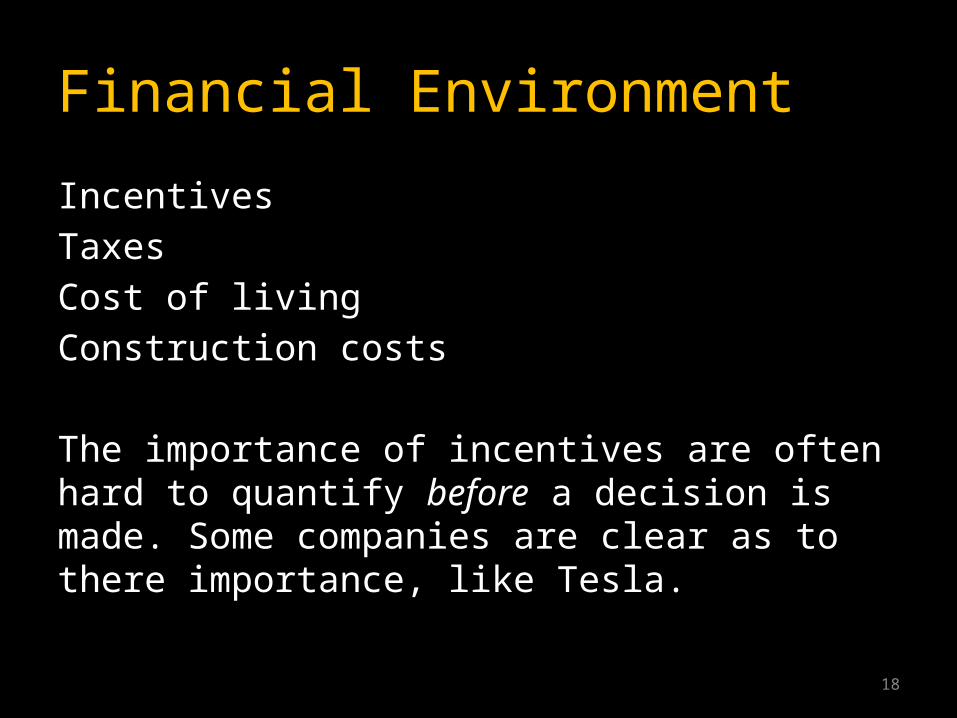
Financial Environment
Incentives
Taxes
Cost of living
Construction costs
The importance of incentives are often hard to quantify before a decision is made. Some companies are clear as to there importance, like Tesla.

19
Other
Quality of living (medium high)
Proximity to training/schools (medium)
Competitor proximity (low)
Customer proximity (low)

20
Workforce
Availability and cost of labor (high)
Workforce Demographics (diversity)
Labor Unionization (cost issue)

21
So where did Tesla go?

22

23
Motivating factors
$1.25 billion incentive package with the state of Nevada (10th biggest in US history)
Quality of living (proximity to Lake Tahoe, mountains etc.)
Growing technology presence (Microsoft, Apple, Intuit, Ashima)
Zero Corporate Income Tax

24
?

25
Let’s apply some data

26
Simple Process
Industries
Staffing Patterns
Individual Occupations
27
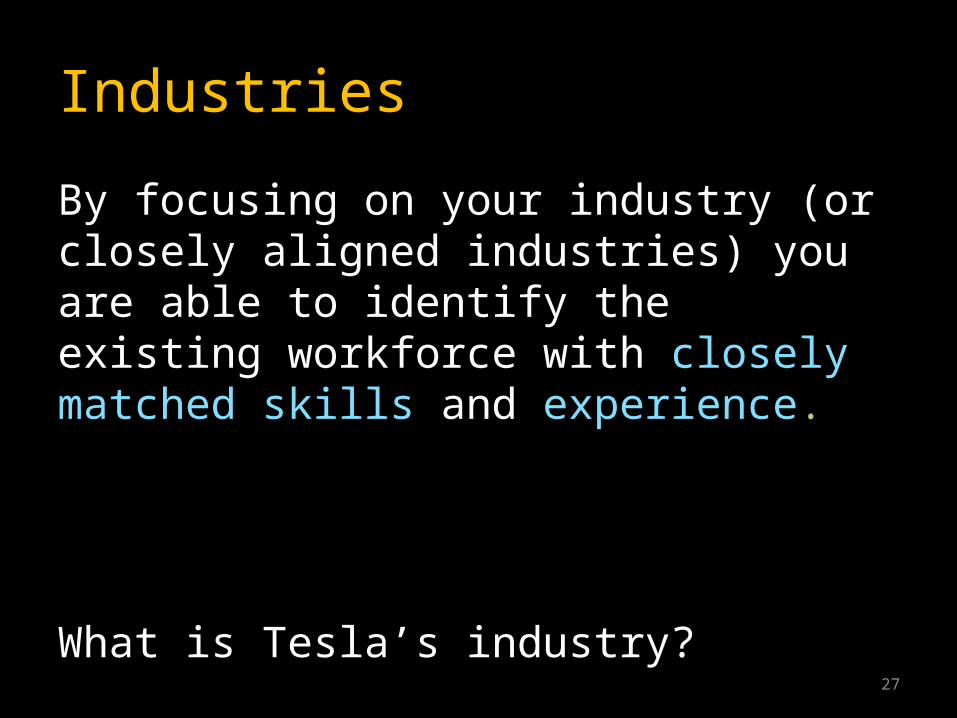
Industries
By focusing on your industry (or closely aligned industries) you are able to identify the existing workforce with closely matched skills and experience.
What is Tesla’s industry?
28
29
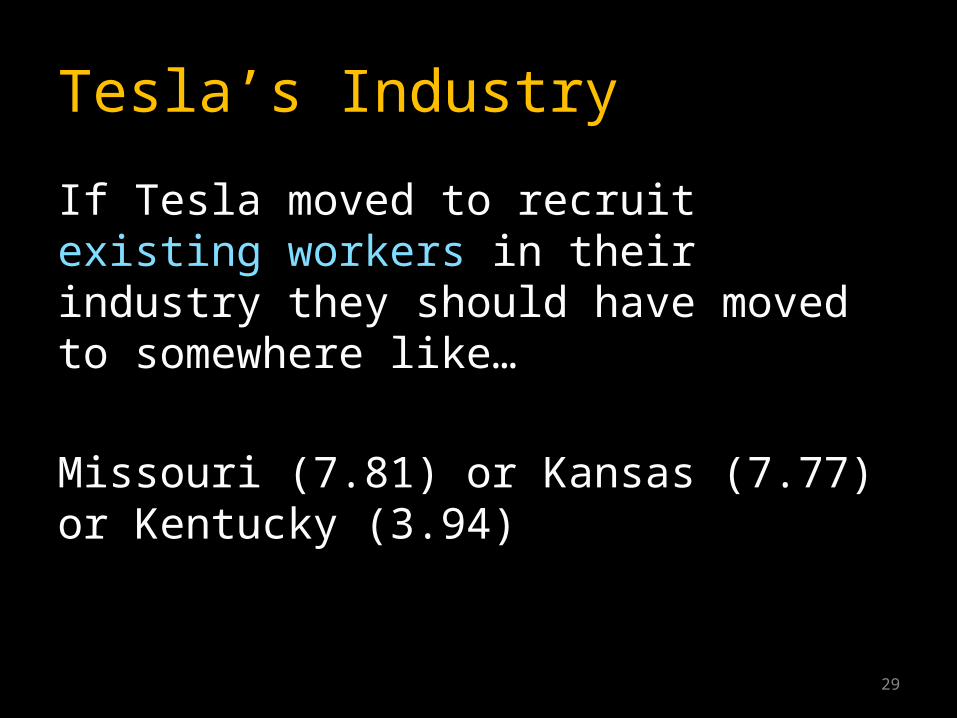
Tesla’s Industry
If Tesla moved to recruit existing workers in their industry they should have moved to somewhere like…
Missouri (7.81) or Kansas (7.77) or Kentucky (3.94)

30
Other Industries
Other closely aligned industries present compatible talent pools. Tesla could recruit from industries like Motor Vehicle Electrical and Electronic Equipment Manufacturers.
Those jobs are predominantly in the Midwest or Southeast.
31
Simple Framework
Industries
Staffing Patterns
Individual Occupations
32
Staffing Patterns
Using Staffing patterns we can identify the jobs which drive a particular industry.
Then we can identify whether they exist in
other industries.
33
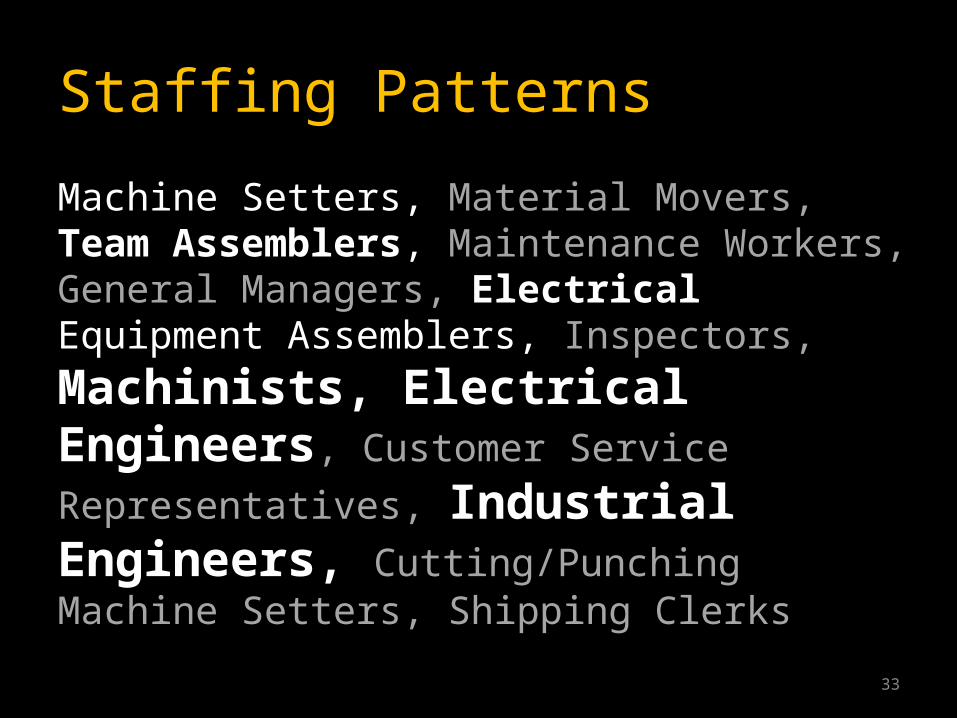
Staffing Patterns
Machine Setters, Material Movers, Team Assemblers, Maintenance Workers, General Managers, Electrical Equipment
Assemblers, Inspectors, Machinists, Electrical Engineers, Customer
Service Representatives, Industrial Engineers, Cutting/Punching Machine Setters, Shipping Clerks
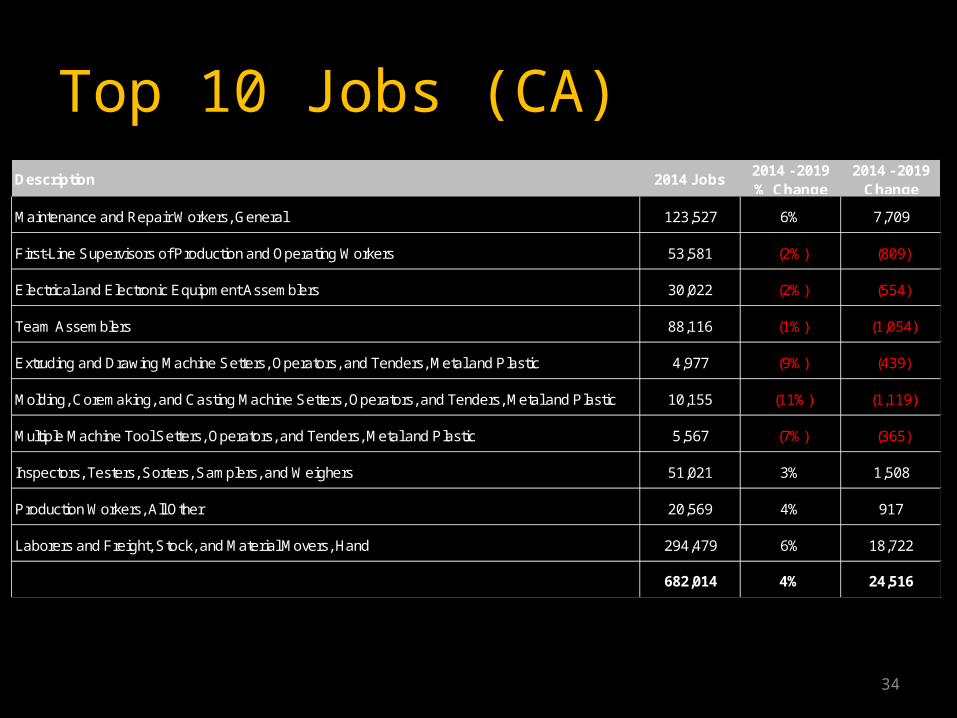
Top 10 Jobs (CA)
34
Description 2014 Jobs2014 - 2019 % Change
2014 - 2019 Change
Maintenance and Repair Workers, General 123,527 6% 7,709
First-Line Supervisors of Production and Operating Workers 53,581 (2%) (809)
Electrical and Electronic Equipment Assemblers 30,022 (2%) (554)
Team Assemblers 88,116 (1%) (1,054)
Extruding and Drawing Machine Setters, Operators, and Tenders, Metal and Plastic 4,977 (9%) (439)
Molding, Coremaking, and Casting Machine Setters, Operators, and Tenders, Metal and Plastic 10,155 (11%) (1,119)
Multiple Machine Tool Setters, Operators, and Tenders, Metal and Plastic 5,567 (7%) (365)
Inspectors, Testers, Sorters, Samplers, and Weighers 51,021 3% 1,508
Production Workers, All Other 20,569 4% 917
Laborers and Freight, Stock, and Material Movers, Hand 294,479 6% 18,722
682,014 4% 24,516

35
Top 10 Jobs (TX)Description 2014 Jobs
2014 - 2019 % Change
2014 - 2019 Change
Maintenance and Repair Workers, General 112,020 9% 9,838
First-Line Supervisors of Production and Operating Workers 47,914 4% 2,151
Electrical and Electronic Equipment Assemblers 17,756 2% 312
Team Assemblers 65,098 8% 5,074
Extruding and Drawing Machine Setters, Operators, and Tenders, Metal and Plastic 5,330 (4%) (188)
Molding, Coremaking, and Casting Machine Setters, Operators, and Tenders, Metal and Plastic 6,880 (6%) (401)
Multiple Machine Tool Setters, Operators, and Tenders, Metal and Plastic 5,886 3% 178
Inspectors, Testers, Sorters, Samplers, and Weighers 45,254 7% 3,174
Production Workers, All Other 9,662 11% 1,104
Laborers and Freight, Stock, and Material Movers, Hand 203,921 8% 16,692
519,721 7% 37,935
36
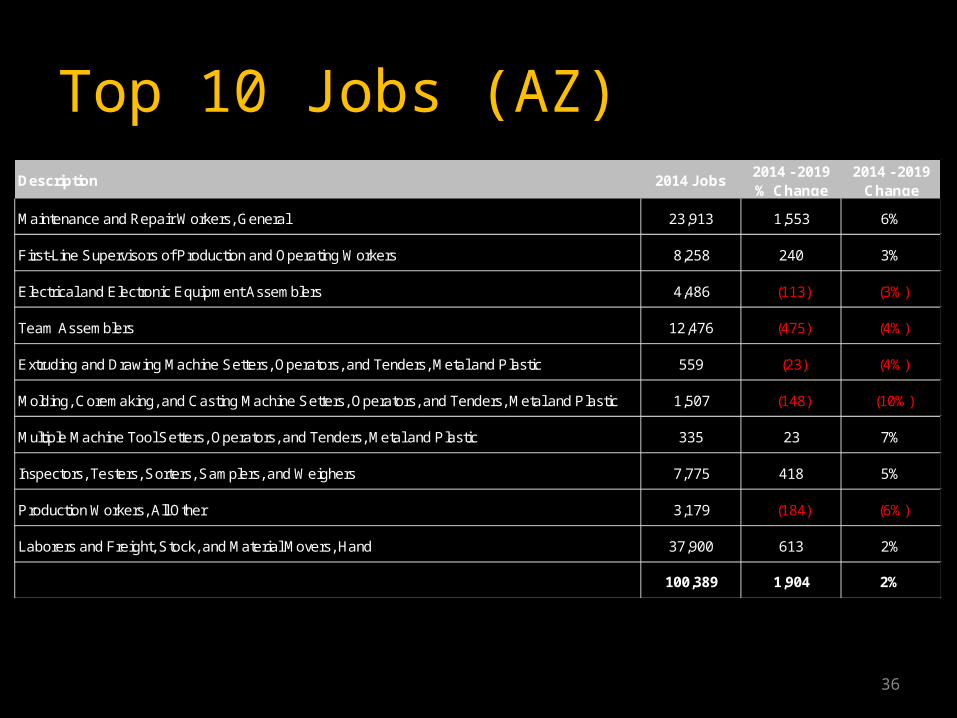
Top 10 Jobs (AZ)Description 2014 Jobs
2014 - 2019 % Change
2014 - 2019 Change
Maintenance and Repair Workers, General 23,913 1,553 6%
First-Line Supervisors of Production and Operating Workers 8,258 240 3%
Electrical and Electronic Equipment Assemblers 4,486 (113) (3%)
Team Assemblers 12,476 (475) (4%)
Extruding and Drawing Machine Setters, Operators, and Tenders, Metal and Plastic 559 (23) (4%)
Molding, Coremaking, and Casting Machine Setters, Operators, and Tenders, Metal and Plastic 1,507 (148) (10%)
Multiple Machine Tool Setters, Operators, and Tenders, Metal and Plastic 335 23 7%
Inspectors, Testers, Sorters, Samplers, and Weighers 7,775 418 5%
Production Workers, All Other 3,179 (184) (6%)
Laborers and Freight, Stock, and Material Movers, Hand 37,900 613 2%
100,389 1,904 2%

37
Top 10 Jobs (NM)Description 2014 Jobs
2014 - 2019 % Change
2014 - 2019 Change
Maintenance and Repair Workers, General 7,772 6% 489
First-Line Supervisors of Production and Operating Workers 2,310 3% 60
Electrical and Electronic Equipment Assemblers 540 (0%) (1)
Team Assemblers 2,107 (1%) (13)
Extruding and Drawing Machine Setters, Operators, and Tenders, Metal and Plastic 56 0% 0
Molding, Coremaking, and Casting Machine Setters, Operators, and Tenders, Metal and Plastic 363 (10%) (37)
Multiple Machine Tool Setters, Operators, and Tenders, Metal and Plastic 68 6% 4
Inspectors, Testers, Sorters, Samplers, and Weighers 1,641 4% 69
Production Workers, All Other 1,140 (1%) (10)
Laborers and Freight, Stock, and Material Movers, Hand 8,675 5% 477
24,670 4% 1,040
38
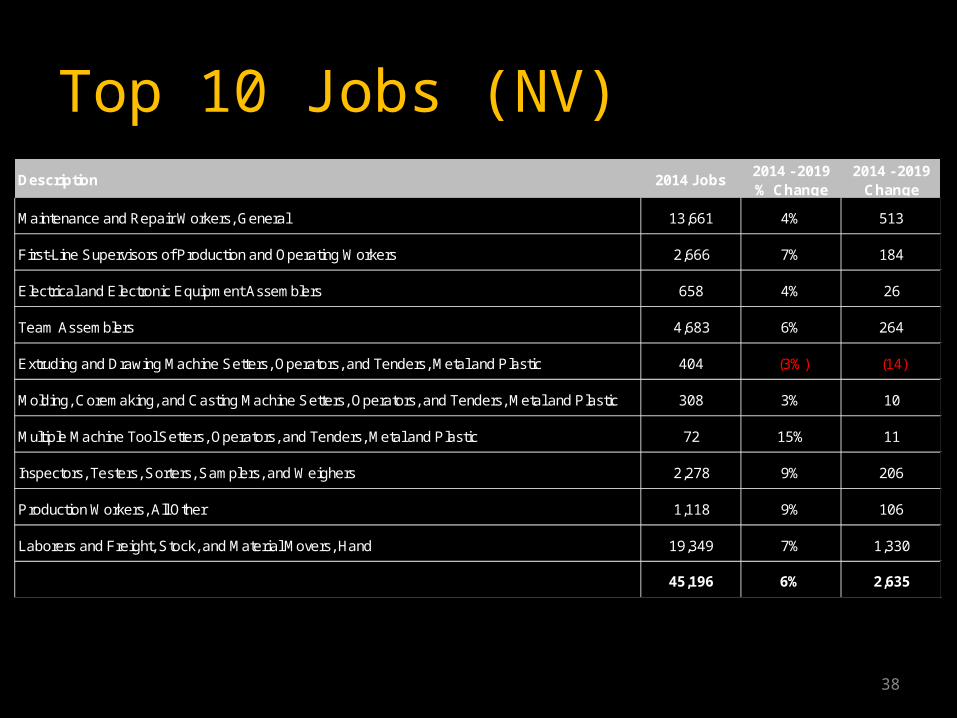
Top 10 Jobs (NV)Description 2014 Jobs
2014 - 2019 % Change
2014 - 2019 Change
Maintenance and Repair Workers, General 13,661 4% 513
First-Line Supervisors of Production and Operating Workers 2,666 7% 184
Electrical and Electronic Equipment Assemblers 658 4% 26
Team Assemblers 4,683 6% 264
Extruding and Drawing Machine Setters, Operators, and Tenders, Metal and Plastic 404 (3%) (14)
Molding, Coremaking, and Casting Machine Setters, Operators, and Tenders, Metal and Plastic 308 3% 10
Multiple Machine Tool Setters, Operators, and Tenders, Metal and Plastic 72 15% 11
Inspectors, Testers, Sorters, Samplers, and Weighers 2,278 9% 206
Production Workers, All Other 1,118 9% 106
Laborers and Freight, Stock, and Material Movers, Hand 19,349 7% 1,330
45,196 6% 2,635
39
Simple Framework
Industries
Staffing Patterns
Individual Occupations

40
Industrial Engineers
668 Industrial Engineers
67% below Average
8.5% projected growth
$76,000/annum
41
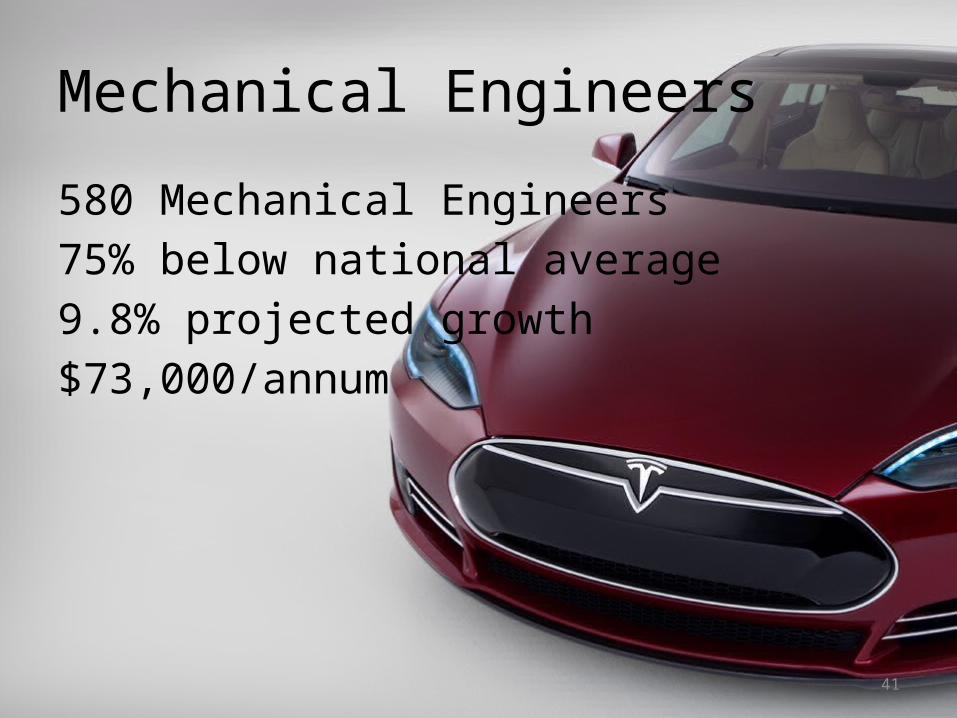
Mechanical Engineers
580 Mechanical Engineers
75% below national average
9.8% projected growth
$73,000/annum

42
So what are Tesla going to do?
43
Migration Patterns
Tesla must leverage its proximity to other key states and attract workers with a propensity to migrate.
44
Migration – All Jobs
Net gain in total jobs through migration (+5000)
Greatest in-migration for all jobs from California, Arizona, Texas, Washington, Utah, Florida and Colorado.
45
Migration – Engineering
Greatest in-migration for engineering jobs from California, Washington, Arizona, Texas, Colorado, Georgia and Hawaii.
Overall net loss in engineering jobs
Focus on retention

46
Thanks and Questions


