36
| Date post: | 11-Feb-2017 |
| Category: |
Data & Analytics |
| Upload: | grega-kespret |
| View: | 513 times |
| Download: | 1 times |

Grega Kešpret, Director of Engineering, Analytics – CeltraDenny Lee, Technology Evangelist – DatabricksDecember 9th, 2015
How Celtra Optimizes its Advertising Platform with Databricks
About Me: Grega Kešpret
Grega Kešpret is the Director of Engineering for Analytics. He works at Celtra since 2012, where he helped build analytics pipeline and optimization systems. Grega also leads the team of engineers and data scientists at San Francisco and Ljubljana, working on their analytics platform. Prior to Celtra, Grega worked at IBM, helping enterprise customers adopt WebSphere Application Server and before that did a 8-month internship at SANYO (Panasonic) in Japan, working on battery systems. His current technical interests include databases, distributed systems, functional programming and machine learning.
About Me: Denny Lee
Denny is a Technology Evangelist with Databricks; he is a hands-on data sciences engineer with more than 15 years of experience developing internet-scale infrastructure, data platforms, and distributed systems for both on-premises and cloud. His key focuses surround solving complex large scale data problems – providing not only architectural direction but the hands-on implementation of these systems. He has extensive experience in building greenfield teams as well as turn around / change catalyst. Prior to joining Databricks, Denny worked as a Senior Director of Data Sciences Engineering at Concur and was part of the incubation team that built Hadoop on Windows and Azure (currently known as HDInsight).
• About Celtra & AdCreator
• Event Data
• AdTech Problems (Sessionization, Funnel Analytics)
• Databricks Use Cases
• Data Analysis Evolutionary Path
• Main pain points from the past
• Demo
• Q&A
Agenda
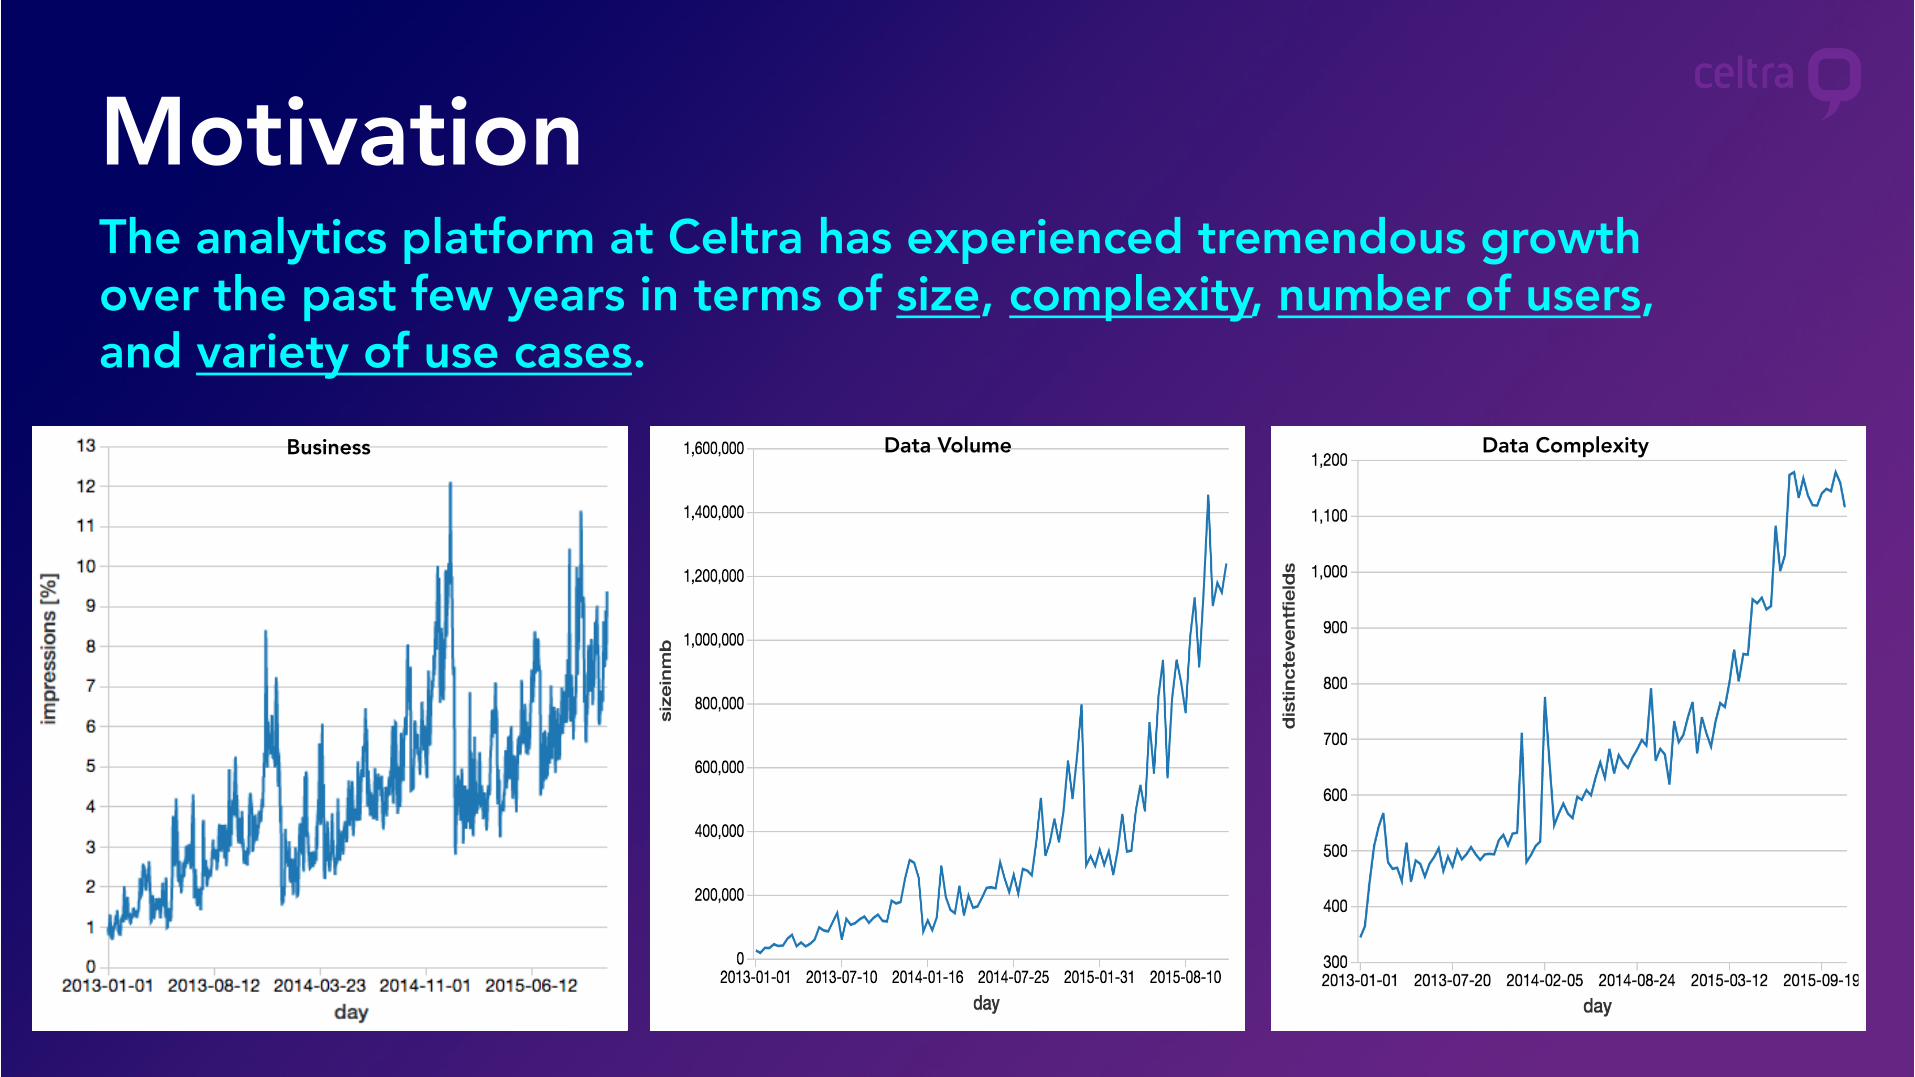
MotivationThe analytics platform at Celtra has experienced tremendous growth over the past few years in terms of size, complexity, number of users, and variety of use cases.
Business Data Volume Data Complexity
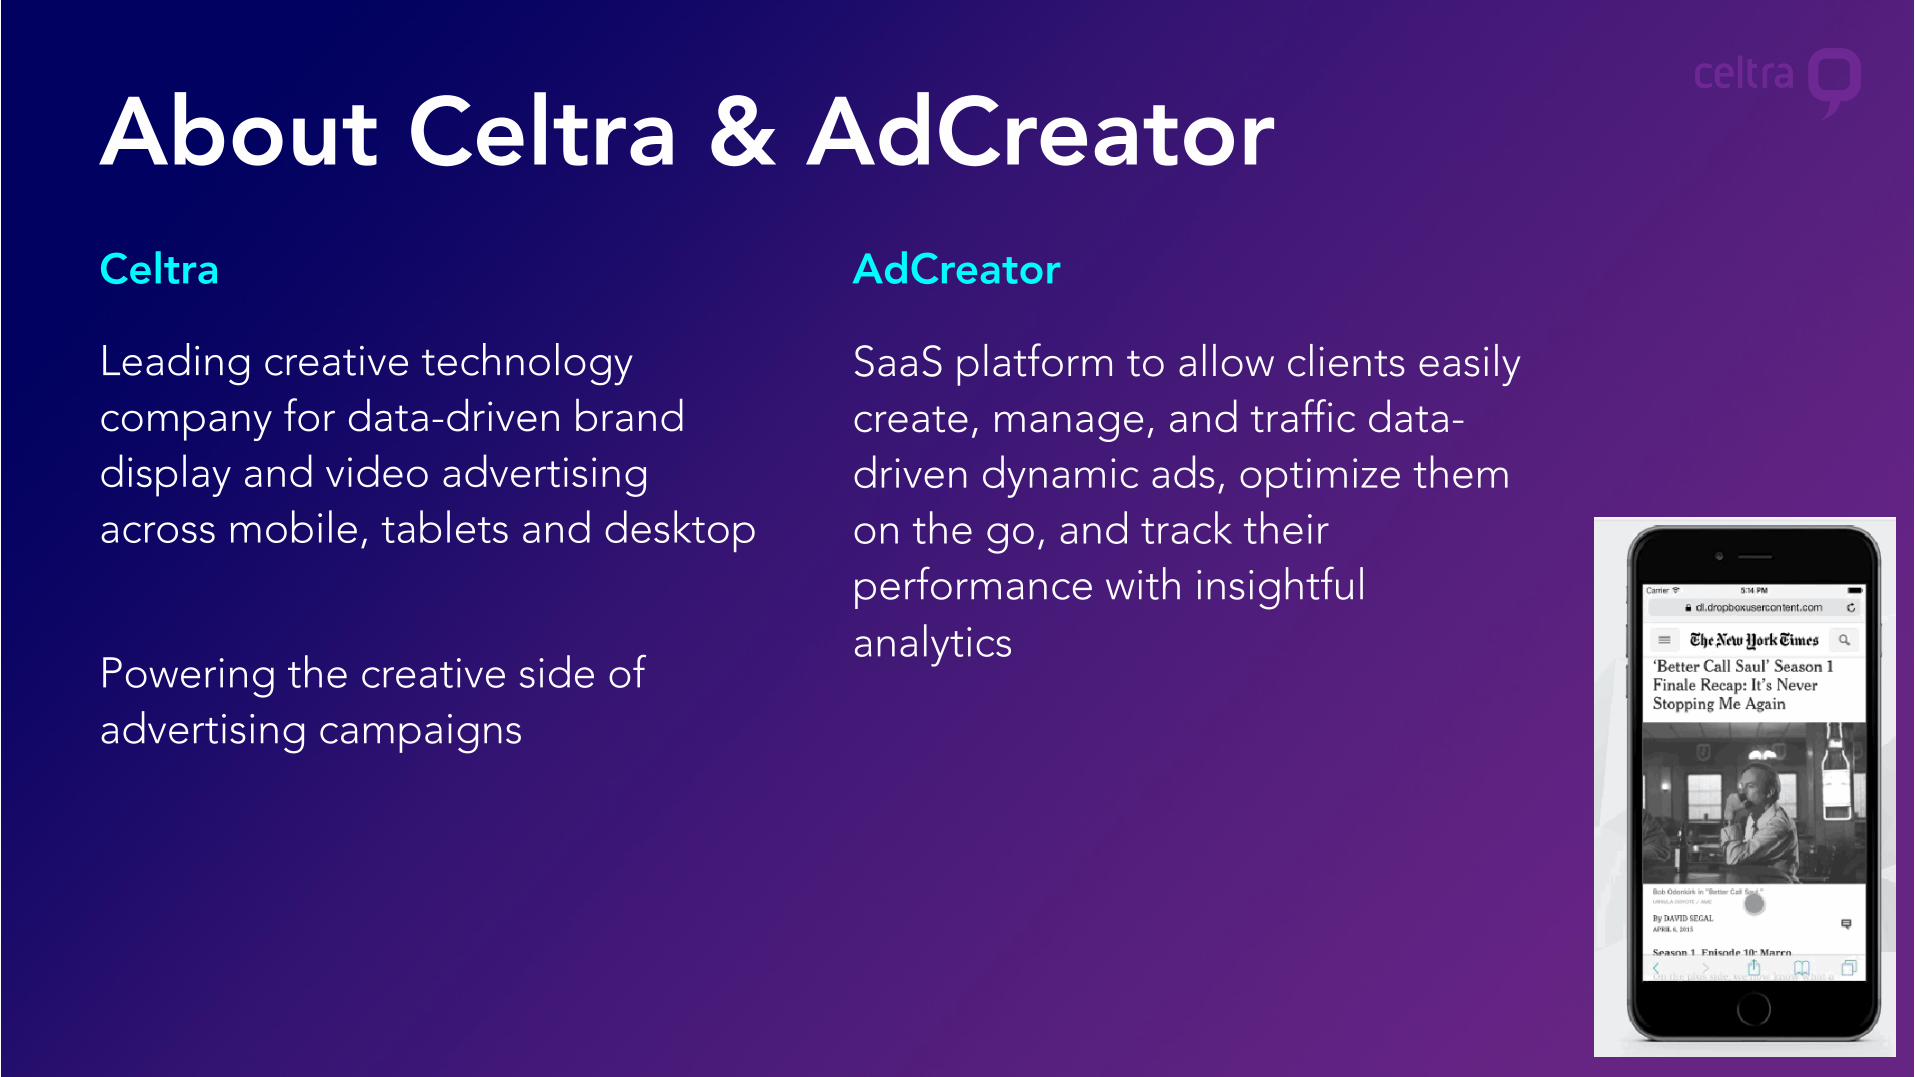
Leading creative technology company for data-driven brand display and video advertising across mobile, tablets and desktop
Powering the creative side of advertising campaigns
SaaS platform to allow clients easily create, manage, and traffic data-driven dynamic ads, optimize them on the go, and track their performance with insightful analytics
Celtra AdCreator
About Celtra & AdCreator

Trusted by +5000 brands
and agencies.
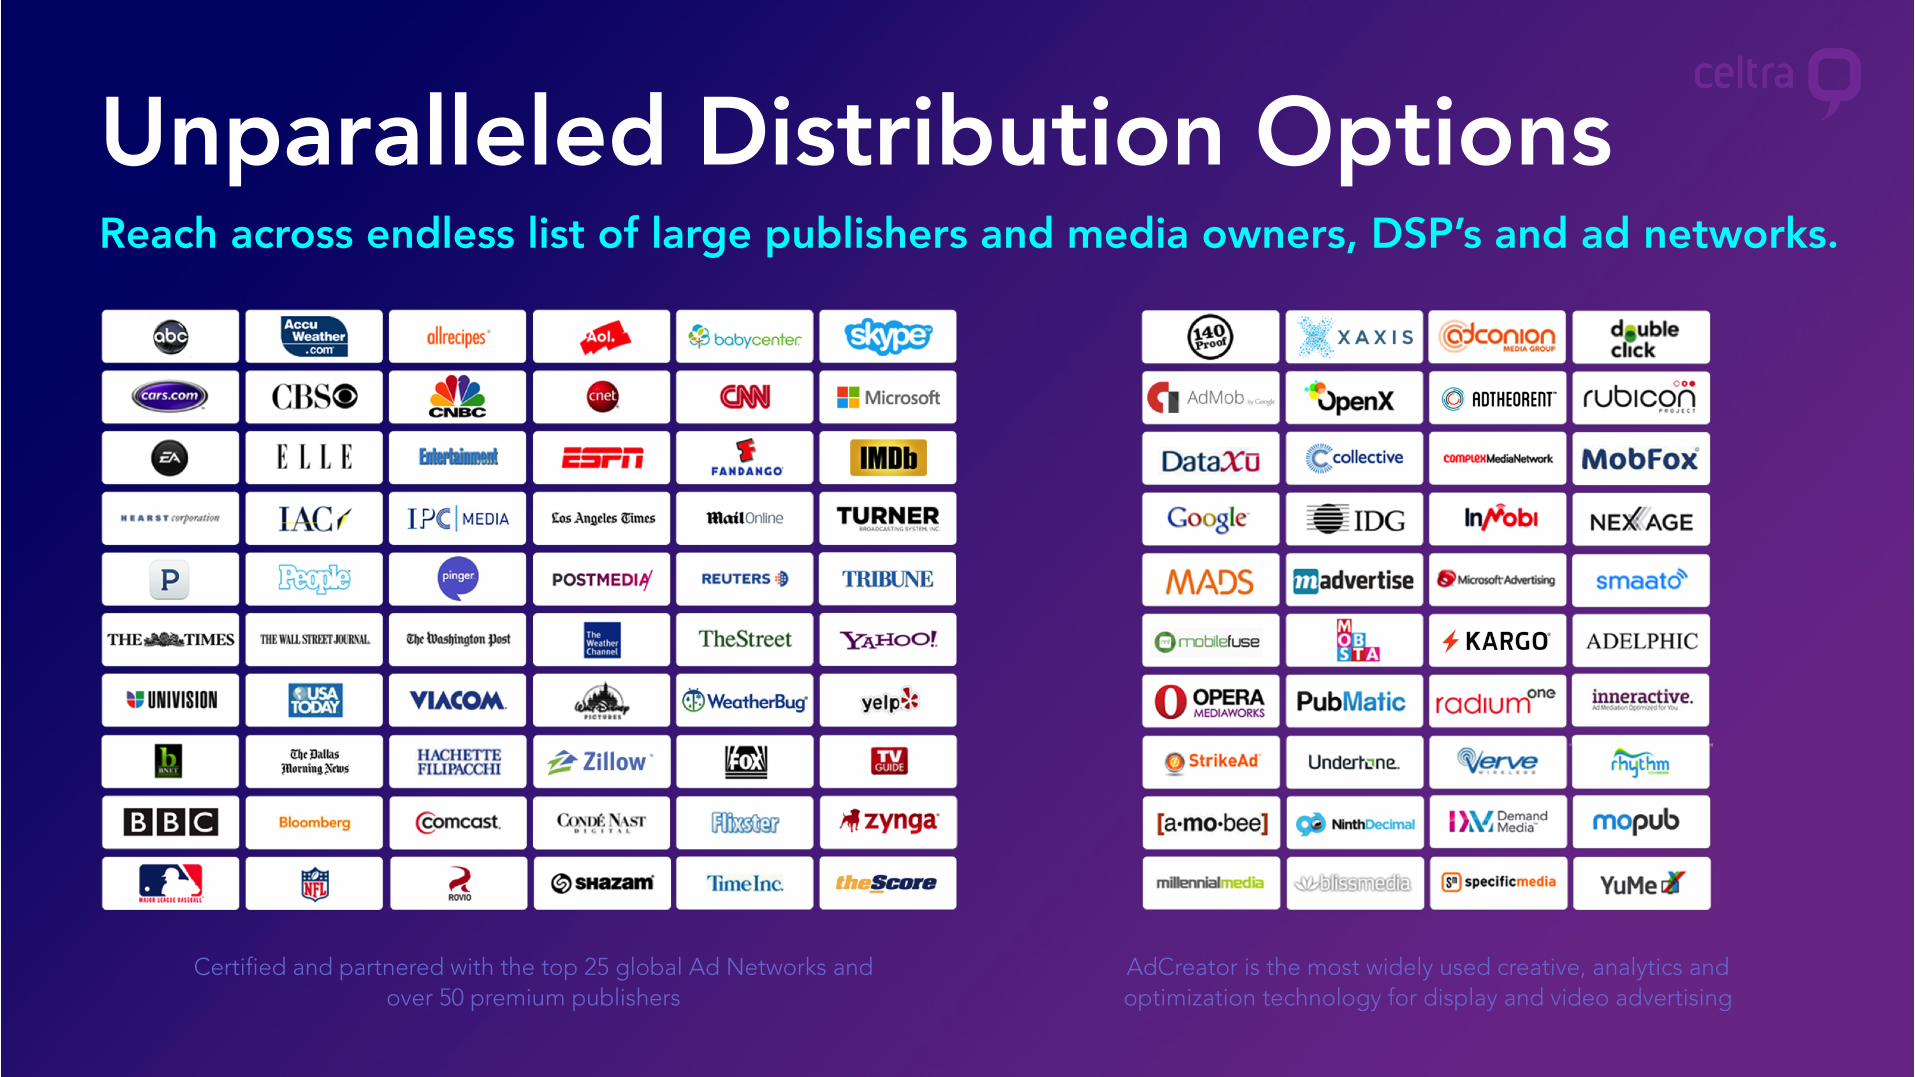
Unparalleled Distribution Options Reach across endless list of large publishers and media owners, DSP’s and ad networks.
Certified and partnered with the top 25 global Ad Networks and over 50 premium publishers
AdCreator is the most widely used creative, analytics and optimization technology for display and video advertising
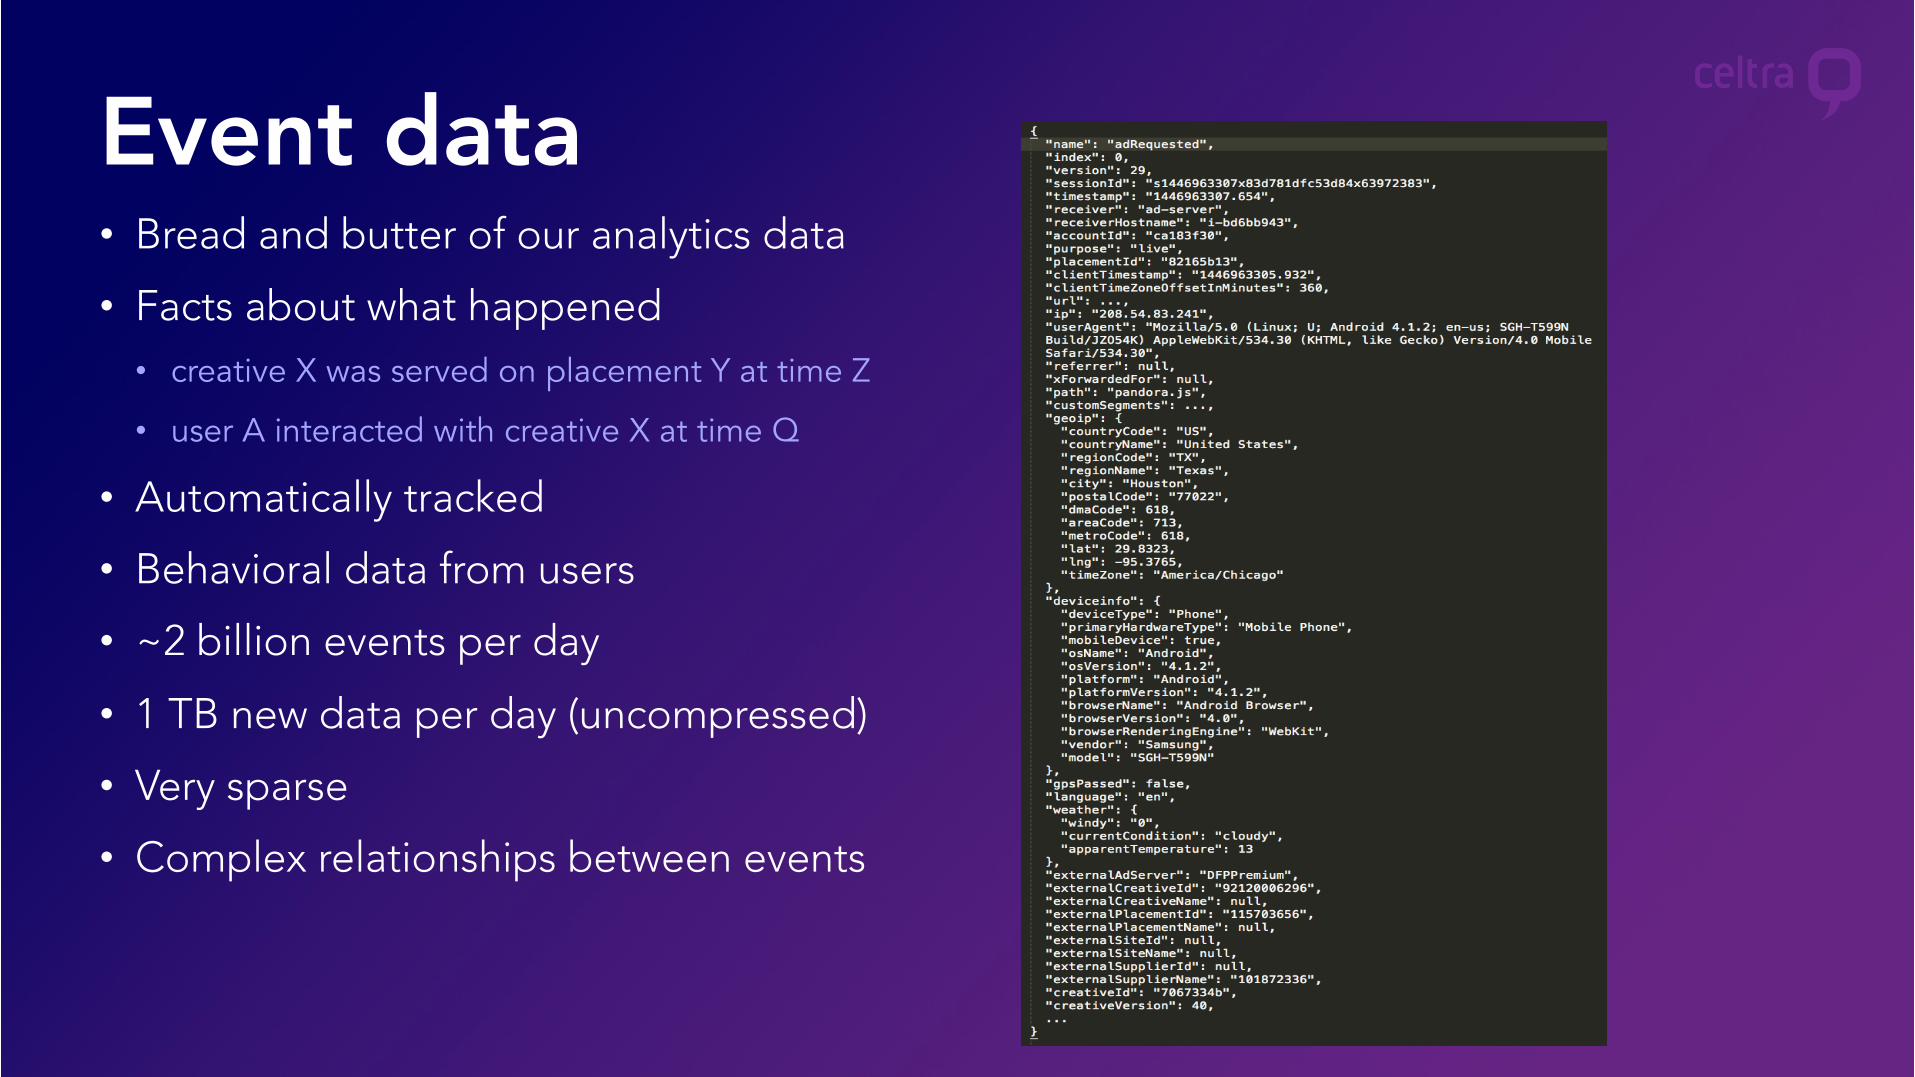
• Bread and butter of our analytics data
• Facts about what happened• creative X was served on placement Y at time Z
• user A interacted with creative X at time Q
• Automatically tracked
• Behavioral data from users
• ~2 billion events per day
• 1 TB new data per day (uncompressed)
• Very sparse
• Complex relationships between events
Event data
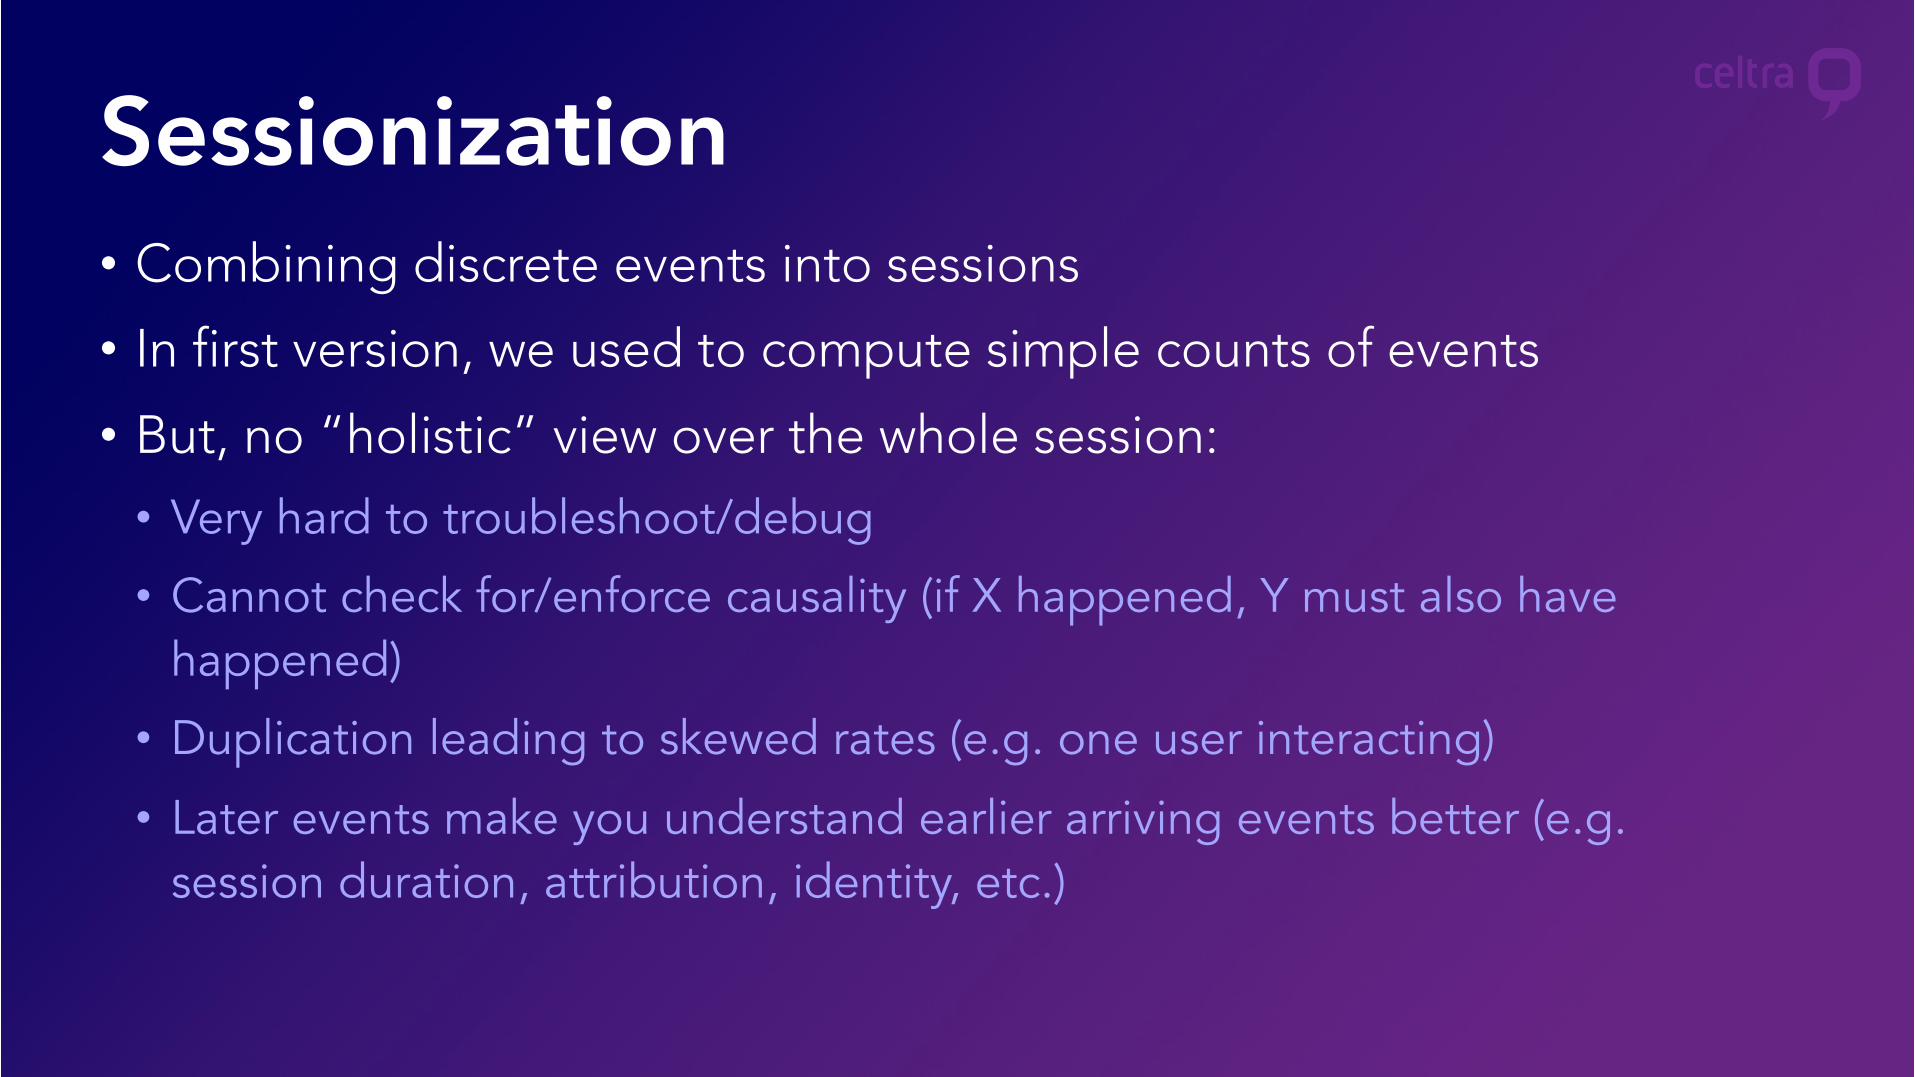
• Combining discrete events into sessions
• In first version, we used to compute simple counts of events
• But, no “holistic” view over the whole session:
• Very hard to troubleshoot/debug
• Cannot check for/enforce causality (if X happened, Y must also have happened)
• Duplication leading to skewed rates (e.g. one user interacting)
• Later events make you understand earlier arriving events better (e.g. session duration, attribution, identity, etc.)
Sessionization
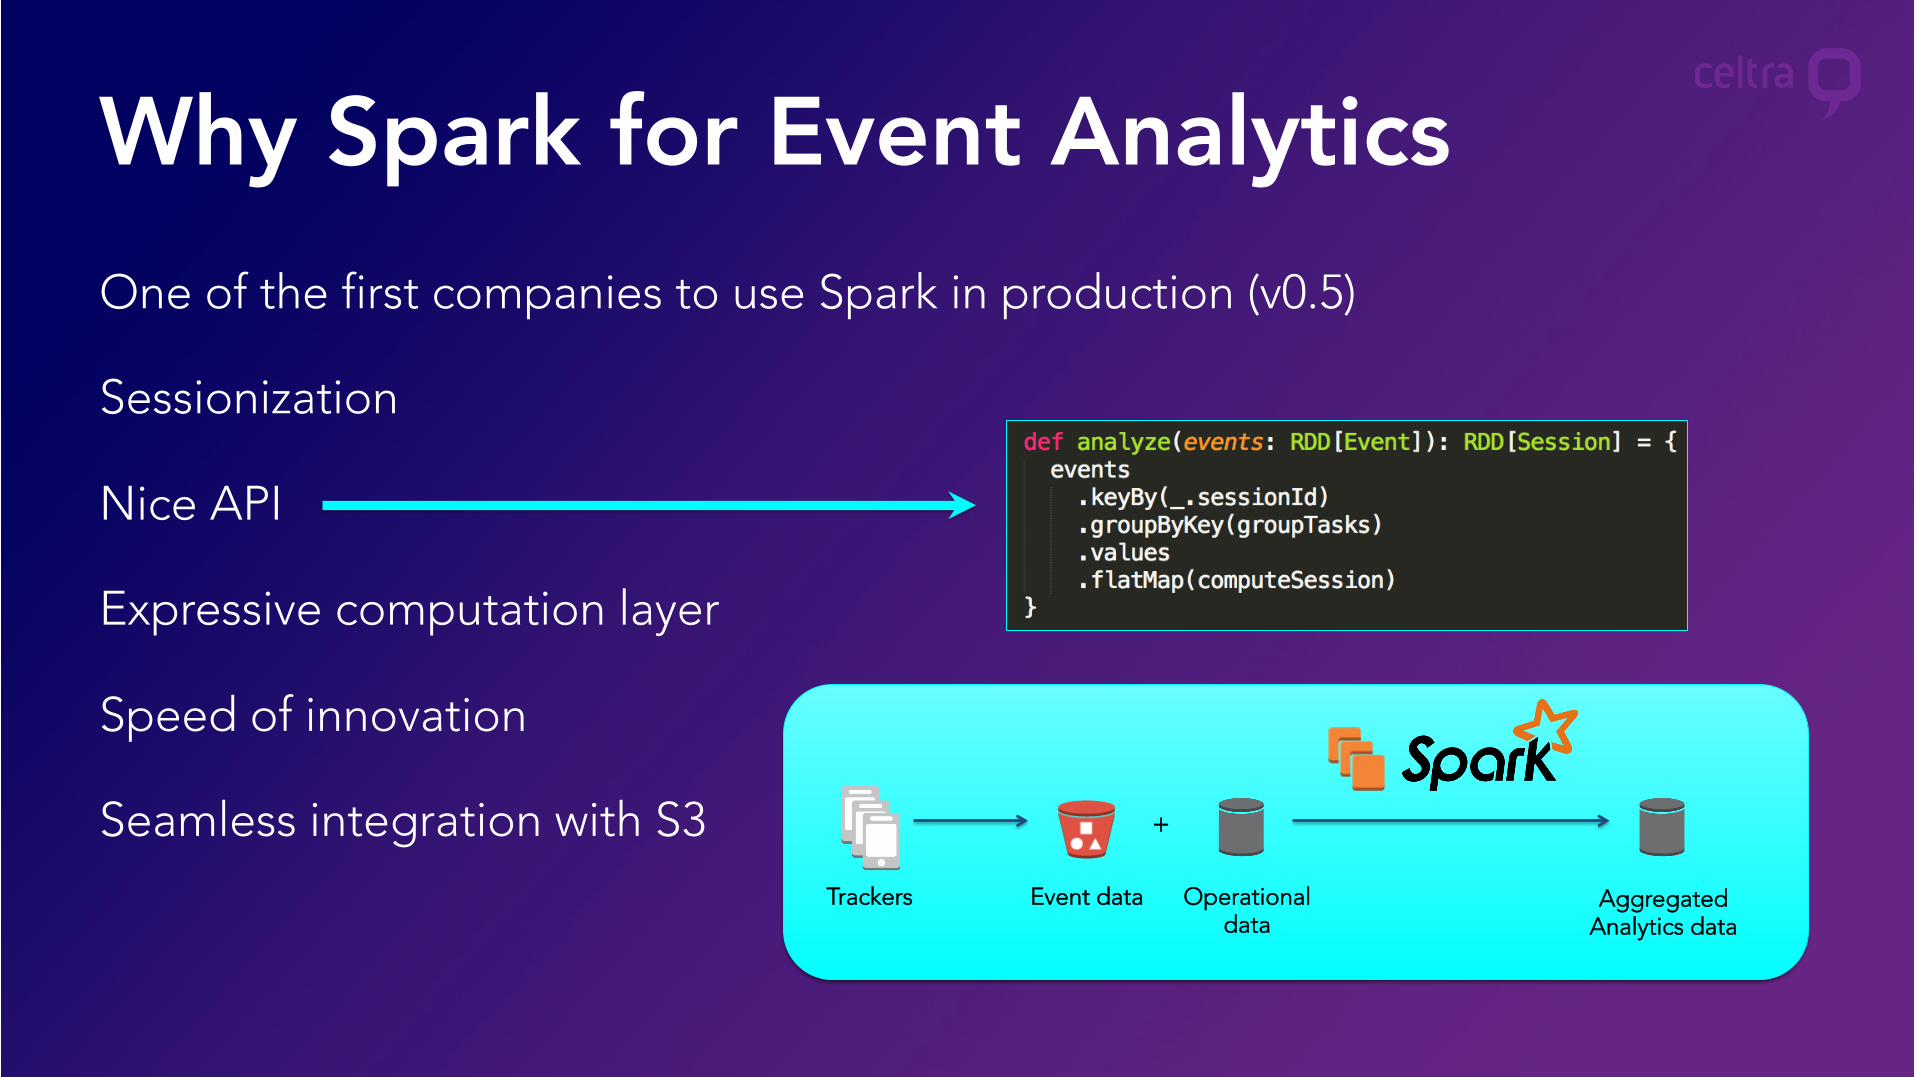
Why Spark for Event AnalyticsOne of the first companies to use Spark in production (v0.5)
Sessionization
Nice API
Expressive computation layer
Speed of innovation
Seamless integration with S3Aggregated
Analytics dataEvent data
+
Operational data
Trackers
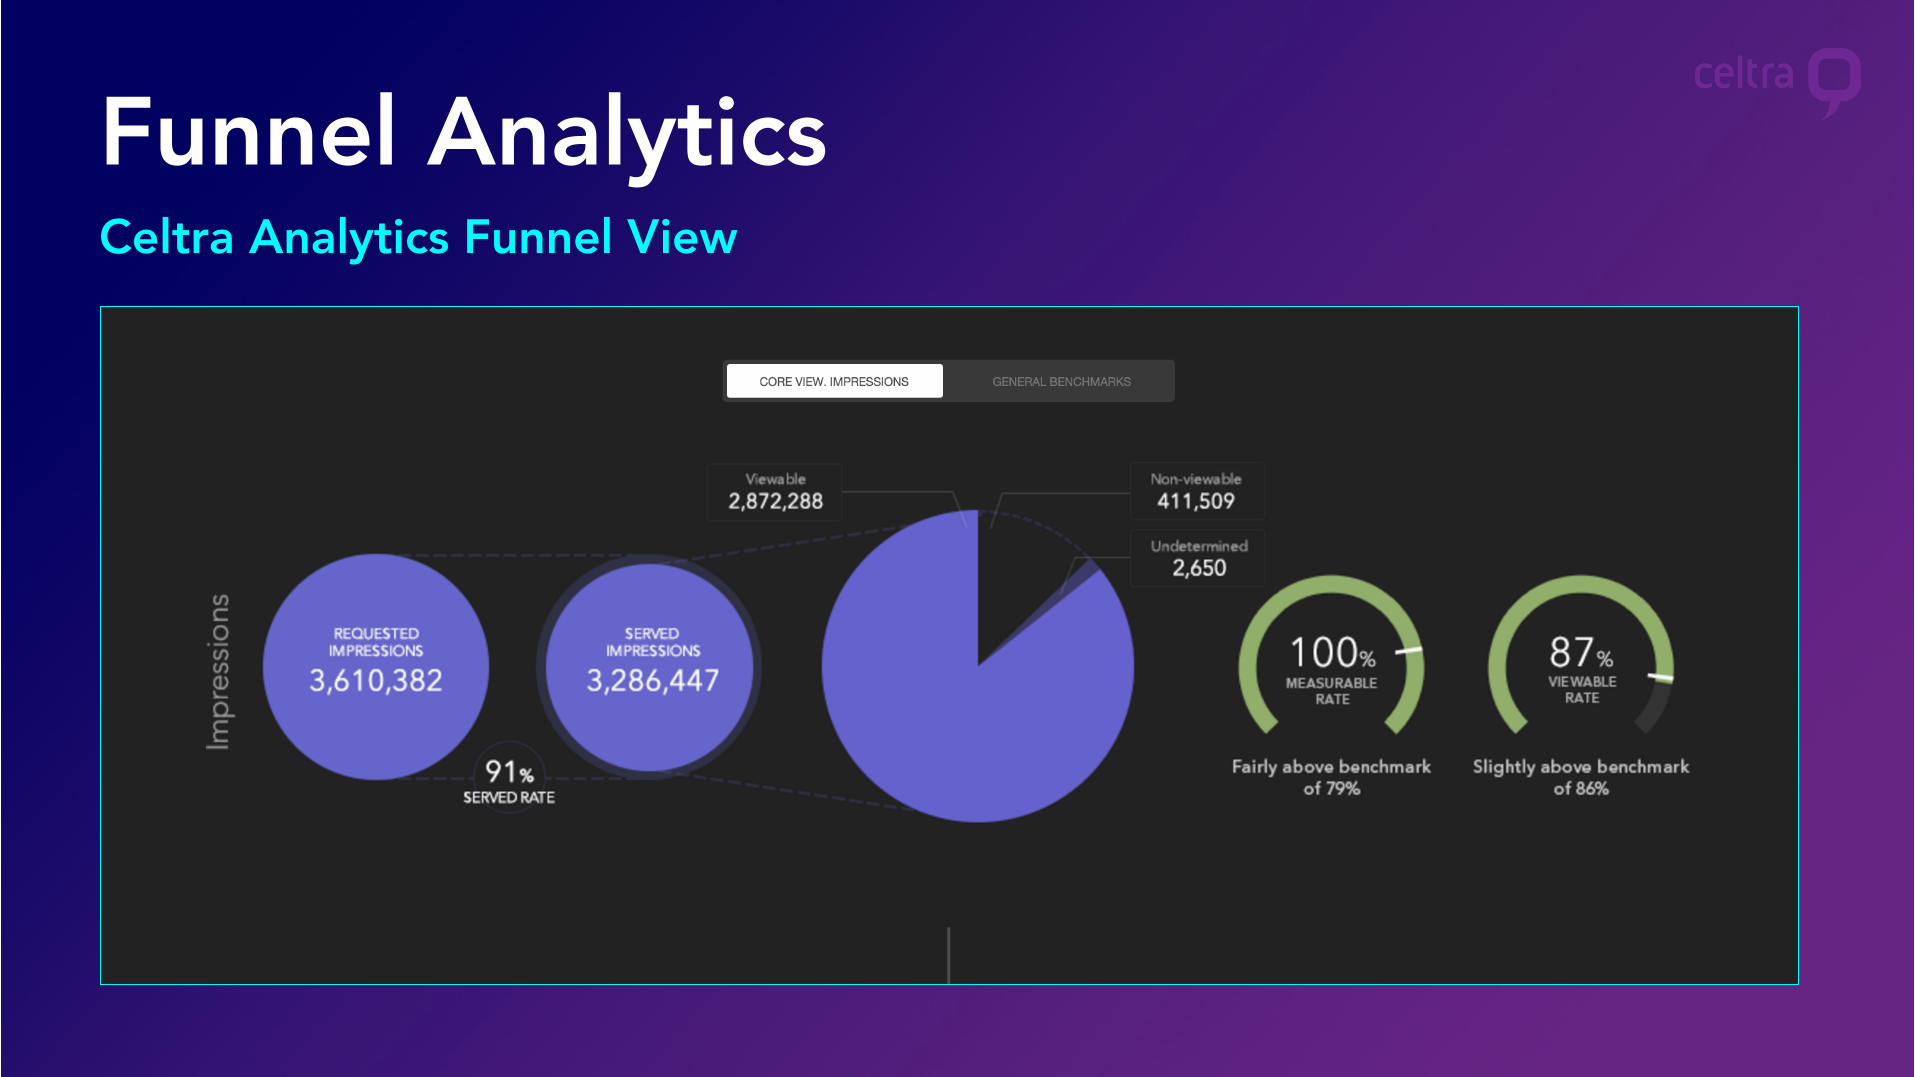
Funnel AnalyticsCeltra Analytics Funnel View
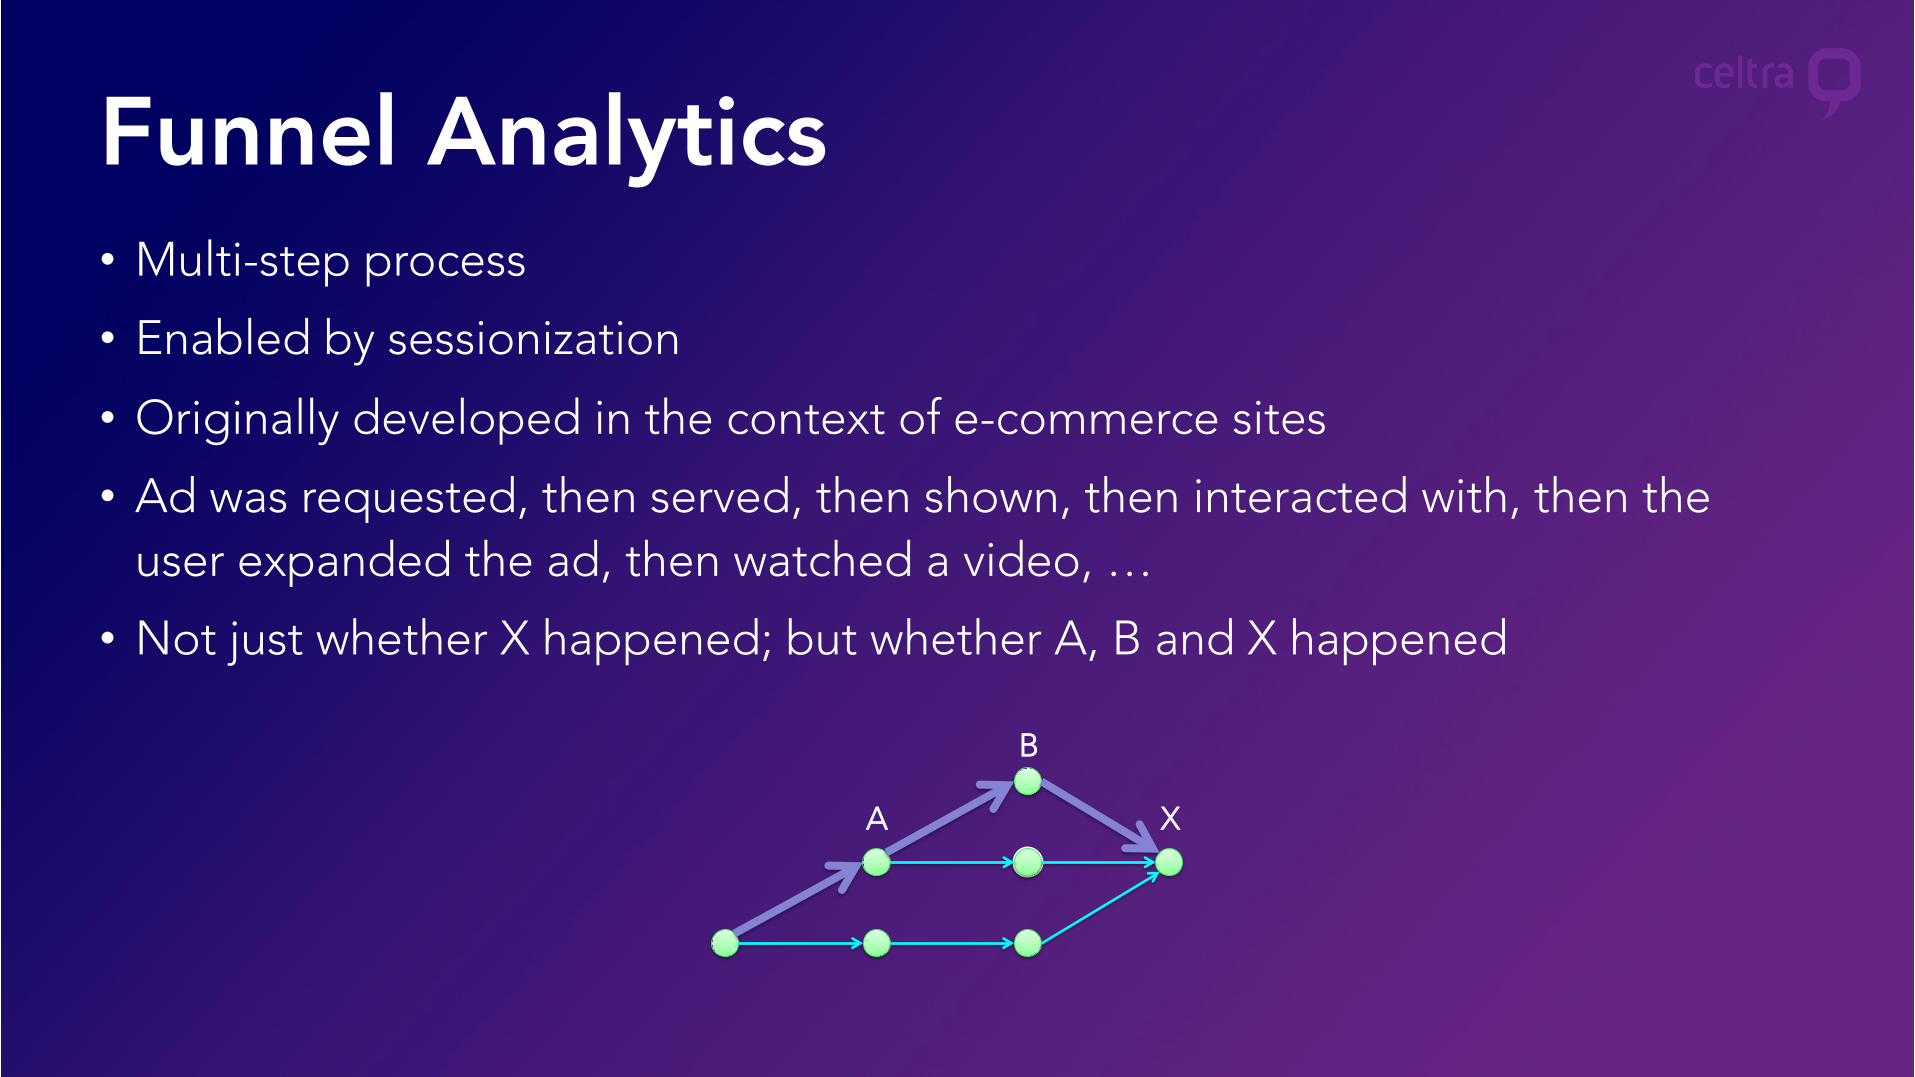
• Multi-step process
• Enabled by sessionization
• Originally developed in the context of e-commerce sites
• Ad was requested, then served, then shown, then interacted with, then the user expanded the ad, then watched a video, …
• Not just whether X happened; but whether A, B and X happened
Funnel Analytics
XA
B
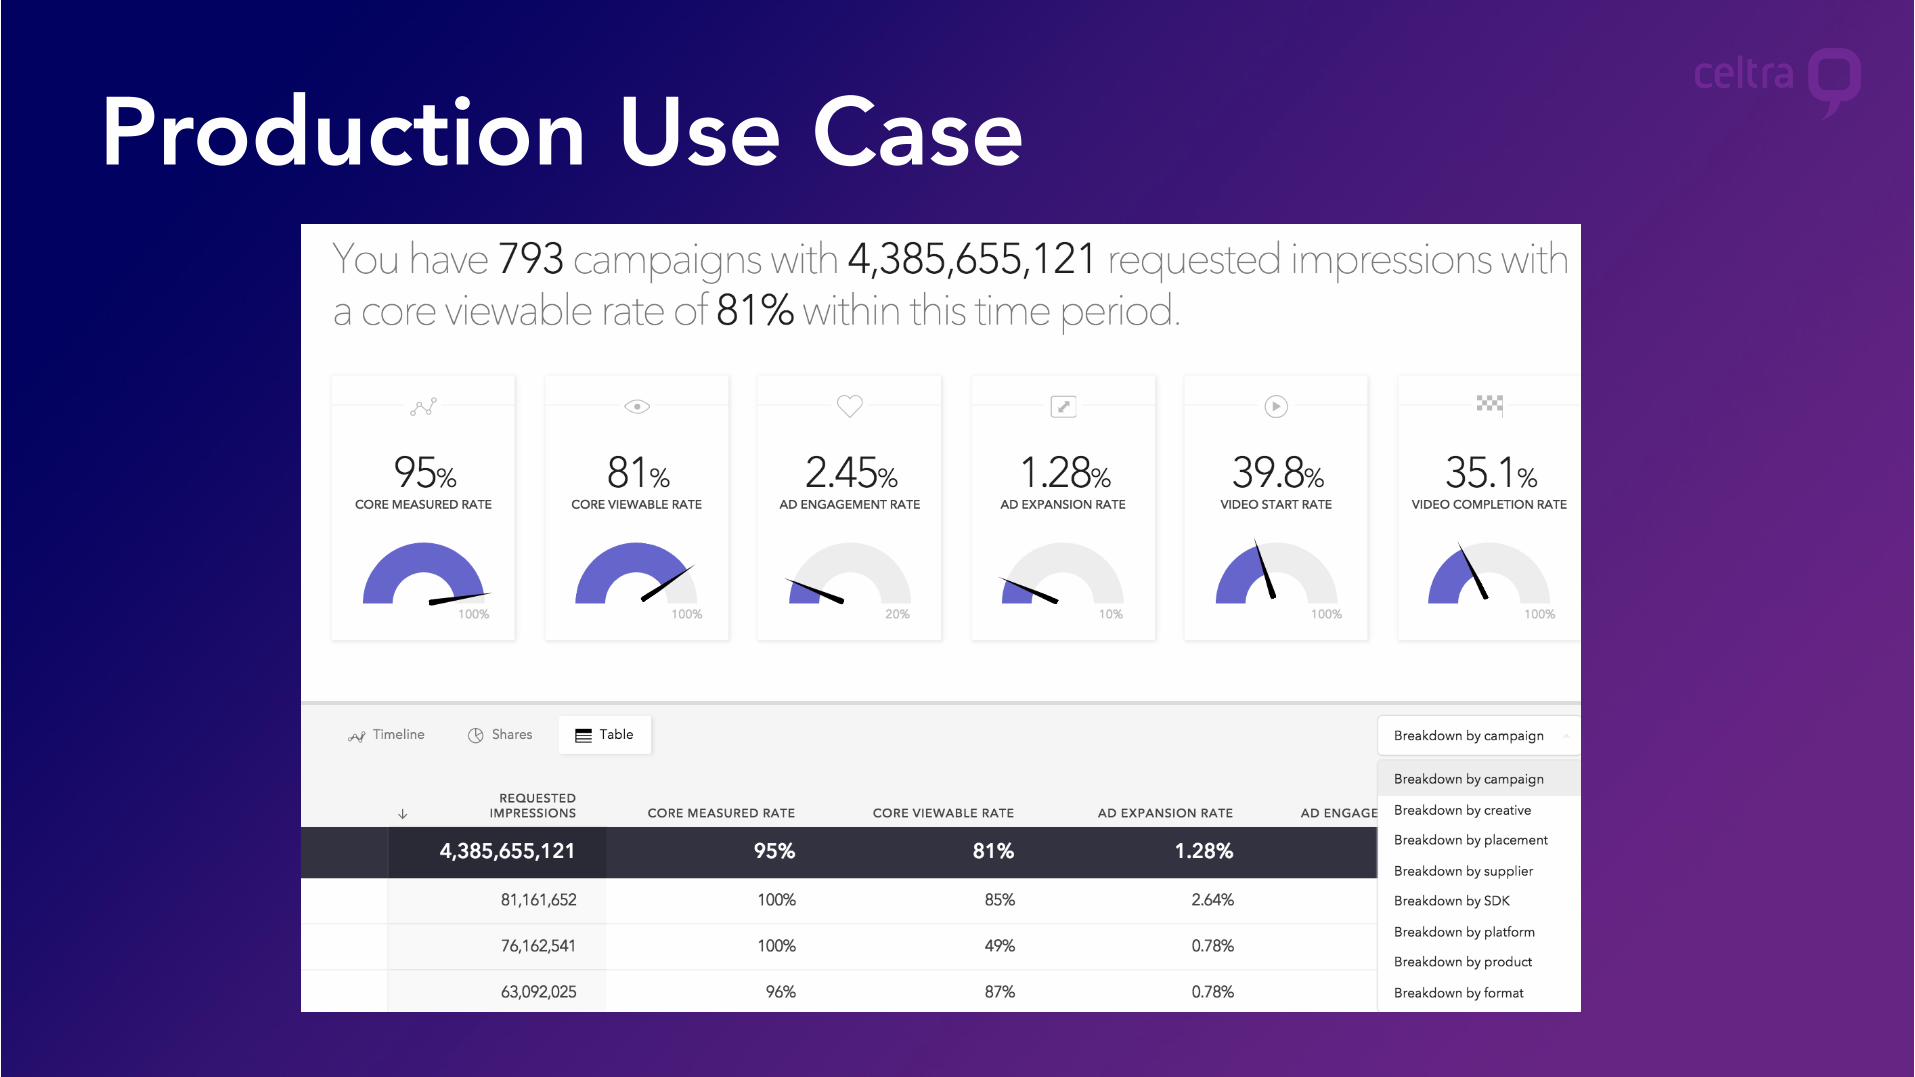
Production Use Case

But that’s justthe beginning
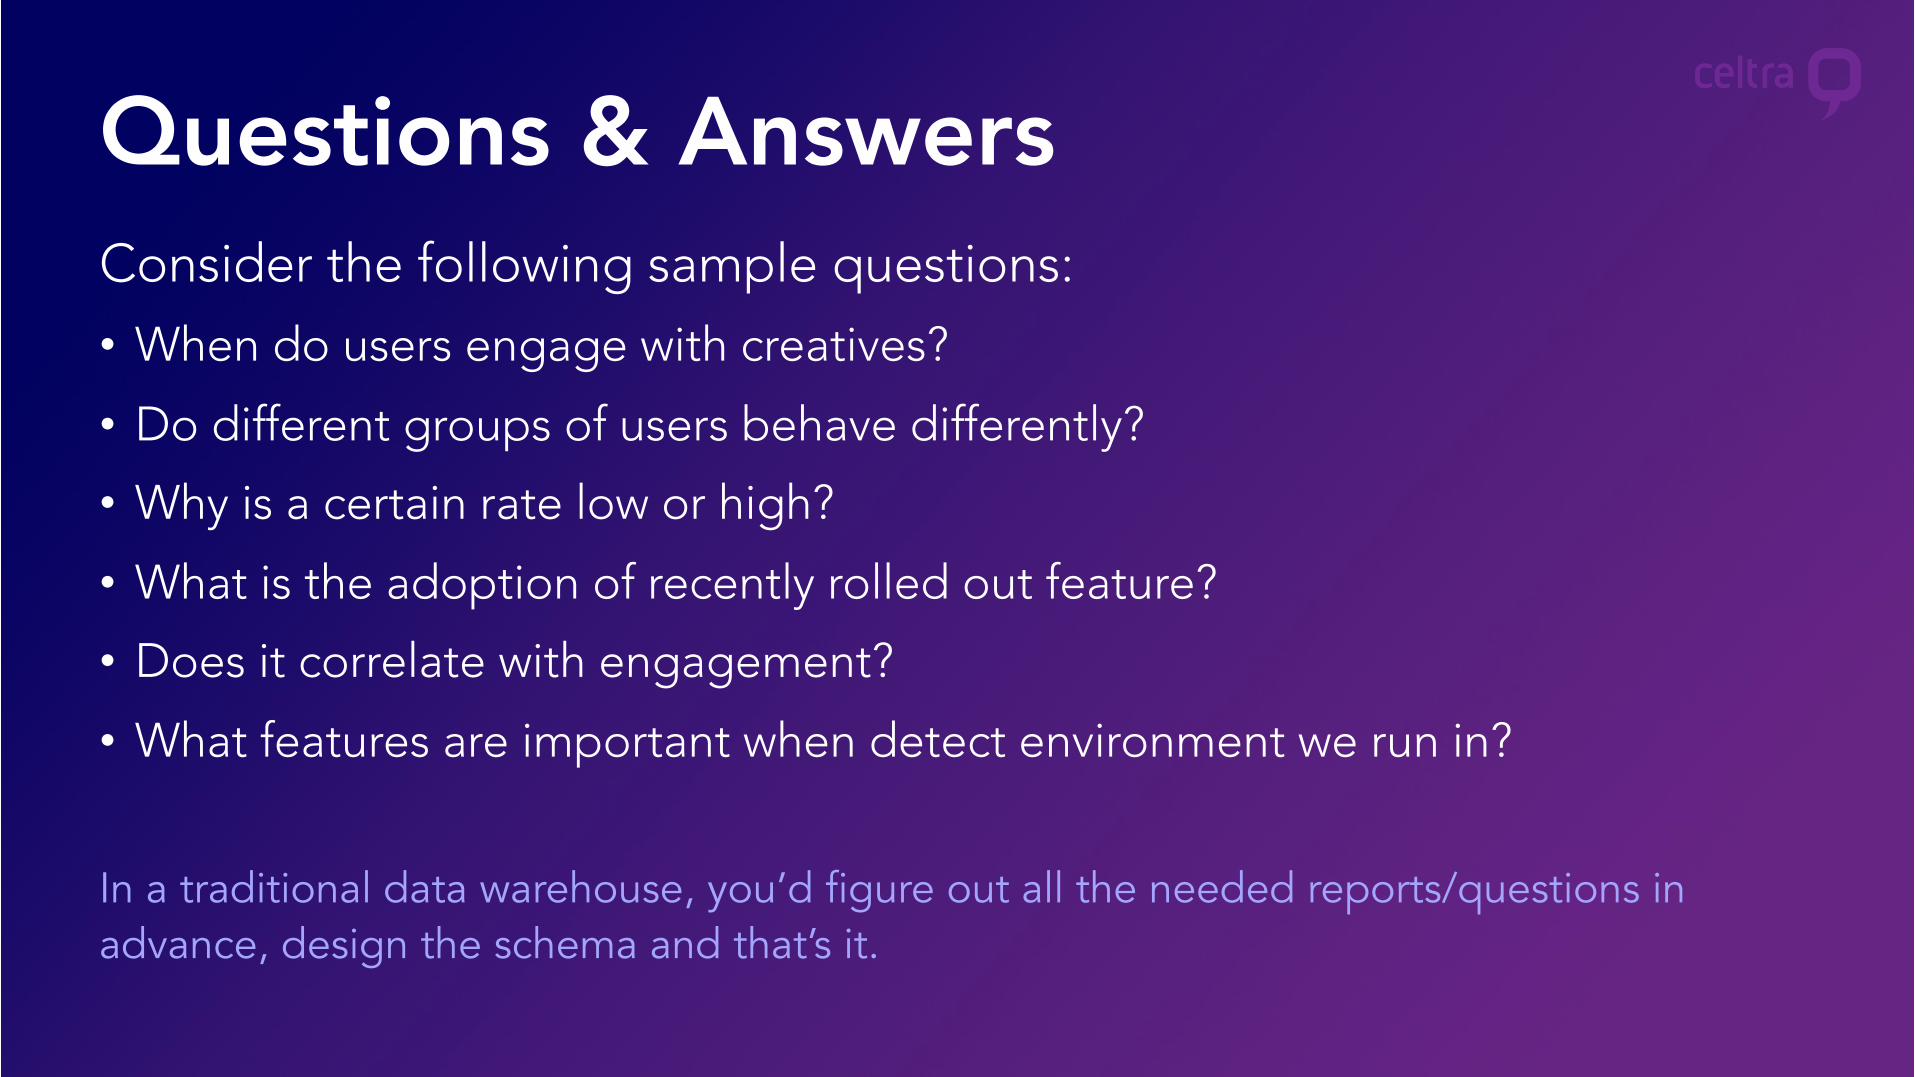
Consider the following sample questions:
• When do users engage with creatives?
• Do different groups of users behave differently?
• Why is a certain rate low or high?
• What is the adoption of recently rolled out feature?
• Does it correlate with engagement?
• What features are important when detect environment we run in?
In a traditional data warehouse, you’d figure out all the needed reports/questions in advance, design the schema and that’s it.
Questions & Answers
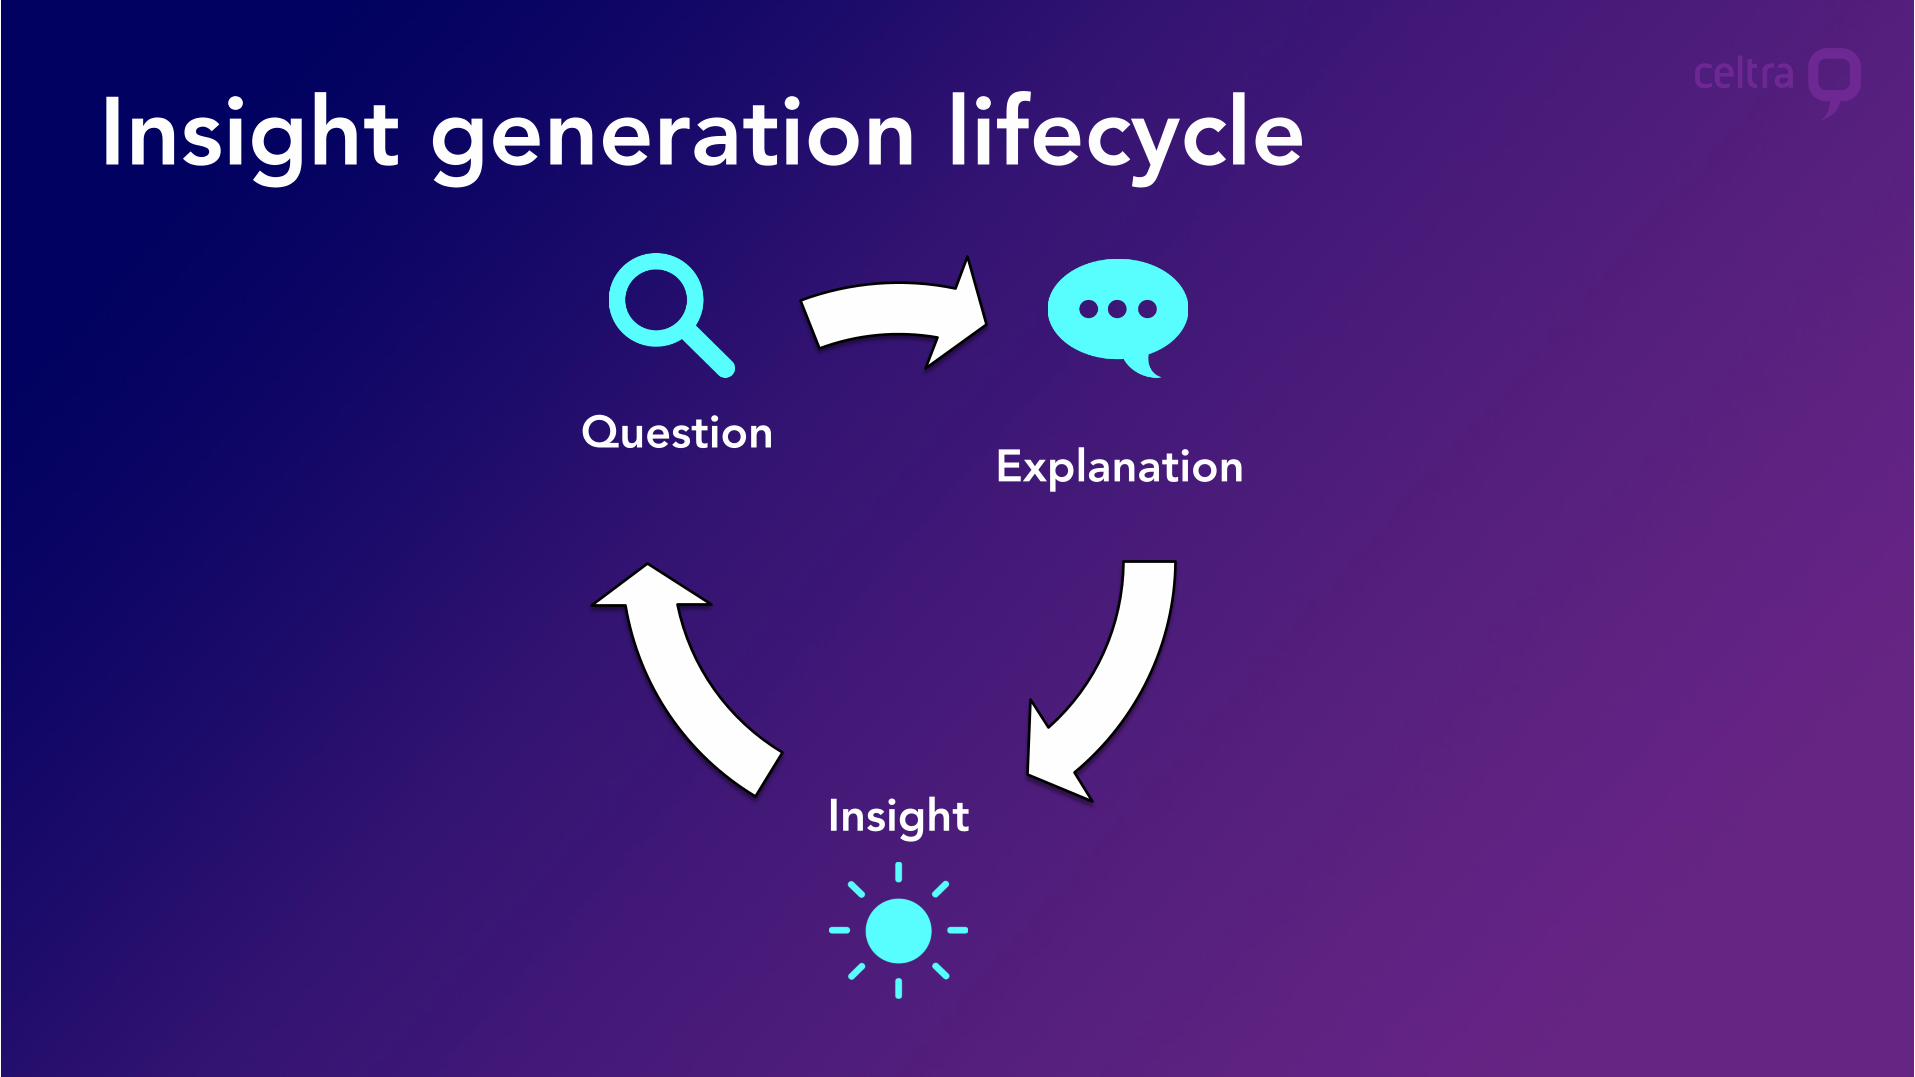
Explanation
Insight
Question
Insight generation lifecycle
1. Ad-hoc queries for campaigns• Databricks allows us to easily run our increasingly complex ad-hoc queries
2. Exploratory data analysis• Derive value from data as soon as possible
3. Troubleshooting• The bar for reliability and correctness is very high
• Why something broke? Why is certain rate low/high?
• Quickly identify the root cause of production failures and minimize system downtime
Use cases
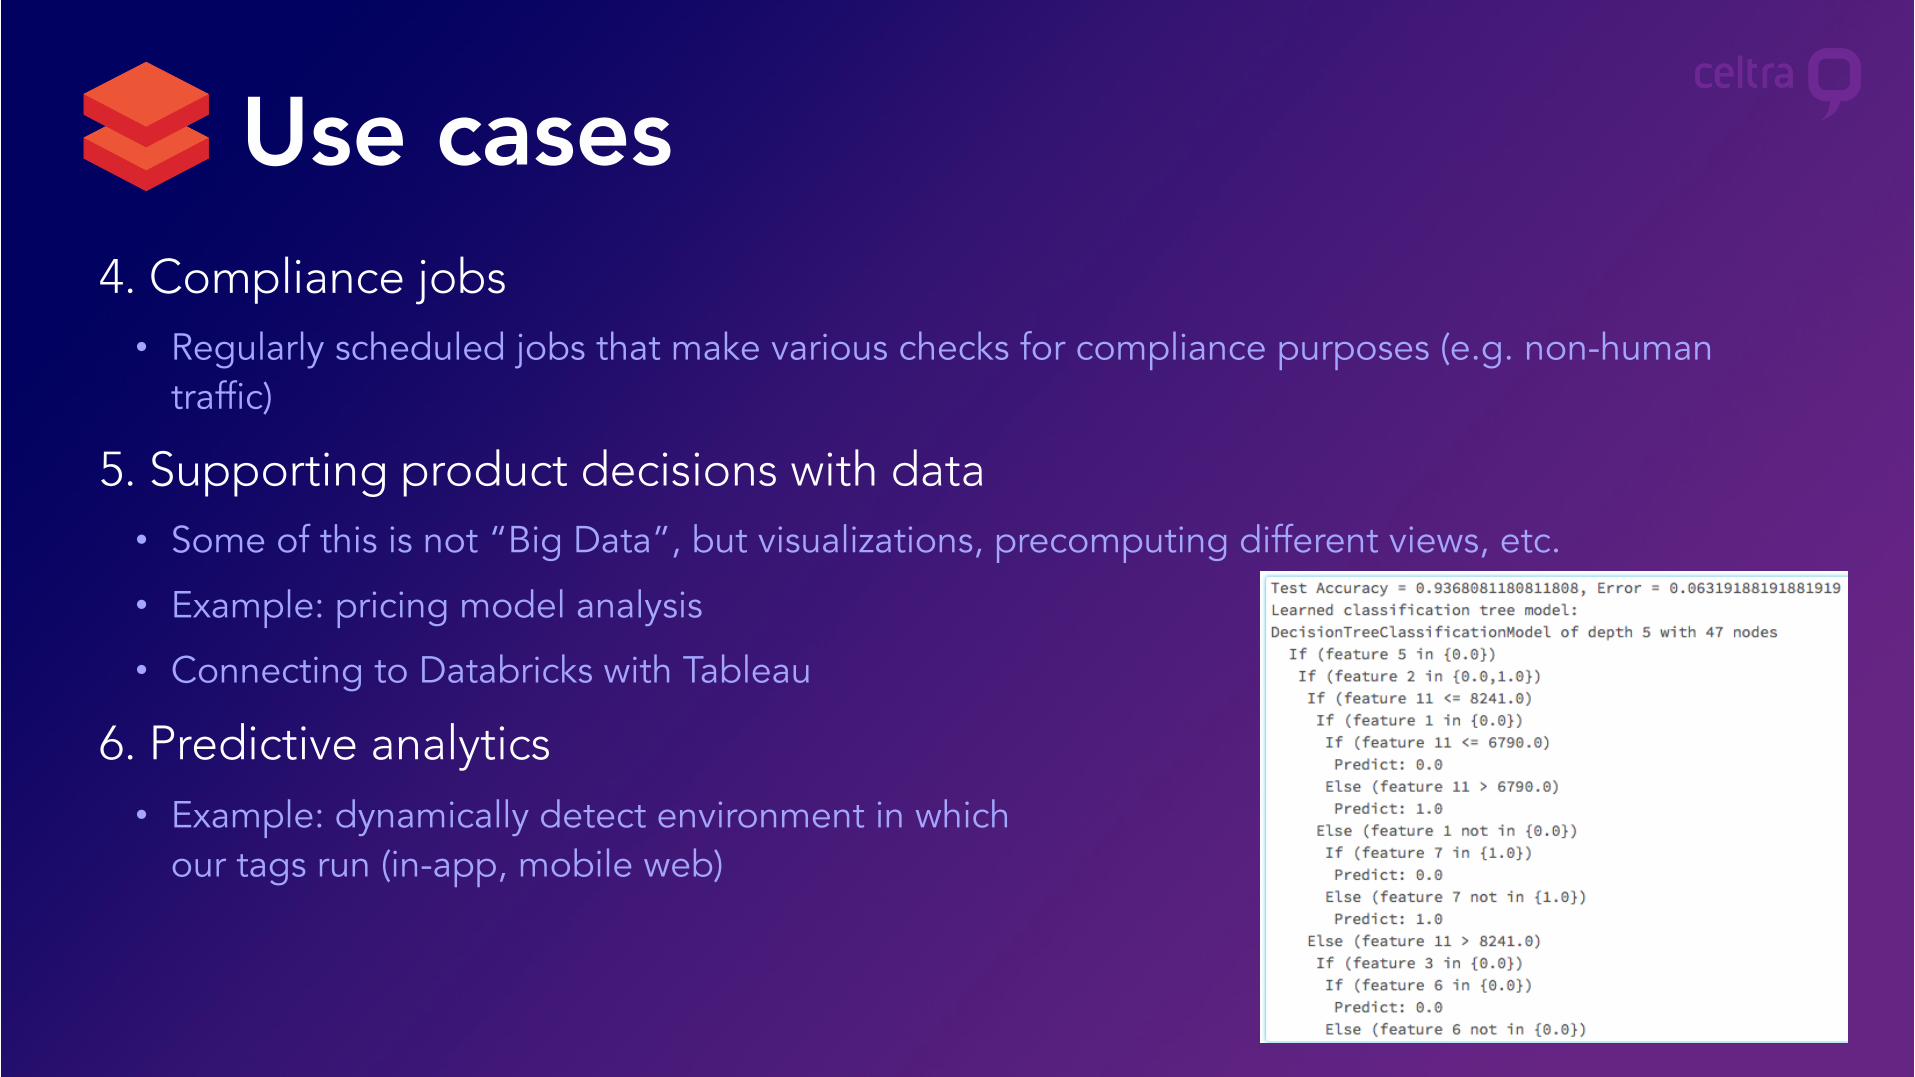
4. Compliance jobs• Regularly scheduled jobs that make various checks for compliance purposes (e.g. non-human
traffic)
5. Supporting product decisions with data• Some of this is not “Big Data”, but visualizations, precomputing different views, etc.
• Example: pricing model analysis
• Connecting to Databricks with Tableau
6. Predictive analytics• Example: dynamically detect environment in which
our tags run (in-app, mobile web)
Use cases
• Need flexibility, not provided by precomputed aggregates (uniques, order statistics, etc.)
• Answers to questions that existing data model does not support (Demo)
• Short development cycles and faster experimentation
• Complex ecosystem + Wide creative capabilities = Diverse data
• Data focused on the engagements of consumers with our clients’ ads • Constantly exploring new ways to leverage this information to improve our offering
• Visualizations• Important aspect of big data mining
• In 9 out of 10 notebooks, there is at least one visualization
Exploratory data analysis
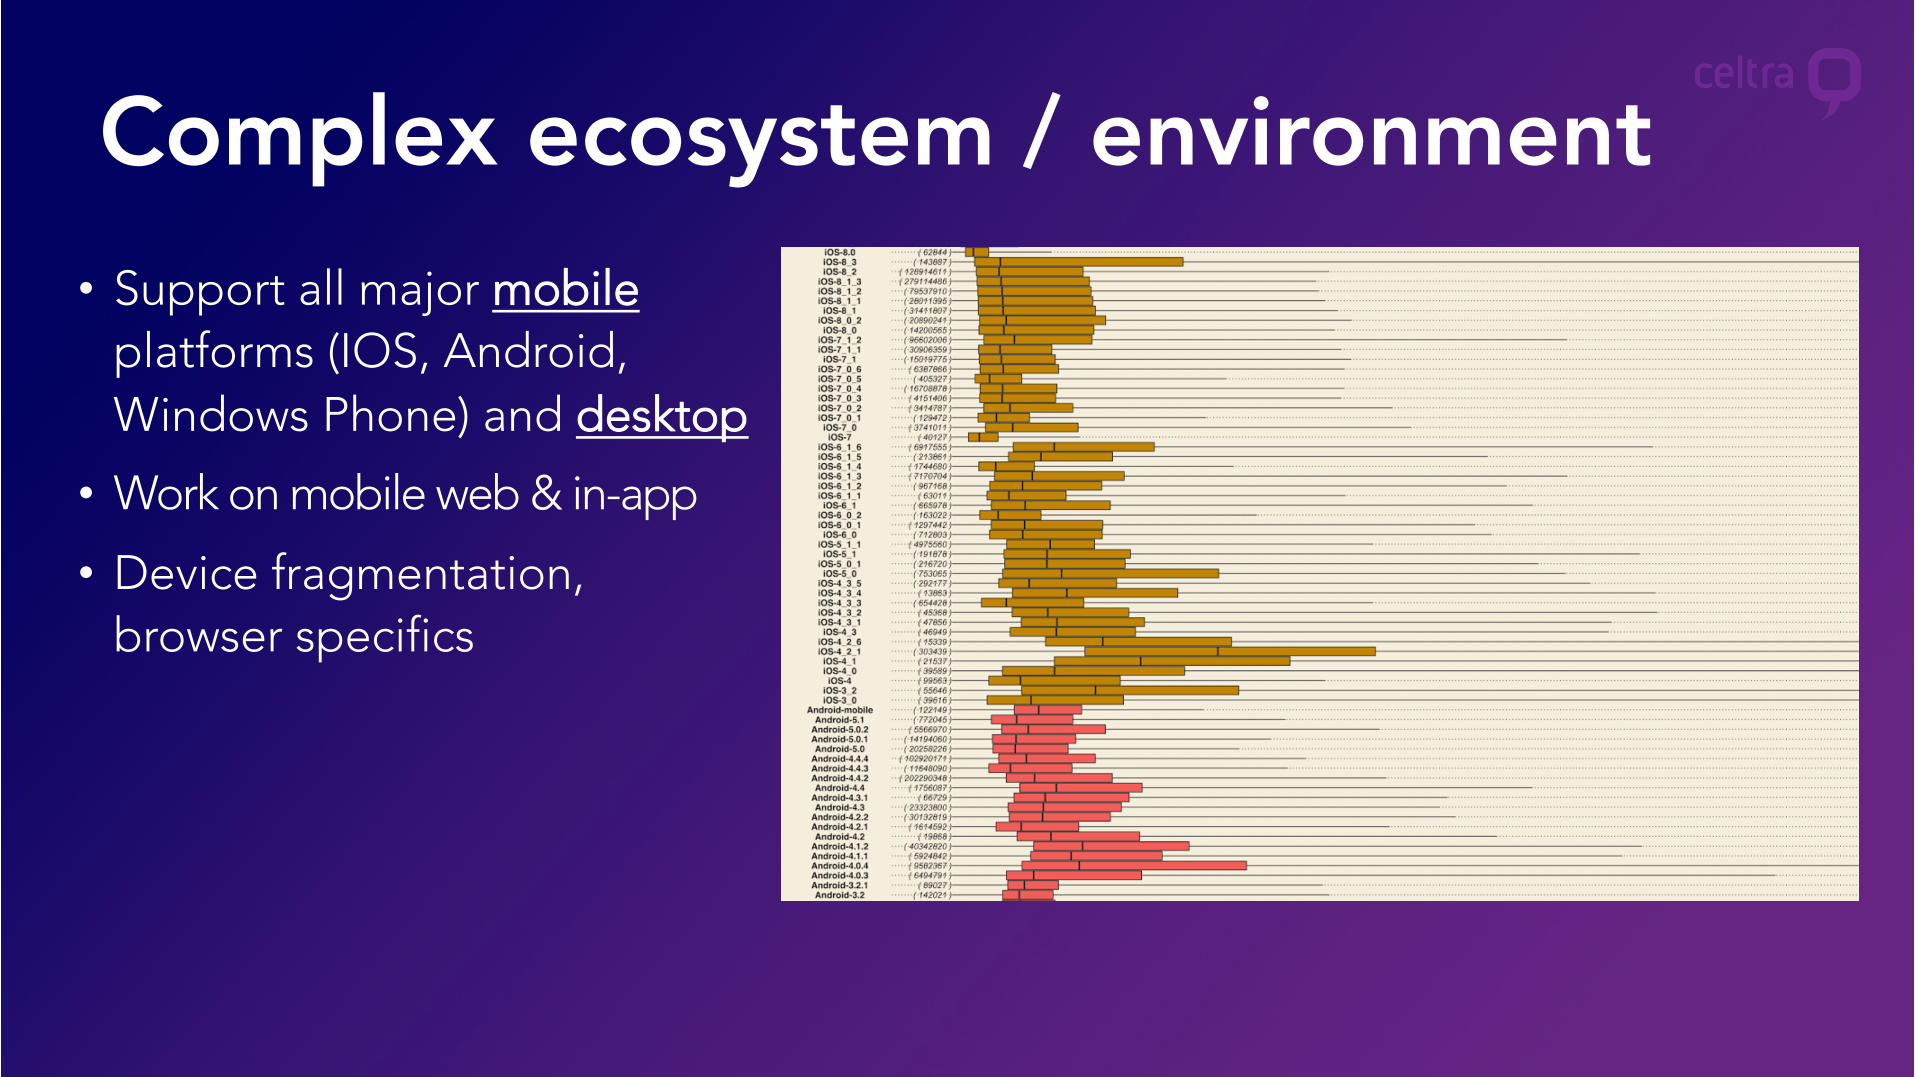
Complex ecosystem / environment• Support all major mobile
platforms (IOS, Android, Windows Phone) and desktop
• Work on mobile web & in-app
• Device fragmentation, browser specifics
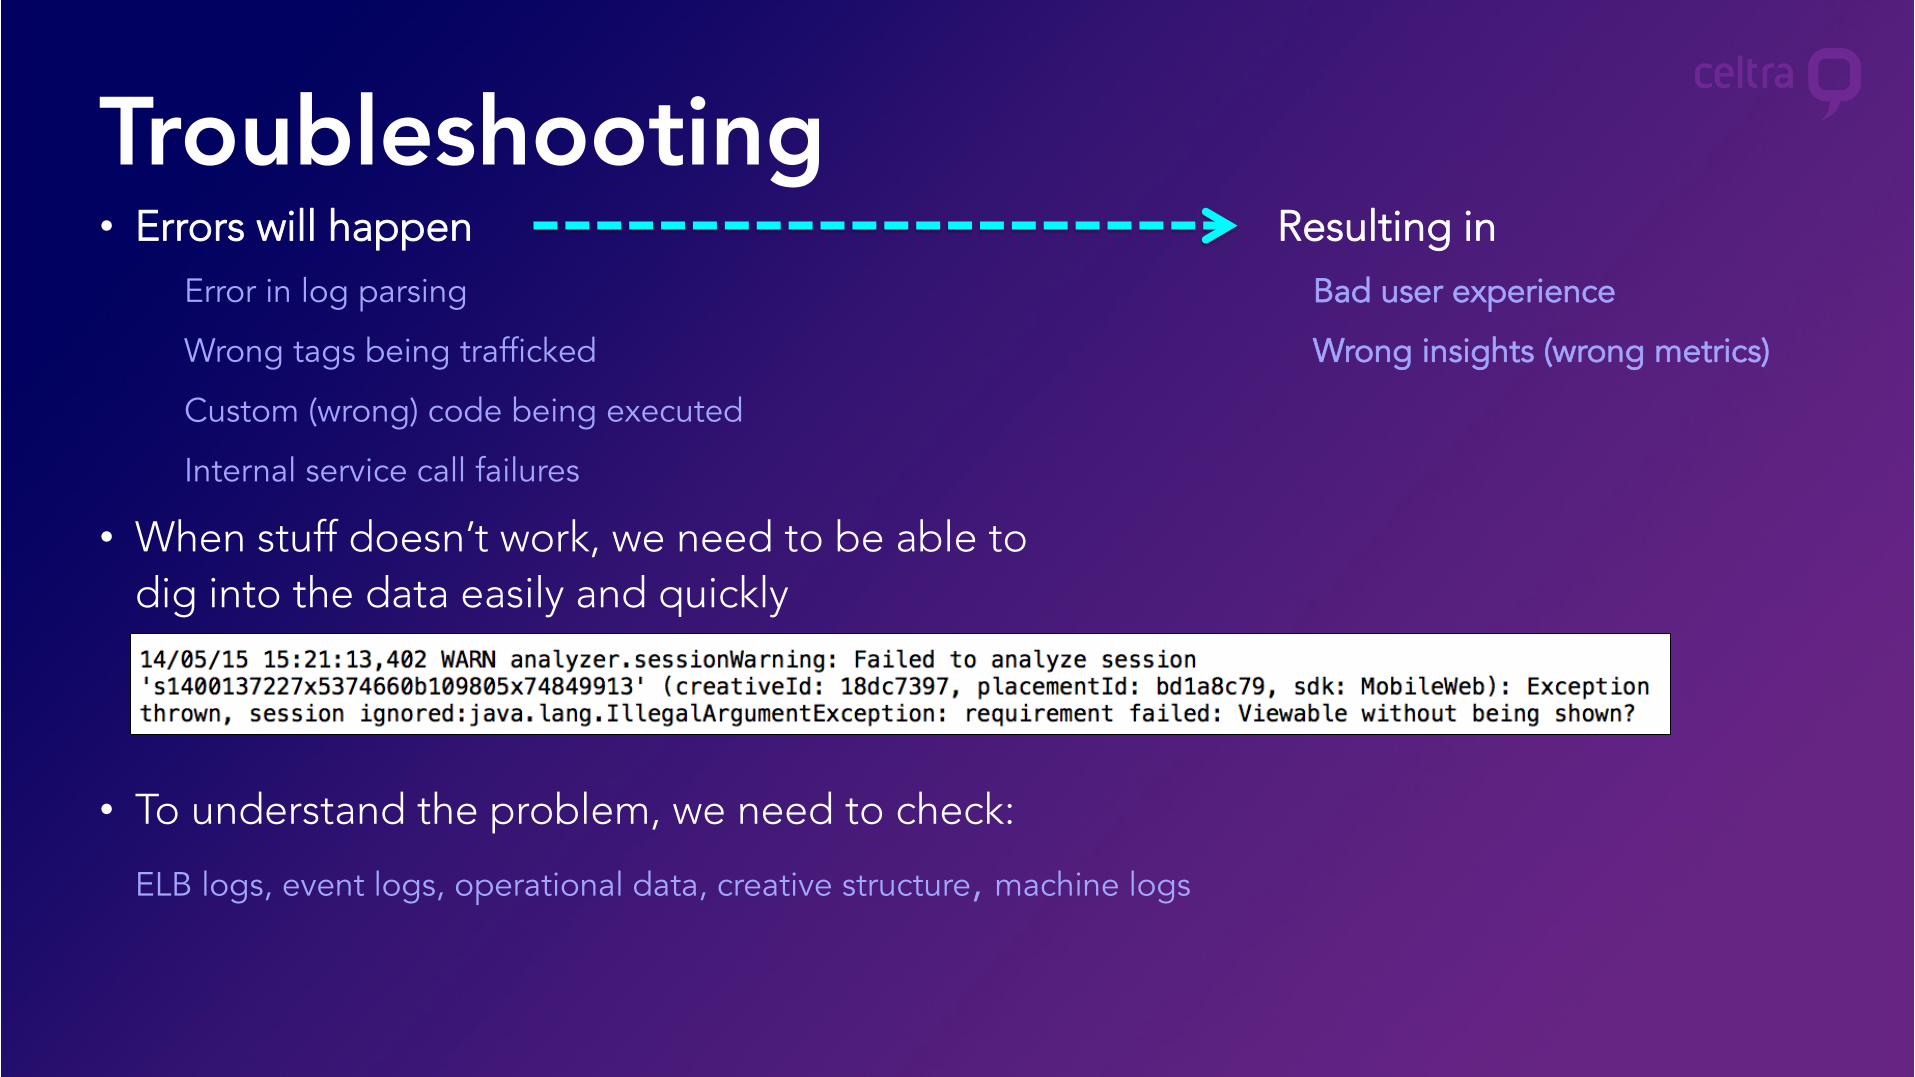
• Errors will happenError in log parsing
Wrong tags being trafficked
Custom (wrong) code being executed
Internal service call failures
• When stuff doesn’t work, we need to be able to dig into the data easily and quickly
• To understand the problem, we need to check:
ELB logs, event logs, operational data, creative structure, machine logs
TroubleshootingResulting in
Bad user experience
Wrong insights (wrong metrics)
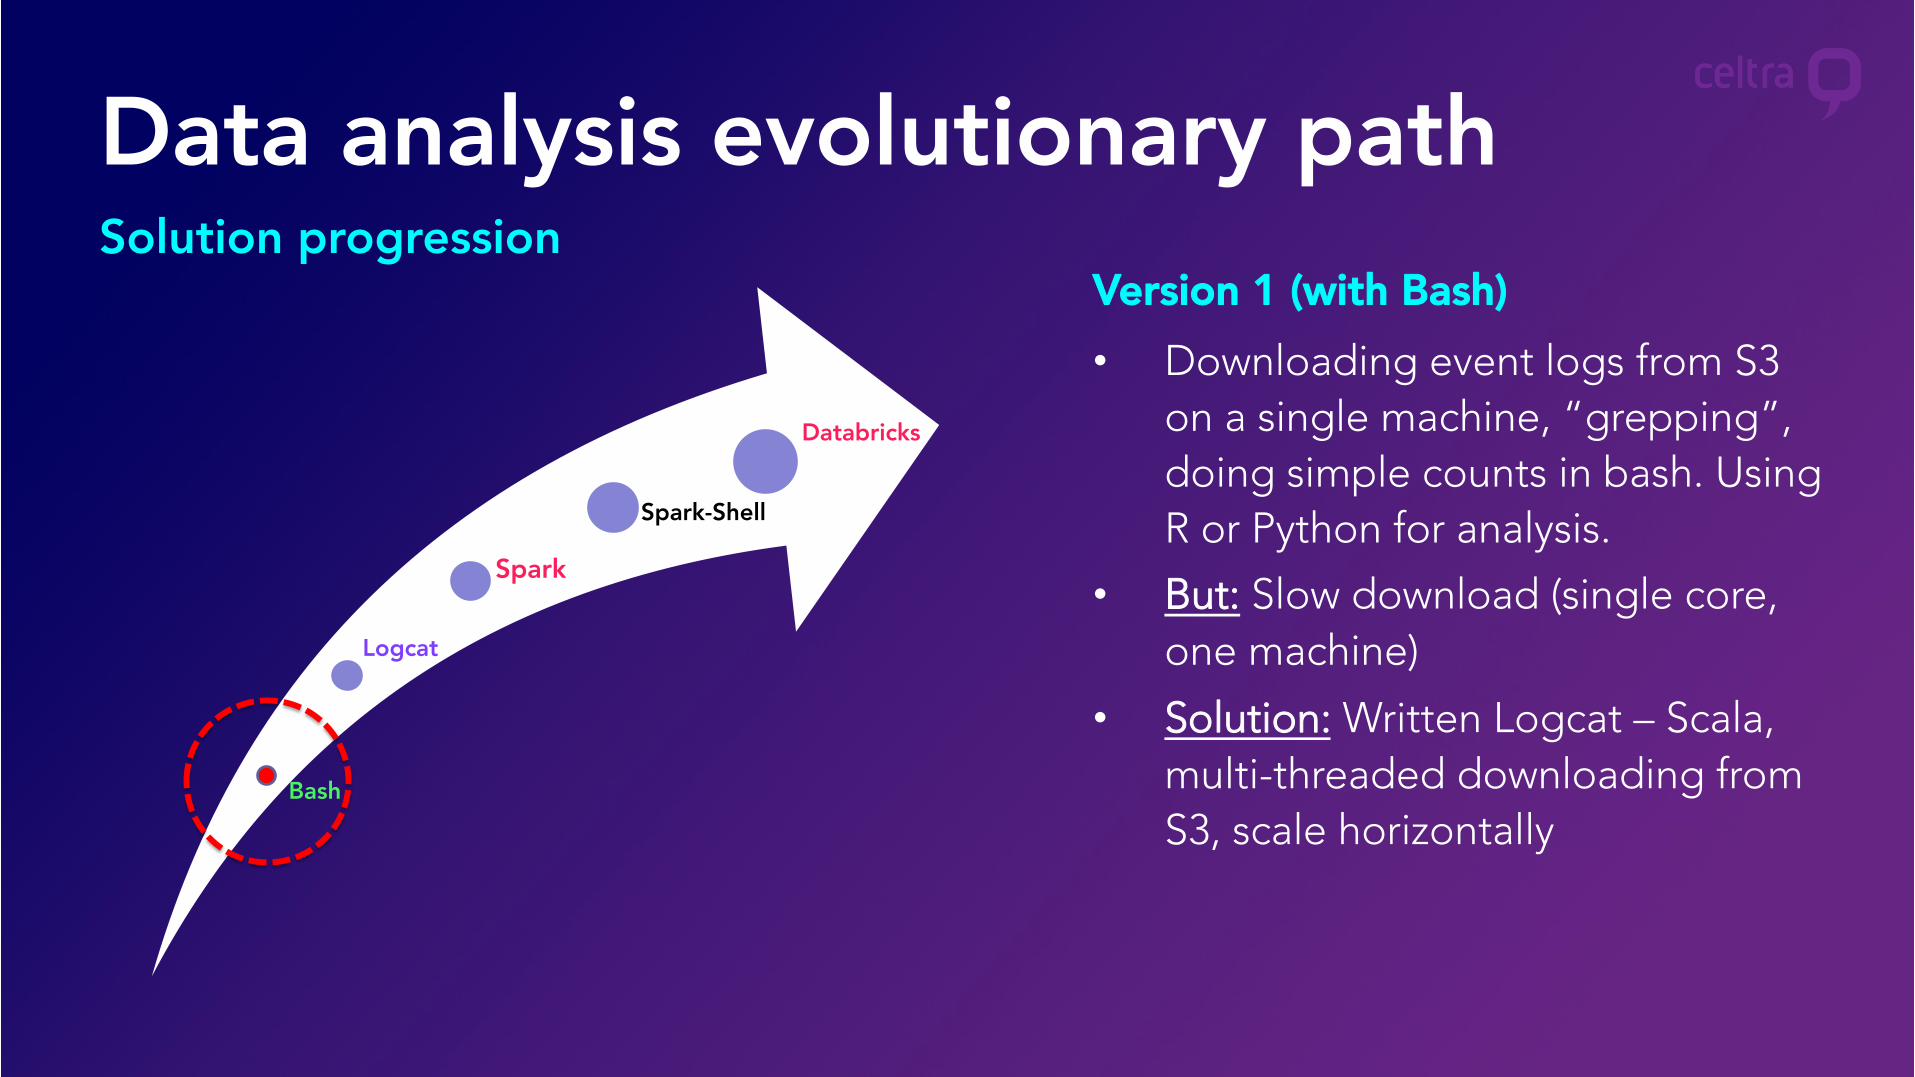
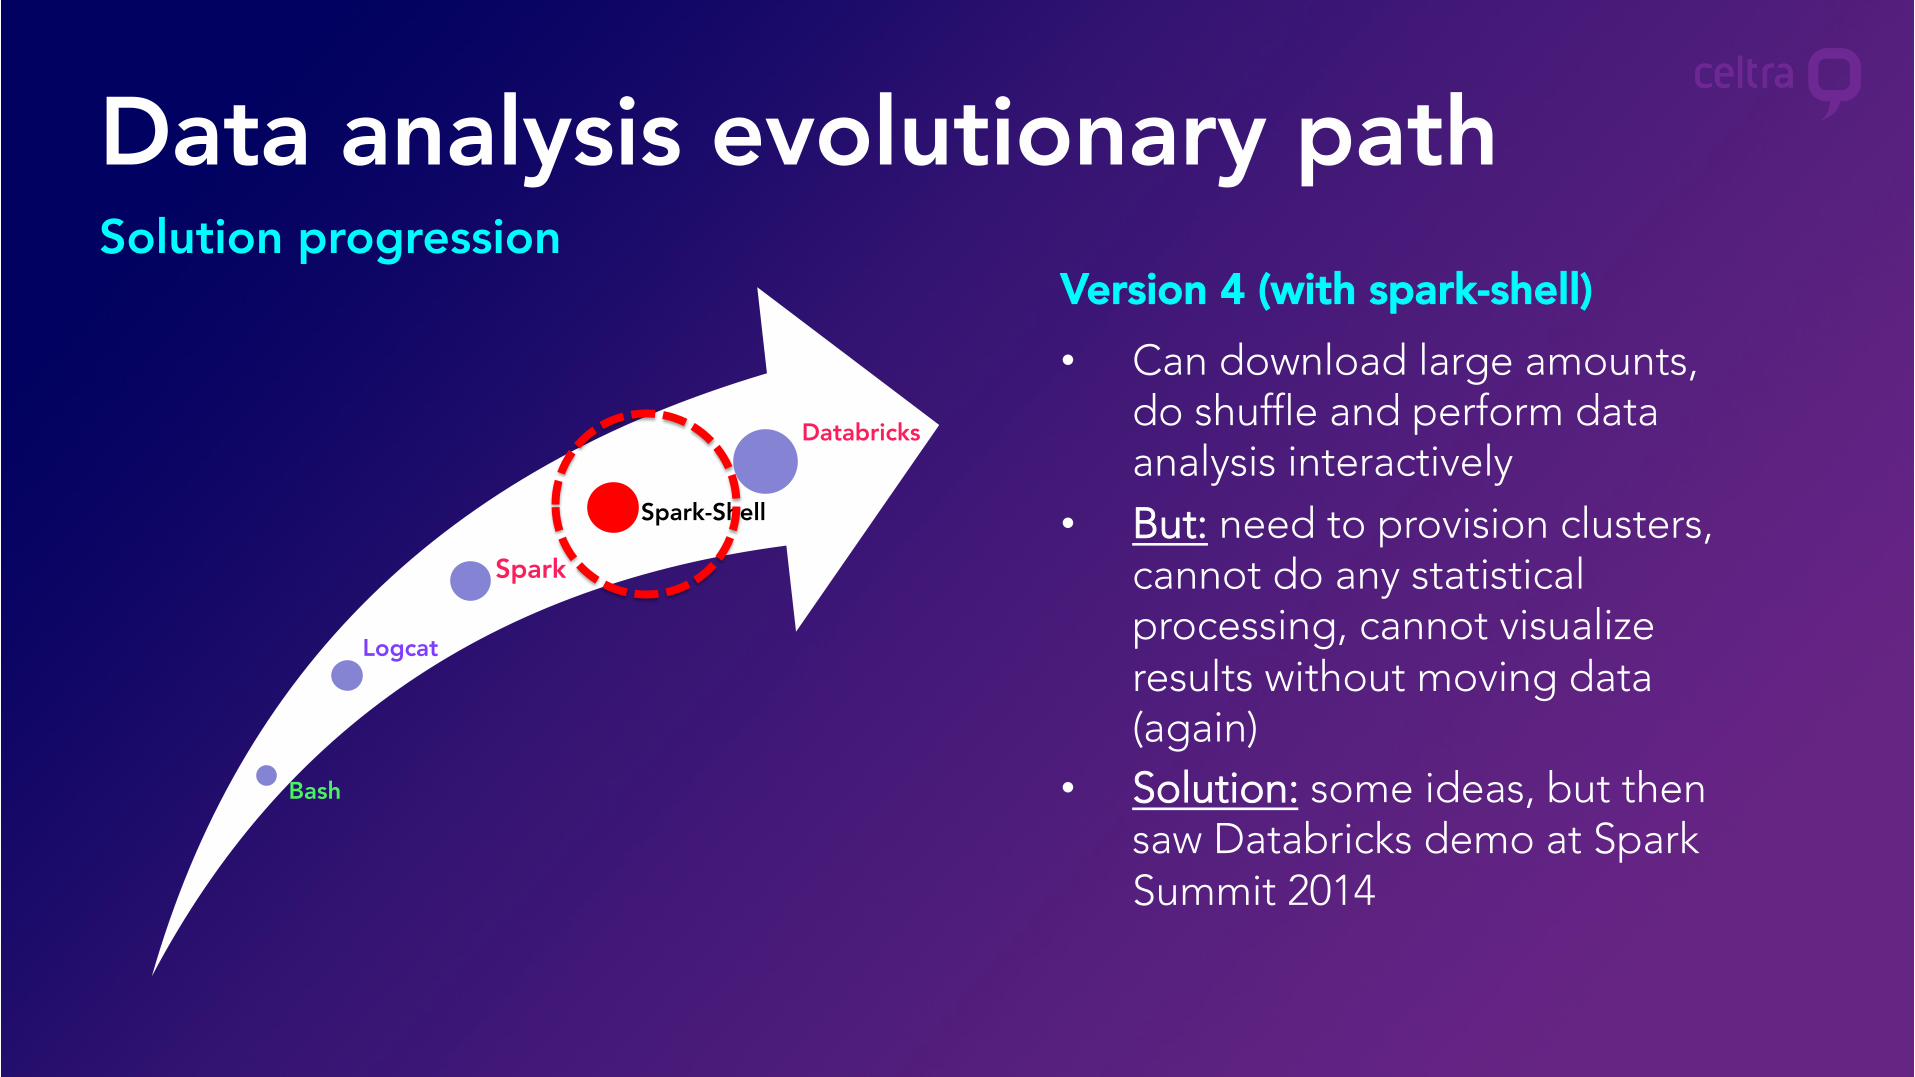
Data analysis evolutionary pathSolution progression
Bash
Logcat
Spark
Spark-Shell
Databricks
• Downloading event logs from S3 on a single machine, “grepping”, doing simple counts in bash. Using R or Python for analysis.
• But: Slow download (single core, one machine)
• Solution: Written Logcat – Scala, multi-threaded downloading from S3, scale horizontally
Version 1 (with Bash)
Bash
Logcat
Spark
Spark-Shell
Databricks
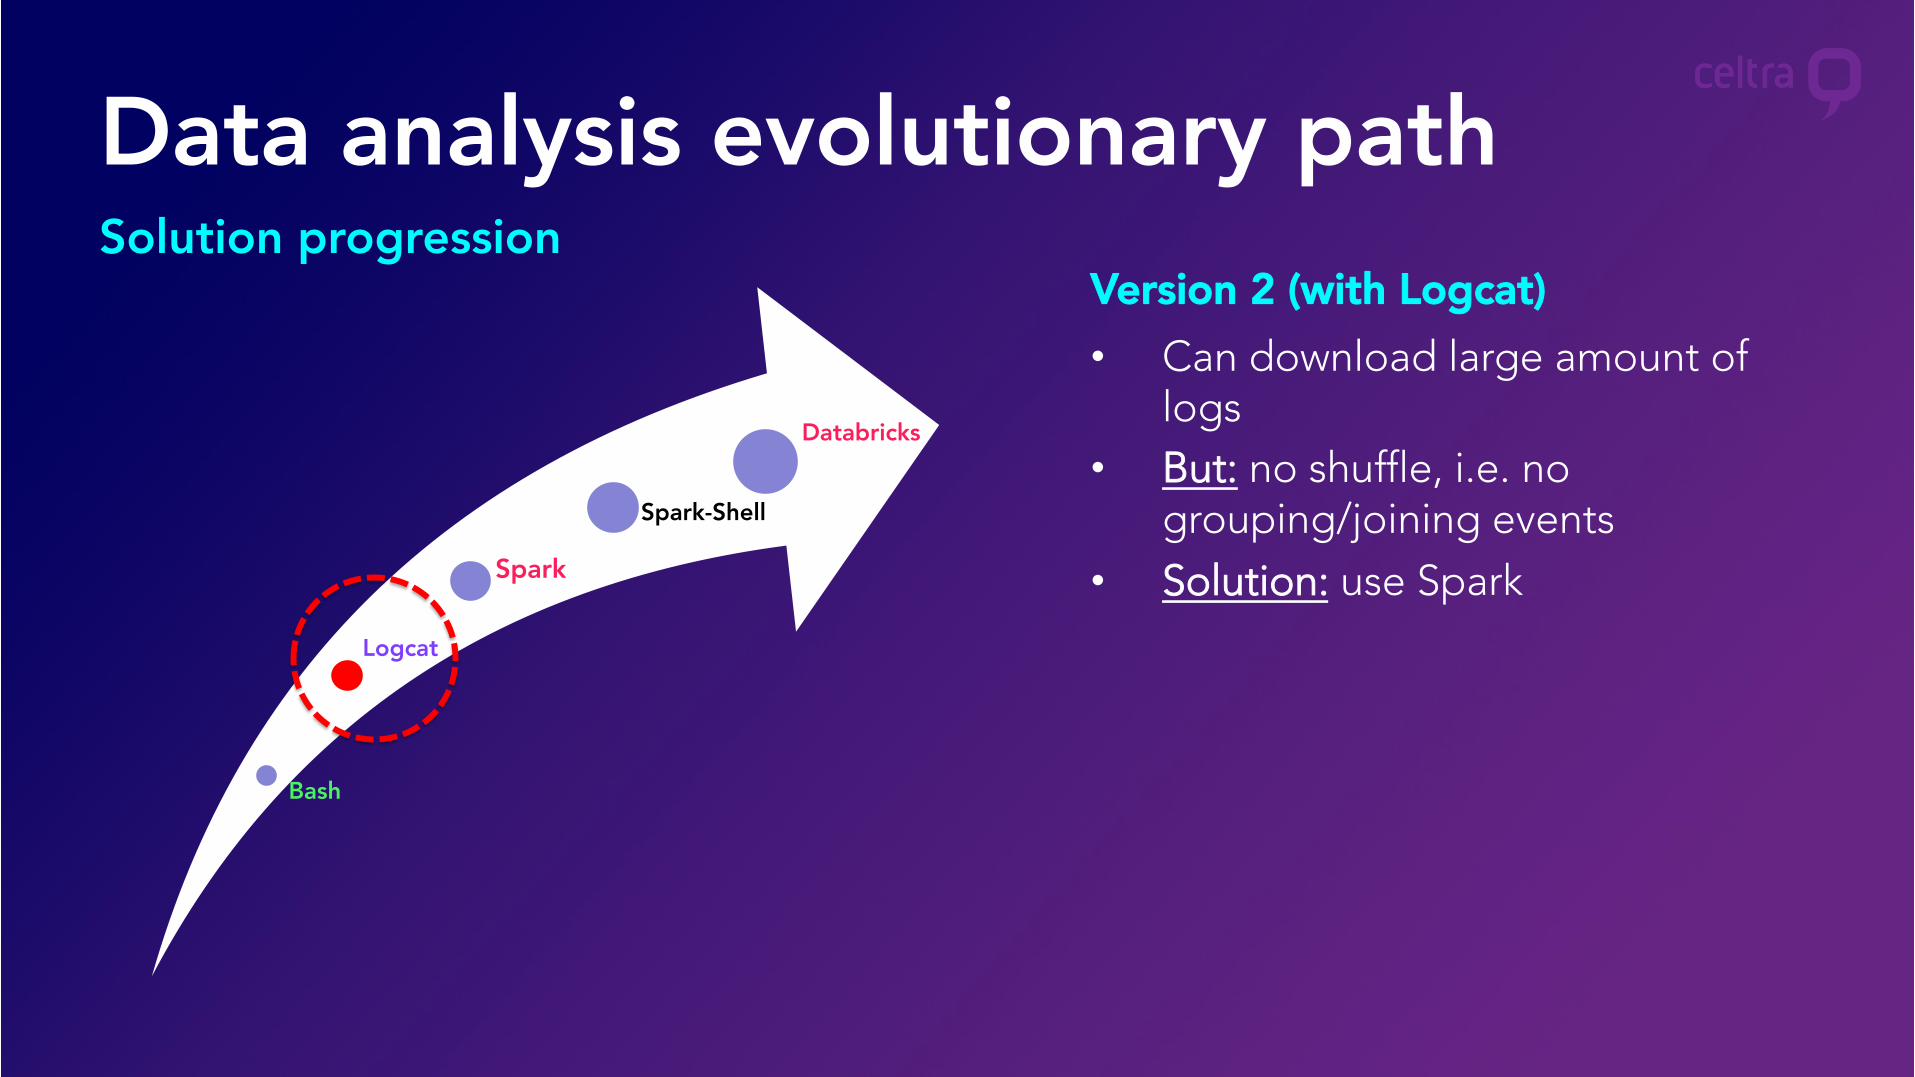
Data analysis evolutionary pathSolution progression
• Can download large amount of logs
• But: no shuffle, i.e. no grouping/joining events
• Solution: use Spark
Version 2 (with Logcat)
Bash
Logcat
Spark
Spark-Shell
Databricks
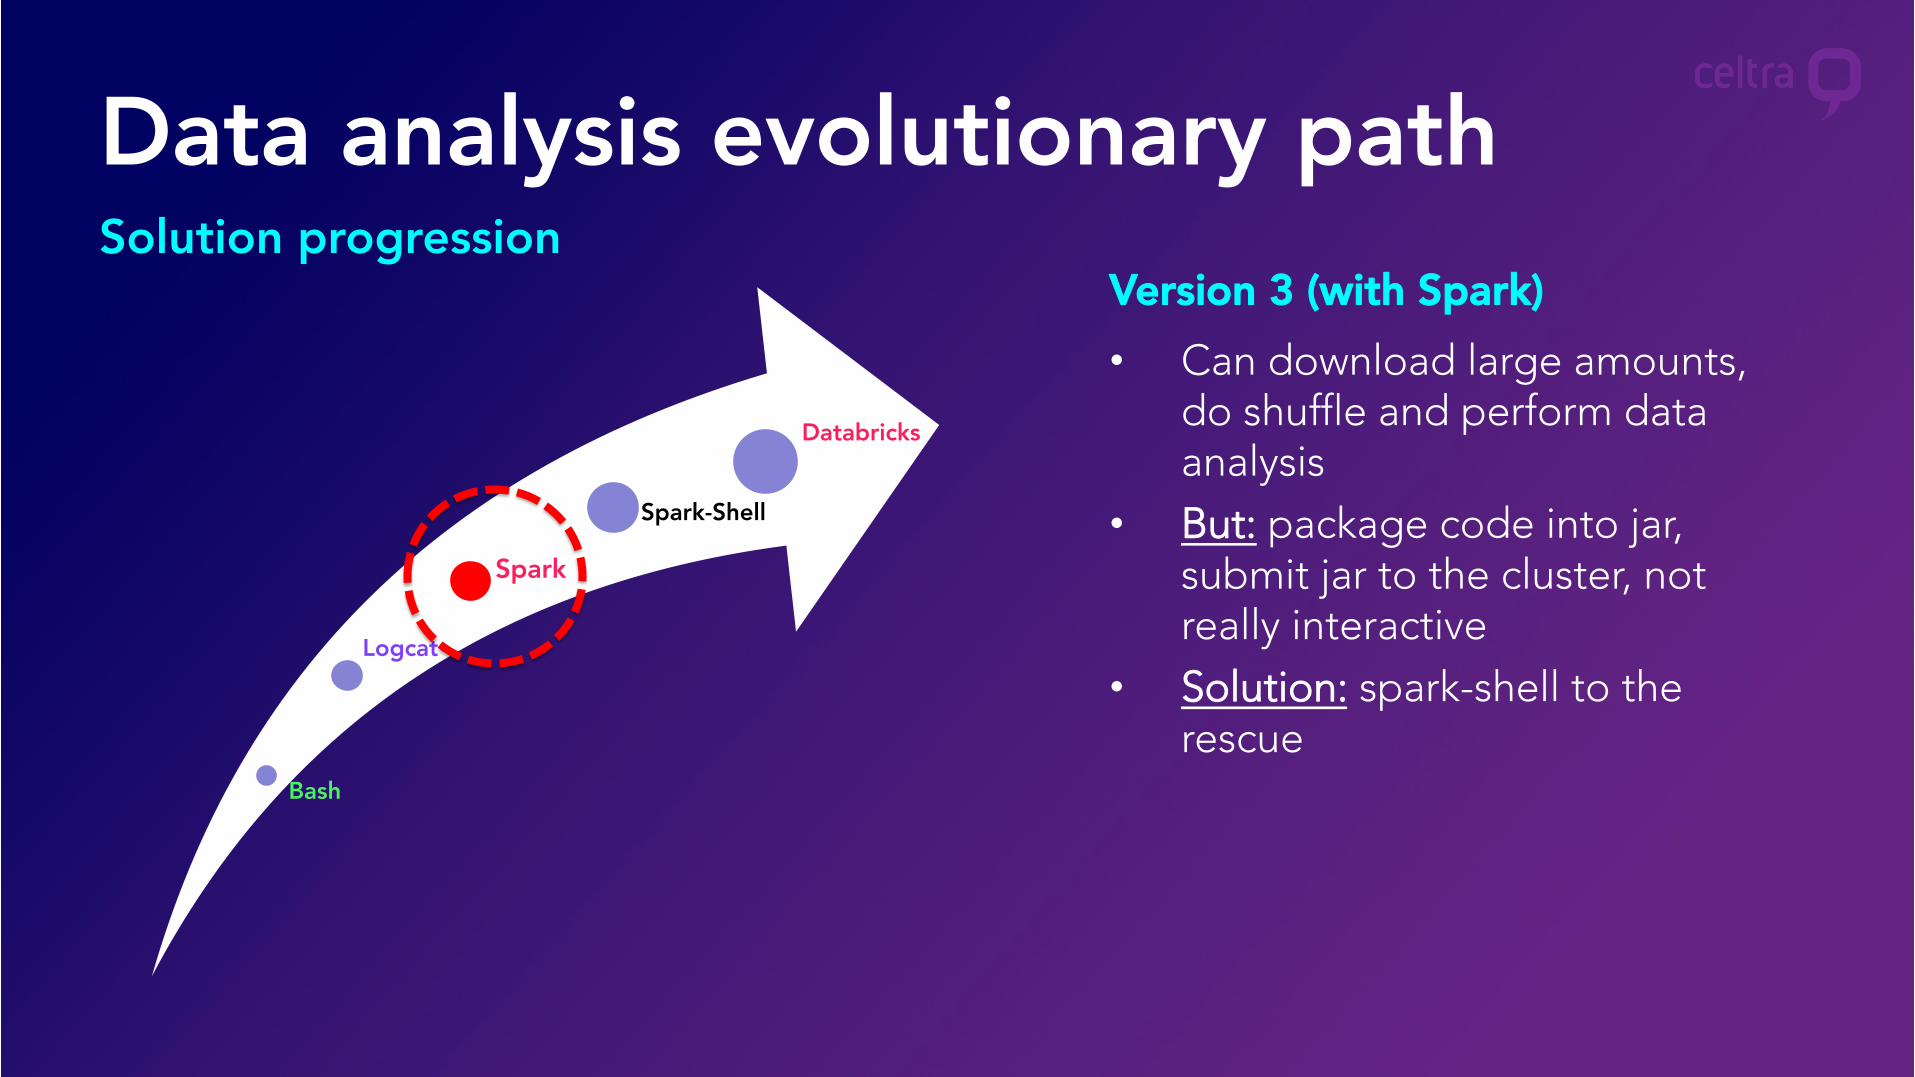
Data analysis evolutionary pathSolution progression
• Can download large amounts, do shuffle and perform data analysis
• But: package code into jar, submit jar to the cluster, not really interactive
• Solution: spark-shell to the rescue
Version 3 (with Spark)
Bash
Logcat
Spark
Spark-Shell
Databricks
Data analysis evolutionary pathSolution progression
• Can download large amounts, do shuffle and perform data analysis interactively
• But: need to provision clusters, cannot do any statistical processing, cannot visualize results without moving data (again)
• Solution: some ideas, but then saw Databricks demo at Spark Summit 2014
Version 4 (with spark-shell)
Bash
Logcat
Spark
Spark-Shell
Databricks
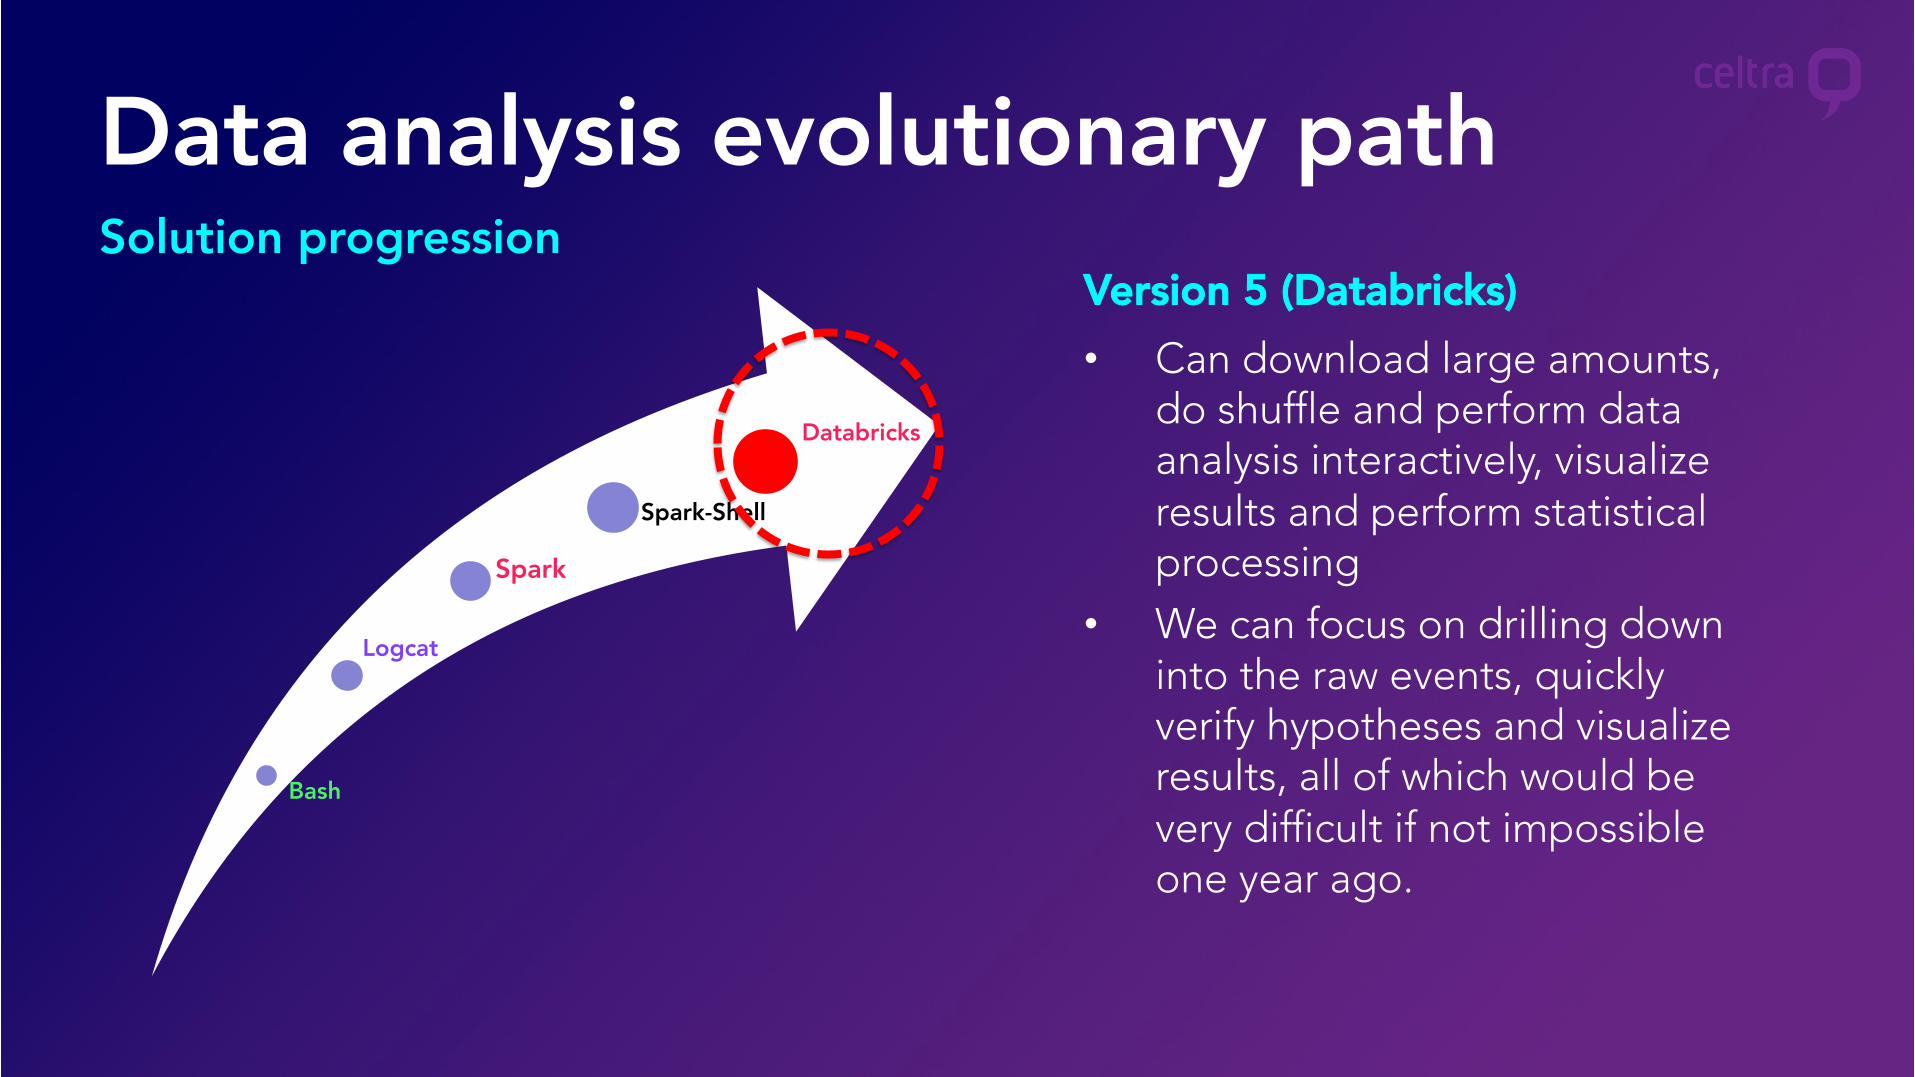
Data analysis evolutionary pathSolution progression
• Can download large amounts, do shuffle and perform data analysis interactively, visualize results and perform statistical processing
• We can focus on drilling down into the raw events, quickly verify hypotheses and visualize results, all of which would be very difficult if not impossible one year ago.
Version 5 (Databricks)
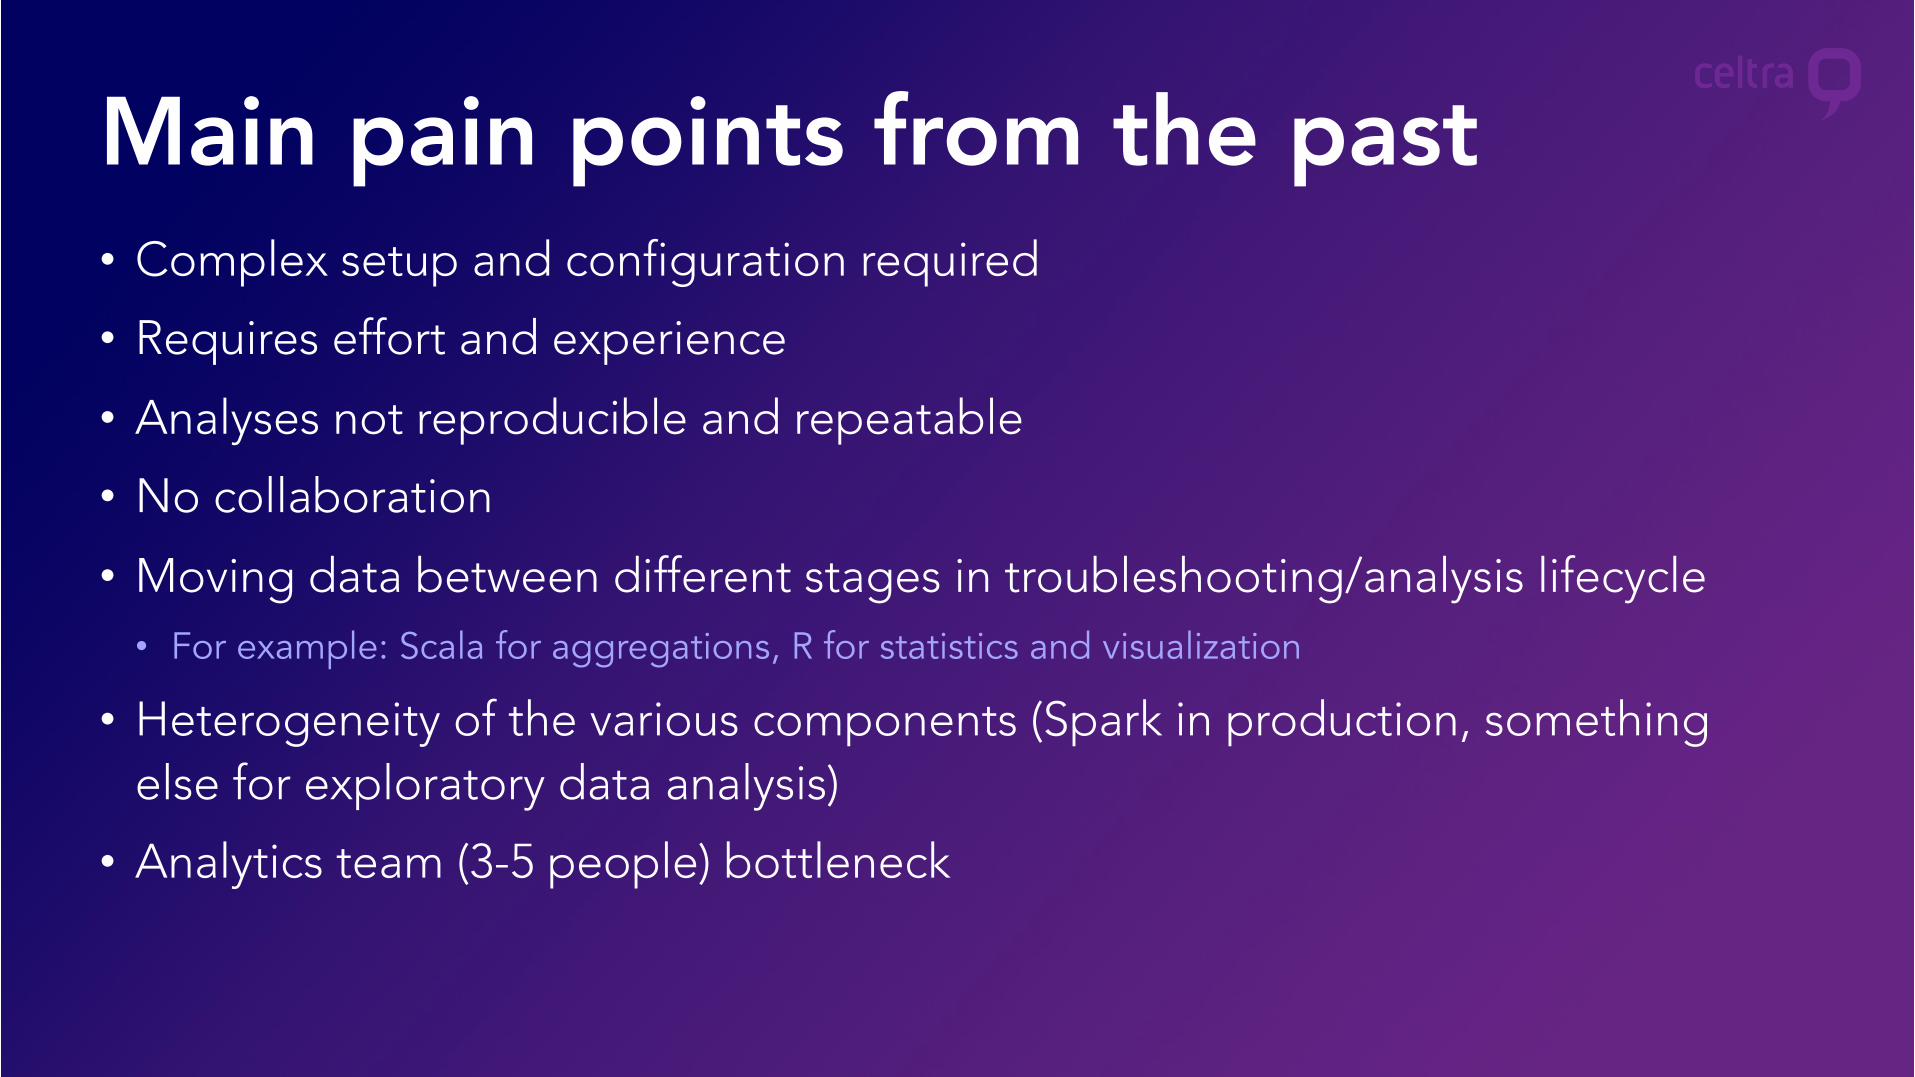
• Complex setup and configuration required
• Requires effort and experience
• Analyses not reproducible and repeatable
• No collaboration
• Moving data between different stages in troubleshooting/analysis lifecycle• For example: Scala for aggregations, R for statistics and visualization
• Heterogeneity of the various components (Spark in production, something else for exploratory data analysis)
• Analytics team (3-5 people) bottleneck
Main pain points from the past
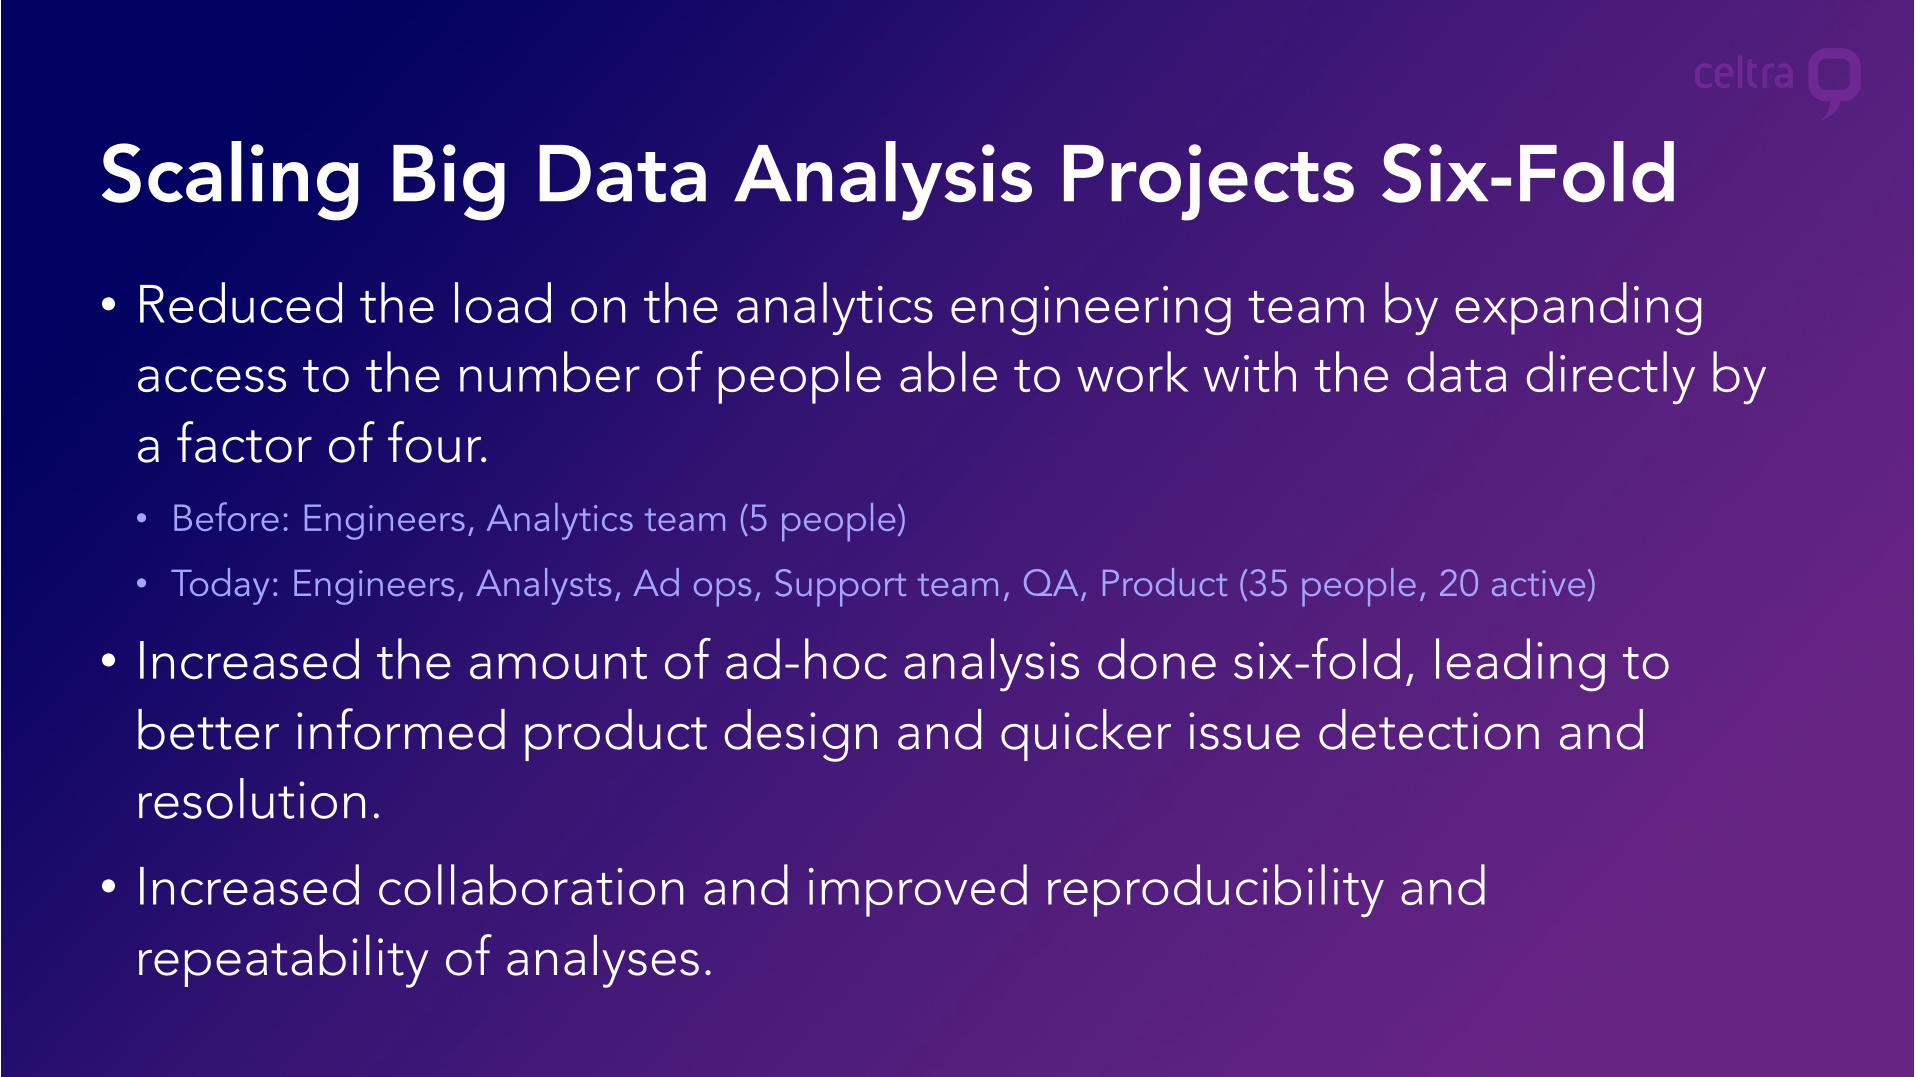
• Reduced the load on the analytics engineering team by expanding access to the number of people able to work with the data directly by a factor of four.• Before: Engineers, Analytics team (5 people)
• Today: Engineers, Analysts, Ad ops, Support team, QA, Product (35 people, 20 active)
• Increased the amount of ad-hoc analysis done six-fold, leading to better informed product design and quicker issue detection and resolution.
• Increased collaboration and improved reproducibility and repeatability of analyses.
Scaling Big Data Analysis Projects Six-Fold
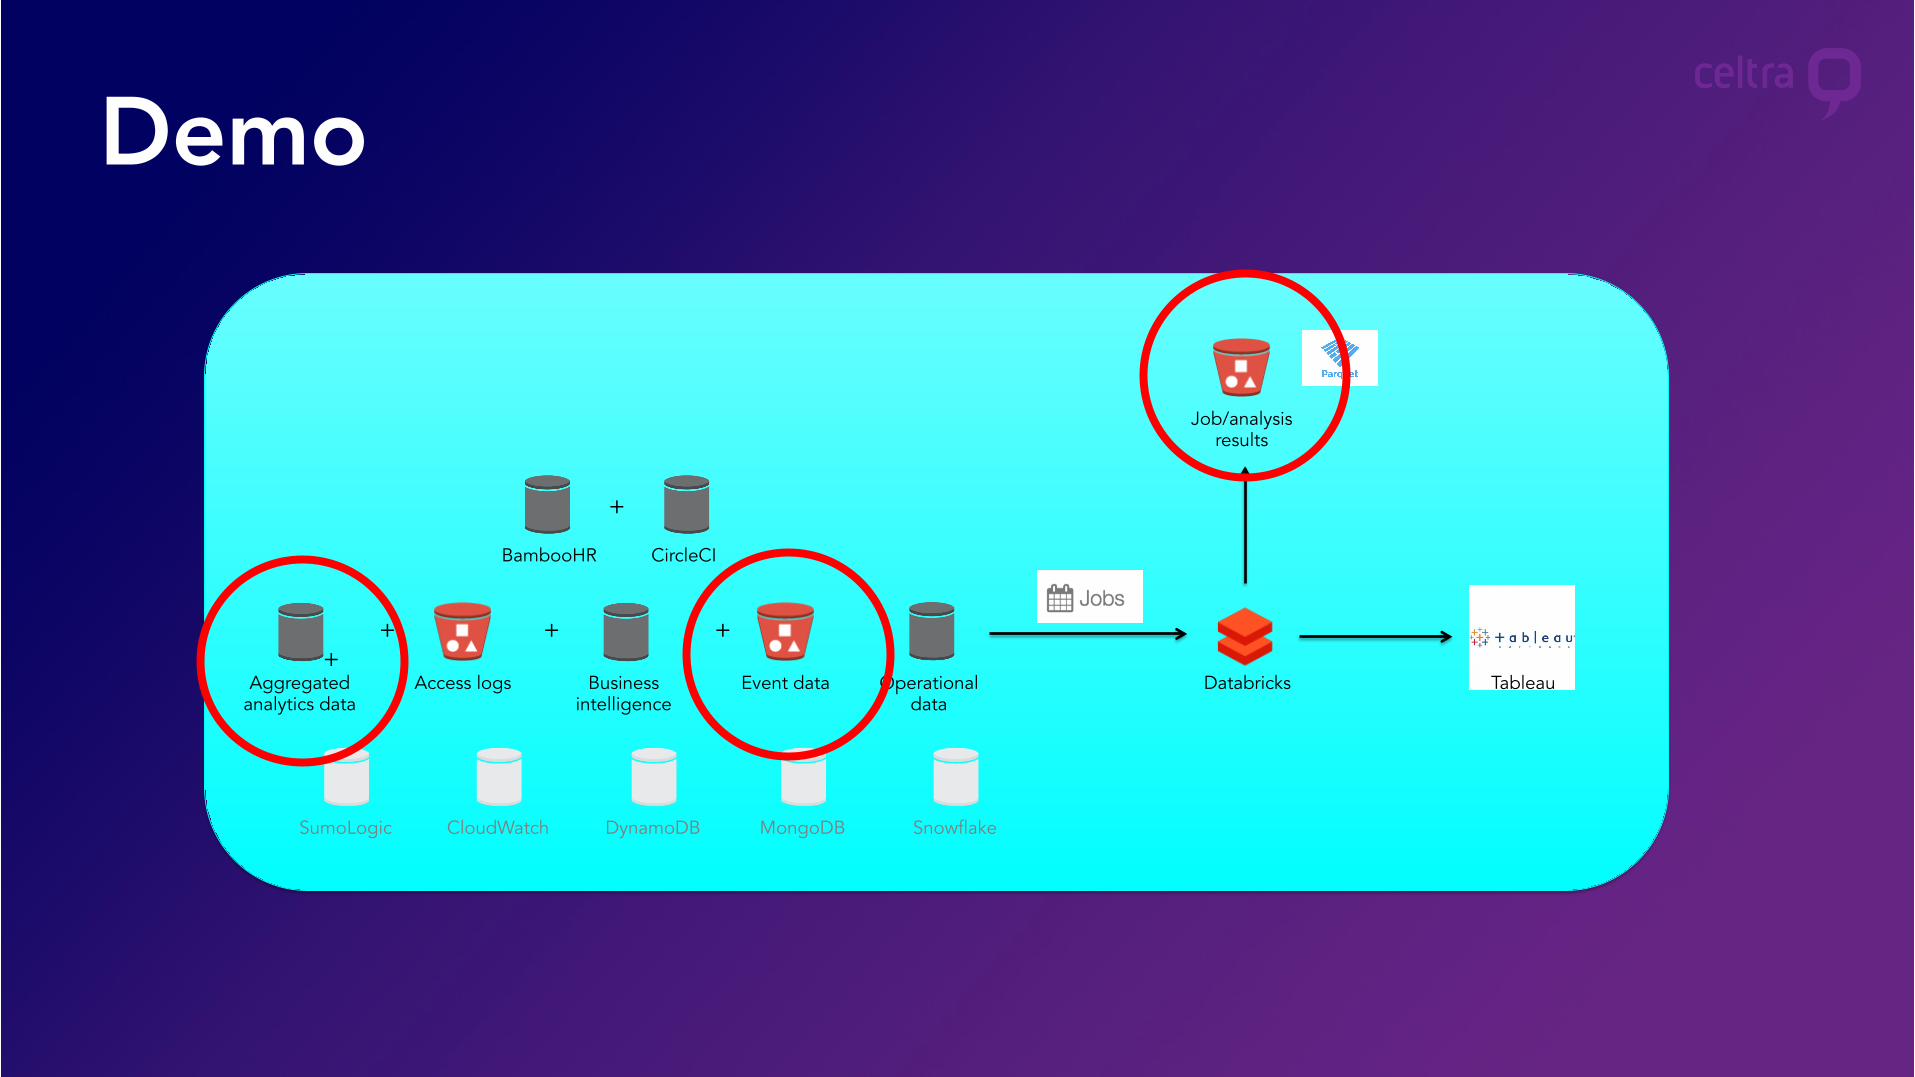
Demo
Event data
+ + + +
Operational data
Databricks Tableau Business intelligence
Job/analysis results
Access logs Aggregated analytics data
SumoLogic
BambooHR CircleCI
+
CloudWatch DynamoDB MongoDB Snowflake

Q&A

Appendix
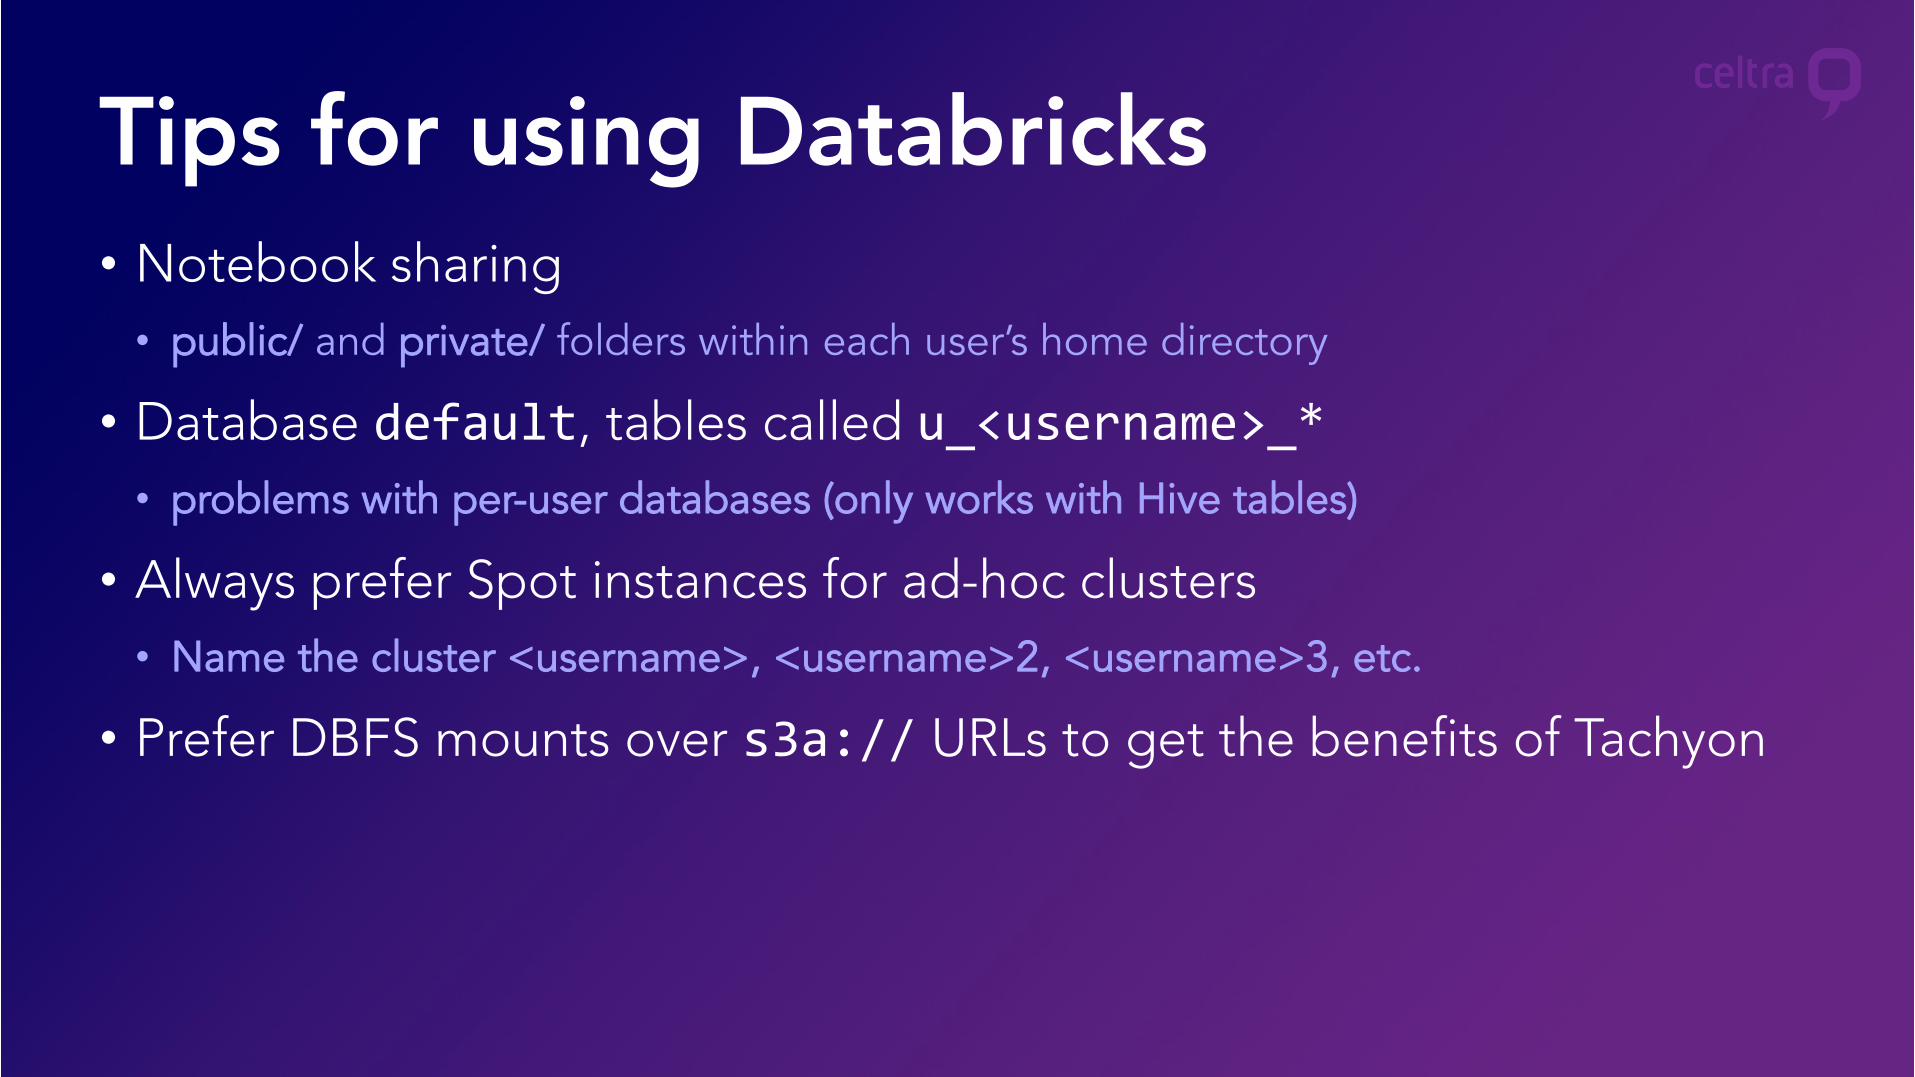
• Notebook sharing• public/ and private/ folders within each user’s home directory
• Database default, tables called u_<username>_* • problems with per-user databases (only works with Hive tables)
• Always prefer Spot instances for ad-hoc clusters • Name the cluster <username>, <username>2, <username>3, etc.
• Prefer DBFS mounts over s3a:// URLs to get the benefits of Tachyon
Tips for using Databricks
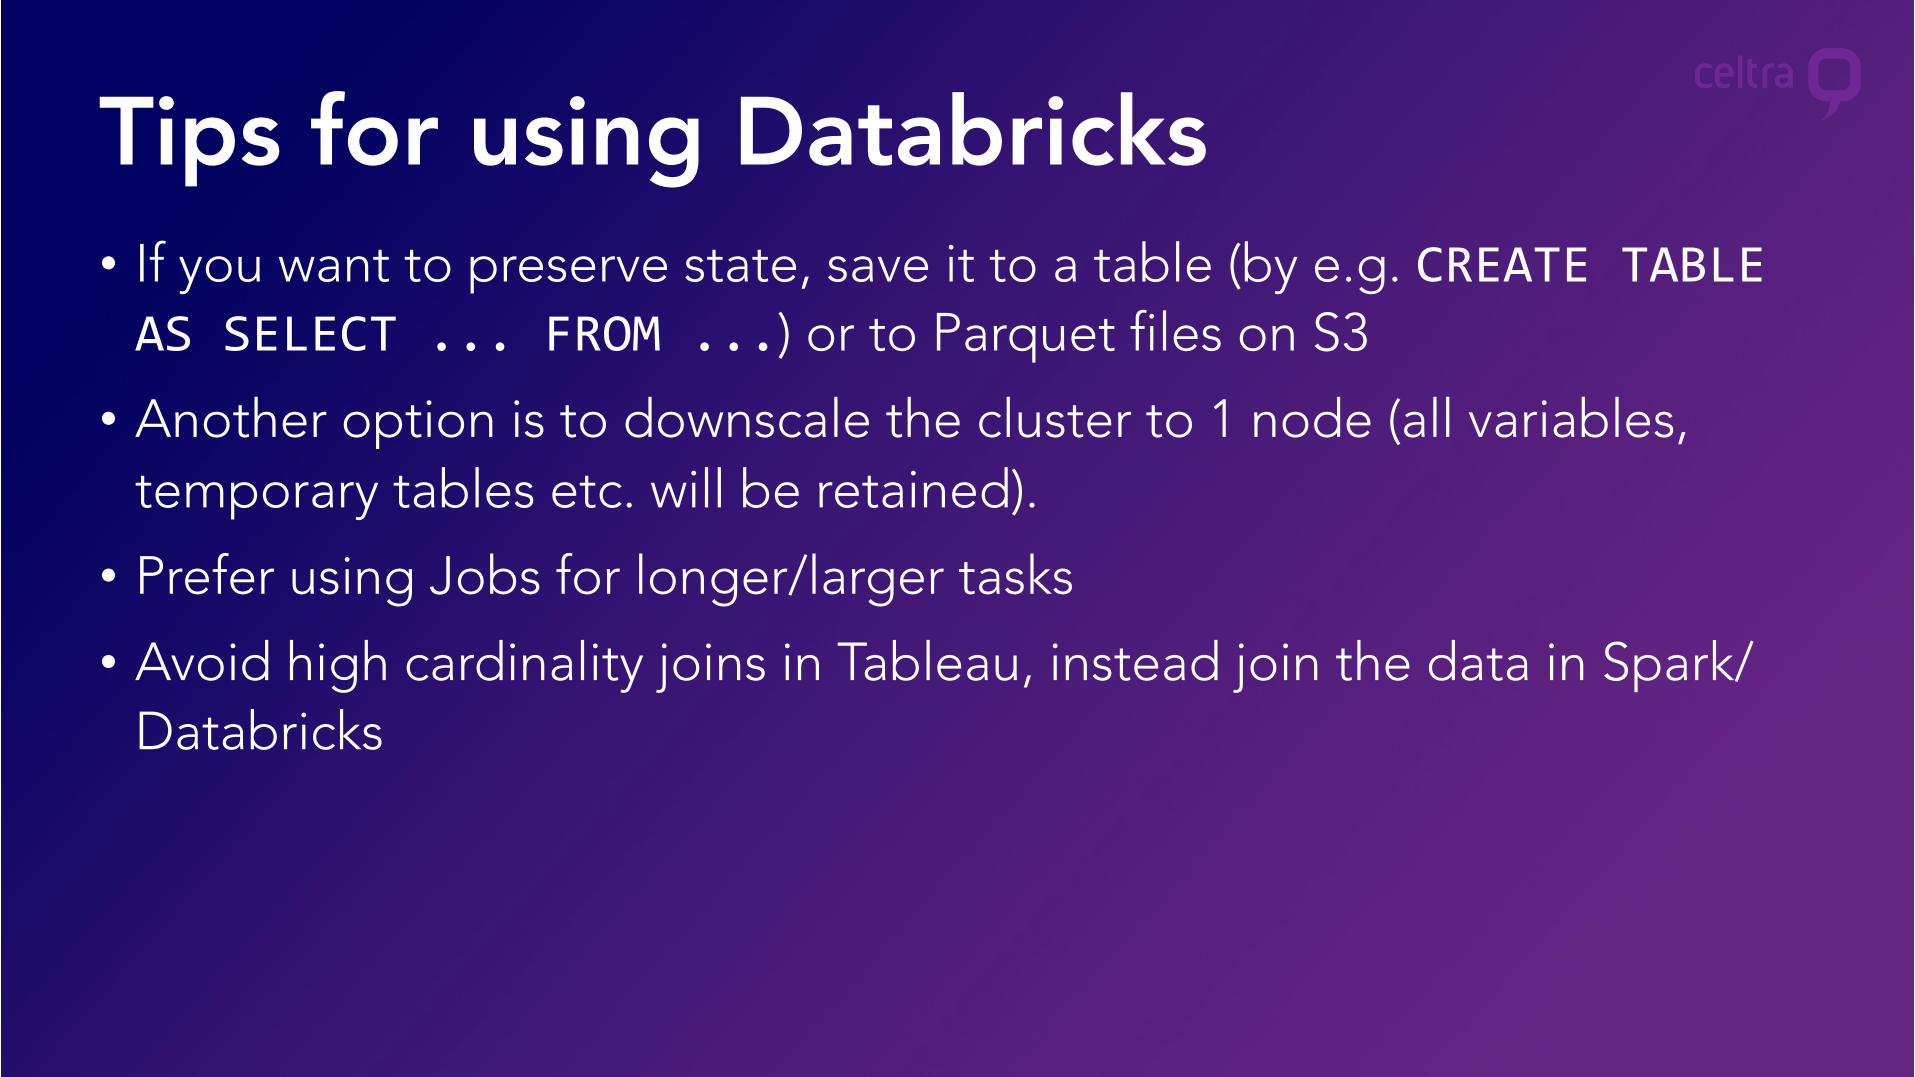
• If you want to preserve state, save it to a table (by e.g. CREATE TABLE AS SELECT ... FROM ...) or to Parquet files on S3
• Another option is to downscale the cluster to 1 node (all variables, temporary tables etc. will be retained).
• Prefer using Jobs for longer/larger tasks
• Avoid high cardinality joins in Tableau, instead join the data in Spark/Databricks
Tips for using Databricks


