61
October, 2013 Presentation to: How Chilled Water Optimization makes Cogeneration More Effective with a Better Payback By Hemant Mehta, P.E. WM Group Engineers, P.C.

October, 2013
Presentation to:
How Chilled Water Optimization makes
Cogeneration More Effective with a
Better Payback
By
Hemant Mehta, P.E.
WM Group Engineers, P.C.
Post Sandy
Challenge our industry
Resiliency
Answer
Micro Grid - CHP
Island mode operation

CHP Implementation
Challenge from the bean counters
Payback
Answer
Improve coincident factor by
reducing peak power demand and
annual operating costs

OTHER
LOSSES
4.8%
INP
UT
10
0%
LOSSES
25.8%
EXHAUST
LOSSES
21%
THERMAL
OUTPUT
44.5%
ELECTRICAL
OUTPUT
29.7% USEFUL ENERGY
74.2%
CHP Limitation
• High electric to thermal demand during summer
limits CHP operation.
• Decreasing the summer electric demand allows
best operational scenario for CHP.

Every Manufacturer has different energy
profile
CHP Selection
• Reduction in power consumption in summer
allows the selection of smaller CHP units with
low minimum thermal output optimal in summer
• It allows the better unit selection with more
operating hours and more energy savings
resulting in good payback.
• Chilled Water Optimization is a necessary step
for CHP operation.

Opportunity - Chilled Water System optimization
1. Power requirements for Chilled
water system establish peak
summer demand
2. I have yet to see an efficient
chilled water system

• Design inconsistency of chilled water plant, distribution system and building systems by consulting Engineers
• Poor Delta T
• High Chilled water pump TDH
• System hydraulics
• Inefficient Condenser water system
• Band Aid Solutions
The reasons of poor design and/or operation or system inefficiencies are:

Signs of inefficient systems
• If your fall and Spring Chilled water Delta T is
lower than summer peak delta t
• If your pumping system is primary/secondary or
primary/secondary/tertiary
• If you have division of responsibility between
plant and buildings
• If your control logic is same as 1970 design
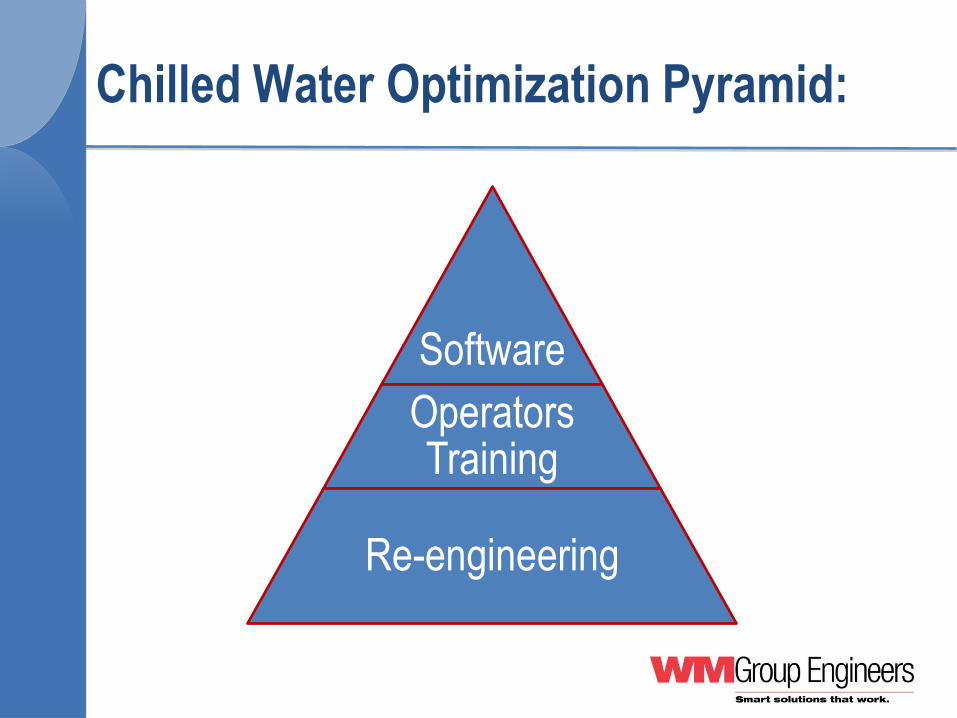
Chilled Water Optimization Pyramid:
Software
Operators Training
Re-engineering
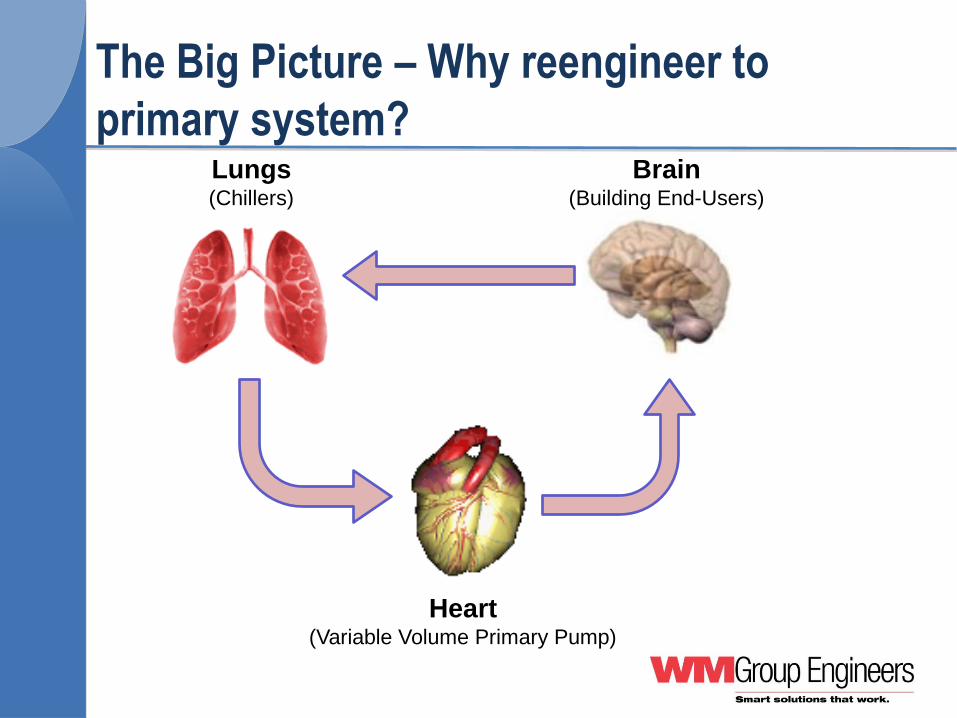
The Big Picture – Why reengineer to
primary system?
Heart (Variable Volume Primary Pump)
Lungs (Chillers)
Brain (Building End-Users)

Chilled water system optimization
• I realized the power of system optimization in
1984 while working on a project for the Louisville
medical Center
• Let’s review some of the case history on how the
analysis and reengineering of the existing
system reduced electric peak demand,
consumptions and saved millions of dollars to the
client

Case study – Louisville Medical Center
• 12,000 ton plant could not meet the Cooling requirements
• Local consultant recommended Installing 3,000 tons of
additional capacity
• We were called in for peer review
• Our review indicated that the cooling load was only 8,800 tons
• Reengineering the plant we regain the capacity and reduced
PEAK Power

Case study – Memorial Sloan Kettering Cancer Center New York
• World famous cancer treatment hospital campus
• Four individual chiller plants operating
individually
• Major issues:
– Not enough chiller capacity. Client planned to spend
millions to add chiller capacity
– Too much pumping
– Inefficient operation

Summary of Reengineered system
• Interconnected four plants to operate as one system
– Interconnections eliminated need for a stand by
chillers. Old stand by chillers are now available for
campus expansion.
– No need to add additional chillers for a while saving
millions of dollars
• Removed 32 pumps, reduced power by over a
megawatt and saved over a million dollars a year in
annual cost

Power Reduction – MSKCC
19,000 tons CHW production
capacity interconnected
32 pumps bypassed
23 pumps demolished
$1 million in projected annual
energy savings
$662,000 NYSERDA funding
Pump Cemetery reduced
power by over One MW
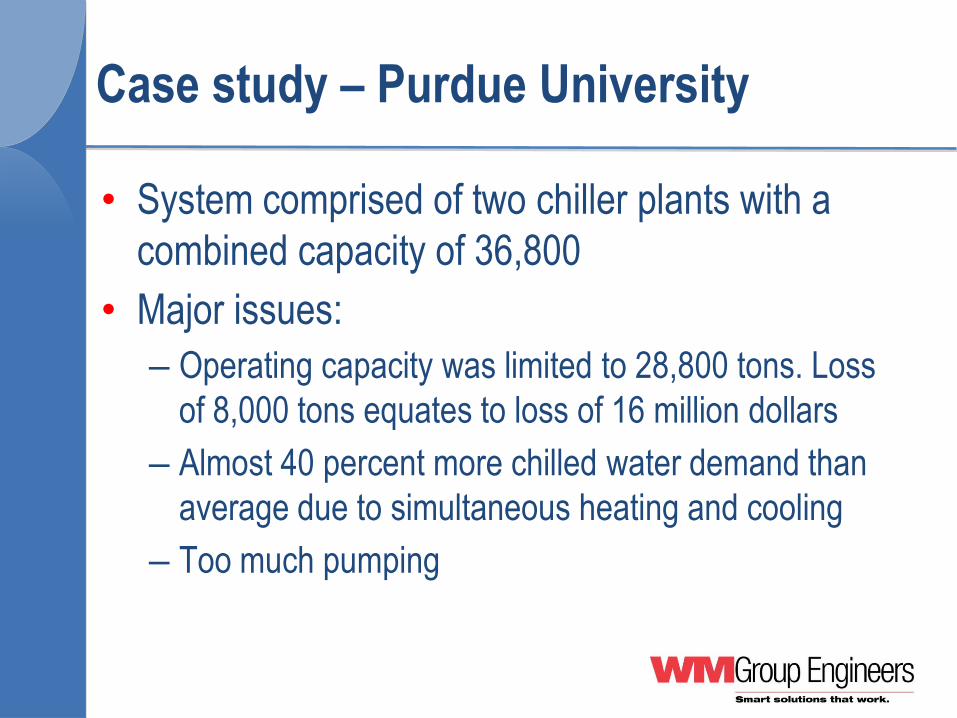
Case study – Purdue University
• System comprised of two chiller plants with a
combined capacity of 36,800
• Major issues:
– Operating capacity was limited to 28,800 tons. Loss
of 8,000 tons equates to loss of 16 million dollars
– Almost 40 percent more chilled water demand than
average due to simultaneous heating and cooling
– Too much pumping
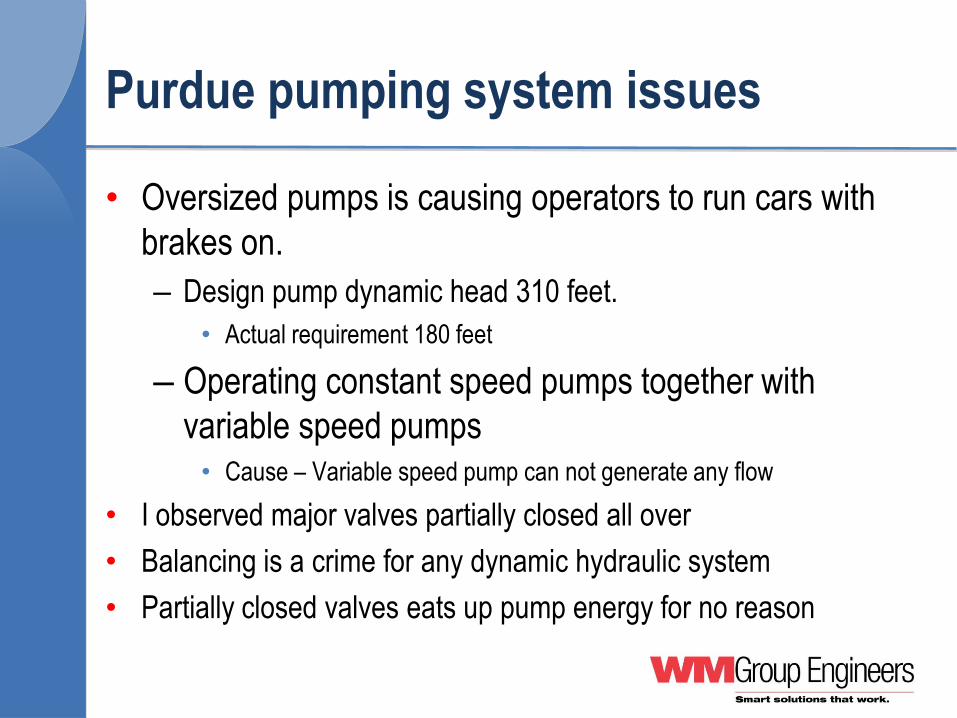
• Oversized pumps is causing operators to run cars with
brakes on.
– Design pump dynamic head 310 feet.
• Actual requirement 180 feet
– Operating constant speed pumps together with
variable speed pumps • Cause – Variable speed pump can not generate any flow
• I observed major valves partially closed all over
• Balancing is a crime for any dynamic hydraulic system
• Partially closed valves eats up pump energy for no reason
Purdue pumping system issues

Purdue pumping system issues

• Use of Building Pumping Unnecessary, Removed 130
pumps from the buildings. Power reduction 1.1 megawatt
• Removed 130 pumps from the buildings
Distribution Observations
Pressure Wasted by Closing
valve
Pressure Increased
by pump

Summary of optimization at Purdue
• Within six weeks of the project, at zero cost
reduced peak power by 1.1 Megawatt
• Removed 130 tertiary pumps
• Anticipate to reduce annual operating cost by
over 3 millions a year
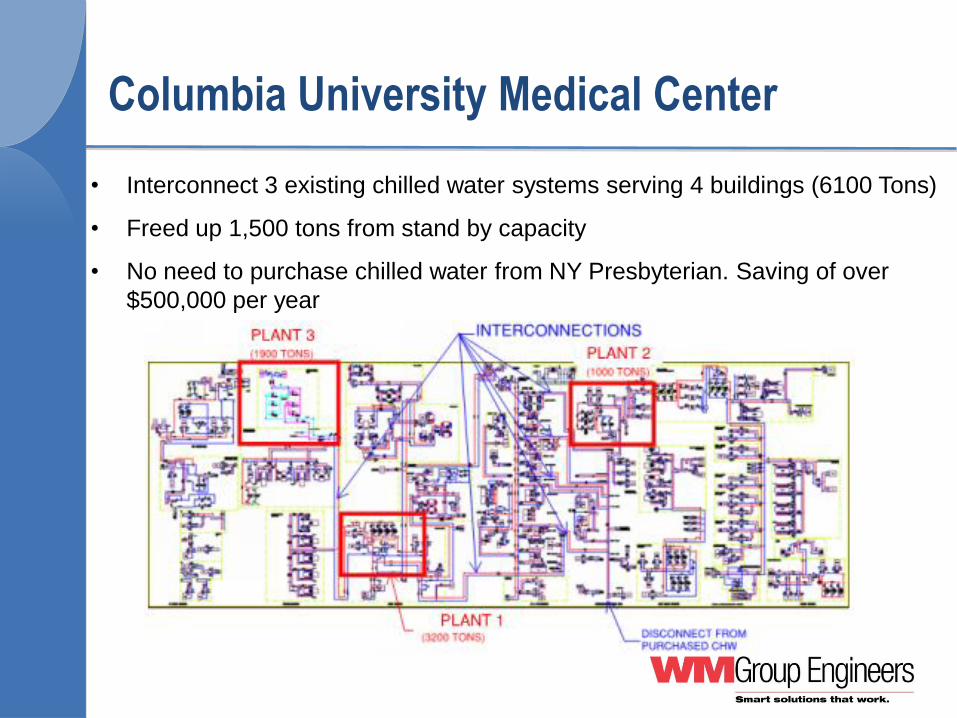
• Interconnect 3 existing chilled water systems serving 4 buildings (6100 Tons)
• Freed up 1,500 tons from stand by capacity
• No need to purchase chilled water from NY Presbyterian. Saving of over
$500,000 per year
Columbia University Medical Center

Case study – US Capitol
• Original plant of 28,000 tons designed by my
company in 1979
• Plant expanded by 15,000 tons by another
engineer in 2003
• Major issues:
– “ Cut and Paste” signature design by other engineer
– Operating capacity loss of thousands of tons
– Inefficient operation

DE
CO
UP
LE
R
PP
CH-5
CH-6
CH-7
CH-1 CH-2
CH-3 CH-4
MIN
BY
PA
SS
FM FM
PRIMARY PUMPS
SECONDARY
PUMPS
PRIMARY PUMPS
DISTRIBUTION
VFDVFDVFDVFDVFD
Primary-Constant Speed Primary/Secondary Variable
Poor Design – Incompatible Addition

Poor Design
• Oversized Pumps causing valves to throttle at 60%.
• Flow above 4000 GPM through the de-coupler.
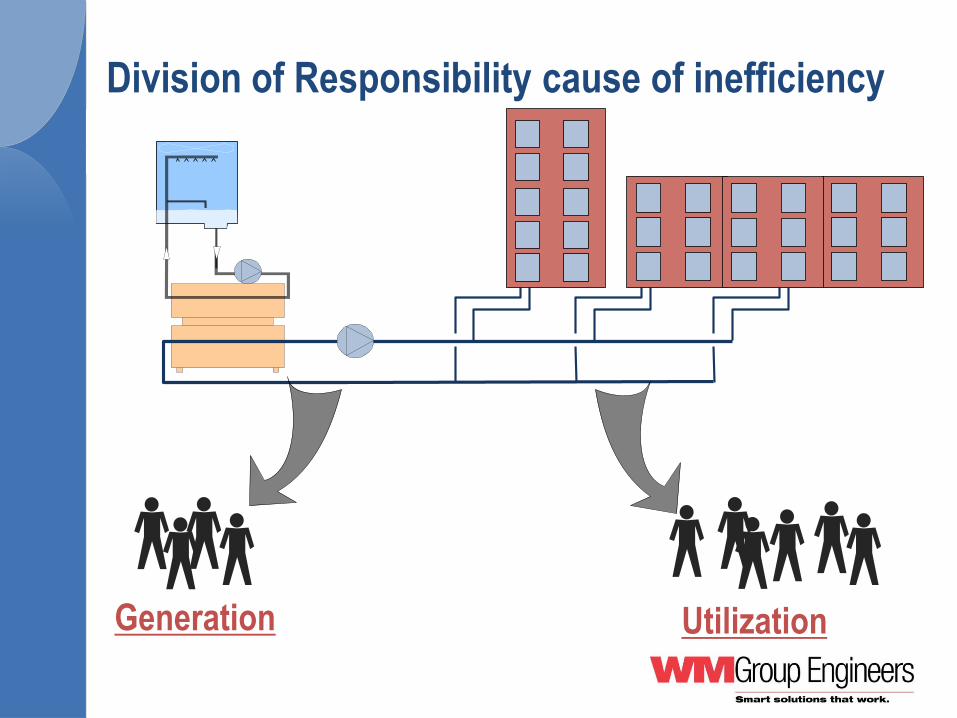
Generation Utilization
Division of Responsibility cause of inefficiency
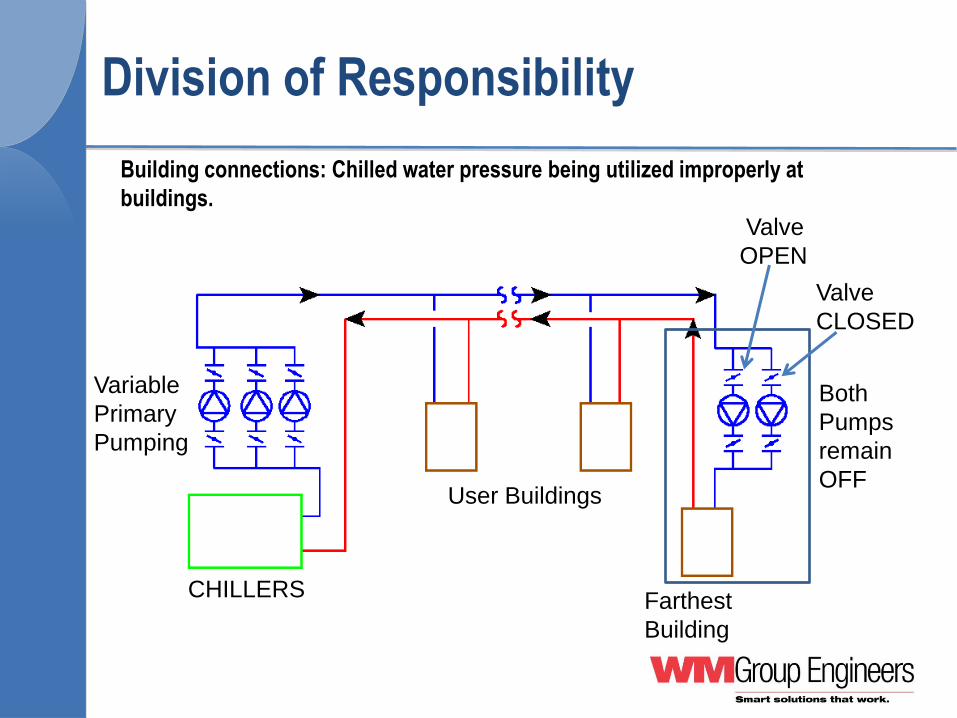
Division of Responsibility
CHILLERS
Variable
Primary
Pumping
Farthest
Building
Both
Pumps
remain
OFF
Valve
OPEN
Valve
CLOSED
User Buildings
Building connections: Chilled water pressure being utilized improperly at
buildings.

Building connections: Chilled water pressure being utilized improperly
at buildings.
Division of Responsibility
Pressure drop:10psi
Head Loss: 23 ft
At peak load flow of 46,000
GPM, additional power required
for Pumps at Chiller Plant is
46000*23/(3960*.8)
= 335 HP or 250.2 kW
Chilled water flowing through
non-operating pump.
With equivalent 4000 full load hours, annual energy loss is 1,000,883 kWh
At $0.0912/kWh, annual loss is $91,281
Equivalent peak demand savings: 250 kW

Summary of optimization at US Capitol
• Provided training to the operators on how to
operate plant at optimum efficiency within the
given constraints of poor plant design
• Reduced annual operating costs by $430,000
without spending any money to fix the plant
• Peak Power Reduction of over 250 KW

Duke CIEMAS Building CHW System
90% closed Triple duty valves 50% closed

Balancing valve 50% closed
Duke CIEMAS Building AHU-9

Duke Levine Science Research Center
CHW System
Before
After
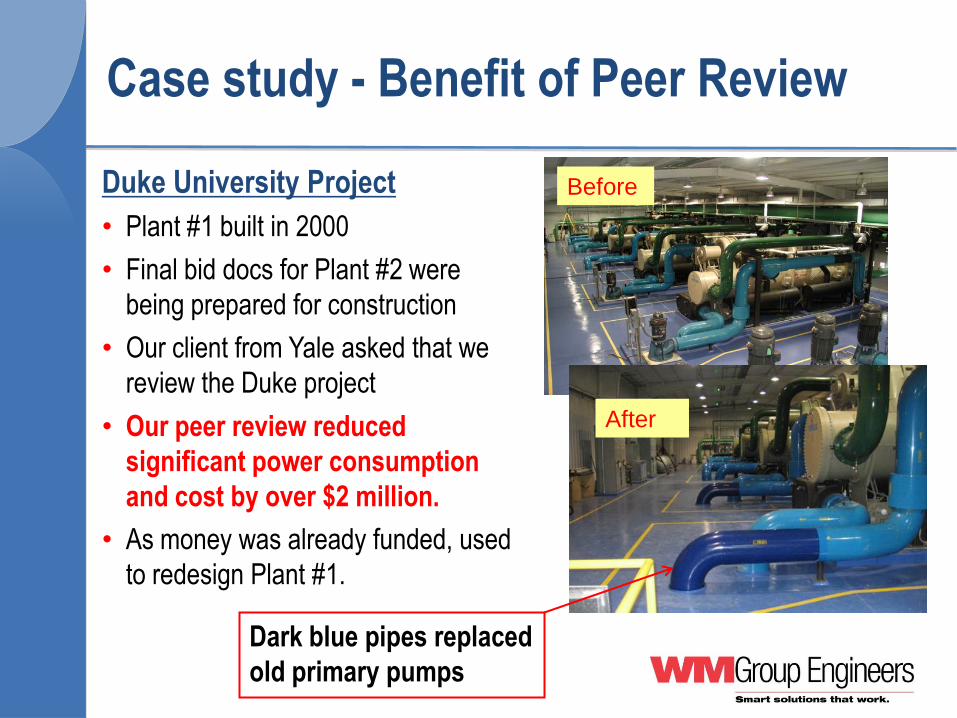
Case study - Benefit of Peer Review
Duke University Project
• Plant #1 built in 2000
• Final bid docs for Plant #2 were
being prepared for construction
• Our client from Yale asked that we
review the Duke project
• Our peer review reduced
significant power consumption
and cost by over $2 million.
• As money was already funded, used
to redesign Plant #1.
Dark blue pipes replaced
old primary pumps
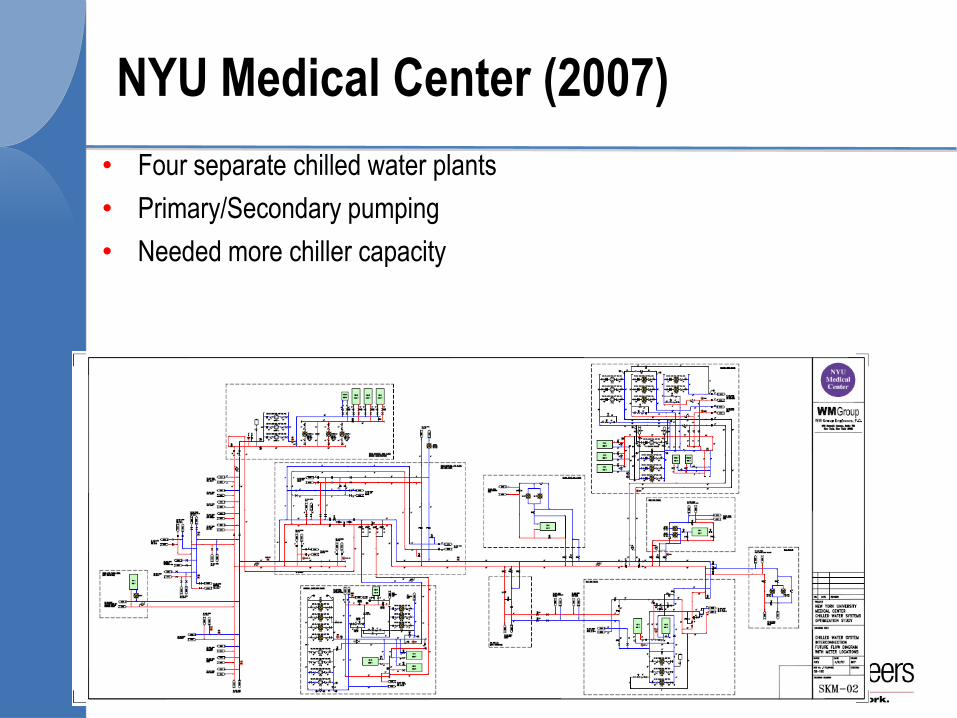
NYU Medical Center (2007)
• Four separate chilled water plants
• Primary/Secondary pumping
• Needed more chiller capacity
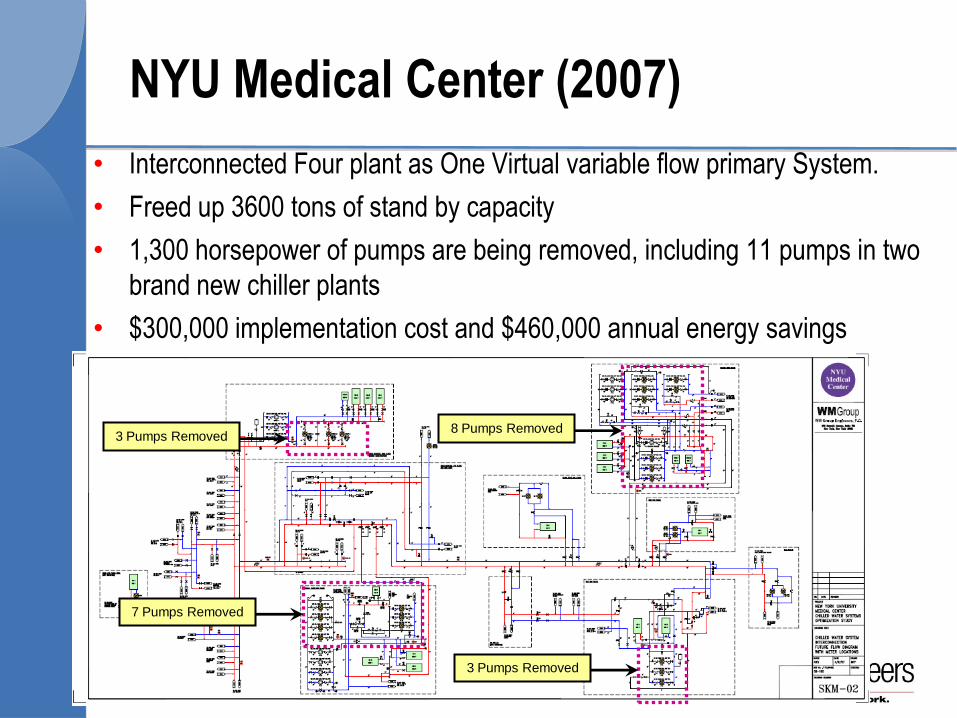
NYU Medical Center (2007)
• Interconnected Four plant as One Virtual variable flow primary System.
• Freed up 3600 tons of stand by capacity
• 1,300 horsepower of pumps are being removed, including 11 pumps in two
brand new chiller plants
• $300,000 implementation cost and $460,000 annual energy savings
3 Pumps Removed
7 Pumps Removed
8 Pumps Removed
3 Pumps Removed

Central CHW Plant & River Water Systems Design
• Design of 12,500 ton central chiller plant and site CHW
distribution system serving multiple buildings.
• Design of river water system and river water pump
house restoration.
• System connected to six different buildings
• Memorial plant machine room only one floor above the
plant
• Memorial building Engineers installed secondary pumps
event though plant pumps were design to pump water
to a mile away
• Convincing the engineer to install by-pass reduced peak
demand
Case Study - Signature “cut and
paste” design-World Trade Center
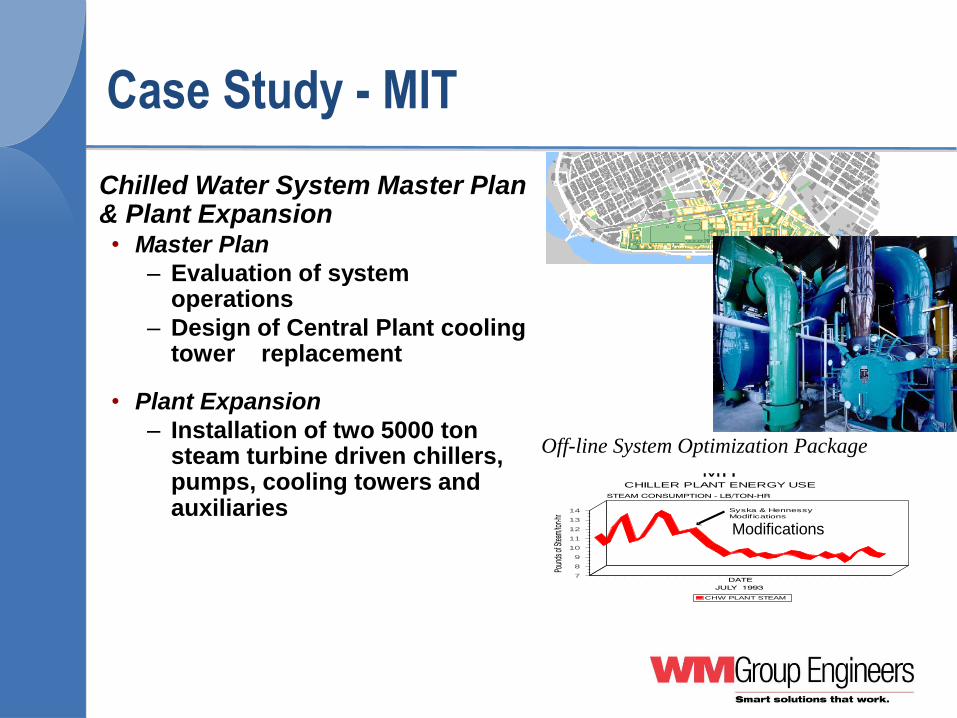
Chilled Water System Master Plan & Plant Expansion • Master Plan
– Evaluation of system operations
– Design of Central Plant cooling tower replacement
• Plant Expansion
– Installation of two 5000 ton steam turbine driven chillers, pumps, cooling towers and auxiliaries
MITCHILLER PLANT ENERGY USE
7
8
9
10
11
12
13
14
CHW PLANT STEAM
Syska & HennessyModif ications
Off-line System Optimization Package
Modifications
Case Study - MIT

Chilled Water Plant Upgrade • $12 million upgrade program to
increase existing plant cooling capacity.
• Performed comprehensive hydraulic analysis and identified flow restrictions and pump deficiencies, enabling further capacity increase by 2000 tons.
• REDUCED DEMAND AND CONSUMPTION AND ENERGY COST BY 20%
Case study – IBM Corporation
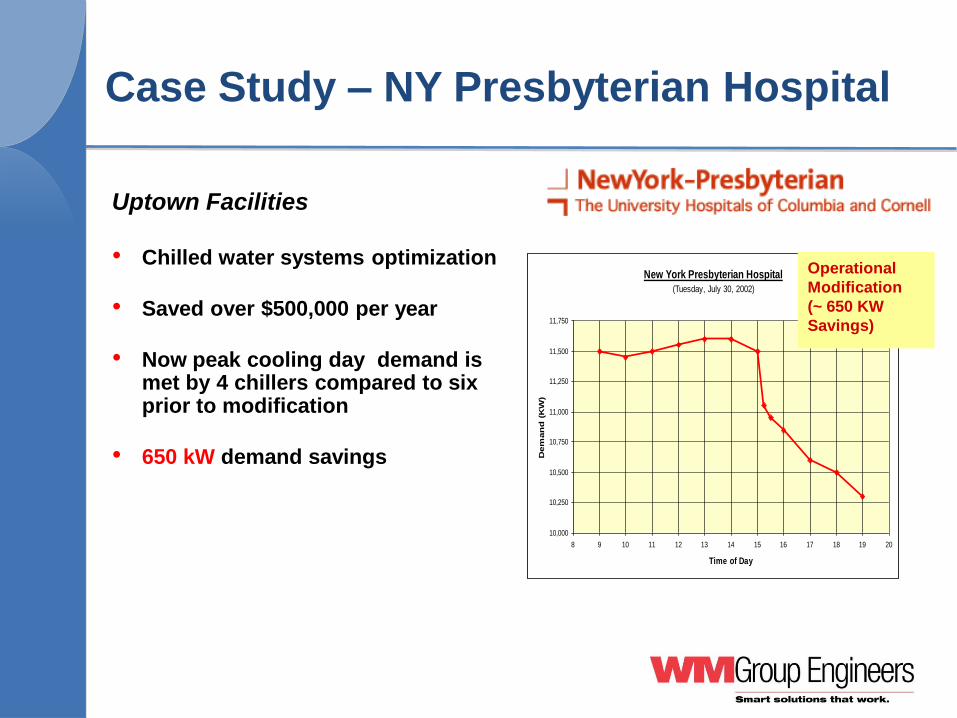
Uptown Facilities
• Chilled water systems optimization
• Saved over $500,000 per year
• Now peak cooling day demand is met by 4 chillers compared to six prior to modification
• 650 kW demand savings
New York Presbyterian Hospital
(Tuesday, July 30, 2002)
10,000
10,250
10,500
10,750
11,000
11,250
11,500
11,750
8 9 10 11 12 13 14 15 16 17 18 19 20
Time of Day
Dem
an
d (
KW
)
Operational
Modification
(~ 650 KW
Savings)
Case Study – NY Presbyterian Hospital

Identification of Bottlenecks
• Two close valves created the blocked area which increases the
increased in pump head.
• Identification and elimination of bottlenecks reduced thousands
of dollars in operating cost.
• Reduction in Power Demand and Consumption
• Annual Energy Cost Savings: $ 500,000
Case study – Amgen Inc.

• Variable Primary Conversion
• 42 pumps removed
• Control system overhauled
• DT Improvement
Case Study – Bristol Myers Squibb
• Gained over 2,000 tons of additional capacity
• Peak Demand reduction by One Megawatt
• $400,000 operational energy cost savings per
year
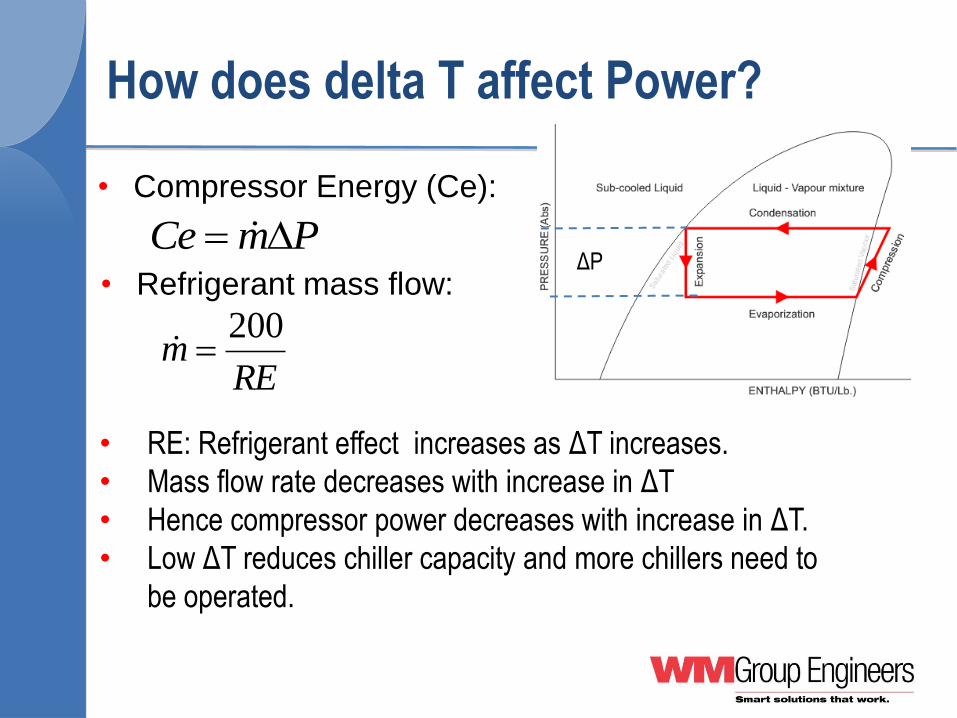
How does delta T affect Power?
• Compressor Energy (Ce):
PmCe D ΔP
REm
200
• RE: Refrigerant effect increases as ΔT increases.
• Mass flow rate decreases with increase in ΔT
• Hence compressor power decreases with increase in ΔT.
• Low ΔT reduces chiller capacity and more chillers need to
be operated.
• Refrigerant mass flow:

How do you improve delta T?
• Controlling the chilled water flow through the
chillers
• Use of new control technology at AHUs.

Case Study – PA State Capitol Complex
• Increased the delta T, reducing the flow requirement thereby
reducing power consumption and demand.

• Site survey
• Collect trended data from historian
• Determine health of system
• Analytics
• Implement no-cost measures.
• Quantify savings.
• Analyze and prioritize energy conservation measures
System Evaluation Process
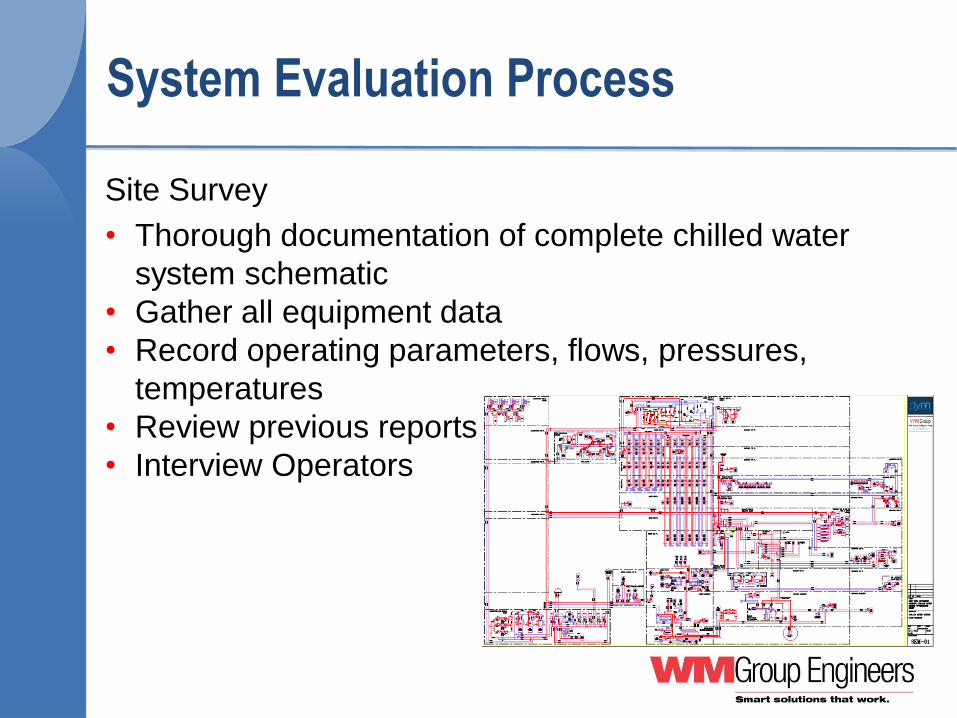
Site Survey
• Thorough documentation of complete chilled water
system schematic
• Gather all equipment data
• Record operating parameters, flows, pressures,
temperatures
• Review previous reports
• Interview Operators
System Evaluation Process

• Analytics
System Evaluation Process

• Analytics Example: Pump Mapping
System Evaluation Process
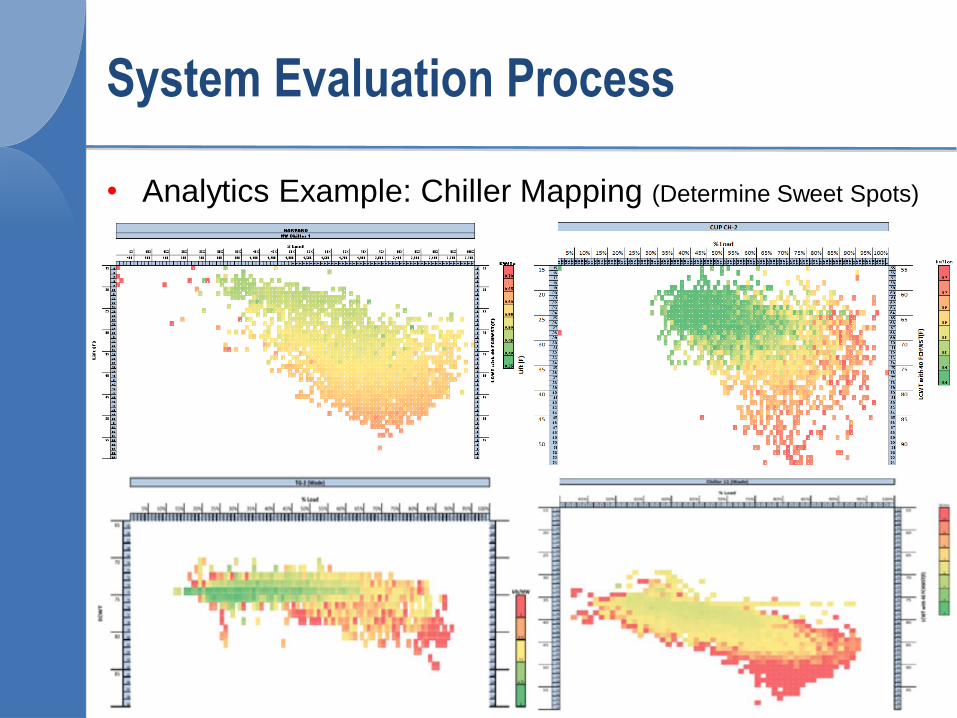
• Analytics Example: Chiller Mapping (Determine Sweet Spots)
System Evaluation Process

• Analytics Example: Cooling Tower Mapping
• Determine actual tower minimum flow rate
System Evaluation Process

• Analytics Example: Water Quality
System Evaluation Process
March 2013
August
2012
December
2012 February
2013

• Analytics Example: Bottleneck (Orifice Plate)
System Evaluation Process

• (5.1.1) Series Configuration for Chillers 9-10
• Upstream Chiller sees lower “lift” (150 Ton Improved Chiller Capacity)
• Lower CHWST during peak conditions (500 Ton Improved Dist. Capacity)
• $34,700 Annual Savings
(ECM 5.1) Wade Plant Re-Engineering

• 8760 Hour Analysis of Measures
MonthCooling
Load (Tons)
Total Chiller
Power
(kWH)
Total CHPW
Power
(kWh)
CW Pump
Power
(kWH)
CT Fan Power
(kWH)Cost ($)
Jan 73,253 42,481 5,583 16,023 4,522 $3,430
Feb 434,587 242,603 30,942 83,880 11,545 $18,449
Mar 2,366,054 1,170,524 136,124 259,735 54,696 $81,054
Apr 2,035,622 1,006,826 114,011 225,773 83,751 $71,518
May 3,439,051 1,703,912 207,288 333,584 157,903 $120,134
Jun 4,078,799 2,006,957 228,190 350,618 224,666 $140,522
Jul 5,617,310 2,807,070 315,648 440,303 291,414 $192,722
Aug 4,075,679 2,097,100 227,470 361,732 245,651 $146,598
Sep 3,999,653 1,963,882 231,896 354,066 193,669 $137,176
Oct 2,134,784 1,071,904 108,340 222,158 76,515 $73,946
Nov 1,401,126 732,718 66,521 173,286 49,594 $51,106
Dec 1,529,842 785,992 85,692 200,029 5,886 $53,880
Total 31,185,761 15,631,968 1,757,704 3,021,188 1,399,813 $1,090,534
MonthCooling
Load (Tons)
Total Chiller
Power
(kWH)
Total CHPW
Power
(kWh)
CW Pump
Power
(kWH)
CT Fan Power
(kWH)Cost ($)
Jan 73,253 42,481 5,583 11,572 4,522 $3,208
Feb 434,587 242,603 30,942 60,580 11,545 $17,284
Mar 2,366,054 1,170,524 136,124 187,587 54,696 $77,447
Apr 2,035,622 1,006,826 114,011 163,058 83,751 $68,382
May 3,439,051 1,703,912 207,288 240,922 157,903 $115,501
Jun 4,078,799 2,006,957 228,190 253,224 224,666 $135,652
Jul 5,617,310 2,807,070 315,648 317,997 291,414 $186,606
Aug 4,075,679 2,097,100 227,470 261,251 245,651 $141,574
Sep 3,999,653 1,963,882 231,896 255,714 193,669 $132,258
Oct 2,134,784 1,071,904 108,340 160,447 76,515 $70,860
Nov 1,401,126 732,718 66,521 125,151 49,594 $48,699
Dec 1,529,842 785,992 85,692 144,465 5,886 $51,102
Total 31,185,761 15,631,968 1,757,704 2,181,969 1,399,813 $1,048,573
Base Case
ECM - CWP VFD or Impeller Change
System Evaluation Process

• Hydraulic Modeling
System Evaluation Process

Summary: How to get power reduction and get
your system in shape
1. Keep operating logs; have logs reviewed by an
expert
2. Don’t be afraid of change; use state-of-the-art
technology
3. Interchange operating personal between plant and
buildings, or “cross training”
4. Provide System training to operators
5. Convert HVAC controls to process controls
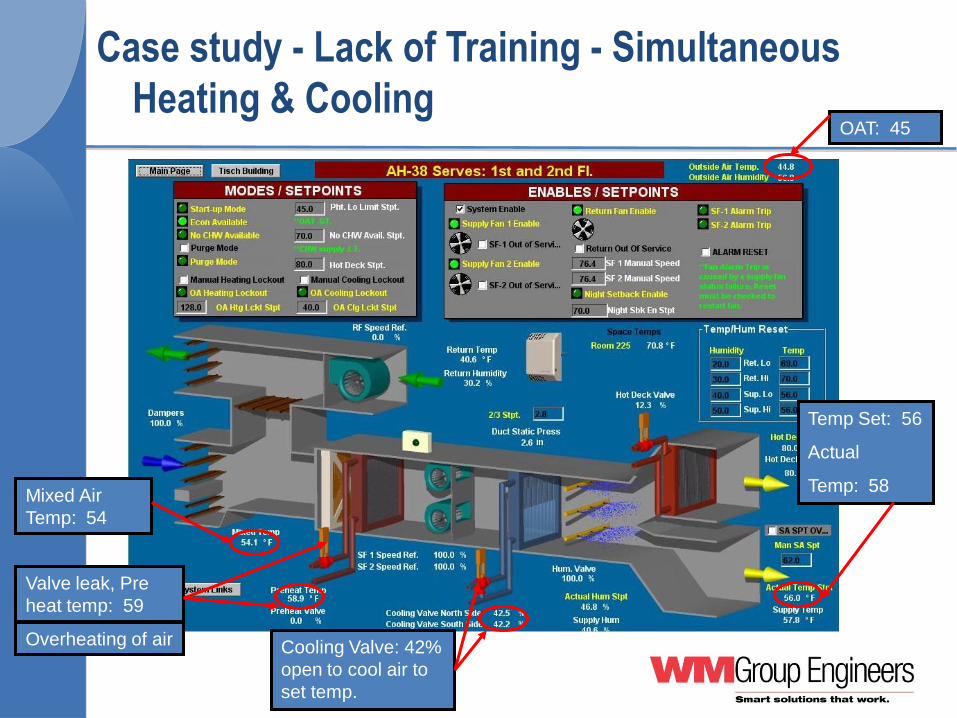
OAT: 45
Temp Set: 56
Actual
Temp: 58
Cooling Valve: 42%
open to cool air to
set temp.
Valve leak, Pre
heat temp: 59
Mixed Air
Temp: 54
Overheating of air
Case study - Lack of Training - Simultaneous
Heating & Cooling

Operators Training
• Training the operators for systems operation
yields maximum plant savings.
• Systems knowledge eliminates the “fear” of
operation thus eliminating redundant
system/product operations.
• Empowers operators to take knowledgeable
decisions during plant operation.
How can We help you
• Check the health of your central utility
infrastructure
– Email me the following
• Plant operating logs
• equipment design data
• Copies of fuel and power bills for one year
• We will review documents and provide a report
on the health of your system and opportunities
for system optimization at NO COST to you

IDEA Lifetime
Membership Award: Feb.
2013
IDEA Person of Year
Award: June 2013
Association of Energy Engineers
(AEE) Region I Energy Engineer
of the Year: Oct. 2011
Achievements

Thank You
Hemant Mehta, P.E.
President
WM Group Engineers, P.C.
(646) 827-6400
www.wmgroupeng.com


![Cogeneration&Combined [Autosaved]](https://static.documents.pub/doc/80x56/55cf94d9550346f57ba4d3d9/cogenerationcombined-autosaved.jpg)


