1 How could the ECB’s monetary policy support the sustainable finance transition? Authors: Stefano Battiston (UZH)* and Irene Monasterolo (WU)** *University of Zurich and FINEXUS Center **Vienna University of Economics and Business Version of March 22st, 2019 This is a preliminary and incomplete version of an ongoing work whose results will be continuously updated in the coming weeks. We welcome comments and suggestion to inform the discussion. The latest version of this paper and the interactive infographics of the data could be accessed at https://www.finexus.uzh.ch/en/news/cspp_sustainable_finance.html Abstract In the context of greening the financial system and promoting climate-related financial disclosure, there has been a growing debate on the sector composition of the European Central Bank’s Quantitative Easing Corporate Sector Purchase Program (CSPP) implemented by six National Central Banks (NCBs). In particular, it has been argued that the CSPP might imply a bias towards carbon intensive sectors. However, previous analyses did not develop a benchmark against which compare the CSPP sectors’ composition. We fill this gap by developing a benchmark of the Euro Area corporate bonds’ market that complies with the CSPP’s eligibility criteria set by the ECB. We obtain a benchmark composed of 1557 securities issued by 282 firms, and a CSPP universe composed of 1097 securities issued by 237 firms. Then, we compare the exposures to carbon- intensive sectors (reclassified into Climate Policy Relevant Sectors) of the benchmark, the CSPP and the individual NCB’s purchases, at the level of individual issuance and issuer. Our results show that the CSPP closely follows the benchmark, which is mostly composed of issuances from fossil fuel and carbon-intensive companies associated to long-term maturities. In contrast, green bonds’ share is still residual, despite green bonds being issued also by carbon-intensive companies. In addition, the exposure to the most carbon- intensive sectors is very heterogeneous across NCBs, with Banca d’Italia and the Bundesbank being respectively most exposed to fossil and automotive companies. Thus, in order to effectively support the sustainable finance transition without prejudice on its market neutrality, in the further steps of its CSPP, the ECB might want to introduce a weight for carbon-intensive companies that are diversifying their portfolio towards low-carbon investments (e.g. in the utility, transport, automotive sectors). This would also contribute to decrease the exposure of the Euro Area financial market and real economy to the risk of carbon stranded assets, thus preventing the onset of price volatility and financial instability. However, this would imply to consider the “shades of brown” (i.e. a negative discrimination) of economic activities in the design of the European Commission’s green taxonomy. Keywords: Central banks, Quantitative Easing, corporate bonds’ market, benchmark, green bonds. Acknowledgments: SB and IM are grateful to Pierre Monnin and Alex Barkawi (CEP) for fruitful discussions on this work. SB acknowledges financial support from the Swiss National Fund Professorship grant no. PP00P1- 144689 and the Schwyzer Winiker Stiftung. For this study, IM and SB acknowledge also the support of Institut Veblen and Positive Money Europe. IM acknowledges the support of the Austrian Climate Research Program's 10th call project Analysis of Carbon Risks in Financial Markets and Austrian Portfolios (RiskFinPorto). 1. Introduction In March 2015, the President of the European Central Bank (ECB) Mario Draghi launched the Quantitative Easing (QE) with the aim to strengthen the effect of its expansionary monetary policy program to the real economy. The QE initially targeted sovereign bonds and in June 2016 was extended to corporate bonds (i.e.
Transcript
1
How could the ECB’s monetary policy support the sustainable finance transition?
Authors: Stefano Battiston (UZH)* and Irene Monasterolo (WU)** *University of Zurich and FINEXUS Center
**Vienna University of Economics and Business
Version of March 22st, 2019 This is a preliminary and incomplete version of an ongoing work whose results will be continuously updated in the coming weeks. We welcome comments and suggestion to inform the discussion. The latest version of this paper and the interactive infographics of the data could be accessed at https://www.finexus.uzh.ch/en/news/cspp_sustainable_finance.html Abstract In the context of greening the financial system and promoting climate-related financial disclosure, there has been a growing debate on the sector composition of the European Central Bank’s Quantitative Easing Corporate Sector Purchase Program (CSPP) implemented by six National Central Banks (NCBs). In particular, it has been argued that the CSPP might imply a bias towards carbon intensive sectors. However, previous analyses did not develop a benchmark against which compare the CSPP sectors’ composition. We fill this gap by developing a benchmark of the Euro Area corporate bonds’ market that complies with the CSPP’s eligibility criteria set by the ECB. We obtain a benchmark composed of 1557 securities issued by 282 firms, and a CSPP universe composed of 1097 securities issued by 237 firms. Then, we compare the exposures to carbon-intensive sectors (reclassified into Climate Policy Relevant Sectors) of the benchmark, the CSPP and the individual NCB’s purchases, at the level of individual issuance and issuer. Our results show that the CSPP closely follows the benchmark, which is mostly composed of issuances from fossil fuel and carbon-intensive companies associated to long-term maturities. In contrast, green bonds’ share is still residual, despite green bonds being issued also by carbon-intensive companies. In addition, the exposure to the most carbon-intensive sectors is very heterogeneous across NCBs, with Banca d’Italia and the Bundesbank being respectively most exposed to fossil and automotive companies. Thus, in order to effectively support the sustainable finance transition without prejudice on its market neutrality, in the further steps of its CSPP, the ECB might want to introduce a weight for carbon-intensive companies that are diversifying their portfolio towards low-carbon investments (e.g. in the utility, transport, automotive sectors). This would also contribute to decrease the exposure of the Euro Area financial market and real economy to the risk of carbon stranded assets, thus preventing the onset of price volatility and financial instability. However, this would imply to consider the “shades of brown” (i.e. a negative discrimination) of economic activities in the design of the European Commission’s green taxonomy. Keywords: Central banks, Quantitative Easing, corporate bonds’ market, benchmark, green bonds. Acknowledgments: SB and IM are grateful to Pierre Monnin and Alex Barkawi (CEP) for fruitful discussions on this work. SB acknowledges financial support from the Swiss National Fund Professorship grant no. PP00P1- 144689 and the Schwyzer Winiker Stiftung. For this study, IM and SB acknowledge also the support of Institut Veblen and Positive Money Europe. IM acknowledges the support of the Austrian Climate Research Program's 10th call project Analysis of Carbon Risks in Financial Markets and Austrian Portfolios (RiskFinPorto).
1. Introduction In March 2015, the President of the European Central Bank (ECB) Mario Draghi launched the Quantitative Easing (QE) with the aim to strengthen the effect of its expansionary monetary policy program to the real economy. The QE initially targeted sovereign bonds and in June 2016 was extended to corporate bonds (i.e.
2
the Corporate Sector Purchase Program, CSPP) issued by Euro Area non-bank institutions. Within the CSPP, six National Central Banks (NCBs) in the Euro Area, including Banque de France, Bundesbank, Banco de Espana, Banca d’Italia, the National Bank of Belgium and the Bank of Finland, were allowed to purchase corporate bonds consistently with the rules for assets eligibility stated by the ECB1. Within the CSPP, which terminated in January 2019, the ECB purchased bonds issued by 237 companies, for 177 Md€2. The ECB has announced that, over time, it will replace the bonds that will reach their maturity with other eligible bonds. Therefore, the composition of the CSPP concerns not only the past (i.e. what has been purchased) but also the future (i.e. what will be purchased). In the context of greening the financial system3 (NGFS 2017) and promoting climate-related financial disclosure (TCFD 2017), academics and practitioners started to discuss what role (if any) the ECB’s monetary policies could play. In particular, it has been argued that the CSPP might imply a bias towards carbon intensive sectors (Barkawi 2017). Matikainen et al. (2017) posed the question of the potential misalignment of the ECB’s CSPP with the climate targets comparing the emissions’ content of the assets purchased within the CSPP with that of the economy, proxied by the Gross Value Added. Schoenmaker (2019) discusses the opportunity of greening the ECB’s asset purchase, e.g. by targeting green bonds, moving from the analysis of the 60 largest companies whose bonds were purchase by the ECB. In order to advance the conversation on what role could the ECB play in the low-carbon transition, it is important to develop a benchmark against which to compare the CSPP sectors’ composition. This step is crucial because it allows to make statements about the alignment of the European market and ECB’s monetary policy to sustainability, beyond the CSPP. Building the benchmark is not trivial. Indeed, ECB’s eligibility criteria sometimes leave space for interpretation at the level of individual firm (e.g. in the finance sector), and because the ECB doesn’t publish the amount effectively purchased by each NCB. We contribute to fill in this gap by providing the first methodology to assess the exposure of NCB’s CSPP to carbon-intensive sectors reclassified into Climate Policy Relevant Sectors (CPRS, reclassified into Climate Relevant Sectors based on their direct and indirect contribution to Greenhouse Gases (GHG) emissions at the NACE 4-digit level, see Battiston et al. 2017) and to compare the carbon intensity of individual NCB’s CSPP portfolio with the other NCBs and with the respective benchmark in the corporate bonds’ market. As a main innovation, we consider the business model of the individual companies issuing the bonds purchased within the CSPP and thus their real economic sector of economic activity (also for issuers classified by data providers and NACE Rev2 as “financial-others”), and their carbon intensity per unit of revenues. Our analysis builds on the Climate Stress-test methodology developed by Battiston et al. (2017), which estimated the direct and indirect exposures of individual equity portfolios to carbon-intensive sectors and computed the climate Value at Risk to assess the largest losses on investors’ portfolios, based on the classification of economic sectors (at NACE 4-digit level) into CPRS. This allows to account for direct and the indirect role of fossil fuels emissions in the economic value chain. Here, we further refine the original CRS classification by differentiating between high and low-carbon transportation, which includes respectively automotive and aero-transport, and railways. This is important because a large share of NCBs’ CSP purchase is represented by automotive, motorways and related activities that has a larger contribution to Greenhouse Gas (GHG) emissions than railways. Our approach is modular and composed of the following steps. First, we build the corporate market benchmark, i.e. we build a Euro Area corporate bonds’ universe as close as possible with the characteristics of the ECB’s CSPP in terms of eligibility criteria. Our benchmark includes the business (e.g. amount outstanding, maturity, residency) and NACE sectors’ characteristics of the company issuing the bonds, its financial characteristics (e.g. maturity), its environmental characteristics (e.g. European Social Governance (ESG) criteria) and its carbon intensity by unit of revenue, thus allowing to assess the carbon intensity of the individual bonds included in the benchmark. Second, we collect and analyze the same information for the CSPP purchase implemented by the six NBCs at the level of individual issuer and security (by ISIN) in order to
1 https://www.ecb.europa.eu/press/pr/date/2016/html/pr160421_1.en.html 2 At the time our analysis was conducted. Updated estimates are available at https://www.ecb.europa.eu/mopo/implement/omt/html/index.en.html#cspp 3 https://bit.ly/2QaSOmU
3
compare the carbon intensity of the CSPP across the NCBs. Third, we compare the CSPP portfolio of the six NCBs that coordinated the purchases in the Euro Area in terms of exposure to individual high-low carbon company. We focus on Banque de France because it has the largest CSPP value (in terms of outstanding amount) among the six NCBs. Finally, we discuss the results of ECB and NCB’s exposure to carbon intensive assets at the light of the EU2030 climate and energy targets and the European Commission’s Sustainable Finance Action Plan (EC COM (2018) 97 final), providing recommendations to foster the alignment of the ECB’s monetary policies with the EU2030 targets. The document is organized as follows. Section 2 presents the data used, while section 3 presents the methodology and the challenges addressed. Section 4 presents the preliminary results for the benchmark universe, for the CSPP and NCBs’ portfolios. Section 5 concludes providing some recommendations on how the ECB’s monetary policy could effectively support the sustainable finance transition. 2. Data In this section we describe the financial data used and the sectors of economic activities considered in the CPRS revised classification. 2.1 Financial data For our analysis, we use corporate bonds data for the Euro-Area and Eurobonds markets obtained from the financial data provider Thomson Reuters (TR) Eikon because it allows us to define interactively the criteria for the corporate bonds’ universe needed for the analysis. The corporate bonds universe is composed of 14.122 securities. In order to make the benchmark universe comparable with the characteristics of the ECB’s CSPP, we consider only corporate bonds issued until 31.01.2019 by the 19 Euro-Area countries (and include the Eurobonds market) by non-bank institutions, investment grade and with maturity lower or equal to 30 years. Importantly, the CSPP excludes corporate bonds issued by the banking sector but includes those issued by other financial activities (and classified as “financial-others”). Being the latter a consistent part of the portfolio, we have reclassified them based on the main business of the parent company. For each security, TR Eikon provides the standard company information (e.g. ISIN, legal identifier, company common name), security information (issue date, amount outstanding, amount issued, coupon, maturity, etc.), NACE Rev2 sector of economic activity (at 4-digit level), and “environmental performance” information (e.g. ESG score, CO2 emissions, CO2 emissions intensity). However, for several securities the environmental performance information is missing. Therefore, we decided not to consider it in our analysis. CSPP data are obtained from the ECB website, which contains the following information: ISIN code of the bond, issuer name, maturity and coupon. The CSPP were purchased by National Central Banks (NCB), i.e. Belgium, France, Finland, Germany, Italy, Spain. 2.2 Economic activity data Sectors of economic activity: We follow two classifications of economic sectors, i.e. the NACE Rev2 (Nomenclature statistique des activités économiques dans la Communauté européenne), which is adopted by Eurostat to classify the economic activities at a 4-digit level, and the NAICS 2017 classification, mostly used in the US. Indeed, by mapping NACE 4-digit sectors into NAICS (North American Industry Classification System) sectors we obtain a more precise description of sectors’ technology, in particular for energy and electricity-related investment. NACE sectors are listed from A—Agriculture, forestry, and fishing to U—Activities of extraterritorial organizations and bodies. Thus, in principle, it would be possible to associate the exposure of a specific financial instrument to a specific sector of economic activity with a level of detail that would allow us to distinguish between carbon-intensive (and thus highly exposed to climate policies) and low-carbon sectors. Nevertheless, this classification is subject to some limitations, in particular as regards the classification of activities within a relevant sector for our analysis, i.e. sector B – mining and quarrying, and sector D – Electricity, gas, steam, and air conditioning supply, and their contribution to Greenhouse Gases (GHG) emissions. Indeed, the level of aggregation of the NACE Rev2 classification of economic activities for which
4
GHG emissions are available hides the heterogeneity of the contribution of different activities classified within the same sector to GHG emissions. GHG emissions for activity at the NACE 4-digit level are not available, thus preventing us from the tempting option of classifying sectors by their emissions’ intensity. For instance, sector C-Manufacturing, which contributes to 26% circa of cumulative CO2 emissions, includes a broad range of activities such as Manufacture of food products, beverages, and tobacco products (CA), Manufacture of coke and refined petroleum products (CD), and Manufacture of computer, electronic, and optical products (CI), which currently cannot be disentangled (Monasterolo et al. 2017). 3. Methodology A first attempt to assess the exposure of the CSPP portfolio at the level of individual NCBs in the Euro Area at to CPRS, at the individual firm/issuer level, is provided. For each issuer included in the benchmark and in the CSPP, we consider the following information: • Financial characteristics, including maturity, date of issue, amount outstanding, price. • Economic characteristics, including the description of their sector of economic activity at the NACE 4-digit
level and the main business. • Environmental characteristics: CO2 equivalent emissions per revenues, ESG scores, Scope 1 and Scope 2
scores, green bonds. The CRS introduced in Battiston et al. (2017) are revised by disaggregating the transport sector into high and low-carbon transportation. In addition, we analyse the carbon intensity of the corporate bonds by looking at the CO2 equivalent emissions per revenues. The added value of our approach is thus twofold. On the one hand, it allows us to consider the carbon intensity of the business model of the individual issuer. On the other hand, it allows to look at the macrotrends of alignments of individual and cumulative purchases by individual NCB with the EU2030 targets. 3.1 Building the corporate bonds’ benchmark universe We have built a benchmark dataset by reproducing as close as possible the criteria of eligibility followed by the ECB’s CSPP. First, we have considered all corporate bonds, issued by non-banking companies domiciled in the Euro Area, being investment grade, in Euro currency. In addition, within the ECB criteria, one refers to a possible jurisdiction weight. However, in absence of further information, we did not attempt to replicate any country weight. Second, we have replaced the NACE 4-digit code of the issuers in the financial sector that are subsidiaries of non-financial corporations in NACE B (Mining and quarrying), C (Manufacturing), and D (Electricity, gas, steam and air conditioning supply), with the respective NACE code of the parent company, and issuers with NACE K-64 (Financial service activities) while we kept K-65 (Insurance, reinsurance and pension funding) and K-66 (Activities auxiliary to financial services and insurance activities). We obtain a benchmark composed of 1.557 securities issued by 282 firms, for a total amount outstanding across maturities equal to 809.859 bn EUR. 3.2 Collecting information on CSPP ECB’s CSPP data contains the following information: ISIN code of the bond, issuer name, maturity and coupon. However, ECB CSPP data does not contain the following information • The sector of the issuer and the amount issued. • The amount purchased by each NCB. • Issue date. Furthermore, it is not clear if the issuer name is compliant to a known standard, and the LEI is not provided. Therefore, the identification of the issuer has to be done through the ISIN. The data providers allow to identify issuers through the ISIN but use different standards for the other variables. We also observe few cases (two) where the same corporate bonds could have been purchased by two different NCBs. The set of CSPP securities in the dataset obtained from the ECB on January 25th, 2019 is 1202, from which we removed those with missing amount or missing LEI in TR, and those included in sector K – finance issued by
5
banks but keeping K-65 (Insurance, reinsurance and pension funding) and K-66 (Activities auxiliary to financial services and insurance activities). Thus, in selecting the dataset for our analysis building the benchmark the exclude about 100 securities. However, they are related to issuers in the financial sector that do not belong directly to CPRS. We are left with 1097 securities (i.e. 91.3% of the original 1202 securities), issued by 237 firms. The total amount outstanding across maturities is 750.278 billion EUR. In addition, we should notice that several issuers are subsidiaries of the same corporate entity. Whenever possible, by crossing the LEI of the Issuer on BdD Orbis, we have identified its Controlling Shareholders and assigned as Issuer Consolidated the entity that is closest to the Global Ultimate Owner on the ownership pathway and that is a corporate (and not e.g. a physical person or a foundation). 3.3 Dataset consolidation Data consolidation in a unique dataset was required for two reasons. First, the corporate bonds’ information of the benchmark universe necessary for this analysis are not made by the data provider in a single online database, but they are located across several spreadsheets (e.g. the NACE classification, ESG scores). Second, the data on CSPP provided by the ECB did not include the company’s business and sector information, nor the environmental performance. We rescued this information from TR Eikon and then merged it with the existing information. 3.4 Sectors’ classification into Climate Policy Relevant Sectors Many corporate bonds included in the benchmark universe and in the CSPP are issued through financial subsidiaries of parent companies in climate relevant sectors. Most relevant examples are automotive, extraction and production of petrol and gas, and producers of fertilizers. These are classified in TR under “financial-other” and assigned a finance-related NACE identifier in many cases. To overcome this issue, we reclassify each individual corporate bond included in “financial-other” according to the core business of the parent company. We build on the classification of sectors of economic activity in Climate Policy Relevant Sectors (CPRS) developed in Battiston et al. 2017, which include: i) fossil fuels, ii) utility, iii) energy intensive, iv) transport, v) housing. So far, the methodology for the calculation of Scope 3 is still largely unclear because emissions induced downstream from companies that produce energy are self-declared by the same companies and no standardized reporting is available. Thus, this doesn’t show the full responsibility of the fossil fuel sector in emissions direct and indirect production. Further, ESG scores are often inconsistent across data providers and even within the same classification (e.g. Volkswagen score during the Diesel scandal was better than Tesla’s one). In this regard, the CPRS classification allows to consider both the direct and indirect contribution of individual activities to GHG emissions, as well as the activity’s inclusion in the EC’s carbon leakage classification, and the business model of the company. In addition, we refine the CPRS by disaggregating the transport sector into high and low-carbon, respectively for automotive, aeromotive, and related activities, or railways and related activities. This allows to adopt a sector-based approach to the analysis of the carbon intensity of the CSPP and to overcome main limits of ESG classifications and emissions’ reporting at the NACE sector level (Monasterolo et al. 2017). The rationale of the main carbon-intensive sectors is as follows: Fossil fuels: we consider how much of the revenues depend both direct and indirect on selling fossil fuels along the value chain. We include gas in fossil fuels and we consider fossil as a single sector. We are aware of the debate on whether gas should be considered a successful tool for the low-carbon transition. However, recent research shows that data on leakage from gas transportation is highly underestimated (Alvarez et al. 2018) and that overall investing in gas as a bridge could eventually delay the transition to a low-carbon economy (Roberts 2018). Overall, fossil-fuel and utility sectors deserve a main attention because they are the ones directly responsible for GHG emissions from the energy sector (28% in the EU, EEA 2018), and indirectly from the other sectors of economic activities, and they represent a large share of the NCBs’ CSPP portfolios. We consider all activities for which the revenues depend primarily on GHG emission, such as sectors that include Extraction of crude petroleum (NACE 06.10), Extraction of natural gas (NACE 06.20), Manufacture of
6
refined petroleum (NACE 19.20), Distribution of gaseous fuels through mains (NACE 35.22), Distribution of electricity (NACE 35.13), Support activities for petroleum and natural gas extraction (NACE 09.10), etc. Utility: we include in this sectors companies that don’t produce fossil fuels but electricity either from fossil fuel or renewable energy sources (or both, see the case of Enel). At this first stage of the analysis, we do not distinguish between utility firms that have GHG emission reduction policies (e.g. by shifting the energy they use for the production of electricity towards renewables), and traditional, fossil fuels-based utility companies. This is due to the fact that the data on GHG intensity (the data on ratio of CO2-equivalent Kg per Euro) we obtained so far is very sparse and not much populated. Transportation: we divide it in carbon intensity and low carbon activities. This classification is far from perfect, but it reflects current state of affairs and data reporting. Indeed, the relevance of the transportation sector for climate is due to its important share of GHG emissions in the economy. In the EU-28, GHG emissions from fuel combustion (without transport) is responsible for 54% of in 2016, while fuel combustion for transport (including international aviation) is the second most important source sector with 24% in 2016. In addition, GHG emissions from transport (including international aviation and excluding international shipping) increased by 26% compared with 1990 levels in the EU-28, reaching 1097 Mio CO2 tons equivalent in 2017. In particular, road transport accounts for 72% of total GHG emissions of the sector (EEA 2018). Activities in the transportation sector can in principle contribute to reduce GHG emissions, e.g. a shift towards train versus road. Since data about the bonds issued by companies involved in the production of electric cars are very poor, we choose to compare: • Activities related to railroads (e.g. manufacturing of trains and railroads infrastructures, railroad services),
the rational being that investing in railway services contributes to decrease GHG emissions from car use; • Activities related to car transportation (manufacturing of motor vehicles, services for land transport,
construction and management of roads), air transportation, sea transportation, the rational being that investing in these activities contributes to increase GHG emissions from the transport sector.
4. Discussion of results 4.1. Benchmark’s portfolio composition by amount outstanding, maturity and sector Figure 1 shows the CPRS composition, maturity and amount outstanding of the corporate bonds that compose the benchmark. We notice that carbon-intensive sectors (within the CPRS classification), and in particular in carbon intensive transportation, fossil-fuel, utility and energy-intensive sectors, represent the largest share of the Euro Area corporate bonds’ market. This means that currently, the Euro Area bonds’ market is mostly carbon-intensive (i.e. “brown”). In addition, this carbon-intensive bias is due to persists due to the prevailing longer-term maturities. In contrast, the share of low-carbon transportation on the total (i.e. the most of green bonds issued in the Euro Area corporate bonds’ market) is residual, yet slightly increasing until 2033. These results show that nor the current neither the longer-term maturity composition of the corporate bonds’ market is aligned to the EU2030 targets, and that the corporate bonds’ market will not be able to contribute to the achievement of the EU2030 targets given the minimal share of green bonds.
7
Figure 1: Composition of the benchmark as a share of the total amount outstanding (e.g. 0.6 equals 60%) (left) and by amount outstanding (in bn Eur, right), by CPRS sector (color) and maturity (from 2019 to 2040). FracYearBench represents the fraction of amount outstanding of the benchmark by year of maturity. 4.2 CSPP’s portfolio composition by amount outstanding, maturity and sector In contrast, Figure 2 provides the breakdown by amount outstanding, sector and maturity, both in Eur billion and as a share of the amount outstanding for the CSPP portfolio of the six NCBs. We notice that the CSPP’s portfolio composition is not aligned to the EU2030 targets, and that even in the long-term, the CSPP portfolio will be locked-into carbon-intensive sectors. In addition, the composition by CPRS of the CSPP closely follows the composition of the benchmark, thus confirming the accuracy of the benchmark’s selection as also shown by Table 1, and by Figure 3. The ECB’s director Draghi claimed that the CSPP mimicked the composition of the bonds’ market in order to be “sector neutral”. In this regard, Figure 3 also shows that the composition of both the market benchmark and the CSPP is skewed towards carbon-intensive sectors, with a larger exposure to fossil fuel and a lower exposure to low-carbon transportation than the market, and thus clearly misaligned with the EU2030 targets.
8
Figure 2: Composition of the CSPP’s portfolio as a share of the total amount outstanding (e.g. 0.6 equals 60%) (left) and by amount outstanding (in bn Eur, right), by CPRS sector (color) and maturity (from 2019 to 2040). FracYearCSP represents the fraction of amount outstanding of the CSPP by year of maturity.
Table 1: Composition of the benchmark (FracBench) and of the CSPP (FracCSP) composition by Climate Policy Relevant Sector, as a share of the total amount outstanding. We notice that the sector composition of the CSPP closely follows that of the benchmark.
Figure 3: comparison of the CPRS composition of the benchmark and the CSPP, as a share of the total (0.2 equals 20%). We notice that the sector composition of the CSPP closely follows that of the benchmark, and that both are mostly exposed to carbon-intensive transportation, energy-intensive, utility and fossil fuel sectors. 4.3 Banque de France’s CSPP portfolio composition by amount outstanding, maturity and sector
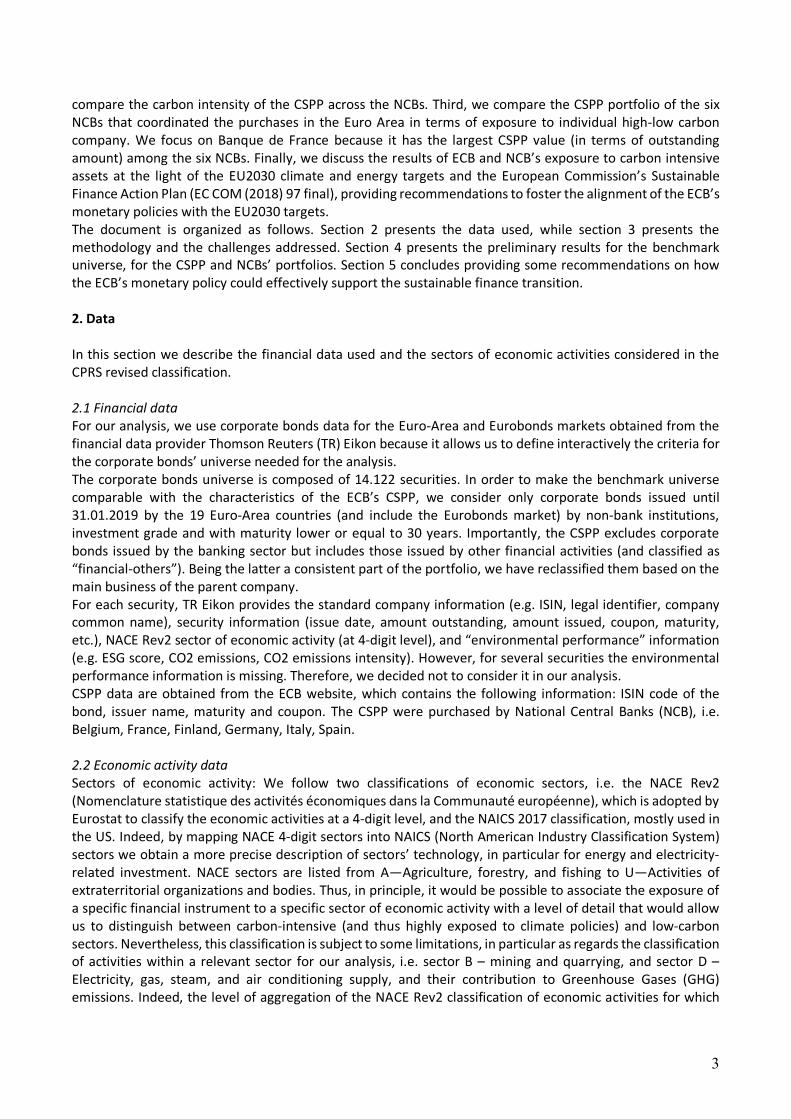
Figure 4 provides the breakdown by CPRS, maturity and amount outstanding, both in Eur billion and as a share of the amount outstanding, for the CSPP portfolio of Banque de France (BdF). We notice that BdF’s CSPP portfolio composition, both by amount outstanding and as a share of total amount outstanding is more exposed to the utility sector and less exposed to fossil-fuel and carbon-intensive transportation CPRS in comparison with the CSPP and the benchmark. This largely reflects the composition of the French economy where utility companies play a relevant role. This difference is particularly evident in the bonds with the longest-maturity (i.e. from 2034 to 2039).
Figure 4: Composition of the BdF’s CSPP portfolio as a share of the total amount outstanding (e.g. 0.6 equals 60%) (left) and by amount outstanding (in bn Eur, right), by CPRS sector (color) and maturity (from 2019 to 2040). FracYearBdF represents the fraction of amount outstanding of BdF by year of maturity. 4.4 Comparing the CPRS composition of the benchmark, the CSPP and BdF’s portfolios 4.4.1 Benchmark vs CSPP By comparing the overall CSPP and the benchmark portfolios (in fraction of amount outstanding) in terms of the composition by CPRS (Figure 5), we notice that the largest share is represented by corporate bonds issued by firms in other sectors, followed by carbon-intensive transportation, by energy-intensive and by fossil-fuel. While the benchmark has a larger relative exposure to carbon-intensive transportation in comparison to the CSPP, this latter has a larger relative exposure to fossil-fuel, energy-intensive and utility CPRS than the benchmark. For both universes, low-carbon transportation represents one of the lowest shares in value.
10
Figure 5: Fraction of bonds by CPRS out of the total amount outstanding (e.g. 0.2 equals 20%). FracCSP represents the fraction of amount outstanding of the CSPP, fracBench represents the fraction of amount outstanding of the benchmark.
Figure 6: Fraction of bonds by CPRS and individual bonds’ issuer by amount outstanding out of the total (e.g. 0.2 equals 20%). FracCSP represents the fraction of amount outstanding of the CSPP, while fracYearBench represents the fraction of amount outstanding of the benchmark. By looking at the composition by individual corporate bonds’ issuer of the CSPP and the benchmark (Figure 6), we notice that the largest individual corporate bonds’ purchase by amount are in carbon-intensive transportation, where Volkswagen, Daimler and BMW represent the largest share, and in the utility sector, where Electricite France SA and Engie SA represent the largest share. In contrast, renewable energy companies e.g. Veolia Environment are residual Further, we compare the CPRS allocation of BdF’s CSPP portfolio with the benchmark (Figure 7). We notice that BdF has a larger exposure to energy-intensive and utility CPRS and a smaller exposure to carbon-intensive and fossil-fuel CPRS in comparison with the benchmark, as a share of the value of the portfolios. Low-carbon transportation represents one of the smallest shares of bonds for both universes.
11
Figure 7: Fraction of bonds by CPRS out of the total amount outstanding (e.g. 0.2 equals 20%). FracNCB_FR represents the fraction of amount outstanding of BdF, while fracYearBench represents the fraction of amount outstanding of the benchmark. Finally, we provide a breakdown of the composition by CPRS and individual bond’s issuer of BdF’s CSPP portfolio (Figure 8). We notice that BdF is highly exposed to very few issuers in the utility sector, i.e. Electricite de France and Engie SA, while the energy intensive sector is dominated by bonds issued by Sanofi SA, the carbon-intensive transportation by Vinci SA, and the fossil-fuel sector by Total SA.
Figure 8: Fraction of bonds by CPRS and individual bonds’ issuer out of the total amount outstanding (e.g. 0.2 equals 20%). FracNCB_FR represents the fraction of amount outstanding purchased by BdF, while fracYearBench represents the fraction of amount outstanding of the benchmark. 4.5 Shades of green: the green corporate bonds market in the Euro Area We then look at the share of green bonds in BdF’s CSPP portfolio and we compare it with the CSPP’s portfolio of the six NCBs (Figure 9). It emerges that green bonds represent a very small share of both portfolios, and
12
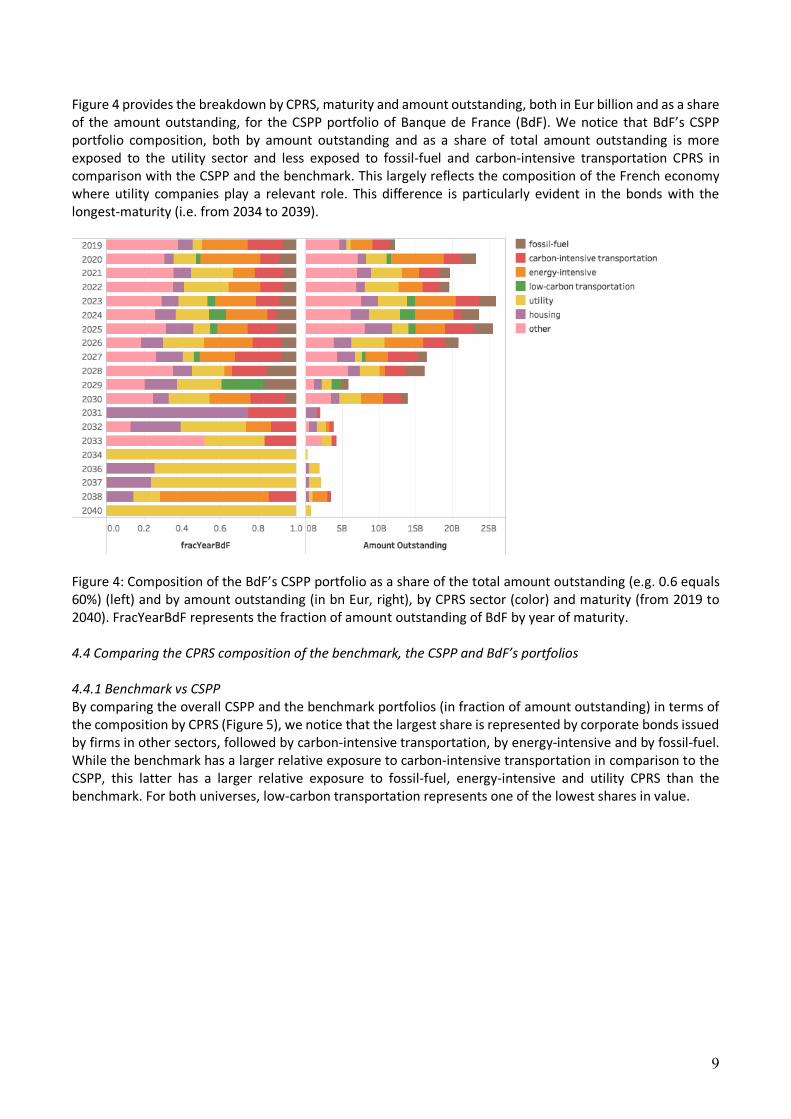
that BdF’s share of green bonds on its total CSPP portfolio is lower than the overall CSPP portfolio of the six NCBs and characterized by shorter maturity (up to 2029). We also see that green bonds have in average lower maturity that the rest of the bonds (last maturity date being 2036).
Figure 9: Fraction of green bonds out of the total amount outstanding (e.g. 0.03 equals 3%) by year of maturity. FracYearBdF represents the fraction of amount outstanding of BdF, fracYearCSP represents the fraction of amount outstanding of the CSPP, fracYearBench represents the fraction of amount outstanding of the benchmark.
Figure 10: Composition of green bonds’ outstanding in relative terms (e.g. 0.03 equals 3%) by CPRS sector. FracCSP represents the fraction of amount outstanding of the CSPP, while FracBench represents the fraction of amount outstanding of the benchmark. Then, Figure 10 shows the green bonds’ individual issuances by CPRS for both the overall CSPP and the benchmark. We first notice that the CSPP has a slightly larger exposure to green bonds than the benchmark. The largest issuers of green bonds are utility companies, followed interestingly by fossil fuel companies and by firms in the housing sector. This reflects the fact that several fossil fuels’ firms have already started to diversify their activities towards low-carbon energy production (on which they could issue the green bonds), thus decreasing their share of potential carbon stranded assets. The same hold for carbon-intensive
13
transportation companies. In the utility sector, this evidence is striking, and indeed the largest share of the green bonds (or climate bonds, if we follow the Climate Bonds Initiative classification) is represented by renewable energy and energy efficiency sectors. However, the value of the green bonds remains residual on the overall value of the CSPP and of the benchmark portfolios.
Figure 11: Fraction of green bonds’ purchases by amount outstanding in relative terms (e.g. 0.03 equals 3%) by CPRS sector. FracCSP represents the fraction of amount outstanding of the CSPP, while fracBench represents the fraction of amount outstanding of the benchmark. Figure 11 shows the largest individual issuers of green bonds by CPRS both within the CSPP and the benchmark, in share of the value of the two portfolios. The largest issuers in the utility sector is Iberdrola (Spain), followed by Engie (Germany) and Enel (Italy). Then, we find three issuers in the fossil-fuel sector, i.e. Naturgy SA (France), Hera SpA (Italy) and Iren SpA (Italy). Within the low-carbon transportation CPRS, Ferrovie dello Stato (Italy) and Terna SpA (Italy) have issued green bonds, while within the carbon-intensive transportation sector Royal Shiphol Group (The Netherlands) and ALD SA (France) have issued green bonds. Finally, we compare the CPRS composition of the CSPP purchase across the six NCBs as a share of total amount outstanding and in bn Eur (Figure 12). First, we clearly notice the relevance of the value of BdF’s portfolio on the overall CSPP. Then, Figure 12 (left) shows that BdF’s exposure isn’t concentrated on a specific sector, despite a larger exposure to energy-intensive and utility. In contrast, among the six NCBs, the Bundesbank has the largest relative exposure to carbon-intensive transportation, and Banca d’Italia has the largest relative exposure to fossil-fuel. By plotting the six NCBs’ CSPP exposures by sector in value of amount outstanding (right), it emerges that BdF has the largest portfolio in value, followed by the Bundesbank (DE) and the National Bank of Belgium (BE). In contrast, the lowest CSPP’s amounts outstanding belong to the Bank of Finland and Banco de Espana.
14
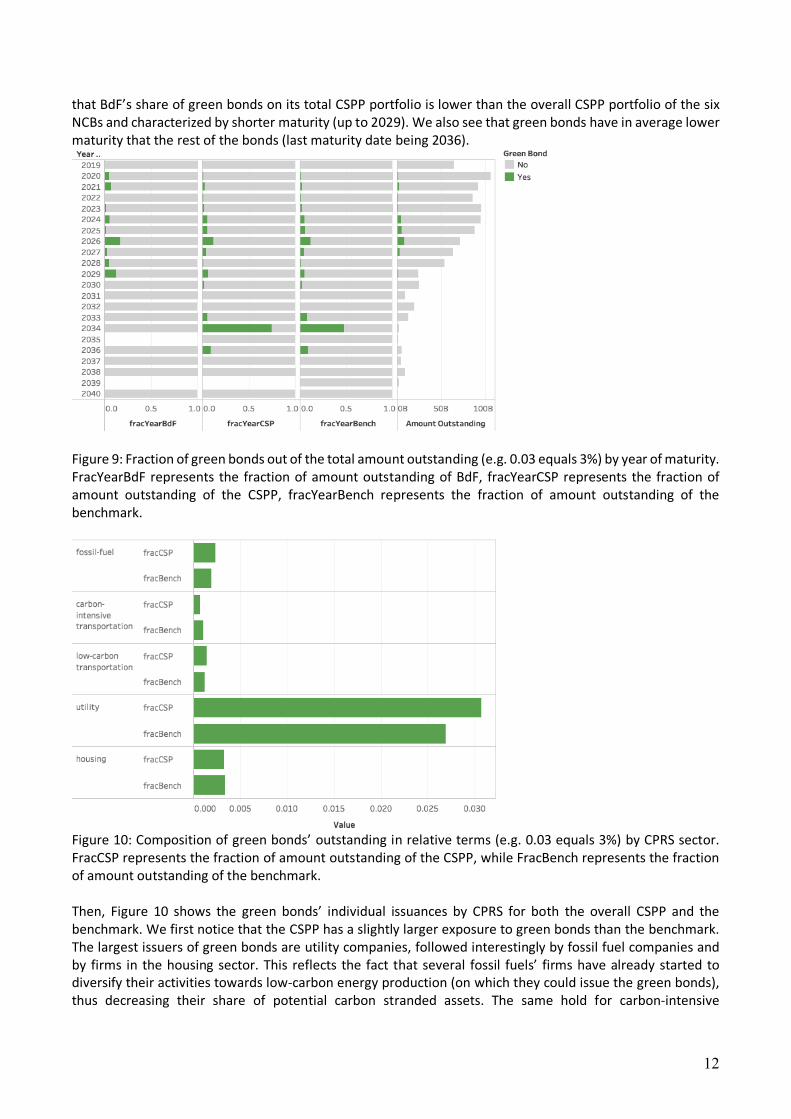
Figure 12: Composition of the six individual NCBs’ CSPP portfolio by CPRS as a share of the total bonds’ amount outstanding (e.g. 0.5 equals 50%, left) and in value of amount outstanding in bn Eur (right). 4.5 Shades of brown of the corporate bonds’ market In Figure 13, by looking at the composition of the fossil-fuel CPRS by individual bonds’ issuer and NACERev2 4- digits subsector for the benchmark, we notice that the largest issuer in the benchmark is ENI SpA (Italy, manufacture of refined petroleum), followed by Total SA (France, extraction of crude petroleum) and Snam SpA (Italy, transport via pipeline).
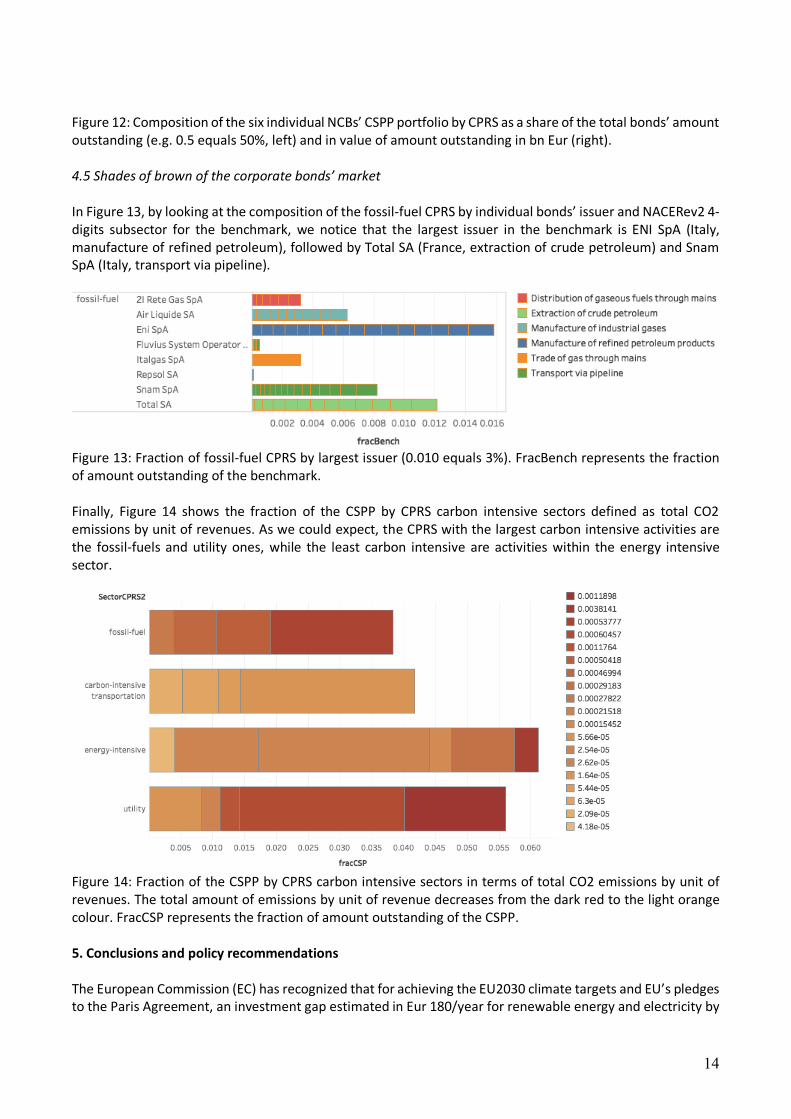
Figure 13: Fraction of fossil-fuel CPRS by largest issuer (0.010 equals 3%). FracBench represents the fraction of amount outstanding of the benchmark. Finally, Figure 14 shows the fraction of the CSPP by CPRS carbon intensive sectors defined as total CO2 emissions by unit of revenues. As we could expect, the CPRS with the largest carbon intensive activities are the fossil-fuels and utility ones, while the least carbon intensive are activities within the energy intensive sector.
Figure 14: Fraction of the CSPP by CPRS carbon intensive sectors in terms of total CO2 emissions by unit of revenues. The total amount of emissions by unit of revenue decreases from the dark red to the light orange colour. FracCSP represents the fraction of amount outstanding of the CSPP. 5. Conclusions and policy recommendations The European Commission (EC) has recognized that for achieving the EU2030 climate targets and EU’s pledges to the Paris Agreement, an investment gap estimated in Eur 180/year for renewable energy and electricity by
15
2030 has to be filled. However, at the lunch of the EC’s Sustainable Finance Action Plan (SFAP), both President Juncker and Mr. Dombrovski recognized that the public sector cannot fill the gap it on its own, and that private finance and capital markets are needed to deliver on the political commitments. Thus, the transition to sustainable finance would be crucial to allow, on the one hand, the alignment of the EU market to sustainability and, on the other hand, avoid risk of losses related to carbon stranded assets (Caldecott 2018). Recently, Battiston et al (2017) Climate Stress-test of the financial system showed that a disordered transition to the low-carbon economy could imply significant losses for investors whose portfolios are highly exposed to carbon intensive assets and sectors (Battiston et al. 2017), including for development finance institutions (Monasterolo et al. 2018), and or governments. In this regard, Battiston and Monasterolo provided the first carbon risk assessment of a central bank’s portfolio, in collaboration with the Austrian National Bank (OeNB) (Battiston and Monasterolo 2019) that prices countries’ GDP carbon-intensity in the present value of their sovereign bonds with a new metric, the climate spread. They find that the misalignment of the economy to the low-carbon transition could worsen the fiscal and financial risk conditions of the country. Further, such risks could be amplified by financial actors’ interconnectedness in the financial network (ESRB 2016). If large assets classes and systemic actors are involved, there would be implications for assets price volatility (both in carbon-intensive and low-carbon sectors) and thus for financial stability (Monasterolo et al. 2017). In this regard, several central banks started to analyse the relation between climate risks and financial stability, after the Governor of Bank of England Mark Carney’s speech about the “Tragedy of the Horizons” (Carney 2015). Several central banks and financial regulators joined a Network for Greening the Financial System (NGFS) that recommended, among the others, to foster investors’ disclosure of climate-related financial risks, and the introduction of forward-looking stress-tests, also for their portfolios (NGFS 2018). The ECB has also started to consider risks for financial stability stemming from climate change. As Draghi stated in several occasions in 2018, the “The ECB supports and welcomes a number of initiatives on sustainable finance of the EU and international fora”, and “recognizes that the correct pricing of financial risks stemming from climate change is key to promoting sustainable development and preserving a well-functioning financial system.4” With regard to the ECB, there has been a growing debate on the sector composition of its QE CSPP, implemented by six National Central Banks (NCBs) and that injected 178 bn Eur in the Euro Area market since June 2016. It has been argued that the CSPP might imply a bias towards carbon intensive sectors (Barkawi 2017, Matikainen et al. 2017), thus recommending the ECB to greening its monetary policy, e.g. via the purchase of green bonds (Schoenmaker 2019). In order to advance the discussion on the conditions under which the ECB’s monetary policies could contribute to align the European financial market and real economy to sustainability, it is important to build a benchmark against which compare the CSPP sectors’ composition. We fill this gap by developing a benchmark of the Euro Area corporate bonds’ market that complies with the CSPP’s eligibility criteria set by the ECB, showing the challenges that we experienced in constructing the universes by relying on public available data provided by different financial data providers. We obtain a benchmark composed of 1557 securities issued by 282 firms, and a CSPP universe composed of 1097 securities issued by 237 firms. Then, we compare the exposures to carbon-intensive sectors (reclassified into CPRS, Battiston et al. 2017) of the benchmark, the CSPP and the individual NCB’s purchases, at the level of individual issuance and issuer. Our results show that the CSPP closely follows the benchmark, which is mostly composed of issuances from fossil fuel and carbon-intensive companies associated to long-term maturities. In contrast, green bonds’ share is still residual, despite green bonds being issued also by fossil fuel and carbon-intensive companies. In addition, the exposure to the most carbon-intensive sectors is very heterogeneous across NCBs, with Banca d’Italia and the Bundesbank being respectively most exposed to fossil and automotive companies, and Banque de France being most exposed to energy intensive sector. Our approach allows to assess the carbon-intensity of the corporate bonds’ market in the Euro Area and of the NCBs’ CSP purchases in terms of current composition, values and market tendencies, such as the green bonds market. In particular, our analysis contributes to answer to three research questions: 4 Draghi’s reply to Mr Paul Tang’s letter (QZ-004), Frankfurt am Main, 21 February 2019 L/MD/19/049. Available from: https://bit.ly/2txs8jd
16
1. To what extent is the Euro Area corporate bonds’ market aligned to the EU2030 targets? 2. To what extent is the ECB’s CSPP aligned to the EU2030 targets? 3. Do individual NCBs’ differ in terms of carbon intensity of their CSPP?
Our results, despite being still preliminary, suggest that: • The composition of the CSPP is much aligned to the benchmark, which is mostly populated by carbon-
intensive firms. However, there is a number of elements that suggest that there is a strong misalignment to the EU2030, both in the short and also in the long term, based on its maturities.
• Based on the sectorial composition (CPRS), there are elements to support that the Euro Area corporate bonds’ market is not aligned to the EU2030 targets, according to i) the structure of the maturity, ii) the high exposure to fossil fuel and carbon-intensive transportation, and iii) very limited share of green bonds.
• This means that the neither the corporate bonds’ market, nor the CSPP or the green corporate bonds’ market alone would contribute to achieve the EU2030 targets and fill the green investment gap.
• There are relevant differences in the “shades of brown”, i.e. the carbon intensity, of the corporate bonds purchased by the individual NCBs. For instance, Banca d’Italia shows the largest exposure to the fossil fuel sector, the Bundesbank has the highest exposure to automotive, while Banque de France has the highest exposure to the utility sector, i.e. Electricite de France and Engie SA, the energy intensive sector, which is dominated by bonds issued by Sanofi SA, and the fossil-fuel sector by Total SA. These results highlight the role of timely and targeted climate-aligned policies in those countries whose real economy and market is still heavily biased towards fossil fuel and carbon intensive sectors, in order to tame risks of economic competitiveness and financial stability.
• The ECB (and the NCBs) could contribute to signal the corporate market towards sustainability by adjusting the composition of the CSP portfolio, in particular by replacing its exposure to the corporate bonds of companies that have not embraced the transition yet with bonds issued by companies in the low-carbon sectors or companies that diversified their business.
• It would be possible to be more granular, but this would require firms to disclosure their alignment to the technology roadmap (e.g. energy mix). If disclosure at the level of individual corporation is implemented, it would be possible for the NCBs to identify those companies that are engaging in the low-carbon transition by diversifying their portfolio, even in sectors traditionally contributing to GHG emissions (e.g. traditional vs electric automotive).
We conclude that in order to effectively support the sustainable finance transition without prejudice on its market neutrality, in the further steps of its CSPP, the ECB might want to introduce a weighting factor that would favor the least carbon-intensive companies per unit of revenue within each sector of economic activity, and in particular those that already started to diversify their economic activity towards green investments. For instance, within the utility sector (that is included in our CPRS), Terna SpA is less carbon intensive than Engie, based on their declared CO2 emissions per revenue. This would also contribute to decrease the exposure of the Euro Area financial market and real economy to the risk of carbon stranded assets, thus preventing the onset of price volatility and financial instability. However, this would imply to consider the “shades of brown” (i.e. a negative discrimination) of economic activities in the design of the European Commission’s green taxonomy. Further, one should consider the fact that for several carbon intensive companies (e.g. in utility sector) information on the carbon intensity by unit of revenue is not existing or accessible. This has several consequences, in particular for the EC’ Technical Expert Group (TEG) design of the green taxonomy and green bonds’ standards, as well as for investors’ disclosure of their portfolios’ contribution to CO2 emissions, including the NCBs and ECB’s ones. Better information on firms’ CO2 intensity per unit of revenue should be considered as a public good. In this regard, a new European independent authority in charge of providing a data disclosure service (and not of providing financial services) would support portfolios’ disclosure thus creating synergies with the EC’s SFPA implementation. The authority could be in charge of collecting and consolidating information at the firm level that is climate relevant, and of making it available to private and public financial and research institutions. This step is fundamental to foster public and private research on real and financial market’s alignment to the
17
EU2030 climate and energy targets, and the role of central banks and regulators in fostering the transition towards sustainable finance. References Alvarez, R.A., Zavala-Araiza, D., Lyon, D.R., Allen, D.T., Barkley, Z.R., Brandt, A.R., Davis, K.J., Herndon, S.C., Jacob, D.J., Karion, A. and Kort, E.A. (2018). Assessment of methane emissions from the US oil and gas supply chain. Science, 361(6398), pp.186-188. Barkawi, A. (2017). Why monetary policy should go green. Retrieved March 21, 2019 from the Financial Times https://on.ft.com/2qbUpYI Battiston S., Mandel A., Monasterolo I., Schuetze F. & G. Visentin (2017). A Climate stress-test of the EU financial system. Nature Climate Change, 7, 283–288. Battiston, S. and Monasterolo, I. (2019). A carbon risk assessment of central banks’ portfolios under a 2C aligned climate scenarios. Working paper presented at the Bundesbank workshop “Scaling-up Green Finance: The Role of Central Banks”, Nov. 8-9 2018. European Commission (EC) (2018) Commission action plan on financing sustainable growth. EC COM (2018) 97 final Matikainen, S., Campiglio, E. and Zenghelis, D. (2017). The climate impact of quantitative easing. Policy Paper, Grantham Research Institute on Climate Change and the Environment, London School of Economics and Political Science. Monasterolo, I., Battiston, S., Janetos, A. C., & Zheng, Z. (2017). Vulnerable yet relevant: the two dimensions of climate-related financial disclosure. Climatic Change, 145(3-4), 495-507. Monasterolo, I., Jiani I. Zheng and Battiston, S. (2018). Climate transition risk and development finance: a climate stress-test of China’s overseas energy portfolios. China & World Economy 26(6), 116–142. Input to the G20 Task Force “An International Financial Architecture for Stability and Development”. Network for Greening the Financial System (NGFS) Communication (2017). Retrieved September 12, 2018, from https://www.banque-france.fr/en/financial-stability/international-role/network-greening-financial-system Network for Greening the Financial System (NGFS) First Report (2010). Retrieved March 21, 2019 from https://www.banque-france.fr/search-es?term=publications Roberts, D. (2018). Clean energy is catching up to natural gas. The natural gas “bridge” to sustainability may be shorter than expected. Available at https://www.vox.com/energy-and-environment/2018/7/13/17551878/natural-gas-markets-renewable-energy Schoenmaker, D., 2019. Greening monetary policy. CEPR working paper, available at SSRN 3242814.