University of Iowa Iowa Research Online eses and Dissertations 2008 How do teams learn? shared mental models and transactive memory systems as determinants of team learning and effectiveness Amit Kumar Nandkeolyar University of Iowa Copyright 2008 Amit Kumar Nandkeolyar is dissertation is available at Iowa Research Online: hps://ir.uiowa.edu/etd/2 Follow this and additional works at: hps://ir.uiowa.edu/etd Part of the Business Administration, Management, and Operations Commons Recommended Citation Nandkeolyar, Amit Kumar. "How do teams learn? shared mental models and transactive memory systems as determinants of team learning and effectiveness." PhD (Doctor of Philosophy) thesis, University of Iowa, 2008. hps://doi.org/10.17077/etd.upgvsg29
Transcript
University of IowaIowa Research Online
Theses and Dissertations
2008
How do teams learn? shared mental models andtransactive memory systems as determinants ofteam learning and effectivenessAmit Kumar NandkeolyarUniversity of Iowa
Copyright 2008 Amit Kumar Nandkeolyar
This dissertation is available at Iowa Research Online: https://ir.uiowa.edu/etd/2
Follow this and additional works at: https://ir.uiowa.edu/etd
Part of the Business Administration, Management, and Operations Commons
Recommended CitationNandkeolyar, Amit Kumar. "How do teams learn? shared mental models and transactive memory systems as determinants of teamlearning and effectiveness." PhD (Doctor of Philosophy) thesis, University of Iowa, 2008.https://doi.org/10.17077/etd.upgvsg29
____________________________________ Title and Department
____________________________________ Date
HOW DO TEAMS LEARN? SHARED MENTAL MODELS AND TRANSACTIVE
MEMORY SYSTEMS AS DETERMINANTS OF TEAM LEARNING AND
EFFECTIVENESS
by
Amit Kumar Nandkeolyar
A thesis submitted in partial fulfillment of the requirements for the Doctor of
Philosophy degree in Business Administration in the Graduate College of
The University of Iowa
August 2008
Thesis Supervisor: Professor Greg L. Stewart
Copyright by
AMIT KUMAR NANDKEOLYAR
2008
All Rights Reserved
Graduate College The University of Iowa
Iowa City, Iowa
CERTIFICATE OF APPROVAL
_______________________
PH.D. THESIS
_______________
This is to certify that the Ph.D. thesis of
Amit Kumar Nandkeolyar
has been approved by the Examining Committee for the thesis requirement for the Doctor of Philosophy degree in Business Administration at the August 2008 graduation.
Thesis Committee: ___________________________________ Greg L. Stewart, Thesis Supervisor
___________________________________ Terry L. Boles
___________________________________ Kenneth G. Brown
___________________________________ Roy Suddaby
___________________________________ Jennifer Glanville
ii
ACKNOWLEDGMENTS
I am immensely grateful for the encouragement and support of many people who
have helped me successfully complete this dissertation. Their contribution is
immeasurable and I would like to mention my heartfelt gratitude for their efforts and
kindness.
I would like to express my deep gratitude to my adviser, Dr. Greg Stewart, whose
motivation, patience and tireless energy helped sustain me through the highs and the lows
of this project. I am deeply indebted to Greg for encouraging and mentoring me
throughout my PhD and this project.
Next, I would like to thank the other members of my dissertation committee: Dr.
Terry Boles, Dr. Ken Brown, Dr. Roy Suddaby and Dr. Jennifer Glanville. All of them
provided me with important insights, unfailing support and valuable advice.
Finally, I would like to thank my family and friends who have been a great source
of inspiration and support. In fact, I would like to dedicate this dissertation to my wife,
Aparna, without whom it would have been impossible to accomplish this goal.
iii
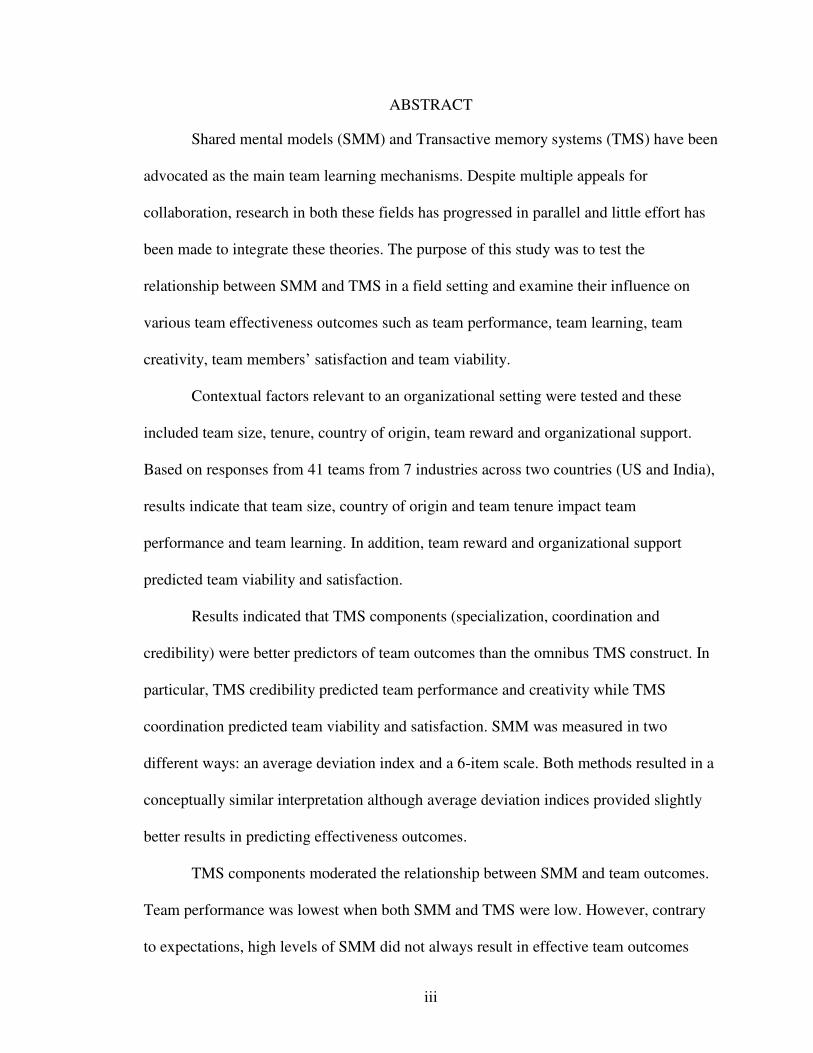
ABSTRACT
Shared mental models (SMM) and Transactive memory systems (TMS) have been
advocated as the main team learning mechanisms. Despite multiple appeals for
collaboration, research in both these fields has progressed in parallel and little effort has
been made to integrate these theories. The purpose of this study was to test the
relationship between SMM and TMS in a field setting and examine their influence on
various team effectiveness outcomes such as team performance, team learning, team
creativity, team members’ satisfaction and team viability.
Contextual factors relevant to an organizational setting were tested and these
included team size, tenure, country of origin, team reward and organizational support.
Based on responses from 41 teams from 7 industries across two countries (US and India),
results indicate that team size, country of origin and team tenure impact team
performance and team learning. In addition, team reward and organizational support
predicted team viability and satisfaction.
Results indicated that TMS components (specialization, coordination and
credibility) were better predictors of team outcomes than the omnibus TMS construct. In
particular, TMS credibility predicted team performance and creativity while TMS
coordination predicted team viability and satisfaction. SMM was measured in two
different ways: an average deviation index and a 6-item scale. Both methods resulted in a
conceptually similar interpretation although average deviation indices provided slightly
better results in predicting effectiveness outcomes.
TMS components moderated the relationship between SMM and team outcomes.
Team performance was lowest when both SMM and TMS were low. However, contrary
to expectations, high levels of SMM did not always result in effective team outcomes
iv
(performance, learning and creativity) especially when teams exhibited high TMS
specialization and credibility. An interaction pattern was observed under conditions of
low levels of SMM such that high TMS resulted in higher levels of team outcomes. The
theoretical and practical implications of these results are discussed.
v
TABLE OF CONTENTS
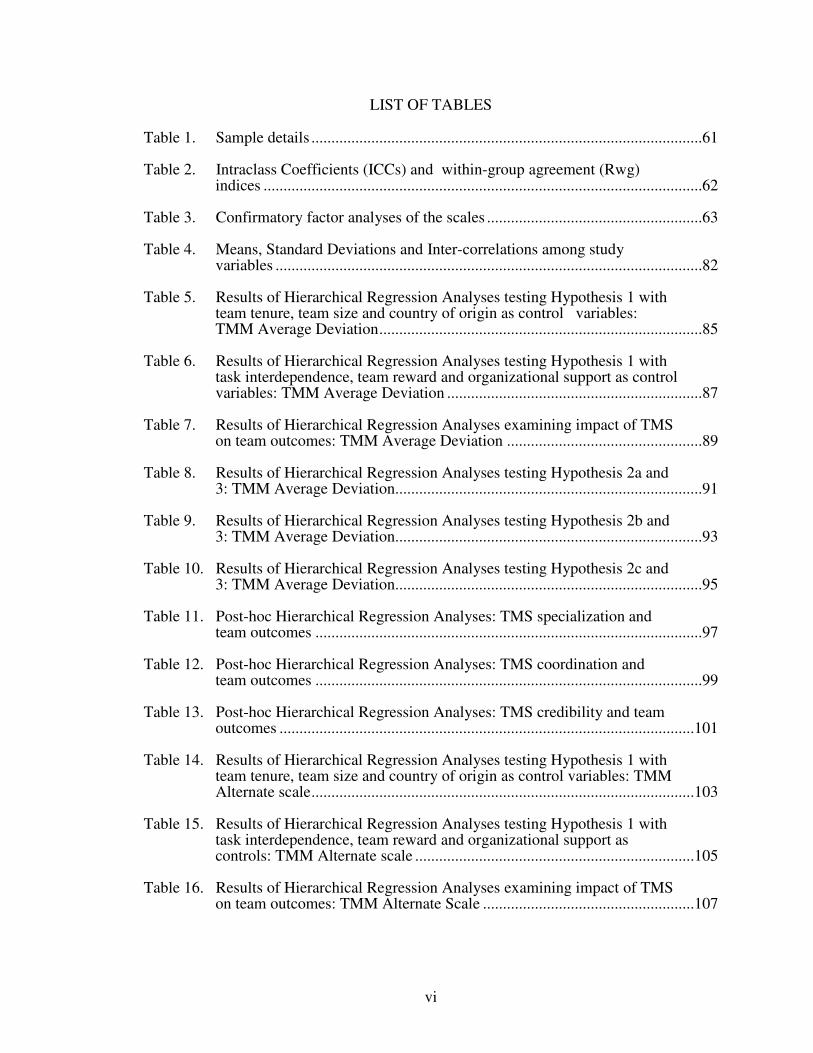
LIST OF TABLES............................................................................................................. vi
LIST OF FIGURES ......................................................................................................... viii
Procedure ........................................................................................................43 Sample ............................................................................................................44 Aggregation Issues..........................................................................................45 Study Variables and Measures........................................................................47
Method 1: Team Mental Model (Average Deviation) ....................................65 Method 2: Team Mental Model (Alternate Scale)..........................................74
To be completed by the team members ........................................................162 To be completed by the team managers .......................................................167
Table 2. Intraclass Coefficients (ICCs) and within-group agreement (Rwg) indices ..............................................................................................................62
Table 3. Confirmatory factor analyses of the scales ......................................................63
Table 4. Means, Standard Deviations and Inter-correlations among study variables ...........................................................................................................82
Table 5. Results of Hierarchical Regression Analyses testing Hypothesis 1 with team tenure, team size and country of origin as control variables: TMM Average Deviation.................................................................................85
Table 6. Results of Hierarchical Regression Analyses testing Hypothesis 1 with task interdependence, team reward and organizational support as control variables: TMM Average Deviation ................................................................87
Table 7. Results of Hierarchical Regression Analyses examining impact of TMS on team outcomes: TMM Average Deviation .................................................89
Table 8. Results of Hierarchical Regression Analyses testing Hypothesis 2a and 3: TMM Average Deviation.............................................................................91
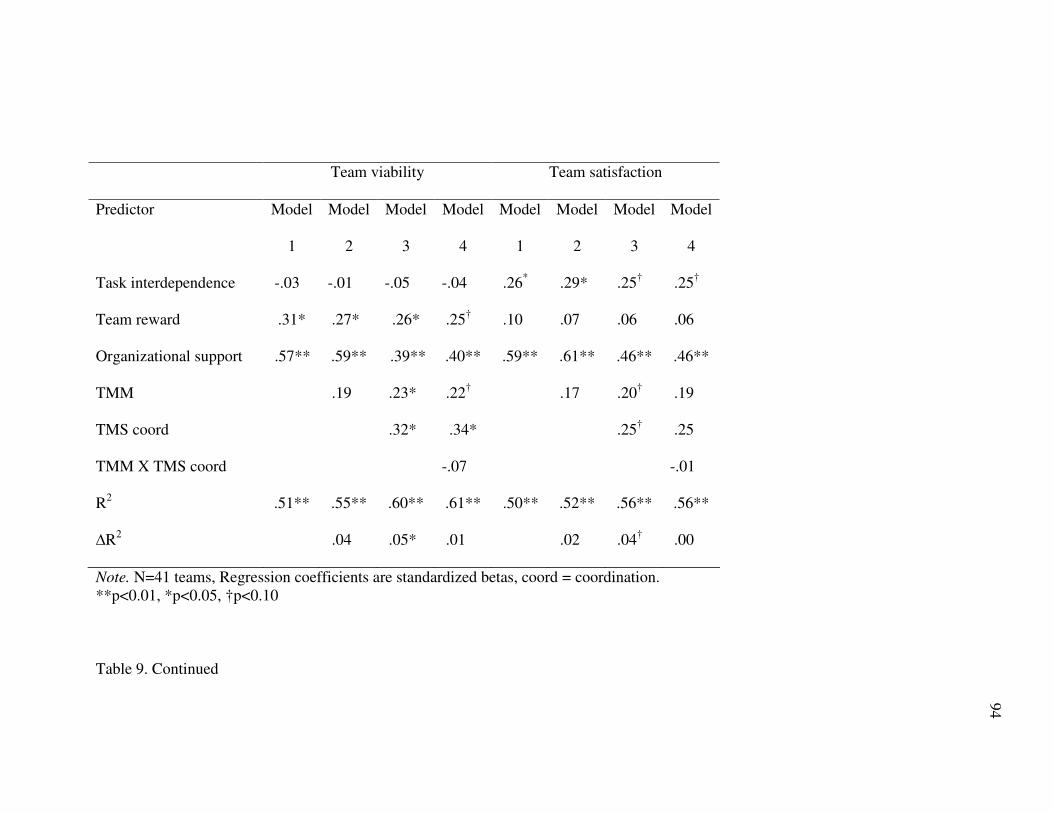
Table 9. Results of Hierarchical Regression Analyses testing Hypothesis 2b and 3: TMM Average Deviation.............................................................................93
Table 10. Results of Hierarchical Regression Analyses testing Hypothesis 2c and 3: TMM Average Deviation.............................................................................95
Table 11. Post-hoc Hierarchical Regression Analyses: TMS specialization and team outcomes .................................................................................................97
Table 12. Post-hoc Hierarchical Regression Analyses: TMS coordination and team outcomes .................................................................................................99
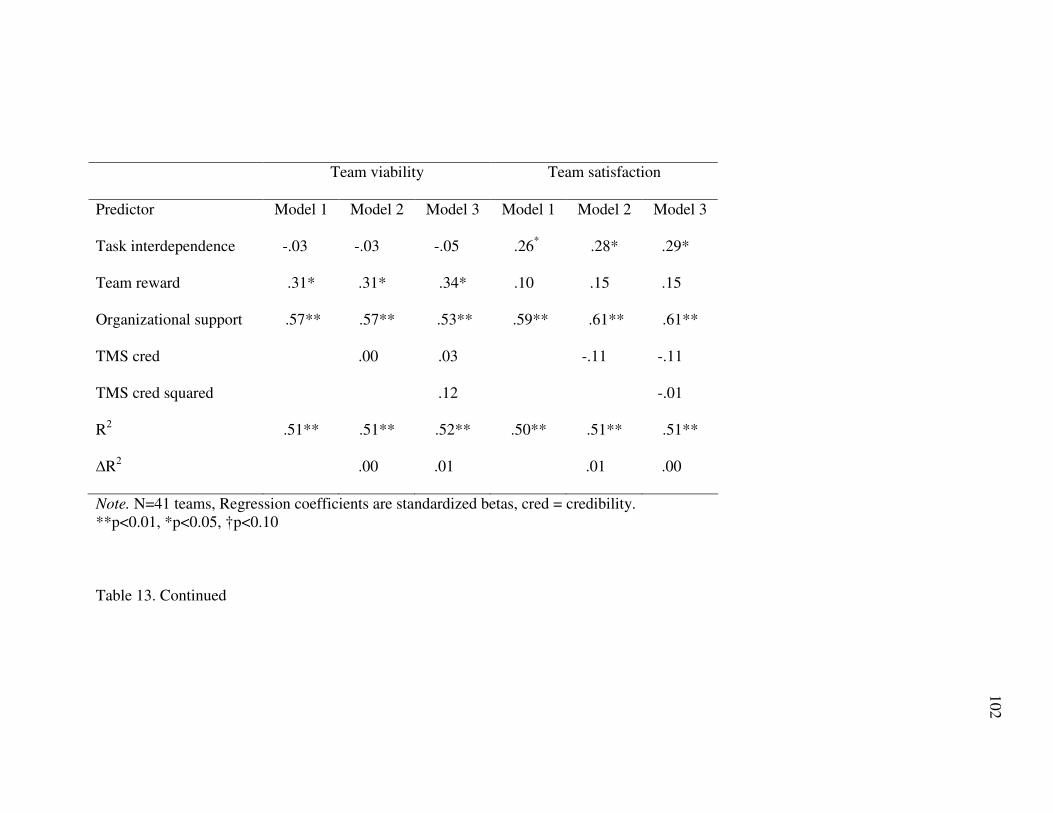
Table 13. Post-hoc Hierarchical Regression Analyses: TMS credibility and team outcomes ........................................................................................................101
Table 14. Results of Hierarchical Regression Analyses testing Hypothesis 1 with team tenure, team size and country of origin as control variables: TMM Alternate scale................................................................................................103
Table 15. Results of Hierarchical Regression Analyses testing Hypothesis 1 with task interdependence, team reward and organizational support as controls: TMM Alternate scale ......................................................................105
Table 16. Results of Hierarchical Regression Analyses examining impact of TMS on team outcomes: TMM Alternate Scale .....................................................107
vii
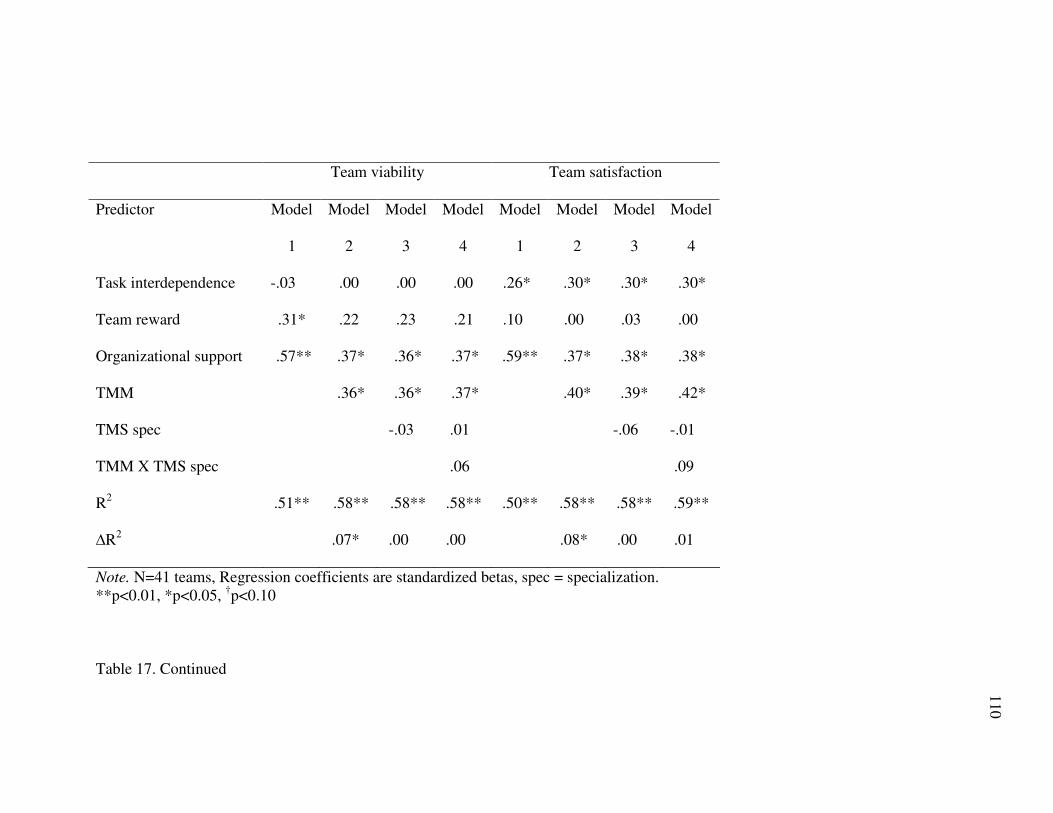
Table 17. Results of Hierarchical Regression Analyses testing Hypothesis 2a and 3: TMM Alternate Scale ................................................................................109
Table 18. Results of Hierarchical Regression Analyses testing Hypothesis 2b and 3: TMM Alternate Scale ................................................................................111
Table 19. Results of Hierarchical Regression Analyses testing Hypothesis 2c and 3: TMM Alternate Scale ................................................................................113
Table 20. Summary of key findings...............................................................................129
Table 21. Conceptual overlap across different literatures on team learning..................133
viii
LIST OF FIGURES
Figure 1. Team-level conceptual model describing relationships between processes, context and dependent variables.....................................................41
Figure 2. Hypothesized relationship between TMM, TMS and team performance ........42
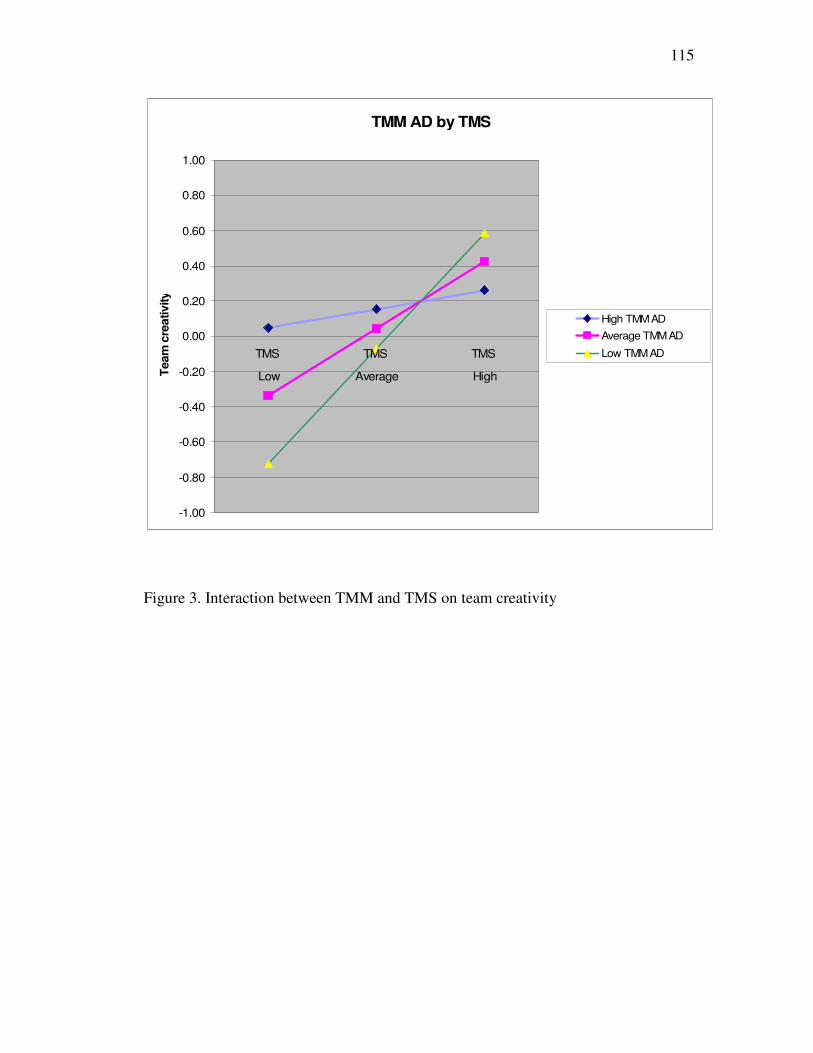
Figure 3. Interaction between TMM and TMS on team creativity ................................115
Figure 4. Curvilinear impact of TMS specialization on team creativity........................116
Figure 5. Curvilinear impact of TMS coordination on team viability ...........................117
Figure 6. Curvilinear impact of TMS coordination on team satisfaction ......................118
Figure 7. Curvilinear impact of TMS credibility on team performance ........................119
Figure 8. Interaction between TMM and TMS specialization on team creativity .........120
Figure 9. Interaction between TMM and TMS coordination on team performance......121
Figure 10. Interaction between TMM and TMS credibility on team performance .........122
Figure 11. Interaction between TMM and TMS credibility on team learning.................123
Figure 12. Interaction between TMM and TMS credibility on team creativity...............124
Figure 13. Interaction between TMM and TMS on team creativity ................................125
Figure 14. Interaction between TMM and TMS specialization on team creativity .........126
Figure 15. Interaction between TMM and TMS coordination on team viability.............127
Figure 16. Interaction between TMM and TMS credibility on team creativity...............128
1
CHAPTER 1: INTRODUCTION
Knowledge is of two kinds. We know a subject ourselves, or we know where we can find information upon it.
- Samuel Johnson (In life of Samuel Johnson, 1791 by James Boswell)
Knowledge is of paramount importance nowadays since organizations are
increasingly becoming service oriented and dependent on knowledge workers (Blackler,
1995; Davenport & Prusak, 1998). Organizations try to capture the benefits of collective
knowledge assimilation by the formation of teams and task-forces (Edmondson, Bohmer,
& Pisano, 2001; Katzenbach & Smith, 2003). Therefore, one of the primary challenges
facing managers is to encourage knowledge sharing within a team so that team members
can effectively combine their unique knowledge (Nonaka, 1994). Knowledge sharing
takes place mostly through interaction with others and we often rely on others to augment
our knowledge (Simon, 1997). A combination of individual and others’ knowledge is an
ideal means to obtain information, solve problems, and be creative in the workplace.
There has been a lot of research in the past decade on how groups engage in
knowledge creation and sharing. For example, organizational researchers have
demonstrated the importance of learning in groups and communities and its importance to
team outcomes (Argote, Gruenfeld, & Naquin, 2001). Similarly, social psychologists
have proposed that groups develop a shared understanding through a process of
interaction, and the resulting knowledge is shared and distributed amongst group
members (Thompson & Fine, 1999). Strategic Management researchers have proposed a
knowledge-processing view of the firm that emphasizes the importance of social
interaction as the process through which knowledge is created and transferred in
organizations (Kogut & Zander, 1992; Nonaka, 1994). It can benefit all fields to integrate
2
findings on group learning from these disciplines to better understand how group learning
occurs.
I define team learning as the process by which team members seek to acquire,
share, refine, or combine task-relevant knowledge through interaction with one another
(Argote, Gruenfeld, & Naquin, 2001). Such a definition will include asking questions,
challenging assumptions, seeking multiple perspectives and reflecting on past actions
(Van der Vegt & Bunderson, 2005). The team learning literature has focused on how
successful groups reach better decisions by assimilating the knowledge residing in
individual members.
Team learning represents a process term under the Input-Process-Outcome (or I-
P-O) framework (Hackman, 1987). These processes are mediating mechanisms linking
input variables such as member, team, and organizational characteristics with output
measures like team performance, team members’ satisfaction and team viability. In
addition to input variables, the team learning process is likely to be influenced by
contextual factors (input variables) external to the team. Situational factors have been
underappreciated in organizational research and need to be better documented to improve
our understanding of the phenomenon (e.g. team learning) under study (Johns, 2006). I
will incorporate contextual details to describe conditions under which teams engage in
learning.
In some ways, team learning constructs also represent important emergent
processes within an Input-Process-Output model (Marks, Mathieu, & Zaccaro, 2001). An
emergent state is a dynamic construct that can define cognitive, affective or motivational
aspects of team members and it affects team processes and the ultimate team outcome.
3
Since, team learning essentially represents a ‘theory-in-use’ (Argyris & Schon, 1978) it is
an emergent state.
This definition of team learning is consistent with the notion of socially shared
cognition which refers to how dyads, groups and large collectives create and utilize
knowledge (Thompson & Fine, 1999). Thompson and Fine (1999) suggest that the word
‘shared’ in “shared cognition” could mean one of three possibilities. First, it could mean
“held in common” that includes overlapping cognitive representations of task
requirements and role responsibilities. Second, shared could mean “divided up into
portions” as relating to dividing up responsibility for different information. The third
possibility relates to the notion of consensus or acceptance as in viewing things and tasks
from another person’s perspective. This paper focuses on clarifying the first two
possibilities and hence will not explore the third concept of shared meaning. The two
types of sharing represent two conceptualizations of collective learning in teams.
Shared mental models (SMM) are defined as a mental representation of
knowledge regarding key components of a team’s environment that is shared amongst
team members (Mohammed, Klimoski, & Rentsch, 2000). They represent a “held in
common” type of knowledge sharing. A mental model is a cognitive structure or a
network of associations between concepts in an individual’s mind. Thus, a degree of
sharing exists amongst team members on knowledge or beliefs about the team’s
environment (Klimoski & Mohammed, 1994). A general assumption underlying SMM is
that team effectiveness will improve if the team members have an adequate shared
understanding. This shared understanding could include understanding about the task and
the equipment (task model), or awareness of team members characteristics including
4
knowledge and beliefs about appropriate or effective processes (team model) (Cooke et
al., 2003).
A transactive memory system (TMS) has been defined as a combination of an
individual’s knowledge and a shared awareness of who knows what (Austin, 2003;
Wegner, 1987). This represents a “divided up into portions” type of knowledge sharing.
TMS was initially proposed to explain the knowledge residing amongst intimate couples
and family members when they are able to bring together disparate knowledge to solve a
problem. This means that even though the solution to any issue at hand may not be
readily available, family members know how to come together and develop a response.
Wegner (1987) explains how family members develop such a thought process.
If we ask a question of a person who is a well-integrated part of a transactive memory network, this person often is able to answer (after consultation with other network members, of course) with information well beyond his or her own internal storage. Asking any member of a family a question about the family's summer vacation, for example, can prompt the retrieval of several members' accounts of the experience. The success we have in retrieving certain items depends on the degree to which the person we begin with has location information about the items we label. Even if we ask the person to retrieve an item with an obscure label, however, the person may be able to help us enter the storage system. Asking Bud how much the family paid for gasoline in Orlando, for instance, may lead him to quiz Dad-who generally knows about car-related items (p.190).
TMS has recently been extended to the work group level as it is a cooperative
division of labor for learning, remembering and communicating relevant knowledge
(Moreland & Myaskovsky, 2000). When team members correctly identify the experts and
delegate tasks based on an individual member’s expertise, they perform better
(Hollingshead, 2000). Hence, team performance may depend on whether the group can
correctly recognize and utilize the knowledge of its members (Brandon & Hollingshead,
5
2004). The TMS definition includes two parts: a) a combination of individual knowledge
and b) interpersonal awareness of others’ knowledge.
Despite growing literature on SMM and TMS, there remains some confusion
regarding the actual conceptualization of these constructs, with proponents of TMS and
SMM suggesting that the other is a part of their construct (Austin, 2003; Mohammed,
Klimoski, & Rentsch, 2000). Specifically, Austin (2003) defined TMS as “a team mental
model about the distribution of knowledge within the group” (p. 867). Similarly, some
researchers have suggested that TMS is a Shared Mental Model about importance of who
knows what given the roles distribution in a team (Cooke, Salas, Cannon-Bowers, &
Stout, 2000; Mohammed & Dumville, 2001). While the exact nature of the relationship
between TMS and SMM is not very clear, it becomes important to clarify the unique
contribution of these constructs in particular (Mohammed & Dumville, 2001). It appears
that there is an obvious overlap between these two constructs even though they have been
conceptualized differently. Not surprisingly, researchers have a hard time defining the
term shared cognition and what is being shared (Cannon-Bowers & Salas, 2001;
Mohammed, Klimoski, & Rentsch, 2000).
To the best of my knowledge, the constructs of TMS and SMM have not been
studied together, except in a study by Ellis (2006) who indicated that lack of SMM and
TMS helps explain why teams perform poorly under acute stress. In this paper, I expand
on his conceptualization that SMM has an integrative function as it represents the
common elements whereas TMS has a differentiating function as it emphasizes
distribution of knowledge held by individual members. An integrative function captures
6
the portion of the knowledge that is universally accepted while the differentiating
function builds on the knowledge that is unique to each member in a team.
One way in which SMM and TMS are related can be understood via information
processing theory as it focuses on the cognitive processes inside a group. According to
this theory, information processing has been defined as the degree to which information,
ideas, or cognitive processes are shared and how this sharing of information affects both
individual and group-level outcomes (Hinsz, Tindale, & Vollrath, 1997). Every group
member has separate, independent memory structures. Assuming group members engage
in information sharing, they have access to one another’s memory, effectively expanding
the storage and retrieval capacity of any particular individual. Within this perspective,
SMM seems helpful in explaining how the common information is shared amongst team
members while TMS helps explain how teams collectively encode, store and retrieve
unique differentiated information. Thus, studied together they may better elucidate how
groups act as information processors and succeed in delivering results beyond any single
individual’s capacity.
My primary research questions in this dissertation are 1) How are TMS and SMM
related to each other? I plan to investigate whether these concepts are indeed distinct. In
addition, I ask 2) How do TMS and SMM impact team performance? Is one construct
better than the other in explaining team performance? Or do they better explain team
performance in combination with each other? This study is an extension of the previous
work on group learning phenomena and contributes to the literature by contrasting two
different group learning mechanisms.
7
CHAPTER 2: LITERATURE REVIEW
Theoretical framework
Learning happens at multiple levels. At times we learn independently, but most of
the time we learn by interaction with others (Bandura, 1977). These interactions can
happen at home, in the workplace, in our own network of peers and friends, and from
Reagans & Zuckerman, 2001; Seger, 1994; Webb, 1982). One of the perspectives on
team learning in recent years has focused largely on SMM or TMS (Edmondson, Dillon,
& Roloff, 2008). Despite burgeoning literature on these topics, there has been only one
study that explicitly included both these concepts and clarified the nature of their
relationship (Ellis, 2006). This study used information processing theory as a framework
to suggest that SMM is about integration of teammate’s perceptions while TMS captured
differences amongst team members’ roles and responsibilities.
However, the study involved undergraduate students engaged in a computer-based
simulation of defending enemy attacks, and this makes it difficult to generalize the results
to an organizational setting. In this case, team members had clearly defined goals and
distinct expertise. While the laboratory task of keeping simulated enemy aircrafts out of
your home zone is not easy, in reality, many teams in organizational settings engage in
tasks that are much more cognitively challenging. Moreover, team members often have
overlapping expertise, lack a clearly defined role, a prior relationship with each other, and
may be required to work in future together. The peculiarities of organizational teams
make it useful to replicate in realistic settings. Additional study will help to uncover
whether these two constructs are indeed unique and help increase the external validity of
prior findings.
8
In the following sections, first, I expand on the nature of the relationship between
TMS and SMM using the information processing framework. Second, I review the
existing empirical research on SMM and TMS, as well as their impact on team
performance. Finally, I highlight the potential impact of context on the present study.
Information Processing Theory
Information processing in teams has been defined as “the degree to which
information, ideas, or cognitive processes are shared, and are being shared among group
members and how this sharing of information affects both individual and group- level
outcomes” (Hinsz, Tindale, & Vollrath, 1997, p. 53). As teams are performing
increasingly cognitive tasks, team performance relies on team members’ information
processing capabilities. Team members must attend to information in order to process it.
The information is then structured and interpreted by the process of encoding, followed
by a storage process for retrieval from memory, when necessary.
The information processing framework has been helpful in explaining team
performance in organizations. In a longitudinal study of 98 Research and Development
groups, the fit between task technology’s nonroutineness and the information processing
needs of the team helped explain team performance as far out as one year later (Keller,
1994). According to Keller (1994), information processing theory explains top
management team flexibility in strategic decision making in terms of the team’s ability to
better analyze and access information. In another cross level study, Thomas and
McDaniel (1990) suggested that a better information processing structure (low
formalization and high interaction between team members) allows top managers to better
analyze environmental factors and provides a sense of control over the strategies to be
9
followed. A CEO having lower information processing ability might evaluate a particular
situation to be threatening while another CEO with a more accurate and well-developed
information processing ability may scout for opportunities in a similar scenario. Thus,
information processing helps in sense-making and better interpretation of the
environment and could help extend our understanding of organizational learning and
change (Huber, 1991; Thomas & McDaniel Jr, 1990). In summary, information
processing theory highlights the cognitive processes by which top managers and teams
engage in learning. Thompson and Fine (1999) came to a similar conclusion in their
review of how groups develop shared meaning. According to them, groups develop
shared meaning across three main dimensions: affect, behavior and cognition.
Affective experiences include identification with a group due to reduction of
individuals’ self-identity and creation of social identity by having group-level goals
(Hogg & Terry, 2000; Tajfel & Turner, 1986). Such experiences enhance group cohesion
and group norms. Behavioral consequences include coordination and creation of products
and group decisions that are not identifiable to any individual level processes. The
cognitive dimension takes the form of TMS and SMM.
According to Thompson and Fine (1999), both TMS and SMM are manifestations
of an information-processing model. Consistent with the information-processing
approach, group members have separate and independent memory structures located
within each individual member. Moreover, group members have access to one another’s
memory if it is shared, thus effectively expanding storage and retrieval to any individual.
The notion that SMM and TMS have a lot in common as they both are concerned with
cognitive structures in teams has been reached by other researchers (cf.Mohammed &
10
Dumville, 2001). Hence, I explore the relationship between SMM and TMS using the
information-processing framework.
Shared Mental Models
The term mental model refers to a symbolic representation of a system and its
expected behavior (Johnson-Laird, 1983). According to Johnson-Laird (1983), human
beings have an innate tendency to develop and use mental models because effective
action requires an understanding of the system within which one is located. Thus people
define and enact appropriate behavior by using their evolving knowledge of the system
into a model that enables them to describe, explain and predict consequences of behavior
(Rouse & Morris, 1986). This emphasis on prediction has led researchers to explore the
usefulness of mental models primarily on performance.
Recently, the notion of a mental model was extended by researchers to account
for performance differences between teams, and SMM has been defined as an organized
understanding of relevant knowledge that is shared by team members (Klimoski &
Mohammed, 1994). As the notion of SMM was developed to explain difference in team
performance, there is an inherent assumption that SMM is an antecedent to effective team
performance (Mohammed, Klimoski, & Rentsch, 2000). SMM could help explain how
team members use similar knowledge to guide their (coordinated) behavior in effective
teams. The predictive nature of the construct could help as an indicator of a team’s
‘readiness’ to take on a particular task (Cannon-Bowers & Salas, 2001). This would lead
managers to diagnose a team’s problems and provide insight on how to solve them.
Despite the potential usefulness of the construct, the empirical evidence to support the
value of SMM is rather weak. As Cannon-Bowers and Salas (2001) note, “The problem
11
seems to be that researchers have interpreted the shared cognition label to mean so many
different things, that we are not sure that any two authors mean the same thing when they
use it” (p.196). They further highlight that researchers have used over twenty labels to
describe various types of shared cognition (e.g. collective cognition, team knowledge,
team mental models, shared knowledge, transactive memory, shared mental models).
In an early attempt to clarify the confusion regarding what is meant by shared
cognition, Cannon-Bowers, Salas and Converse (1993) proposed that there are
conceptually four distinct types of SMM. The first includes knowledge about the
equipment and tools used by the team. The second includes knowledge about task
procedures, strategies and environmental cues that impact the task. Third includes
knowledge about teammate characteristics such as preferences, habits and expertise. The
fourth component includes knowledge about team roles and team interaction patterns.
While researchers have theorized that multiple distinct types of mental models exist
(Rouse, Cannon-Bowers, & Salas, 1992), few have actually investigated multiple SMMs
and established the discriminant validity of this typology.
In some ways, the four types of models described above can be seen as reflecting
two major domains: a) Task related aspects (e.g. knowledge of equipment/technology and
job/task models) and b) Team related aspects (e.g. knowledge about team interaction and
knowledge about teammates). Consequently, most researchers have re-classified SMM
into two broad dimensions: Task-mental model and Team-mental model (Klimoski &
Mohammed, 1994, p. 432; Rentsch & Hall, 1994). Mathieu, Goodwin, Heffner, Salas and
Cannon-Bowers (2000) conceptually and empirically distinguished between task and
team-based mental models using a sample of undergraduate dyads. Further, their results
12
suggested that task mental models had no direct impact on team performance, whereas
team mental models had a positive relationship with performance.
In this paper, I focus on team-mental models rather than task models as they are
more likely to be relevant in teams that are engaged in a variety of tasks. The equipment
and task mental models are context specific, and hence harder to study in teams engaged
in different types of tasks that are not really comparable. The nature of teamwork and the
team-mental model is expected to be universally relevant compared to the task-mental
model as empirical results have been more supportive for studying team mental models
over task mental models (Mathieu, Goodwin, Heffner, Salas, & Cannon-Bowers, 2000).
Henceforth, I will use TMM to represent team-mental model. In addition, the content of
task mental model as a representation of “who does what” is much closer to the concept
of role differentiation, an issue better addressed by the TMS literature, and to be
described later.
Further, TMM involves team members’ knowledge of each other. In other words,
conceptually TMM involves shared knowledge of each other’s preferences, strengths,
weaknesses and tendencies in order to maximize performance. TMM should benefit team
performance by helping team members to compensate for each other, predict each other’s
action and provide information before being asked. Moreover, TMM is team specific and
will only hold when team membership remains relatively stable. The above clarification
responds to one of the questions posed by Cannon-Bowers and Salas (2001) that it is
critical to clarify ‘what is shared?’
Recently, Ellis (2006) examined the role of TMM and TMS in the relationship
between acute stress and team performance in a study involving 97 teams running a PC
13
based simulation task. Among other results, he found that both TMM similarity as well as
accuracy was positively related to team performance. TMM similarity refers to common
interpretation of their situation while accuracy refers to quality. The difference between
similarity and accuracy is marked by Mathieu et al. (2000) comment, ‘Similarity does not
equal quality- and teammates may share a common vision of their situation yet be wrong
about the circumstances that they are confronting’ (p.281). Ellis (2006) operationalized
TMM as the team interaction mental model, focusing on team-related aspects of a
situation. Support for a positive relationship between TMM and team performance has
also been reported by other researchers. For example, Marks, Zaccaro and Mathieu
(2000) found in a study of 79 three-person student teams engaged in a computer based
war simulation that TMM strongly predicted team performance under novel situations.
Moreover, the similarity in TMM amongst the team members was responsible for more
adaptive responses in novel situations.
Extending prior research, Smith-Jentsch, Mathieu and Kraiger (2005) used
measures of both task and team mental models to predict safety and efficiency of 306 air
traffic controllers across 47 airports. This appears to be the only published TMM study
using intact work teams. Contrary to expectations, task and team mental models failed to
demonstrate any linear effects on predicting air safety and efficiency (i.e. minimizing
airport delays). However, there was an interaction between task and team mental models
that better predicted air safety and efficiency. Their results suggested that the highest
tower efficiency and safety rates were evident when Air Traffic Controllers exhibited
high team and task mental models. Moreover, it was better to have low levels of both
team and task mental models than to have a high team and a low task mental model. It
14
appears that efforts to demonstrate linear effects of TMM on team performance have
yielded mixed and somewhat equivocal results. Hence, there is a need to study more
complex patterns of relationships to demonstrate the impact of TMM on team
performance, especially in real work teams.
One reason for the mixed results obtained between TMM and team performance
could be because of too much shared cognition. The resulting TMM might lead to
‘groupthink’, and the inability to incorporate external viewpoints might lead to failures
(Janis, 1972). Groupthink refers to a deterioration of mental efficiency, reality testing,
and moral judgment that results from in-group pressures. Groupthink has been blamed for
such decision-making fiascoes as the Bay of Pigs invasion, the escalation of the Vietnam
conflict, the Watergate cover-up, and the Challenger disaster as well as for flawed group
problem solving in business and other organizations.
Although many aspects of groupthink have been questioned, it has been
frequently invoked to explain group failures. One idea that has found support in
groupthink research is that premature consensus has a negative effect on group decision
making and leads to negative outcomes (Aldag & Fuller, 1993). When teams attempt to
learn or solve problems, often team members have divergent solutions to problems that
the team faces. Discussing these contrasting ideas is crucial to problem solving in groups
and has been considered constructive (Tjosvold, 1985). Lack of alternative viewpoints
might result in a failure to discuss critically relevant information that is not already
shared (Stasser & Titus, 1987).
In fact, when groups are comprised of familiar members, they are less likely to
bring out new or unshared information to solve a task that requires pooling of information
15
(Stasser & Titus, 1987). Such high TMM groups may already share a common frame of
reference to interpret information. It is quite possible to have high degree of consensus on
an apparently wrong way to attempt a task. As Ellis (2006) suggests, team members
under stress may have high consensus on task requirement but this may result in a bad
team performance. As Smith-Jentsch et al. (2005) observe in their study of air traffic
controllers, teams that were simultaneously high on both the task and team mental models
did not report high safety and efficiency. They speculate that a possible reason could be
that teams may overgeneralize the actions they expected from their teammates – ‘In other
words, the same implicit coordination processes that enabled these teams to perform well
under routine task conditions may have actually led to greater problems in emergency
situations’ (p.532).
Weick (1993) documented the story of fire-fighters who failed to drop their tools
because they could not comprehend an unusual direction from their team leader. In the
end, 13 fire-fighters lost their lives in the ‘Mann-Gulch disaster’. This demonstrates that a
high TMM does not necessarily result in increased performance. Another chilling disaster
attributed to air crew’s application of habitual routines resulted in the plunge of the Air
Florida flight 90 into the Potomac River shortly after take-off from Washington D.C.
(Gersick & Hackman, 1990). Thus, there are empirical and practical reasons as to why
high TMM may not essentially be a good thing.
More team interaction could be beneficial as team members engage in frequent
communication, build strong norms and increase team cohesiveness. Team members will
be able to build a social identity by having an over-arching goal (Tajfel, 1982). Such
activities will lead to a higher collective team identity that improves team performance
16
(Van der Vegt & Bunderson, 2005). A higher collective identity assumes that members
will have higher expectations from their teammates as they will have a more accurate
idea of teammate’s beliefs, abilities and preferences. Such activities are likely to increase
members’ expectations from their teammates and also improve team performance as they
come to know about each other’s strengths. However, if there is too much time spent in
understanding team members, the individual members may get too involved in
maintaining social relationships and less in their own task related activities. This is
especially true when team members have homogenous demographics and belong to a
close-knit social network (Thomas-Hunt, Ogden, & Neale, 2003). Thus, a very high level
of TMM will be undesirable as it could lead to disasters due to failure to engage in
meaningful information processing. Thus, I propose that there is an optimum level of
TMM for performance:
Hypothesis 1: The relationship between a team’s TMM and team performance will be curvilinear (∩-shaped) such that both high and low agreement on TMM will exhibit low levels of team performance.
Transactive Memory Systems
A TMS focuses on who knows what and attempts to capture the uniqueness of
information in a team. Based on their studies of learning in successful teams, Moreland
suggested that TMS has three distinct components – Specialization, Credibility and
Coordination. People in an interpersonal relationship often develop a specialized division
of labor with respect to encoding, storage and retrieval of information from different
sources. Thus, each member in the relationship develops an expertise in some areas but
not all. Other members expect members to be able to process and possess expertise in
17
specific domains. This process leads to reduction in overlapping individual knowledge
while improving information processing efficiency within teams. The Specialization
component refers to the level of knowledge differentiation within the team. Credibility
refers to team members’ beliefs about the accuracy of other members’ knowledge.
Coordination refers to team members’ ability to work together efficiently.
In one of the earliest studies indicative of TMS, Wegner, Erber and Raymond
(1991) studied memory performance of 118 individuals who had been in close dating
relationships for at least 3 months. For a memory task performed by pairs, some subjects
were paired with their partners and some were paired with an opposite-sex partner from
another couple. For some pairs, a memory structure was assigned (e.g., 1 partner should
remember food items, another should remember history items, etc.), whereas for others
no structure was mentioned. The pairs were asked to study together but not allowed to
engage in verbal communication. Memory recall was tested subsequently in individuals.
Memory performance of the natural pairs was better than that of impromptu pairs without
assigned structure, whereas the performance of natural pairs was inferior to that of
impromptu pairs when structure was assigned. This implies that dating pairs had
developed their own implicit memory structure of how to divide the task. Adding external
structure and directions resulted in interference with this TMS.
This result supports Wegner’s (1987) assertion that people often try to improve
their limited memories with external memory aids. These external aids may include either
taking notes, maintaining diaries or reliance on other people. People often turn to each
other for recalling information when they do not trust their own memory or have trouble
recalling information. Hence, it appears that TMS develops in natural groups as an
18
automatic process. This facet has spurred researchers to investigate whether teams engage
in similar memory organization and retrieval as observed in intimate couples.
Liang, Moreland and Argote (1995) in an experimental setting studied students
instructed to assemble radio kits in groups. Students trained together were better able to
assemble radios than those trained individually. Groups whose members were trained
together recalled more about how to assemble radios and made fewer assembly errors
than did groups whose members were trained apart. Later, they investigated the
videotapes of the students and coded behaviors suggesting the development of TMS. The
measures of TMS were derived from judges’ observations of videotaped teams who were
assembling the radio kits. The researchers derived observation measures for member’s
knowledge (specialization), members’ beliefs about the reliability of other’s knowledge
(credibility) and effective knowledge processing (coordination). Once these TMS
behaviors were accounted for, there were no differences between groups who were
trained together versus those trained individually. Hence, they inferred that TMS is
responsible for improved team performance. However, there could be other reasons why
these teams performed well apart from a well-developed TMS such as training and
communication.
In order to rule out alternative reasons for improved performance, Hollingshead
(1998) investigated TMS in a series of laboratory experiments. In the first experiment,
intimate couples who worked face to face performed better on a knowledge-pooling task
when compared to strangers who worked face to face or intimate couples who worked via
a computer conferencing system. Additional analyses indicated that intimate couples
when interacting face to face were better at determining when a partner’s answers were
19
correct even if only one member knew the answer prior to discussion. In the second
experiment, intimate couples scored significantly better on a knowledge task when they
had access to either nonverbal or paralinguistic communication cues than when they had
access to neither. Taken together, the results indicate that communication could be
important in the knowledge retrieval aspect of TMS.
In order to untangle communication from TMS, Hollingshead (2000) designed
two experiments to test if communication could be responsible for better group
performance, a result generally attributed to development of TMS. Sixty three, three-
member teams were trained differently (e.g. individuals trained apart, individuals with
feedback about others and individuals trained together) to perform the task of assembling
radios. Groups whose members were trained apart with no chance to communicate with
each other prior to the experiment performed equally well as the groups that trained
together and whose group members were given feedback about the skills other members
had. Both the above groups did much better than groups whose members were trained
apart and had no knowledge of their members’ skills. Training techniques did not explain
differences in team performance. These set of studies clarified that TMS is distinct from
communication and training and is responsible for improved team performance via
knowledge of teammates’ skills.
TMS coordination refers to team members’ ability to work together efficiently
and has been considered critical for team performance. Research on dating couples
demonstrated that partners engage in coordinated action in response to tasks requiring an
effective TMS (Moreland & Myaskovsky, 2000). Similar coordination was observed
when a sample of clerical workers were asked to work with others in a laboratory setting
20
(Hollingshead, 2000). Participants were able to learn and recall more information when
partners had different work-related expertise. The results were reversed when they
worked with partners having similar expertise. These results suggest that coordination is
a key part of TMS as members work on their own expertise area and rely on coordination
from their partners to recall and combine information on areas different from their own.
TMS credibility refers to team members’ beliefs about the accuracy of other
members’ knowledge and provides evidence that group members trust each other’s
expertise. This dimension has also been referred to as accuracy (Austin, 2003). In a study
of student groups attempting to build AM radio-sets, groups who trained together
developed more accurate TMS than those who were trained apart (Moreland &
Myaskovsky, 2000). Researchers from other areas have also highlighted the importance
of credible recognition of expertise within teams. In a study of loan officers asked to
determine the bankruptcy chances for real estate firms, the person identified as the expert
in the team performed as well as the entire group suggesting that accurate identification
of expertise is a crucial measure of TMS (Libby, Trotman, & Zimmer, 1987). This is
consistent with Wegner’s original conceptualization that an individual can rely on other
members with more confidence when he/she has a credible source of information.
Recently, TMS has been investigated in field settings and has been shown to
explain superior team performance. Austin (2003) examined the relationships between
TMS and performance amongst 27 teams in a large apparel and sporting goods company.
Group TMS was measured as a combination of knowledge, knowledge specialization,
transactive memory consensus and transactive memory accuracy. Eleven dimensions of
skills were identified as relevant for the sample. Individuals were later asked to identify
21
the expertise level of other group-mates on these eleven skills. The individual expertise
scores were aggregated to a group score for calculating combination of knowledge.
Transactive memory consensus was defined as the extent to which group members agree
about who has the knowledge. Transactive memory accuracy involves the extent to which
individuals identified by others in the group as possessing particular knowledge actually
possessed it. According to Austin (2003), TMS is positively related to objective team
performance, external evaluations, and internal evaluations. The results proved TMS
could be applied in field settings but required direct observations and identification of
skill sets in each team that can be cumbersome. When organizations have teams with
widely different expertise it becomes increasingly difficult and time–consuming to apply
this technique of measuring TMS.
While experimental settings did provide support for the conceptualization of
TMS, it was hard to translate the measures to field settings. The measures developed for
laboratory settings (e.g. assembling radio sets) were constructed for a setting where tasks
are clear and do not differ across groups, a rarity in most organizational settings. Partly,
this was responsible for fragmented research and lower interest in its application to
organizational settings. This hurdle has been solved largely by the development of a
survey instrument validated in the field (Lewis, 2003). Lewis developed and tested a 15
item measure in a field sample of 27 teams from technology companies. Her scale
comprises the three sub-scales of specialization, credibility and coordination. The indirect
method of knowledge observation based on surveys seems as valid as direct observations
and seems to have provided a common method of measuring TMS.
22
Empirical evidence is broadly supportive of the notion that TMS impacts team
performance. It is not clear whether each of the TMS components demonstrates a positive
relationship with team performance. We need to extend the present theory by examining
the relationship of TMS components with team performance. According to Lewis (2003),
TMS is best represented as a second order factor indicated by three first order factors
(specialization, credibility and coordination). She states that “when TMS exists, it causes
specialized knowledge, mutual trust in others’ knowledge, and smooth coordinated task
processing” (p. 591). As the TMS literature is still in its nascent stage, we need to
examine the impact of each first order latent construct (specialization, credibility and
coordination) on team performance.
First, consider specialization and its impact on team performance. When team
members with distinct roles have an overlapping knowledge amongst themselves, this
causes redundancy of information. In organizational settings with clear team roles, team
members need to decide who will share what information (Mohammed & Dumville,
2001). A TMS helps a group by reducing the redundant overlaps in knowledge and
clarifying who will remember what information. This creates specialization within teams
that aids in retrieval and accessibility of information later on. Increased specialization
makes team members more efficient in cognitive processing, as only the individual
assigned to a particular expertise attends to the relevant information and encodes it to
one’s memory. This frees up other individuals to concentrate on their tasks and improves
information processing resulting in better team performance.
Coordination has been often considered critical for team performance and
effective TMS will only come from effective coordination of teammates. In a study of 35
23
five-person teams across US and Japan, Montoya-Weiss, Massey and Song (2001)
observed that coordination was responsible for smoother work flow, lowered negative
conflict and improved team performance. Faraj and Sproull (2000) in a study of 69
software teams demonstrated that the mere presence of expertise is not enough, teams
need to coordinate expertise in order to be effective. Entin and Serfaty (1999) in a study
of teams comprising Navy officials found that adaptive coordination helps teams get over
sudden events and leads to better team performance. In some ways coordination allows
teams to engage in team learning. By effective coordination, a group is able to efficiently
divide the process of acquiring information. Every member can concentrate on updating
their memory, and when needed, on retrieving the correct information from the expert
group members. In effect, TMS coordination helps in increasing the storage capacity of
the group and makes retrieval more efficient (Hinsz, Tindale, & Vollrath, 1997).
Another crucial part of TMS deals with increasing the credibility of information.
Once group members develop their expertise they will share it with their members and
over a period of time are expected to be more accurate, by reducing errors. When group
members need to find information, they are most likely to look up to the most credible
person. Thomas-Hunt, Ogden and Neale (2003) found that individuals perceived as
experts engage in more information-seeking behaviors than non-experts. They actively
share their expertise as well as engage in seeking out unique information held by minority
members. It is quite possible that credibility is in the eye of the beholder and the
individual perceived as expert might engage in self-fulfilling prophecies and thereby raise
his performance (Eden, 1984; Rosenthal, 1994). However, it is difficult to visualize the
actual processes as to why individuals who are recognized as credible engage in more
24
information sharing. Nevertheless, as long as the accuracy of team members is increased,
credibility should result in better team performance as shown in another study by Fulmer
and Stewart (2006) where a negative relationship was observed between the least
accurate team members’ perception of the leadership role and team performance.
Formally stated, I expect that the TMS components will be positively related to team
performance.
Hypothesis 2a: TMS specialization will be positively related to team performance.
Hypothesis 2b: TMS coordination will be positively related to team performance.
Hypothesis 2c: TMS credibility will be positively related to team performance.
Relationship between TMM and TMS
Many researchers have demonstrated that transactive memory systems predict
team outcomes like accuracy on tasks (Austin, 2003), team viability and team
performance (Lewis, 2004). We also know that team knowledge whether it is shared
mental models, or transactive memory systems, has been shown to result in improved
team performance (Ilgen, Hollenbeck, Johnson, & Jundt, 2005; Lewis, 2004; Mohammed
& Dumville, 2001). It is unclear whether TMS and TMM are conceptually distinct
entities. If yes, how are they related? Are they compensatory or do they interact in
different ways?
The lack of clarity between TMS and TMM can be seen in the way researchers
have treated these two constructs in past studies. While the principal proponents of each
of these constructs have tried to conceptually distinguish between the two constructs
(Lewis, 2003; Mohammed, Klimoski, & Rentsch, 2000), some researchers have started
calling for greater integration between the two constructs (Mohammed & Dumville,
25
2001). Researchers have implicitly described TMS as a type of shared knowledge (TMM)
in groups about who knows what (Rulke & Rau, 2000). Similar assumptions have been
made when TMS was defined as a form of TMM whereby team members store in
memory who is aware of what information (Fiore, Salas, Cuevas, & Bowers, 2003). Still
there are others who have equated TMM and TMS as a form of shared understanding
within teams and investigated the impact of information distribution amongst team
members on negotiation outcomes (Peterson & Thompson, 1997). It is important to
investigate the nature of the overlap and the differences between these two constructs in
order to better understand team processes and team performance.
Irrespective of conflicting viewpoints, one thing that is certain is that these
concepts are related. One explanation behind the apparent confusion is the proliferation
of similar sounding constructs of ‘shared cognition’ and the subsequent confusion
regarding the ways to operationalize and measure them (Cannon-Bowers & Salas, 2001).
According to Klimoski & Mohammed (1994), there are over thirty labels or variations of
the term ‘team mental models’. Some of these labels include terms like group cognition,
cognitive maps of collectives, strategic consensus, collective cognitions, shared frames,
shared meaning, collective mind and social cognition. It is quite likely that such labels
have increased since 1994 creating more confusion for researchers and practitioners
looking for guidance. In order to summarize and make sense of the empirical findings, we
need to be parsimonious in labeling and provide more conceptual clarity behind what we
mean by shared cognition. Once we do so it will be relatively easier to explain the
relationship between TMM and TMS, two similar sounding dominant constructs.
26
Researchers have warned that it is important to clarify what we mean by ‘shared’.
Generally, the advice is to clarify if shared means one of the following: overlapping,
similar, compatible or complementary, or distributed (Cannon-Bowers & Salas, 2001;
Mohammed & Dumville, 2001). While it is possible that some teams will be identical in
every respect and some will be totally incompatible, most teams will fall somewhere
between these extremes. In most real work teams, it is likely that some knowledge will be
shared, some will be similar, and the rest will be distributed. Hence, the a priori definition
of shared as one of the four categories will lead to a narrower definition than the reality.
I propose that we need to have an inclusive and more nuanced definition of shared
cognition. In this study, I propose that we can meaningfully capture the idea of shared
with ‘identical’ and ‘distributed’ as opposite ends on a continuum. Therefore, identical
knowledge between members would be classified as overlapping. If members have
unique knowledge, the team would be classified as distributed. This is consistent with the
idea that the shared cognition literature has overemphasized the overlapping and
underemphasized the distributed nature of sharing (Mohammed & Dumville, 2001).
Obviously, this conceptualization assumes that TMM and TMS will overlap as evident by
the coordination sub-dimension. Since both constructs, TMM and TMS, are assessed with
indices of agreement and coordination, there is an indication that such an agreement has
developed within teams.
One way to think about the relationship between TMM and TMS can be in terms
of the distribution of knowledge in a team setting. A TMM forms when group members
encode information collectively as a cognitive representation of related items (Cannon-
Bowers, Salas, & Converse, 1993; Weick & Roberts, 1993). When these mental models
27
reflect the accurate representation of team interaction, groups interact more efficiently
and perform more effectively (Mathieu, Goodwin, Heffner, Salas, & Cannon-Bowers,
2000). Thus, TMM reflects similarity amongst team members. Overlapping knowledge
amongst team members could be redundant and may result in less than optimal
performance. In such situations with clear team roles, team members need to decide who
will share what information (Mohammed & Dumville, 2001). A TMS helps a group by
reducing the redundant overlaps in knowledge and clarifying who will remember or
contribute what information. This creates specialization within teams that aids in retrieval
and accessibility of information later. The process of retrieving the correct information
from the expert group members helps in increasing the storage capacity of the group and
makes retrieval more efficient (Hinsz, Tindale, & Vollrath, 1997).
In terms of their functions, TMM is about similarity amongst team members and
suggests an integrative function amongst team members, TMS is more about
specialization of knowledge and seems to highlight differentiation amongst the team
member’s expertise (Ellis, 2006). In any team, it is quite likely that some tasks will need
integration of knowledge while at the same time unique expertise needs to be identified,
making differentiation also critical. To sum up, it appears that both TMM and TMS need
to be present in order for effective information processing in groups.
TMS ensures that information will be held by at least one of the organizational
members and lead to improved performance. In accordance with the information
processing model, TMS highlights the necessary condition for collaborative recall:
consensus, correctness and confidence (Hinsz, 1990). Despite strong theoretical support,
empirical support has been equivocal for TMS. A higher TMS does not always translate
28
into optimal team performance. This represents a process loss where team performance is
not a simple multiple of individual performance (Steiner, 1972). TMS process loss is best
captured in the following quote:
The transactive memory concept is problematic because studies of ad hoc laboratory groups indicate that on most tasks, such as those requiring logic, judgment, or problem-solving, groups usually perform above the level of the average individual but rarely reach, let alone exceed, the level of the best member (Thompson & Fine, 1999, p. 287).
The results seem puzzling since TMS has been linked to improved performance
but sometimes results in mediocre outcomes. The question arises as to why teams fail to
leverage the expertise of all their members. However, given that TMS serves as a
knowledge differentiator amongst teammates, comparison can be made from the results
found in the literature on expertise diversity and performance. The empirical results
between expertise diversity and performance have been positive in some cases and
It appears that when diversity increases to a very high level, it becomes very difficult to
coordinate between team members. It is possible that when expertise diversity increases,
members may become alienated from each other and an even greater effort of
coordination is required so that team members can leverage on the benefits of expertise
diversity (Faraj & Sproull, 2000). Expertise diversity refers to “differences in the
knowledge and skill domains in which members of a group are specialized as a result of
their work experience and education” (Van der Vegt & Bunderson, 2005, p. 533,
emphasis added). In some ways, the notion of expertise diversity is remarkably close to
the concept of TMS as both focus on the distribution of knowledge in teams. So, we can
apply this analogy in the present paper.
29
In her dissertation, Rau (2001) found that expertise diversity explained high team
performance in the banking industry when team members develop TMS. However, her
study looked at only the successful teams and overlooked the unsuccessful ones. This
opens up the possibility that expertise diversity may have a different relationship with
team performance when TMS is low or not so well developed. Fortunately, a study by
Van der Vegt and Bunderson (2005) provides some clues to this puzzle. In their study,
expertise diversity was linked as an antecedent to team learning in a study of
multinational teams working in an oil and gas company. They examined the relationship
of expertise diversity and team performance under varying levels of collective team
identification. When team identification was low, expertise diversity was negatively
related to team performance. Conversely, with high team identification expertise diversity
was positively related to team performance.
Gruenfeld and colleagues (Gruenfeld, Mannix, Williams, & Neale, 1996;
Gruenfeld, Martorana, & Fan, 2000) in their research suggest that familiar group
members generally outperform groups of strangers when there is unique information with
each member. However, groups of strangers outperform familiar groups only when they
engage in information sharing. In some ways, TMS explains why group members do not
share unique information with team mates and only share common information for the
most part (Stasser, Taylor, & Hanna, 1989; Stasser & Titus, 1987). This may be because
team members have no idea about the possession of unique information by other
members, and they end up discussing what is collectively known. TMS will only expand
and be beneficial for the team when teammates discuss unique information.
30
When strangers do engage in mutual communication and figure out mutual
expertise, it often brings out unique knowledge. This is especially critical in tasks where a
‘hidden profile’ exists (Stasser & Stewart, 1992), a situation where team members
possess knowledge differentially and all information must be shared in order to find the
correct solution. An example includes solving a murder mystery in which the murder
suspect is correctly identified only when all participants discuss the clues available to
them. Since team members fail to share all the available information, unique information
possessed by strangers often fails to come out in the open. This situation can be
somewhat mitigated when members are motivated to complete the task and have been
informed that a clear solution will exist only if they pool their knowledge together. It is
clear that team diversity impacts how much team members will contribute to information
sharing (Thomas-Hunt, Ogden, & Neale, 2003).
Sometimes teams get motivated, often for emotional reasons, to overcome these
tendencies to avoid information sharing and engage in efforts to build a collective team
identity. According to Van der Vegt and Bunderson (2005), collective team identification
motivates team members to interact more with their teammates and re-categorize their
goals. Consistent with self-categorization theory, it is assumed that re-categorization can
mitigate the adverse effects of subgroups and create a supra-individual goal.
Consequently, evaluations of other dissimilar group members become more positive and
team members start counting others as in-group rather than out-group. When team
members engage in an integration process, it builds the shared code and language
necessary for teams to engage in knowledge creation (Nahapiet & Ghoshal, 1998).
Integration is the “process of developing shared understanding among individuals and of
31
taking coordinated action through mutual adjustment” (Crossan, Lane, & White, 1999, p.
525).
Faraj and Sproull (2000) observed that the mere presence of expertise diversity
was not enough in high performing software teams. In fact when expertise diversity
increased, team members had to engage in greater coordination so that they could
leverage the benefits of expertise diversity. I expect that a fostering environment that
creates collective identity will increase expectations of support from teammates resulting
in an increased effect of TMM on teamwork. Hence, the best team performance is
expected to occur when team members are able to balance their requirements for
encoding knowledge amongst the various team mates by building a great TMS as well as
by their ability to bring the required knowledge together through the commonality of
TMM. Great teams should be able to distribute knowledge amongst team members by
differentiating as well as integrating the collective knowledge.
On the other hand, when members are too specialized in their knowledge it may
create an isolated environment for team members. There may not be any expectations
from other team members to help, and it might result in a bunch of experts thrown
together without any shared understanding of what is required of them. This seems like a
sure recipe for disaster. Team members may stop asking for or offering information when
it is most desired simply because they may not know whom to ask. A case in point is
when the technicians building the mirror of the Hubble Telescope did not seek out the
help of designers. Being under time pressure, the technicians and designers stopped
working together, and it resulted in the production of a sub-optimal telescope. This was a
financial as well as an image loss for both the Perkin-Elmer Corporation and NASA (see
32
Ellis, 2006). Consequently, among the Perkin-Elmer team members’ TMM about team
expectations declined and the resulting team performance was lower than expected. Thus,
TMS alone may not help team performance if TMM is low.
Hypothesis 3: TMM moderates the relationship between TMS and team performance; the relationship is negative when TMM is low but positive when TMM is high.
Context
One way in which organizational work teams differ from typical undergraduate
teams engaged in artificial tasks (e.g. playing computer games etc.) is by the presence of
different contextual variables. Context is defined as “situational opportunities and
constraints that affect the occurrence and meaning of organizational behavior as well as
functional relationships between variables” (Johns, 2006, p. 386). As Johns (2006)
argued, we as organizational researchers do not fully appreciate the impact of context in
organizational settings. Ignoring contextual differences could be a reason why field
research may not generalize across dissimilar settings. From a managerial perspective, we
need to understand the conditions under which real work teams engage in team learning
behaviors. This will be more meaningful as we understand the boundary conditions under
which laboratory results could be applied in organizational work teams. Understanding
these conditions will help practitioners prevent and diagnose potential problems in teams
who are weak on TMM and TMS.
Context can be studied at two different levels – omnibus and discrete (Johns,
2006). Omnibus is a more broadly defined entity and can best be expressed in terms of
capturing who (occupational and demographic characteristics), what (constitutes
substantive content of the research), when (refers to the time at which research was
33
conducted), where (location of the research site), and why (rationale for collection of
research data).
In contrast, the discrete dimension of context is referred to by Johns (2006) as
“the particular contextual variables or levers that shape behavior or attitudes” (p. 391).
Discrete dimensions are expected to provide the explanatory link between the more
descriptive omnibus context and specific organizational behavior like team learning. The
various dimensions of discrete dimension include task, social and physical. Johns
suggests task context would include autonomy, uncertainty, resources, etc. Similarly
some examples of social context would be social density, social structure and direct
social influence. Physical context includes temperature, light, the building environment
and décor. For the purpose of this paper, I will limit my focus to elements capturing the
task dimension of the discrete context apart from the omnibus indicators.
Research in individual job performance has sought to capture context in terms of
situational constraints that make it difficult for employees to successfully accomplish
their tasks (Peters & O'Connor, 1980). This link between situational variation and
performance variation is implicit in several theories of performance that acknowledge
how situational conditions can influence behaviors and outcomes (Campbell & Pritchard,
1976; Schneider, 1978). This notion is consistent with the interactional perspectives of
psychology (Bandura, 1986; Schneider, 1978; Terborg, 1981) that suggest variation in
context as an explanation for variance in performance outcomes. Researchers have
generally found that performance is highest when situational opportunity exists
adequately while lower performance results because of constrained settings (Blumberg &
Organizational Support (5) 10.16(5) 0.09 0.96 0.98 0.98
Team performance (6) 14.52(6) 0.08 0.91 0.95 0.95
Team learning (5) 5.46(4) 0.12 0.90 0.97 0.96
Team viability (7) 69.46(14)* 0.07 0.95 0.97 0.97
TMS
TMS – single factor (15) 213.03(90)* 0.08 0.83 0.86 0.86
TMS – 3 first order factor
(15)
116.57(87)* 0.08 0.96 0.97 0.97
TMS – 3 first order, one
higher order factor (15)
116.57(87)* 0.08 0.96 0.97 0.97
Team creativity
Team creativity, original
scale, single factor (6)
13.51(9) 0.08 0.95 0.97 0.97
Team creativity– modified
(4)
2.08(2) 0.03 1.00 1.00 1.00
Note. S-B χ2
= Satorra-Bentler scaled chi square, df = degrees of freedom, SRMR =Standardized root mean squared residual, NNFI = Non-normed fit index, IFI= Incremental fit index, CFI = Comparative fit index.
*p<0.05
Table 3. Confirmatory factor analyses of the scales
64
CHAPTER 4: RESULTS
Descriptive statistics and zero-order intercorrelations for the variables are
presented in Table 4. Several significant relationships involving control variables were
observed. First, team tenure was positively related to high levels of TMS Specialization (r
= 0.32, p<0.05) and TMS credibility (r = 0.43, p<.05), and teams with longer tenure
reported a higher level of team performance (r = 0.34, p<0.05), team learning (r = 0.42,
p<0.05) and team creativity (r = 0.39, p<0.05). Second, team size was negatively related
Vollrath, 1997) and organizational team research (Argote, Gruenfeld, & Naquin, 2001) to
extend the relationship between SMM and TMS. Table 21 reflects the conceptual
overlap.
Perspective TMM TMS
Present study Integrative Differentiation
Group learning Interpersonal focus Task focus
Information sampling Shared information Unshared information
Information processing Sharing Storage and Retrieval
Table 21. Conceptual overlap across different literatures on team learning.
134
As seen in Table 21, the current study clarifies how TMM and TMS are
conceptually similar to constructs discussed in various literatures related to team learning.
First, the group learning literature stresses the importance to acquire, share, refine, or
combine task-relevant knowledge through interaction with one another (Argote,
Gruenfeld, & Naquin, 2001). It is clear that such a definition has two important
components – a) interpersonal interaction and b) task-relevant knowledge. A TMM is a
measure of interpersonal awareness and adequately captures the sharing of information
across team members while TMS with its differentiation focus captures how task-relevant
knowledge is distributed.
Second, small group researchers working mostly in experimental settings have
developed an amazing literature on how groups work. This literature has been commonly
referred to as the information sampling framework. A common result of their study is that
groups work best when they combine all the relevant information, shared and unique,
dispersed and available, to their members (Stasser, Vaughan, & Stewart, 2000; D. D.
Stewart & Stasser, 1995). It has been suggested that groups are able to solve the most
complex problems when they are able to incorporate unique information from out-group
members or strangers (Gruenfeld, Mannix, Williams, & Neale, 1996; Thomas-Hunt,
Ogden, & Neale, 2003). This is consistent with the present theoretical conceptualization
that we need a match between TMM, focusing on common knowledge and interaction,
and TMS, focusing on unique knowledge dispersed within the group.
Third, the information sharing framework suggests that groups act as information
processors when they efficiently share, store and retrieve information (Hinsz, Tindale, &
Vollrath, 1997). Recently, Wilson et al. (2007) also characterized group learning as a
135
three step process of sharing, storage and retrieval. I propose that TMM focuses on the
sharing process while TMS captures the storage and retrieval part. Hence, the present
conceptualization of the TMM and TMS constructs is consistent with those enumerated
by the information-processing framework.
A major limitation of the previous work has been the lack of clarity about whether
scholars are studying team learning as an outcome or as a process (Wilson, Goodman, &
Cronin, 2007). I propose that team learning processes are explained by the constructs of
SMM and TMS, while learning outcomes are better explained by team learning behaviors
as observed by team managers. This is consistent with the argument that research focused
on task mastery jobs (e.g. SMM and TMS) in experimental settings has been focusing on
team learning processes while scholars investigating group processes have focused on
team learning outcomes (Edmondson, Dillon, & Roloff, 2008).
A major contribution of this study is to integrate the research on team learning
from multiple perspectives by making an explicit assumption that TMM and TMS are
two emergent learning processes and are different from the construct of team learning as
an outcome. I tested this assumption by explicitly measuring TMM, TMS and team
learning. Another related contribution of this study is to extend the idea that TMM
captures the integrative function while TMS focuses on the differentiation aspects within
a team.
Finally, I delineated the team learning construct from team performance as
Wilson et al. (2007) argue in the following statements that team learning is not equivalent
to team performance as implicitly assumed (p.1043).
We argue that learning may have occurred, even when there was no change in a group’s overall performance. For example, the
136
group may have learned something but may not have had an opportunity to apply the learning in a way that would change its performance. Conversely, performance can change without any learning actually taking place.….. Finally, learning does not always result in positive outcomes. Research on group learning needs to account for the possibility of dysfunctional learning, as in the case of superstitious learning, where a group learns a false connection between its actions and some outcomes.
In the present study, team learning and team performance were highly correlated
suggesting that learning was integral to better team performance. Yet, the results clearly
suggest that team learning is quite distinct from team performance. It is important to
understand that the predictors of team performance may not predict team learning. In
addition, team learning and team creativity were quite distinct. Moreover, the present
study highlights that the importance of explicitly considering the dependent variables of
interest. The results suggest that team performance was contingent on TMS credibility
but not on either TMS specialization or TMS coordination. In other words, the belief or
trust in the accuracy of the teammates matters most for high team performance. Further,
the actual distribution of knowledge amongst teammates, and the ability to work together,
does not predict team performance. Similarly, team creativity was dependent on TMS
credibility and TMS specialization, but not on TMS coordination. Thus, team creativity
does not depend on team members’ ability to work together.
Further, team coordination predicted team viability and team satisfaction. My
study provides empirical support to the notion that team learning and team performance
are not interchangeable, and are two distinct constructs with unique predictors. Hence,
the idea that engagement in team learning will always lead to better team performance or
vice-versa is not a tenable argument.
137
Context
As anticipated, contextual variables like team size, team tenure and country of
origin were strong predictors of team effectiveness measures. It was interesting to
observe that team tenure was related to increased team learning suggesting that team
members may need to work together for a substantial time before they start engaging in
team learning. This may be because team members need to know each others’
preferences and skills/ beliefs before coming together to find common ground on how to
change their established behaviors.
This is consistent with the findings of Gladstein (1984) that team performance in
organizational settings is strongly dependent on organizational features. It is possible that
there is an optimum team size beyond which team performance and team creativity suffer
due to problems in managing coordination within the team.
In my study, teams from the US displayed higher team performance, engaged in
more learning behaviors and team creativity compared to teams from India. It should be
mentioned that almost all teams from India were from the IT industry, while the teams
from the US were more diverse representing multiple industries. It is likely that teams
from the IT industry behave differently compared to those in other industries. Hence, it is
hard to pinpoint whether the observed differences were due to national or industry
characteristics. The results underscore the importance of considering contextual factors
like geography and organizational characteristics as boundary conditions for the
applicability of theoretical models in team effectiveness (Johns, 2006).
Contextual variables like organizational support and team reward helped increase
team viability. It appears that goals associated with team rewards help accentuate team
138
members’ social identity with self and others into in-group and out-group. Self-
categorization theory predicts that a superordinate goal applicable to everyone in the team
(e.g. team rewards) will make the team work together for achieving the goal, resulting in
relatively stable group structure and increased team viability (Hogg & Terry, 2000).
Organizational support also helped increase team members’ satisfaction with each other.
These results reiterate the importance of considering contextual variables in order
to predict team level outcomes. Laboratory experiments generally fail to capture the
intricacies of teams in professional settings. In my sample comprising of teams from
diverse backgrounds, contextual variables (e.g. team size, team tenure, country of origin,
organizational support) were strong predictors of team effectiveness dimensions. Ignoring
these important variables that are vital in any field study of “real-life” organizational
teams will provide an incomplete picture of the actual team processes.
TMM
In particular, this study using the Average Deviation Index of TMM failed to
support the notion that Mental Models had a linear effect on team performance, a result
inconsistent with those obtained by Mathieu and colleagues (Mathieu, Goodwin, Heffner,
Salas, & Cannon-Bowers, 2000; Mathieu, Heffner, Goodwin, Cannon-Bowers, & Salas,
2005). However, the present research examined organizational work teams whereas
Mathieu and colleagues have looked at mainly student samples. Also, the contextual
variables provided a stronger effect on team performance and could be a reason why
Team Mental Model (TMM) failed to predict team performance. However, the results are
consistent with a rare field study conducted on TMM in a field setting which failed to
139
observe linear relationships between TMM and team performance (Smith-Jentsch,
Mathieu, & Kraiger, 2005).
Operationalizing TMM
The operationalization of TMM as a 6-item scale was supportive of the linear
relationships between TMM and team performance. Since the proposed model was not
validated by one of the two operationalizations of TMM, there is a need for further tests
to investigate the inconsistent results obtained in this study in more field settings. It is
clear that choosing the method to measure TMM has an impact on the results and
implications for researchers working in this area.
The results from exploring average deviation indices (Burke & Dunlap, 2002) and
using a six-item alternative likert scale (Appendix B) as indices of TMM were similar in
one respect yet different in many ways. The results yielded similar results in relation to
the three hypothesized relationships; yet, the post-hoc results yielded two different
patterns and a slightly different explanation suggesting that computing agreement by rank
ordering of the team processes by team members leads to an effective measure of TMM.
The average deviation captures the agreement level in a team and hence seems to be an
effective measurement method.
TMS and team effectiveness
TMS was more helpful than TMM in predicting team performance. Interestingly,
the main component of TMS driving this relationship appears to be TMS credibility. In
addition, TMS credibility also predicted team creativity. The results suggest that teams
are more creative and better performers when members trust each other’s expertise. This
140
raises the suggestion that it is vital to develop recognition and credibility around the
expertise available within teams.
The exploration of the curvilinear relationships between TMS components and the
various team effectiveness dimensions led to some interesting results. It was important to
highlight that different TMS components behaved differently with the dependent
variables of interest. Specifically, TMS credibility exhibited an increasing hyperbolic
relationship with team performance, TMS specialization exhibited a U-shaped
relationship with creativity and TMS coordination exhibited the same with team viability
and satisfaction. In general, team performance was best under the highest levels of TMS
credibility, suggesting that it is important for team members to identify and trust the
expertise available within teams. A high TMS credibility implies implicit trust about the
accuracy of other members’ knowledge. In contrast, a low TMS credibility suggests that
members do not trust each other’s expertise, and this may lead each member to waste
time and effort by cross-checking the information received. In terms of information-
processing theory, it is possible that when teammates have strong belief in each other,
they will spend less time searching for information. This may lead to efficient retrieval of
information, which should result in better team performance. When team members trust
each other they are more likely to try out new ideas suggested by their members leading
to higher team creativity.
Similarly, results suggest that teams high on TMS specialization engage in more
creative behavior. This is likely because teams high on specialization will be comprised
of individuals with a high level of knowledge differentiation. A team with different
viewpoints is more likely to engage in new ways to do things and be creative. Another set
141
of results that TMS coordination predicts team viability and team satisfaction has a
simple explanation. TMS coordination refers to team members’ ability to work together
efficiently. Thus, teams are more likely to continue working together in the future and
engage in behaviors essential to maintaining itself for future tasks or be viable. In
addition, team members are more likely to be satisfied with each other when they can
work together efficiently.
TMS and TMM interaction
When I examined the interactions between TMM and TMS, the two different
operationalizations of TMM led to different results. The one clear pattern from
examining the results was that measuring TMM in terms of average deviation led to
superior results in terms of the observed interactions amongst TMM and TMS. This
suggests that it is important to measure agreement amongst team members about their
teammates and team processes. I’ll first discuss the results obtained when TMM was
operationalized as an average deviation index.
Contrary to expectations, TMM and TMS did not have an additive effect on team
performance and team learning but more of a compensatory effect. High TMM made up
for low TMS. As expected, TMM moderated the relationship between TMS and team
creativity but in an unexpected way. As expected, teams had the lowest creativity when
both TMS and TMM were lowest. Surprisingly, results revealed that team creativity was
highest under conditions of low TMM and high TMS. The results suggest lack of TMM
frees team members from a rigid mindset of doing things, unleashing more options and
fostering the climate for innovation and creativity. In addition, my results suggest a
consistent pattern of moderation between TMS credibility and TMM on team
142
performance, team learning and team creativity. A similar pattern of results was also
observed between TMS specialization and team creativity.
One reason why we observe the compensatory effect of TMM and TMS in
predicting team performance and team learning could be that a high degree of TMM
coupled with high trust levels regarding expertise in a team (TMS credibility) builds a
sense of complacency within the team. It is also possible that in such situations, project
teams are expected to bring their different expertise and viewpoints towards completion
of organizational tasks. However, teammates look toward their “experts” and fail to
engage in an open ended constructive dialogue critical for effective team performance
(Tjosvold, 1985). This may result in the building of unusually high trust within teams,
which may lead to stifled creativity as a potential downside (Wicks, Berman, & Jones,
1999). Thus, high TMM and TMS credibility lead to a situation where teams engage in
less idea-generation, a negative consequence of both high TMM and high TMS
credibility. This may be partially responsible for the absence of team learning behaviors
because the team has a mental model that suggests a dysfunctional level of agreement.
The results were slightly different when measured with a 6-item scale to measure
TMM. TMM moderated the relationship between TMS specialization and team creativity
as observed before, but the pattern of interaction was slightly different (Figure 14) than
that observed when TMM was measured as an average deviation index (Figure 8). Teams
displayed the highest creativity levels when they demonstrated both high TMS
specialization and high levels of TMM. Conversely, teams exhibited the lowest creativity
under conditions of high TMM and low TMS specialization. It appears that high levels of
TMM are unhelpful and lead team members to behave in an established way of doing
143
things. This condition of high TMM seems especially problematic when there is low
TMS specialization, or a lack of specialists. A team with a high level of shared
knowledge, low TMS specialization, is hardly going to be creative when they all share a
high TMM. On the contrary, TMM is most helpful when team members focus on their
own task and engage in sharing the unique knowledge dispersed among team members.
The pattern of interaction observed between TMS credibility and TMM on team
creativity is similar. Under conditions of low TMS credibility when team members have
very little trust in each other, a high level of TMM was particularly disruptive. Naturally,
team creativity was lowest when teammates trusted each other the least and were under a
situation of high TMM. Teams did best when they had high TMM and a strong belief in
each other, as evident by high TMS credibility.
As expected, team viability was highest under conditions of high TMM and high
TMM coordination. Stated another way, when teammates have an ability to work
together efficiently, as captured by the notion of high TMS coordination and high
knowledge about teammate’s characteristics and their interpersonal interaction patterns,
captured by high TMM, they express interest in continuing to work together. In contrast
when TMM is low, teammates are wary of their teammate’s reaction to a particularly
novel situation that may arise in due course. Teams exhibit low willingness to continue
together when they have teammates who have the ability to work together but don’t do
so. This might create an impression that it is better to dissolve the existing team than
continue working together.
It was interesting to observe a moderate correlation between TMS coordination
and the alternative 6-item TMM scale. It appears that there is a similar reaction towards
144
TMS coordination as towards TMM. This is expected, as per the definition of these two
constructs. If there is substantial agreement amongst team members, it is quite likely that
they will have a high TMM as well as believe in their ability to work together efficiently
leading to high TMS coordination. In some ways, TMS coordination has the closest
linkages to TMM, suggesting that these two constructs may be capturing the same
underlying phenomenon. However, the lack of a similar relationship with the average
deviation method does weaken the argument.
Managerial Implications
The results provide helpful tips for practitioners interested in team learning. While
many practitioner oriented books have suggested that team learning is very important, it
has been rather difficult to implement the suggestions in practice. I hypothesized that
TMM and TMS are important antecedents to team performance. The results illustrate that
contextual factors like team size, team tenure and country are strong predictors of team
performance and team learning. Managers should consider the impact of increasing team
size in organizations. While more people in a team helps bring multiple and often varied
expertise to a team, managing divergent viewpoints and conflict becomes an important
drawback resulting in lower than expected team performance (Haleblian & Finkelstein,
1993). This is especially important as organizational work teams have been increasing in
team size over the years. The fact that increased team tenure helps increase team learning
is critical for organizations that are promoting intellectual capital. The fact that team
learning is an added benefit of retention will be of interest to human resource executives.
The cross-cultural study also highlights the importance of considering the influence of
national work cultures. A majority of the teams were from organizations with a
145
substantial multinational presence, and yet the results suggested that teams from the US
had better team performance than those from India.
Results suggest that TMS credibility plays a key role in improved team
performance and team creativity. The results are consistent with prior findings that team
processes are more important for team effectiveness than individual members’
competence when teams work together for a long time (Watson, Michaelsen, & Sharp,
1991). This study supports the conventional wisdom that it is important to build trust in
team members’ knowledge rather than staffing a team with individual star performers
(Gladwell, 2002).
Organizations can help teams achieve high TMS credibility by identifying experts
and encouraging team members to believe in each other by assigning tasks that build trust
and reliance on each other. Additionally, results demonstrate that it is important to
determine team objectives before engaging in any team-building activities. Managers
must decide whether they want to focus primarily on team performance, team creativity
or team viability. The choice of the specific objective must be matched with
corresponding TMS components. In my study, high performance teams were high on
TMS credibility, while the most satisfied teams were high on TMS coordination. This
implies that different mechanisms are at play in achieving desired team effectiveness
dimension.
Senior executives and organizations should also realize that spending time and
effort on improving TMM is not always a good thing (Senge, 1990) because teams in my
sample did perform well despite low levels of TMM. Managers should consider the
alternative approach of improving TMS credibility to achieve high team performance.
146
More importantly, managers must take into account the contingency approach between
balancing TMS and TMM. High team performance can be obtained by being high on one
construct and low on the other. Practitioners should take into account the match between
TMM and TMS before deciding on how teams should achieve the desired objectives. If
the team has high TMM, managers may not benefit from trying to improve TMS
mechanisms. On the other hand, if the team exhibits low TMM, efforts to improve TMS
mechanisms can be helpful. All of the preceding suggestions can be facilitated by
managers surveying team members in order to find out initial levels of TMM and TMS.
Limitations
The relatively small sample size in this study limited the statistical power to
detect significant relationships. The sample for the present study comprised of 41 teams,
and is similar to those in many other team level studies like a 45 team study reported by
Stewart and Barrick (2000) as well, average project teams studies reported by Cohen and
Bailey (1997). However, some strong results were observed between team performance,
team size and country. The presence of the interactive relationship between TMM and
TMS credibility suggests the presence of strong effects irrespective of the small sample
size. Thus, it is important to further explore these constructs to better understand team
performance and learning.
Second, the present sample may not be generalizable to all types of organizations.
However, the study sample consisted of 41 teams from 11 organizations across 7
industries from two countries. The multi-industry, multi-organization sample resulted in
increased variance in the sample. Hence, the results are expected to be conservative
147
estimates and should generalize better than prior studies focused on a particular industry
or an organization.
Third, the cross-sectional nature of the data limits the findings. Teams may have
been at different stages in their life-cycle, some newly formed, others mature and yet
others working on their last project together when the data were collected. The average
team tenure was 2.9 years, suggesting most teams had been working together for a
substantial length of time and the lack of supportive findings are not due to the survey
timing. It would have been beneficial if all the teams were at the same level of formation,
and the data collection was done longitudinally to better understand the team learning
processes. Hence, any inference of causality should not be deduced because of the
correlational nature of data.
Fourth, although many measures were collected from team managers, some
results may have been influenced by common method bias. In particular, common
method bias could have influenced the relationship between team viability and
satisfaction and TMM and/or TMS. The team processes (TMM and TMS), team viability,
and team satisfaction measures were collected from team members rather than external
observers.
Fifth, although I had a reasonably high response rate, 58% response within each
team, for a field study done remotely by online surveys, team level constructs such as
TMM and TMS are more representative when complete information from every team
member is available. However, it took multiple reminders to achieve the present response
rate and researchers should be mindful of the low response rate in field settings.
148
Sixth, I operationalized TMM as an average deviation index, a type of difference
score, following scholars studying the mental model literature (cf. Smith-Jentsch,
Mathieu, & Kraiger, 2005). The use of difference scores has been criticized by
researchers as this may not capture the agreement constructs like TMM effectively.
Edwards (Edwards, 1995; Edwards & Parry, 1993) has recommended that researchers use
other techniques like polynomial regression techniques to operationalize the agreement
constructs like TMM.
Seventh, many of the findings were of marginal significance (p≤ .10). This
increases the probability of finding results by chance, a direct result of Type I error.
Hence, these results should be interpreted with caution. Replication studies are needed to
support these results.
Finally, I chose to aggregate constructs to team level even when some agreement
indices were lower than the conventionally accepted cut-off norms. This may have
affected the results. It is possible that my sample represents a lower level of agreement
amongst team members than has been observed in the published research. This may
reflect team members having significant within-group differences. Future researchers
should carefully model agreement in future research differences, as well the similarities
amongst team members, by using a multilevel procedure (Kozlowski & Klein, 2000).
Fortunately, the chi-square tests under confirmatory factor analyses were significant
despite the small sample size, which provides a conservative estimate that items do
represent the underlying constructs.
149
Future Research
Future researchers could pursue many different avenues. First, it is important to
investigate the conditions under which teams engage in learning behaviors. In this study,
I did find that contextual variables play an important role in predicting team-level
outcomes, but was unable to pinpoint the impact of industry and the country of origin on
team effectiveness. Due to the paucity of field studies involving TMM and TMS, there is
a need to engage in more field studies to replicate the findings of this study. Scholars
should investigate multiple industries, and countries to examine their impact on team-
level dimensions. It is also important to examine more proximal organizational design
features that may affect team performance and team learning.
Second, TMS and TMM are conceptualized as emergent processes that emerge
over a period of time. The current study was a cross-sectional study and included teams at
all levels of maturity. It will be helpful in future studies if teams are tracked from their
time of formation to the time of disbanding, and regular measurements at equal intervals
are done to track the development of TMS and TMM. Hence, it is important to do a
longitudinal study of the teams to get a better sense of how TMS and TMM develop, as
well as resulting impact on the team level outcomes like team performance, team learning
and creativity.
Third, there is an urgent need to clarify both conceptually and methodologically
the nature of the TMM construct (Mohammed, Klimoski, & Rentsch, 2000). Ironically,
unless there is an agreement amongst researchers working on the mental model construct,
the research is likely to remain fragmented and of little use to researchers and
practitioners alike. I conceptualized two different ways to capture TMM, and the similar
150
pattern across both methods suggests that the TMM construct can be meaningfully
captured using an average deviation index in field settings. This is an initial effort to
measure TMM in “real-life” teams and needs to be replicated in other settings.
Fourth, the finding that the TMS construct is better represented as a three-factor
structure under an umbrella construct deserves more investigation. The evidence that the
narrow dimensions (e.g. specialization, coordination and credibility) predict team
outcomes (e.g. team performance and team creativity) better than a broader construct is
helpful. In the future, researchers should include these three factors as stand-alone
predictors of variables such as team performance.
Fifth, the results suggest an extremely strong relationship between TMS, TMM
and team creativity. Team creativity turned out to be more strongly related to the TMS
components than team learning. This unexpected relationship can be utilized by
researchers focused on creativity, as TMS specialization and TMS credibility turned out
to be important predictors of team creativity.
Sixth, in order to integrate findings across similar sounding labels, it is important
that researchers take a broader perspective when they continue working in this field and
adopt a cross-fertilization approach to assimilate the existing findings and clarify the
meaning underlying the term team learning. The confusion regarding the construct is
quite evident by recent summaries of literature around this topic, and it is no wonder that
the existing research is so fragmented that researchers hope for more integration