Policy Research Working Paper 5810 How Do the Poor Cope with Shocks in Bangladesh? Evidence from Survey Data Indhira Santos Iffath Sharif Hossain Zillur Rahman Hassan Zaman e World Bank South Asia Region Social Protection Unit September 2011 WPS5810 Public Disclosure Authorized Public Disclosure Authorized Public Disclosure Authorized Public Disclosure Authorized Public Disclosure Authorized Public Disclosure Authorized Public Disclosure Authorized Public Disclosure Authorized
Transcript
Policy Research Working Paper 5810
How Do the Poor Cope with Shocksin Bangladesh?
Evidence from Survey Data
Indhira SantosIffath Sharif
Hossain Zillur RahmanHassan Zaman
The World BankSouth Asia RegionSocial Protection UnitSeptember 2011
WPS5810P
ublic
Dis
clos
ure
Aut
horiz
edP
ublic
Dis
clos
ure
Aut
horiz
edP
ublic
Dis
clos
ure
Aut
horiz
edP
ublic
Dis
clos
ure
Aut
horiz
edP
ublic
Dis
clos
ure
Aut
horiz
edP
ublic
Dis
clos
ure
Aut
horiz
edP
ublic
Dis
clos
ure
Aut
horiz
edP
ublic
Dis
clos
ure
Aut
horiz
ed
Produced by the Research Support Team
Abstract
The Policy Research Working Paper Series disseminates the findings of work in progress to encourage the exchange of ideas about development issues. An objective of the series is to get the findings out quickly, even if the presentations are less than fully polished. The papers carry the names of the authors and should be cited accordingly. The findings, interpretations, and conclusions expressed in this paper are entirely those of the authors. They do not necessarily represent the views of the International Bank for Reconstruction and Development/World Bank and its affiliated organizations, or those of the Executive Directors of the World Bank or the governments they represent.
Policy Research Working Paper 5810
This paper uses household survey data collected in September–October 2009 on a nationally representative sample of 2,000 households in Bangladesh to examine the nature of shocks experienced by households over the preceding 12 months and the type of coping mechanisms that were adopted. The analysis finds that more than half the sample claimed to have faced a shock—economic, health, climatic, or asset related—over the previous year. Surprisingly, the non-poor face a larger share of these shocks compared with the poor. A closer look at this result shows that the non-poor report a significantly larger share of “asset-related” shocks, which is consistent with the fact that the poor have fewer assets to lose. Health-related shocks dominate and households appear to have coped with these shocks through savings and loans, help from friends, and depletion of assets. The
This paper is a product of the Social Protection Unit, South Asia Region. It is part of a larger effort by the World Bank to provide open access to its research and make a contribution to development policy discussions around the world. Policy Research Working Papers are also posted on the Web at http://econ.worldbank.org. The author may be contacted at [email protected].
results show that households, when faced with covariate shocks due to climatic reasons, are less able to cope. As would be expected, the poor are less able to cope with shocks compared with the non-poor; the poor are more likely to use coping mechanisms that could have negative welfare implications in the longer term, including the depletion of assets, reduction of essential consumption, and use of high-interest loans. Econometric analysis suggests that geographical location, socio-economic status, and access to microfinance all affect the ability to cope with shocks. Policy implications include the importance of developing safety nets that take into account the vulnerability to climate-related shocks and further developing the links between micro-finance and safety net programs.
How do the poor cope with shocks in Bangladesh? Evidence from survey data
To the extent that data from September 2009 can point to the impacts of the 2009 global
financial crisis, the results suggest that this shock appears to have had limited impact in
Bangladesh. The two main channels which were of concern were a drop in remittance income
and job loss in export industries (especially garments). The household survey data suggests that
these concerns did not materialize. When households were asked whether they had experienced a
crisis due to a set of reasons, less than 1% of households said they had experienced a shock
7
related to the decrease or a full loss of remittance income.1 Similarly, 61 percent responded
income from “garment factory work” remained the same, while 34 percent reported an increase
and 4 percent reported a decrease. This data is clearly not a comprehensive assessment as it is
difficult to say what income from these sources would have been in the absence of the economic
crisis. However, the fact that so few households appear to have been adversely affected appears
consistent with ex-post macro-economic data. Remittances increased by about 13 percent
between 2008/09 and 2009/10 (from $9.7 billion to $11 billion). Export earnings from garments
in 2009/10 also increased compared to the previous year ($12.3 billion in 2008/09 and $12.5
billion in 2009/10) though less so than the change in remittances. Overall, „economic shocks‟
appear to be mostly from agriculture-related events rather than loss of employment or business.
The fact that the non-poor report a larger incidence of shocks relative to the poor (56%
compared with 51%) may at first glance appear counter-intuitive (table 5). This is consistent with
the results found in Quisimbing (2007) where she explains the possible presence of respondent
bias when reporting on shocks of certain types. For example, it is possible that only better-off
households will actually be able to pay for certain types of “economic shocks” such as dowries
and wedding expenses and thus only wealthier households will report having these types of
shocks. Non-poor households are likely to have more assets compared to poor households and
thus report higher incidence of asset shocks. Heltberg and Lund (2010) also report that the non-
poor face more shocks than the poor in Pakistan, and that shocks are predominantly health-
related.
Insert Table 5
According to Table 5, the type of shocks reported varies significantly depending on
poverty status and the location of the household. Conditional on experiencing a shock, the
incidence of climatic shocks is larger among poor households (defined as the bottom 40 percent
of the population along the expenditure distribution) while asset and health related shocks appear
to be more common among non-poor households. Conditional on experiencing a shock, only the
incidence of climatic shocks varies significantly across urban and rural households, with the
8
latter being significantly more affected (17% of rural households report being affected by these
shocks compared to 9.5% among urban households).
Rural households are more likely to be involved in agriculture and thus more likely to
face weather related climatic shocks e.g. loss of land due to river erosions and floods. The
geographic distribution of the shocks is also consistent: households in Barisal, one of the poorest
divisions located in the Southern-most tip of the delta and thus susceptible to flooding and river
erosions, face the highest incidence of shocks with a majority of shocks being weather-related.
Households in Sylhet which is in the North-Eastern corridor bear the second highest incidence of
shocks but the majority of the shocks are health-related.
For each shock, households were asked to list the ways that the household coped. All of
these responses were broadly organized under ten different types of coping strategy: reduction of
non-essential consumption; reduction of essential consumption; help from friends; help from
government and NGOs; low interest loans; high interest loans; savings; increase in labor supply;
and depletion of assets.
In addition, households were given the option of responding that they “could not cope”
with each of the shocks. Out of the total number of households experiencing a shock, 36.5
percent shocks say they could not cope with one or more shocks. We interpret not being able to
cope as meaning that households were not able to mitigate the negative effects of the shock
experienced.
As presented in Table 6, we find that households are significantly more likely to say that
they could not cope when the shock is climatic (59.1 percent) than any other shock. This is
consistent with the notion that climatic shocks are generally covariate shocks and households are
unable to rely on community-based coping instruments. A little over 50 percent and 60 percent
of the households in Rajshahi and Barisal, respectively, are unable to cope with shocks. Both
these divisions are relatively poor as well as highly prone to seasonal shocks and river bank
erosions. A significantly higher number of rural households (39.7%) report being unable to cope
with shocks compared to urban households (34.3%) and is consistent with the fact that climatic
shocks occur mainly in rural areas.
9
Table 6 also shows, using savings and low interest loans are the two most common
coping mechanisms used by households who experienced a shock: 34.2 percent used savings
while 24.9 percent used loans. Savings and borrowing are mainly used to deal with health
shocks; borrowing is also extensively used to cope with asset shocks.
About 19 percent of households reported disposing household assets in order to deal with
shocks. Public assistance, or any form of formal social protection, on the other hand appears to
play a negligible role in helping households cope with shocks. Only 1.2 percent of households
report using safety nets as being one of the top four coping mechanisms used to face a shock.
The relative importance of savings and borrowing compared to public assistance in dealing with
shocks is perhaps not surprising given the vast microfinance, and informal credit sector that
operates in Bangladesh and the low coverage of public safety nets.2
Importantly, even with the widespread use of microfinance, households still rely on
coping mechanisms that are likely to have negative welfare consequences or that are very costly.
This is the case of many rural households. While urban households rely more on savings, rural
households are, for example, more likely to dip into their assets or use high interest loans from
money lenders compared to their urban counterparts. A number of households (almost 8 percent)
also report having reduced essential consumption as a coping strategy, indicating the severity of
some of these shocks and the lack of appropriate instruments to manage their effects. Such an
extreme coping strategy is more common for economic shocks (table 6), and is mostly adopted
by poor households relative to the non-poor, as one would expect.
Insert Table 6
Both the non-poor and poor are equally likely to utilize low interest loans to deal with
shocks. Poor households also have access to some savings but less so than the non-poor: 25.7%
report using savings to cope with shocks among the poor, compared to 39.9 percent of the non-
poor. We infer from the „could not cope‟ column that when we disaggregate the sample by
expenditure quintiles, we find that the portfolio of coping instruments available to the poorest
households is a lot more limited than that available to richer households. Conditional on
2 The gap may also be explained by the fact that we are only looking at ex-post coping mechanisms and, to the
extent that that public assistance received by the household does not increase with a shock, households may not perceive it as a relevant coping strategy ex-post.
10
experiencing a shock, 41.2 percent of the households in the poorest quintile were unable to cope
with the shock, significantly higher than the 31 percent for the wealthiest quintile (see Table 6).
So while poorer households are no more likely than wealthier households to face shocks, they are
more vulnerable once they have faced a shock. A majority of the households who face shocks in
the poorest divisions – Rajshahi and Barisal - also report to be unable to cope with the shocks.
Not only are these divisions relatively poorer, they are also prone to seasonal climatic shocks
such as droughts and river erosions.
Overall, the data seem to suggest that households in 2008-09 faced a wide variety of
shocks, in addition to the global recession. However, the impact of the global crisis on
households via reduced flow of remittances and/or retrenchment from formal private sector
employment (especially garments) was negligible. Health-related idiosyncratic shocks dominated
and households appear to have coped with these shocks through savings and loans, help from
friends and by depleting assets. Households, when faced with covariate shocks due to climatic
reasons, appear however to be less able to cope: more than half of the sampled households that
experienced climatic shocks were not able to cope with them. Public safety nets or the vast
number of NGOs that operate in Bangladesh do not appear to play much of a role in helping
households deal with shocks. The following section uses multivariate regression analysis to
better understand which households are able to deal with these shocks and why.
4. Determinants of household ability to cope with shocks
In this section, we try to explore the factors that make households more likely to face
shocks as well as factors that help them cope with shocks. In Table 7 we present results of two
logit models. The first column shows the results where the dependent variable takes the value 1
if the household faced one or more shocks in the last 12 months; and zero, otherwise. The second
column includes the results of a logit regression on the factors which influence whether a
household is unable to cope with shocks. Explanatory variables include household income;
household size; the age, gender and education levels of the household head; household poverty
status; and per capita value of assets owned, dummy variables representing the four broad
categories of shocks and dummy variables representing household location in terms of divisions
and urban/rural status.
11
A number of patterns emerge that are consistent with our earlier description of the data.
The results show that households whose main source of income is agriculture and big industry
are more likely to face shocks compared to households who depend on wage labor. Households
with more educated household heads (i.e. those who passed secondary education) relative to
those who are illiterate are also more likely to face shocks. These results confirm the earlier
finding that poorer households in Bangladesh are not necessarily more prone to facing shocks.
Indeed the dummy variable representing household poverty status confirms this although the
result is only marginally significant (p value = 0.10). The result also confirms that rural
households are more likely to face shocks due to agro-climatic factors. Again confirming the
results in the descriptive section, households in Barisal and Sylhet are more likely to have faced
shocks relative to households in other divisions.
Insert Table 7
Next, for households who faced a shock, we explore the factors that allowed certain
households to cope and others not. The dependent variable once again is dichotomous and takes
the value 1 for the household who reported to not have coped with the shock conditional on
facing a shock, and zero, otherwise. Along with the independent variables used in the previous
logistic regression, we include dummy variables representing the four broad types of shocks, as
well as dummy variables representing access to services and programs that we hypothesize
would help households cope with shocks such as whether the household is a member of a
microcredit organization; whether the household receives transfers from a public safety net
program; and whether the household can borrow against an emergency.
The results presented in Table 7 also point to the importance of access to savings and
loans services rather than public safety nets in dealing with shocks (at least ex-post and as
reported by households). We find that households who are members of microfinance institutions
(MFIs), who provide both savings facilities as well as access to micro-credit, are more likely to
be able to cope with shocks. The results are consistent with existing studies that argue that
microfinance plays a positive role in smoothing consumption (Morduch, 1999; Pitt and
12
Khandker, 1998; Zaman, 1999).3 On the other hand, access to public safety nets is not a
significant determinant of the household‟s assessment of whether they are able to cope or not.
This result is not surprising since except for a few (e.g. Vulnerable Group Feeding and
Gratuitous Relief) most of the safety nets are designed to mitigate the effects of chronic poverty
and are not catered to mitigating the effects of shocks. These results need to be interpreted with
caution as we do not account for the fact that those who access these services – both micro-
finance and safety nets – may have different unobservable characteristics relative to those
households who do not (the „selection bias‟ problem).
Household poverty status is also a significant determinant of the ability to cope. We had
earlier found poor households to be less likely to have experienced one or more shocks.
Conditional on facing a shock however, we find that poor households are more likely to not be
able to cope. This result is consistent with the results we find with regards to the division dummy
variables: households living in poorer divisions are less likely to cope with shocks. Relative to
households living in Sylhet, the results show that households in Rajshahi, Khulna and Barisal are
more likely to not be able to cope with shocks. The results also show that households whose
major source of income was from agriculture are more likely to not be able to cope relative to
households whose major source of income was from casual labor. The results also show that
households are more likely to be able to cope with health shocks but not climatic and asset
shocks.
5. Conclusion
We can summarize our main findings as follows. First, shocks of various forms affect a
large share of Bangladeshi households – our survey of 2,000 households showed that more than
half the sample claimed to have faced a shock over the previous year. Surprisingly, the non-poor
face a larger share of these shocks compared to the poor – a closer look at this result shows that
the non-poor report a significantly larger share of „asset-related‟ shocks than the poor which is
consistent with the fact that the poor have fewer assets to lose. As one would expect, however,
the poor are less able to cope with shocks compared to the non-poor. Importantly, the poor are 3 As a robustness check we also run a multinomial model where households face one of the following mutually exclusive
outcomes – to not experience a shock; to experience a shock and cope with it; and to experience a shock and not be able to cope
with it. This allows us to include the full sample as opposed to half the observations used in the logistic regression to look at
household ability to cope. We find that the same variables that are significant in the logit model are also significant determinants
of the relative probabilities of facing the above outcomes. Results are available from the authors.
13
also more likely to use coping mechanisms that could have negative welfare implications in the
longer term, including the depletion of assets, reduction of essential consumption and the use of
high interest loans.
The analysis of factors that contribute to household coping with shocks suggest that
microfinance products may help households cope with idiosyncratic shocks but when it comes to
large covariate shocks, households in Bangladesh remain highly vulnerable. Given that climatic
shocks in Bangladesh are annual events in certain parts of the country, the results highlight the
need for weather-related insurance products to reduce ex ante risks for households. The vast
network of micro-finance institutions could provide a potential platform for the piloting of such
products. That said, given that there remains a large number of people living in extreme poverty
there is also a clear need for a public safety net system that can be scaled up to respond to shocks
affecting the poor.
14
References
Besley, T. 1995. “Nonmarket institutions for credit and risk sharing in low income countries.”
Journal of Economic Perspectives 9 (summer): 115-127
Del Ninno, C. and A. Marini. 2005. “Household‟s vulnerability to shocks in Zambia.” Social
Protection Discussion Series. Washington D.C.: World Bank,
Dercon, S. 1996. “Risk, crop choice and savings: Evidence from Tanzania.” Economic
Development and Cultural Change, 44(3): 385-415
Dercon, S. 2004. “Growth and shocks: Evidence from rural Ethiopia. Journal of Development
Economics 74(2):309-329
Dercon, S., J. Hoddinott and T. Woldehanna. 2005. “Vulnerability and Shocks in 15 Ethiopian
Villages, 1999-2004.” Mimeo
Foster, A. 1995. “Prices, Credit Markets and Child Growth in Low-Income Rural Areas”,
Economic Journal, 105 (430): 551-570
Heltberg, R. and N. Lund. 2010. “Shocks, Coping, and Outcomes for Pakistan's Poor: Health
Risks Predominate.” Journal of Developing Studies (forthcoming)
Jacoby, H. and E. Skoufias. 1997. “Risk, Financial Markets, and Human Capital in a Developing
Country”, Review of Economic Studies, 64 (3): 311-335
Jensen, R. 2000. “Agricultural Volatility and Investments in Children”, American Economic
Review 90 (2): 399-404
Morduch, J. 1990. “Risk, production and savings: Theory and evidence from Indian households.”
Department of Economics, Harvard University, Cambridge.
Morduch, J. 1998. “Doe Microfinance Really Help the Poor? New Evidence on Flagship
Prograsm in Bangladesh.” Working Paper.
Pitt, M. and S. Khandker. 1998. “The impact of group-based credit programs on poor households
in Bangladesh: Does the gender of participants matter?” Journal of Political Economy, 106(5):
Rosenzweig, M. 1988. “Risk, implicit contracts and the family in rural areas of low-income
countries.” Economic Journal, 98 (4): 1148-1170
Skoufias, E. and A. Quisimbing. 2003. “Consumption Insurance and vulnerability to poverty: A
synthesis of evidence from Bangladesh, Ethiopia, Mali, Mexico and Russia.” Food Consumption
and Nutrition Division Discussion Paper 155. Washington DC: International Food Policy
Research Institute
15
Quisimbing, A. 2007. “Poverty transitions, shocks, and consumption in rural Bangladesh:
Preliminary results from a longitudinal household survey.” Background Paper for Bangladesh
Poverty Assessment. Mimeo (draft). Washington D.C.: World Bank,
World Bank. 2008. “Poverty assessment for Bangladesh: Creating opportunities and bridging the
East-West divide.” Washington D.C.: World Bank,
Wood, G. and I. Sharif. 1998. “Who needs credit? Povery and finance in Bangladesh.” London:
Zed Books,.
Zaman, H. 1998. “Assessing the impact of micro-credit on poverty and vulnerability in
Bangladesh.” Policy Research Working Paper No. 2145. Washington D.C.: World Bank,
Zaman, H. 2006. “Microfinance in Banglades: growth, achievements and lessons.” In D.
Narayan and E. Glinskaya (eds.) Ending Poverty in South Asia: Ideas that work. Oxford
University Press.
16
Table 1: Allocation of PSUs to Strata
Division Rural Other Urban SMA
Dhaka 16 4 10
Chittagong 12 4 5
Rajshahi 17 4 2
Khulna 8 2 2
Sylhet 5 1 -
Barisal 5 2 -
Total 64 17 19
17
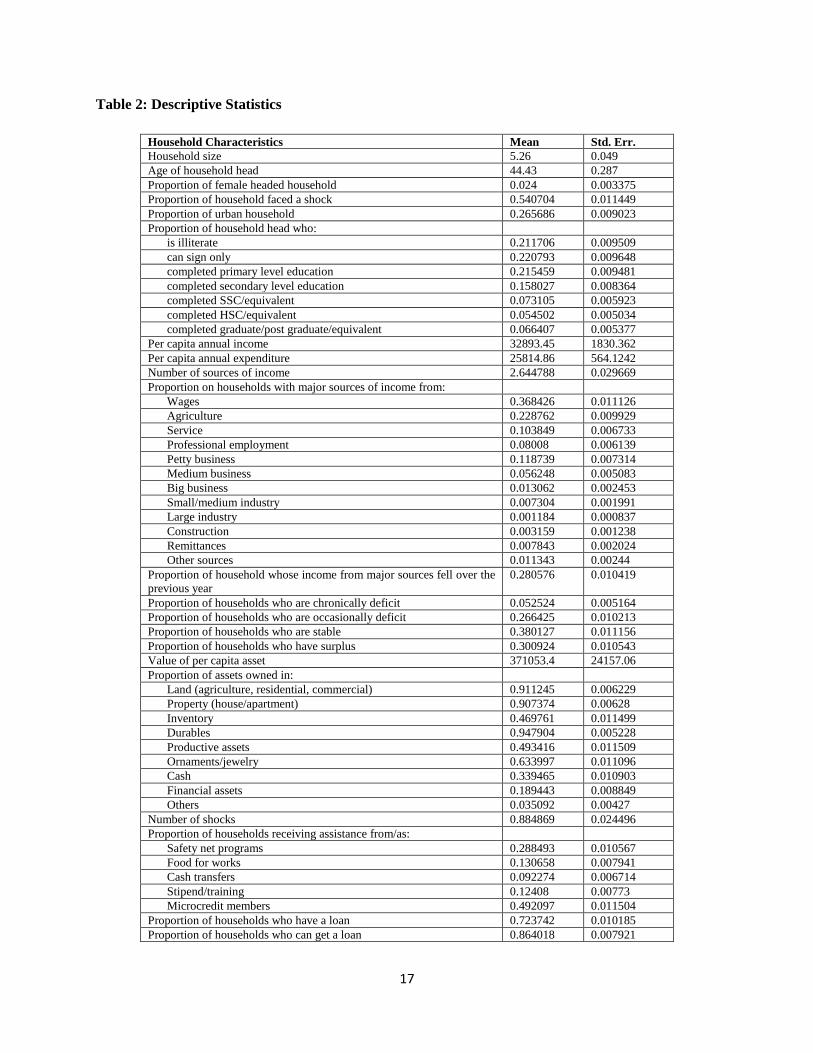
Table 2: Descriptive Statistics
Household Characteristics Mean Std. Err.
Household size 5.26 0.049
Age of household head 44.43 0.287
Proportion of female headed household 0.024 0.003375
Proportion of household faced a shock 0.540704 0.011449