120
Wells Fargo & Company Annual Report 2005 How Do We Picture the Next Stage of Success?

Wells Fargo & Company Annual Report 2005
How Do We Picture the Next Stage of Success?

3 To Our OwnersFor 20 years, Wells Fargo has achieveddouble-digit growth in almost everyeconomic environment. Chairman/CEODick Kovacevich explains how our team did it.
11 How Do We Picture the Next Stage of Success?We believe—and many industry observers agree—that we have thestrongest management team in allof financial services. Here’s how they picture success for their customers,their businesses and their teams.
24 Picturing the Next Stage of Success for Our CommunitiesWe’re one of corporate America’s top 10 givers—but it’s the time, talent and creativity of our team membervolunteers that really sets us apart.
31 Board of Directors, Senior Management
33 Financial Review
58 Controls, Procedures
60 Financial Statements
112 Report of Independent Registered Public Accounting Firm
116 Stockholder Information
Which Measures Really Matter? 2005 Update (inside back cover)
Wells Fargo & Company
Wells Fargo & Company (NYSE: WFC) is a diversified financial services companyproviding banking, insurance, investments,mortgage loans and consumer finance. Ourcorporate headquarters is in San Francisco,but we’re decentralized so all Wells Fargo“convenience points”—including stores,regional commercial banking centers,ATMs, Wells Fargo Phone BankSM centers,internet—are headquarters for satisfying all our customers’ financial needs and helping them succeed financially.
“Aaa”Wells Fargo Bank, N.A. is the only U.S. bank toreceive the highest possible credit rating fromMoody’s Investors Service.
Assets: $482 billion (5th among U.S. peers)
Market value of stock: $105 billion (4th among U.S. peers)
Fortune 500: Profit, 17th; Market Cap, 18th
Team members: 153,500 (one of U.S.’s 40 largest private employers)
Customers: 23+ million
Stores: 6,250
Reputation
Barron’sWorld’s most admired financial
services company
Business EthicsRanked top 10 corporate citizen
BusinessWeekAmong corporate America’s top 10
corporate givers
Fortune“Most Admired Megabank”52nd in revenue among all U.S.
companies in all industriesWorld’s 29th most profitable company
Mergent, Inc.“Dividend Achiever”*
Moody’s Investors ServiceOnly U.S. bank rated “Aaa,”
highest possible credit rating
Watchfire GomezPro#1 internet bank
Our Market Leadership
#1, 2 or 3 in deposit market share in 15 of our 23 banking states; #4 nationally (6/30/05)
#1 retail mortgage originator;#2 mortgage servicer
#2 in mortgages to low-to-moderate income home buyers
#1 home equity lender
#1 small business lender
#1 small business lender in low-to-moderateincome neighborhoods
#1 insurance broker owned by bankholding company (world’s 5th largestinsurance brokerage)
#1 agricultural lender
#1 financial services provider to middle-market businesses in our banking states
#2 debit card issuer
#2 bank auto lender
#3 ATM network
One of U.S.’s leading commercial real estate lenders
One of North America’s premier consumer finance companies
Our Earnings Diversity
Earnings based on historical averages and near future year expectations
Banking, insurance, investments,mortgage loans, and consumer finance—we span North America and beyond.
Community Banking . . . . . . . . . . . . . 34%
Home Mortgage/Home Equity . . . 20%
Investments & Insurance . . . . . . . . . 15%
Specialized Lending . . . . . . . . . . . . . . 15%
Wholesale Banking/Commercial Real Estate . . . 9%
Consumer Finance . . . . . . . . 7%
* Publicly traded companies that increased dividends for last 10+ consecutive years; Wells Fargo has increased dividends for 18 consecutive years, 23 increases since 1988.

Our vision—as it has been for 20 years—is to satisfy all our customers’financial needs andhelp them succeed financially. A vision by itself, however, is not enough.You must have aplan to achieve that vision and a time-tested business model that can perform successfullyin any economic cycle.You have to execute against that plan efficiently and effectively.In fact, it’s all about execution. To be successful, you need leaders who can establish,share and communicate that vision, motivate others to embrace, believe in and follow that vision, and execute in a superior fashion each day, every day, one customer at a time.
How Do We Picture the Next Stage of Success?

2
(l to r): Karen Johnson-Norman, Commercial Real EstateGroup, Washington, DC; Christian Chan, Wells Fargo Funds,San Francisco, California; Edgar Ramirez, Payment Operations,Irving,Texas; Dick Kovacevich, Chairman and CEO;Amy McSpadden, Wells Fargo Financial, Alpharetta, Georgia

3
This year’s outstanding results prove it once again.We havethe most talented, professional, caring, committed, ethical,“customer first”team in all of financial services. Guided by our vision, values, our time-tested business model, ourdiversity of businesses and our conservative risk management—all in place for 20 years—our team once again producedoutstanding, industry-leading results.That included double-digit growth in revenue and earnings per share—which weachieved not just this year, but also for the past 20, 15, 10 andfive years. Over all these periods, our total stockholder returnwas about double the S&P 500®. Amazing!
To Our Owners,
It’s all the more amazing because our team achieved these record results the past 20 years, while dealing with almost every economic cycle and every economic condition a financialinstitution can experience. High and low interest rates. Bubblesand recessions. All types of yield curves (steep, flat and inverted).High and low unemployment. No one can accurately predicthow the economy will perform in 2006 or in any year but forWells Fargo to achieve double-digit growth we must continue tofocus on our primary strategy, consistent for 20 years, which is to satisfy all our customers’ financial needs, help them succeedfinancially, and through cross-selling, gain wallet share and earn100 percent of their business.
Among our 2005 achievements:
• Revenue growth of 10 percent—double-digits once again—the most important measure of success in our industry—outpacing our single-digit expense growth.
• Diluted earnings per share—a record $4.50, up 10 percent—despite the $0.07 per share cost for increased bankruptcyfilings before the October change in federal bankruptcy laws.
• Net income—a record $7.7 billion, up 9 percent.
• Our stock price reached a record high close of $64.34 onNovember 25, 2005.

4
Our PerformanceDouble-digit growth: earnings per share, revenue, loans and retail core deposits
$ in millions, except per share amounts 2005 2004 Change
FOR THE YEAR
Net income $ 7,671 $ 7,014 9%
Diluted earnings per common share 4.50 4.09 10
Profitability ratios
Net income to average total assets (ROA) 1.72% 1.71% 1
Net income applicable to common stock to average common stockholders’ equity (ROE) 19.57 19.56 —
Efficiency ratio 1 57.7 58.5 (1)
Total revenue $ 32,949 $ 30,059 10
Dividends declared per common share 2.00 1.86 8
Average common shares outstanding 1,686.3 1,692.2 —
Diluted average common shares outstanding 1,705.5 1,713.4 —
Average loans $296,106 $269,570 10
Average assets 445,790 410,579 9
Average core deposits 2 242,754 223,359 9
Average retail core deposits 3 201,867 183,716 10
Net interest margin 4.86% 4.89% (1)
AT YEAR END
Securities available for sale $ 41,834 $ 33,717 24
Loans 310,837 287,586 8
Allowance for loan losses 3,871 3,762 3
Goodwill 10,787 10,681 1
Assets 481,741 427,849 13
Core deposits 2 253,341 229,703 10
Stockholders’ equity 40,660 37,866 7
Tier 1 capital 31,724 29,060 9
Total capital 44,687 41,706 7
Capital ratios
Stockholders’ equity to assets 8.44% 8.85% (5)
Risk-based capital
Tier 1 capital 8.26 8.41 (2)
Total capital 11.64 12.07 (4)
Tier 1 leverage 6.99 7.08 (1)
Book value per common share $ 24.25 $ 22.36 8
Team members (active, full-time equivalent) 153,500 145,500 5
1 The efficiency ratio is noninterest expense divided by total revenue (net interest income and noninterest income).2 Core deposits are noninterest-bearing deposits, interest-bearing checking, savings certificates and market rate and other savings.3 Retail core deposits are total core deposits excluding Wholesale Banking core deposits and retail mortgage escrow deposits.

5
• At year-end, the total value of our stock was $105 billion—again making us one of the nation’s 20 most valuable companies.
• Return on equity, 19.57 percent; return on assets, 1.72 percent.
• Our credit quality remained excellent. Nonperforming loanswere at or near historic lows.
• Fortune ranked Wells Fargo “Most Admired Megabank”;Barron’s ranked us the world’s most admired financial servicescompany and we continue to be the only U.S. bank with thehighest possible credit rating, “Aaa.”
• Community Banking achieved record profit of $5.53 billion,up 13 percent with revenue increasing nine percent.
• In consumer banking, we sold almost 16 million products (or “solutions”)—checking, savings, debit cards, loans, etc.—to our customers, up 15 percent.
• Our loans to small businesses, primarily less than $100,000,grew 18 percent. For the third consecutive year, we were thenation’s #1 small business lender in total dollars. In the past10 years, we’ve loaned more than $26 billion to smallbusinesses owned by African-Americans, Asian-Americans,Latinos and women, exceeding our publicly-stated goals.
• For the seventh consecutive year, our cross-sell reached recordhighs—4.8 products per retail banking household, 5.7 productsper Wholesale Banking customer. Our average middle-market,commercial banking customer now has almost 7.0 productswith us—up from almost five just two years ago. In fact, morethan one of every five of our commercial banking officesnationwide averaged eight products per customer.
• For the seventh consecutive year, Wholesale Banking achievedrecord net income of $1.73 billion—with double-digit loangrowth this year across its businesses.
• Our Wholesale Banking business now is truly coast-to-coast,with more than 600 offices nationwide. Across the EasternU.S., we have 175 offices for commercial banking, commercialreal estate, corporate banking, asset-based lending andequipment finance. We’re attracting new commercialcustomers in markets such as Atlanta, Boston, Cleveland,Hartford (Conn.), Indianapolis, New York and Tampa.
Our primary strategy, consistent for 20 years,is to satisfy all our customers’ financial needs,help them succeed financially, and throughcross-selling earn 100 percent of their business.
• We funded $366 billion in mortgages—our second highestannual total ever—and continued to be the nation’s #1 retailmortgage originator. Our owned mortgage servicing portfolio,the nation’s second largest, rose 23 percent to $989 billion. Thehousing market remained strong because new home constructioncontinued to lag the pace of new household formation.
• Our National Home Equity Group’s loans were $72 billion atyear-end with continued very strong credit quality—rankingus the nation’s #1 home equity lender for the fourth consec-utive year.
• Wells Fargo Financial—our consumer finance business—grew average receivables 25 percent.
• Watchfire GomezPro ranked Wells Fargo internet banking #1 among all U.S. banks. Global Finance magazine namedwellsfargo.com best in the U.S. in six categories including “best corporate/institutional internet bank.” Informationtechnology magazine CIO named Wells Fargo one of its 100 Bold winners for our innovative Commercial ElectronicOffice® (CEO®) portal, now used by almost three-fourths ofour commercial customers for everything from loan paymentsto foreign exchange.
Top 10 Consumer Internet Banks
1. Wells Fargo 6. First National Bank of Omaha2. Citibank 7. HSBC3. Bank of America 8. U.S. Bank4. E*Trade Bank 9. Chase5. Huntington 10. Wachovia
Source: Watchfire GomezPro, 3Q05
• To be the financial services company of choice for remittancecustomers, we expanded that service beyond Mexico, Indiaand the Philippines into El Salvador and Guatemala. Thenumber of accounts we opened for Mexican Nationals usingthe Matricula Consular card as a form of identificationsurpassed 600,000. We were the first financial institution in the nation to promote the use of this card as a form of

6
identification to help these customers move from the risky,cash economy to secure, reliable financial services.
• In Los Angeles and Orange counties, we launched a pilotprogram to offer mortgage loans to employed, taxpaying cus-tomers who have an individual taxpayer identification number(ITIN) issued by the IRS but do not have a Social Securitynumber.1 If successful, we hope to roll this mortgage productout across all 23 of our community banking states.
• We increased the Company’s quarterly dividend more than 8 percent to 52 cents a share, the 18th consecutive year we’veincreased our dividend, our 23rd dividend increase since 1988.We’re the nation’s 13th largest dividend payer and one of lessthan 3 percent of more than 10,000 North American-listed,dividend-paying common stocks classified as a “DividendAchiever”—a publicly-traded company that has increased itsdividends for the last 10 or more consecutive years.2 If youhad invested $10,000 in 1986 in our predecessor company,Norwest Corporation, it would have been worth $435,000 at year-end 2005 with dividends reinvested.
• Our total managed and administered assets rose 6 percent to $880 billion. The new Wells Fargo Advantage FundsSM—the result of the merger of Wells Fargo Funds® and StrongFunds®—is the nation’s 18th-largest mutual fund company,managing $108 billion in assets, with 120 funds spanningalmost all asset classes and investment styles.
• We announced a 10-point commitment to integrateenvironmental responsibility into our business practices. This includes a pledge to provide more than $1 billion in thenext five years, in lending, investments and other financialcommitments to environmentally-beneficial business oppor-tunities including sustainable forestry, renewable energy,water-resource management, waste management, “greenhome” construction and development, and energy efficiency.
1 Qualified individuals must have been customers of Wells Fargo Bank for six months, paid U.S. taxes for two years, must be able to prove two years of California residence.
2 Mergent, Inc.
Double-Digit Annual CompoundGrowth – for 20 Years
Total Stockholder ReturnYears EPS Revenue Wells Fargo S&P 500®
5 14% 10% 5% 0.5%10 11 13 17 915 12 12 21 1120 14 12 21 12
Impressive results, indeed. We’re very proud of them. But, believeit or not, we can do even better. In recent annual reports, we toldyou that we’ve not been growing our business banking andinvestment businesses at a rate consistent with their potential. I’m pleased to report we’re making significant progress.
Business BankingJust two years ago, our average Business Banking customer—businesses with annual revenue up to $20 million—had onlyabout 2.7 products with us—dead last in cross-sell among all our businesses. Also, less than one of every four of our BusinessBanking customers did their personal banking with Wells Fargo.Less than one of every 10 gave us their investment business. Two years ago we said that by 2008 we wanted to double rev-enue and cross-sell and dramatically increase our market sharefor both deposits and loans from our small business customers.I’m pleased to report that our Business Banking cross-sell grew11 percent for the year. Our Business Banking team surpassed an average of 3.0 products (or “solutions”) per customer. The number of business customers actively using online bankinggrew 24 percent. Our Business Banking deposits—which grew10 percent in 2004—rose another 9 percent in 2005. Duringthose same years our loans and lines of credit—primarily lessthan $100,000, sold to our small business customers through our banking stores, online, direct mail, teleconsulting and in-bound calls—rose 17 percent and 18 percent, respectively.
Our business customers are buying their financial productsfrom someone. Since we believe we can offer them a superiorvalue, there’s no reason we shouldn’t earn all their financialservices business—business, personal and investments. In 2004Wells Fargo was #1 for the third year in a row in loans under$100,000 to small businesses, with 15 percent market sharenationally. We also were the #1 lender to small businesses in low-to-moderate income neighborhoods, with almost 16 percentmarket share, nationwide.

7
commission discounts with a linked WellsTrade® account. In just five months, balances across all our deposit and brokerageaccounts increased over $4 billion.
Our Investment Management and Trust businesses are growing,too. In addition to more basic wealth planning services—such astrust and estate services —we’ve added alternative asset classesand we’re offering “best of class” outside money managers forour high net worth clients. They, in turn, have given us more of their business. As a result, we’ve achieved five consecutivequarters of record sales, a 40 percent increase in revenue yearover year from wealth planning and insurance.
Good progress but, here again, we can and must do better,faster. Our market share of our customers’ investment businessshould be two to three times higher than it is. There’s no reasonwhy we can’t attract many more new customers. More of ourPrivate Banking and Personal Trust customers should want to giveus their investment management and brokerage business. We alsoshould be satisfying more of the investment needs of our smallbusiness customers and the executives of our middle-market, realestate, and large corporate customers. We should be their firstchoice for personal investment and banking business.
Preparing for more growthWe continue to invest in new stores and operation centers to help satisfy all our customers’ financial needs. During 2005, we opened 92 banking stores, remodeled another 485 bankingstores to improve customer service, and opened 47 mortgagestores, 20 consumer finance stores, seven regional commercialbanking offices and two commercial real estate offices. We alsocompleted four major operations facilities (and are about tocomplete a fifth):
• West Des Moines, Iowa Our mortgage and consumer creditgroup opened a 281,000 square foot center for about 1,500team members. Two more buildings are scheduled to open in mid-2006 and in 2007—for a total of almost one millionsquare feet—on a 160-acre campus, large enough to accom-modate even more expansion.
Top 10 U.S. Full-Service Online Brokers1. Smith Barney 6. Piper Jaffray2. Wells Fargo 7. DB Alex Brown3. UBS 8. A.G. Edwards4. Wachovia 9. McDonald Investments5. Merrill Lynch 10. Edward Jones
Source: Watchfire GomezPro 10/31/05
Private Client ServicesOur private banking and investment business—Private ClientServices—also is growing. It ended 2005 with double-digitrevenue growth in the fourth quarter. We built the foundation forthis growth by integrating all banking, investment and insuranceservices to serve all of our clients’ wealth management needs.We’ve significantly increased the number of investmentprofessionals serving clients. We now have more than 700 privatebankers in our banking stores and wealth management offices, up 150 percent the past two years—and 2,500 licensed bankersand financial consultants, up more than 85 percent in three years.In 2005, we were the first in our industry to announce low- andno-cost online stock and mutual fund trades to benefit our mostloyal customers. Watchfire GomezPro ranked us the nation’ssecond best, full-service on-line brokerage.
As a result, we’re earning more of our clients’ business. Ourloans to Private Banking customers grew 15 to 20 percent each of the last five years. The last two years, deposits rose 38 percent,and brokerage assets 14 percent. More than one million of ourcustomers now have a Wells Fargo Portfolio ManagementAccount®, or PMA® account—which combines all a customer’srelationships with Wells Fargo, including checking, savings,mortgage, personal loans, trust and brokerage. This relationshipproduct offers rewards, discounts, competitive money marketrates, bonus interest rates on linked savings accounts and CDs,no monthly service fees on linked accounts, a Wells Fargo Visa®
Credit Card with waived fee for the Retention Rewards® program,no annual fees on select line of credit accounts, free checks, and
Wells Fargo has achieved double-digit,annual compound growth in revenue andearnings per share, with total stockholderreturn about double the S&P 500 for thepast five, 10, 15 and 20 years.

8
• Des Moines, Iowa Later in 2006 Wells Fargo Financial isscheduled to complete a 360,000 square foot, nine-storybuilding for 1,500 team members, connected via skyway to its downtown headquarters;
• Minneapolis, Minnesota A $175 million conversion andexpansion of the former Honeywell Campus near downtownMinneapolis. It consolidates a dozen Twin Cities areamortgage operations centers and is expected to accommodateabout 4,600 team members by year-end 2006;
• Shoreview, Minnesota A new 160,000 square foot data center in a northern Twin Cities suburb;
• Chandler, Arizona A new operations, technology and call center campus near Phoenix has two, 200,000 squarefoot, four-story buildings, now home to about 2,100 team members in operations and technology. This site is largeenough to accommodate four more buildings totaling 800,000 square feet.
The quality of our leadershipOur vision—as it has been for 20 years—is to satisfy all ourcustomers’ financial needs and help them succeed financially. A vision by itself, however, is not enough. You must have a planto achieve that vision and a time-tested business model that canperform successfully in any economic cycle. You have to executeagainst that plan efficiently and effectively. In fact, it’s all aboutexecution. To be successful, you need leaders who can establish,share and communicate the vision, motivate others to embrace,believe in and follow that vision, and execute in a superiorfashion each day, every day, one customer at a time.
At Wells Fargo, we’re fortunate to have what I believe—and many industry observers agree—is the best team of seniorleaders in the entire financial services and banking industry.They’re the CEOs of our diverse businesses—spanning virtuallyevery segment of our industry. They’re responsible. They’reaccountable. They and their teams have produced outstandingresults you’ve come to expect from Wells Fargo year after yearafter year. They partner together unselfishly. Each and every oneis a great coach. They realize, as every great coach does, that
“At Wells Fargo, we’re fortunate to have what I believe—and many industry observersagree—is the best team of senior leaders inthe entire financial services and bankingindustry.They lead with integrity.They knowhow to build high-performing teams.They all own the customer experience—together.”
success is not about their own self-interest. It’s about what’s best for their teams, their customers and their partners in otherWells Fargo businesses. They give their teams the tools, trainingand resources they need to achieve our goal of industry-leading,double-digit growth in revenue, profit and earnings per share.They help create our vision and values. They help us achieve ourvision every day with every customer. They cause our success tohappen. They drive our business results. They influence, directand inspire their teams. They make sure our 153,000 teammembers understand, support and live that vision and thosevalues. They’re role models for leadership. They lead withintegrity. When they make a mistake, they accept responsibilityand learn from it. They’re big picture thinkers with a broadperspective—company-wide and industry-wide. They’re open to new ideas, know how to learn and they learn from each otherand share best practices. They’re mentors for emerging, diversemanagement talent across the company. They’re collaborators.They know how to build high-performing teams. They and theirteams have fun together. They thrive on change. They care abouttheir people. They value diversity. They all own the customerexperience—together.
They’re not just good leaders, they’re great leaders. What’s the difference? A good leader inspires a team to have confidencein her or him. A great leader inspires a team to have confidence in themselves. They teach and coach others to lead. Most of all,they believe in our most important value: people as a competitiveadvantage. They make every business decision with that value in mind. They know that somewhere on their teams is the answerto every problem, challenge and opportunity. Their job is to find the people on their teams who have the answers, regardlessof rank or stripes, and help translate those answers into action.The people with the answers most often are those closest to our customers.
How do we picture the next stage of success?Therefore, in our report to you this year, we want you to get toknow this great team of senior business leaders better. We wantyou to fully appreciate, as I do, their outstanding talent, skill,experience, integrity, ethics, innovation, insight and caring—

9
and how they picture success for their businesses in the comingyears. Beginning on page 11, our leaders describe their vision of success for their businesses, how they and their talented teamsintend to partner to grow market share and wallet share, andearn all of our customers’ business. I’m very fortunate to beplaying with the best team in financial services. I’m very proud to share their stories with you in this report.
The National Bank Act—the law of the landMobility is a way of life for most of our more than 23 millioncustomers. They commute, do business, relocate, travel andvacation, often coast to coast. Many have a second home indifferent states. They buy goods and services globally. When itcomes to commerce, state boundaries are meaningless for them.They assume that anywhere they go in the United States (or theworld) they can access their money, make financial transactionsand get information about their accounts through their nationalbank governed by uniform, consistent federal oversight. Thanksto this national oversight, they can receive credit decisions almostinstantly, a mortgage in just a few days.
They take this national freedom of financial access forgranted. But it’s not a birthright. It’s the result of a series of lawsand court decisions going back almost a century and a half. The most important of those laws, by far, is the National BankAct of 1864. This visionary law—enacted just 12 years after ourcompany was founded—brought economic order out of a costly,chaotic patchwork of state laws. It created uniform nationalstandards for safety and soundness governing an association ofnational banks with national charters. When the telegraph wasthe internet of its day, this law encouraged the free flow of capitaland labor across state lines in an increasingly mobile society. Itcreated the federal Office of the Comptroller of the Currency and gave it exclusive powers to examine national banks such astoday’s Wells Fargo Bank, N.A. States could still regulate statebanks. The federal government would regulate national banks.
Unfortunately, the last few years several states have tried toturn back the clock and challenge the authority of the Comptrollerto set uniform federal law for national banking and to supervise,exclusively, national banks and their operating subsidiaries.
One Nation. One Economy.Consistent National Standards.
Here are just six recent rulings that each upheld the principle that
the National Bank Act preempts state attempts to regulate national
banks—whether a state does this by restricting their banking
activities or through regulatory supervision:
January 2006 The U.S. Supreme Court, in an 8-0 ruling, holds that relevantfederal banking laws do not deny national banks the right to have casesheard in federal court merely because the bank does business in a partic-ular state. Justice Ruth Bader Ginsburg wrote in the ruling that a lower courtruling was wrong because national banks would be “singularly disfavored”in their access to federal courts.
October 2005 Federal District Court rules in favor of a financial servicestrade association. It blocks the New York Attorney General’s Office fromdemanding information from national banks and investigating their lendingpractices.The Court rules that the National Bank Act preempts stateinvestigations of this type over a national bank such as Wells Fargo Bank,N.A.,leaving such oversight to national regulators such as the Office of theComptroller of the Currency and the Federal Reserve Board.
August 2005 Federal Ninth Circuit Court of Appeals rules in favor of Wells Fargo. It holds that the National Bank Act preempts state licensingrequirements and state supervisory authority over national bank subsidiaries.The California Department of Corporations had tried to exercise authorityover Wells Fargo Home Mortgage, Inc., part of Wells Fargo Bank, N.A.
July 2005 A Federal Circuit Court of Appeals holds that the National BankAct preempts state regulation of a national bank’s operating subsidiary.The case arose when a national bank and its mortgage subsidiary sued the State of Connecticut to avoid having to obtain a state license andfollow certain state laws.
February 2003 Federal Fifth Circuit Court of Appeals rules in favor of Wells Fargo and other national banks. It holds that the National Bank Actpreempts state laws that ban certain check-cashing fees to non-customers.
October 2002 Federal Ninth Circuit Court of Appeals rules in favor of Wells Fargo and other national banks. It holds that the National Bank Actpreempts local ordinances that try to stop national banks from chargingnon-customers a convenience fee for using their ATMs. San Francisco and Santa Monica had ordinances to prohibit these fees.

1 0
Fortunately for our customers, every single one of these misguidedattempts has failed. When states and local governments announcethese lawsuits, they often attract significant media coverage. But when they’re adjudicated in the courts—which haveconsistently ruled in favor of national banks on these issues—the stories are buried or not reported at all.
2006: The EconomyThis coming year will be challenging for the banking industry.Asset yields do not seem to account for risk. Credit quality can’t get much better. The yield curve—the difference betweenshort-term and long-term interest rates—is likely to be flat, eveninverted. Banking competitors are, once again, relaxing loanterms while not fully pricing for this risk. However, Wells Fargo’sbusiness model, now in place for nearly 20 years, focuses onselling more products to existing customers and, therefore,gaining both market share and wallet share. Perhaps that’s whyWells Fargo produced consistent double-digit increases in bothrevenue and earnings per share over the past 20, 15, 10 and five years, which included almost every economic condition a financial institution can face, not unlike those that may exist in 2006.
The Next StageOnce again, we thank our 153,000 talented team members for their outstanding accomplishments and record results not just for this year but for the past 20 years. We thank ourcustomers for entrusting us with more of their business and forreturning to us for their next financial services product. We thankour communities—thousands of them across North America—that we partner with to make them better places to live andwork. And we thank you, our owners, for your confidence inWells Fargo as we begin our 155th year (March 1852).
A special thank youTwo members of our Board will retire this April after a total ofthree decades of service to our company.
Dr. Reatha Clark King, retired presidentand board chair of the General MillsFoundation, Minneapolis, Minnesota,joined the Board 20 years ago when theformer Norwest Corporation had assets of just over $21billion. Most recently sheserved on the audit and examination, andthe finance committees.
Gus Blanchard, chairman of ADCTelecommunications, Inc., Eden Prairie,Minnesota, joined our Board 10 years ago, when we had assets of just over$80 billion. Most recently, he served on the audit and examination, credit, andgovernance and nominating committees.
Their wise counsel and thoughtful guidance has helped ourcompany achieve remarkable growth during their tenures whilewe built a reputation as one of the world’s most admired financialservices companies. Thank you, Reatha and Gus!
The “Next Stage” of success is just down the road—for our teammembers, our customers, our communities and our stockholders.It’s going to be a great ride!
Richard M. Kovacevich, Chairman and CEO

1 1
How Do We Picture the Next Stage of Success?Each of our senior leaders has a vision for thefuture success of their businesses—how theyand their talented teams intend to partner togrow market share and earn all of their customers’business.As you can see on the following pages,they’re unanimous on one key point—people as a competitive advantage.
(l to r): Howard Atkins, Senior EVP, ChiefFinancial Officer; Dave Hoyt, Senior EVP,Wholesale Banking; John Stumpf, Presidentand Chief Operating Officer; Mark Oman,Senior EVP, Home and Consumer Finance

1 2
“The way our team partners together, cares about each other, caresabout customers and solves their financial needs is rare in anycompany. ‘Culture’makes it happen. It’s instinctive. It’s knowing theright thing to do without having to be told. Financial services is verycomplex. Our company has more than 80 businesses, so winning all our customers’business is a team sport.The star of our team…is the team!
We’re a circle not a hierarchy. At the center of the circle—ourcustomers. Alongside them—our customer-contact team members.Farther out in the circle are our managers. At the outside of the circleare senior managers like me. All of us partner together to do thebest job we can for our customers.
If we grow the top line—revenue—the bottom line takes care of itself.We’re not just expanding our franchise, we’re expanding ourthinking.We’re not just adding new stores, we’re adding more teammembers to serve and sell our customers and offer them the bestsolutions. Our success is the result of habits and focused execution,not random acts. Our people are our competitive advantage. Ourproduct is service. Our value-added is advice. Our customers cometo us because of what we know, so they can learn how to save timeand money. If we think like a customer and focus our team onserving customers, then everyone benefits.”
John Stumpf, President and Chief Operating Officer Years in financial services: 30
Star of Our Team: The Team!
(l to r): Patti Hoversen,TechnologyInformation Group, Minneapolis,Minnesota; Lori LoCascio, Wells FargoPhone Bank, Lubbock,Texas;John Stumpf

1 3
“Our picture of success begins with talented people. Our customersthink of them first when they think of Wells Fargo. Diverse, seasonedleaders who make decisions locally, close to the customer. Ourrelationship managers make sure we completely understand thecustomer’s needs before we offer any products to satisfy theirfinancial needs.The scope of our group is amazing—55 nationalbusinesses, coast to coast, revenue the equal of a Fortune 350company, as impressive an array of products and services as you’llfind anywhere.
We know how to serve and sell—we lead the company inproducts per customer. For example, we deliver credit productsmany different ways—a straight commercial loan, an asset-basedloan, a commercial mortgage loan, a franchisee loan, a loan forequipment-finance or equipment-leasing, or a private placement or a syndicated credit. Almost three of every four of our customersnow use our internet portal—Commercial Electronic Office—to run their business more efficiently. It continues to be the best in the industry. Customers sign on just once to access more than 40 products. Our new Desktop DepositSM service lets customers make deposits electronically from their own office, no more hauling paper to our banking stores.“
Dave Hoyt, Senior EVP, Wholesale Banking Years in financial services: 28
Knowing How to Serve and Sell
Team members: 15,000Customers: 78,000Locations: 600Products per customer: 5.7
(l to r): Dave Hoyt; Patti Rosenthal,Wholesale Services, San Francisco,California; Ray Orquiola, WholesaleUniversity, San Francisco, California

1 4
“Our team serves virtually all the credit needs of individualcustomers—mortgage loans, home equity loans, personal credit,and consumer finance. So, success for us is satisfying all these needssmoothly for our customers whether it’s through our stores, on thephone or via the internet.We span all 50 states, Canada and parts ofthe Caribbean, and we’re #1 nationally in many products, but ourmarket share is still relatively small.That gives us lots of opportunityfor future growth.
A mortgage is the largest, most complex financial transactionmost of our customers ever make. It’s also a core product—customers value it so much they’re more likely to give us even more of their financial services business—not just home equityloans and banking products but their investments and insurance.
We’ve proven this works: cross-sell among our mortgage customershas grown about 30 percent a year for the last several years. Ourmortgage business is the Company’s second largest source ofchecking accounts and new credit card customers. Our groupaccounts for almost two of every three of Wells Fargo’s newcustomers.We’ll be even more successful when we can earn more business from our consumer finance customers.
We service the mortgage and home equity loans of more thanfive million households.That’s a monthly relationship that positionsus to be there when they need their next financial product.We alsohave to be best at managing risk.We can’t avoid all risk and stillmake a profit. It’s how well we manage interest-rate risk, credit risk,operations risk and compliance risk that makes the difference.”
Mark Oman, Senior EVP, Home and Consumer Finance Years in financial services: 26
Turning Vision into Reality
Team members: 52,000Customers: 12.3 millionStores: 2,388
(l to r): Mark Oman; Phil Hall,Home and Consumer Finance,Des Moines, Iowa; Michael Levine,Wells Fargo Home Mortgage,Minneapolis, Minnesota

1 5
“Our financial success begins with our time-tested business model.More than 80 businesses.We cover virtually every facet of financialservices.This diversity gives us 80 different ways to grow, helps usmanage the risk of unforeseen changes in the economy or financialmarkets, and helps us earn more business from our customerswherever they are in their financial life cycle. Success for us alsomeans excelling at managing risk in asset quality, interest rates,accounting and operations, and capital.
Our credit ratings are very high. Our approach to risk has alwaysbeen very disciplined.We don’t take unacceptable risks even if some competitors are willing to do so.We’re consistent—with ourcustomers and with Wall Street. As good as our business model andtrack record is, however, our strong and consistent financial resultscannot happen without…great people! I believe we have the bestin the industry.”
Howard Atkins, Senior EVP, Chief Financial Officer Years in financial services: 31
Consistency
Team members: 1,200Finance, Corporate Development,Investor Relations,Treasury,Corporate Properties, InvestmentPortfolio, Controllers
(l to r): Howard Atkins; Nancy Lee,Investor Relations, San Francisco,California; Cindy Garcia, CorporateProperties, Phoenix, Arizona

1 6
Carrie Tolstedt, Regional BankingYears in financial services: 20
Energized, Diverse, Caring
Clyde Ostler, Private Client Services (PCS), Internet Services Years in financial services: 35
Great Service Every Time
Team members: 51,000Households: 10.3 millionStores: 3,120 (92 opened in ’05)Products per customer: 4.8
(l to r): Carrie Tolstedt; Joey Davis,Regional Banking, Omaha,Nebraska; Laurie Doretti, RegionalBanking, Scottsdale, Arizona
Team members: 8,000PCS clients: 820,000Active online consumers: 7.1 million#1 consumer internet bank
(l to r): Katie Kellen, PCS,Denver, Colorado; Clyde Ostler;Lisa Robinson, Internet Services,San Francisco, California
“Our success begins with our great team.When our diverse andcaring team is doing what they do best, they connect with ourcustomers to create a special relationship that lasts a lifetime. Ourengaged team is the link between our vision and the customerexperience. Supported by talented leaders in our local markets,our team responds quickly to their customers, on the spot, doingwhat’s right for them.They know their stores, their customers andcommunities better than anyone.
We develop tools centrally to support our team—training,measurement, marketing, reporting, products and systems.We wantto earn 100 percent of our customers’business by partnering withother teams, such as Home Mortgage, Private Client Services andWells Fargo Financial. Our customers are at the center of everythingwe do. Our team is our competitive advantage.”
“Our picture of success for Private Client Services is very simple—exceptional service for each client every time.We start with theclient’s aspirations, goals, and the legacy they want to leave for futuregenerations. Our value-added is our financial advice.
Our team of professionals should understand our clients’financialneeds so well—and deliver such great service—that they will wantto bring all their business to Wells Fargo. Partnering with our bankingstore teams, we provide investment and insurance services byputting our customers’needs first, and giving them great, individualservice and advice that distinguishes us from our competitors.
We’re rated America’s best internet bank, but we measureinternet success by what our customers tell us—and they tell usthey appreciate the convenience and benefits of wellsfargo.com by giving us more of their business.”

1 7
“We’re a diverse group of businesses that share one vision for success—to help our team members and customers achieve their goals.
For team members, this means knowing how their workconnects to the Wells Fargo vision, knowing they have the tools,work environment and partnering spirit to go as far as their talentand skill can take them. For customers, it means helping themachieve financial success.
Having the right products and services is important, but to satisfy all our customers’financial needs we have to buildrelationships with them, as trusted advisors, so they’ll want to give us all their business.”
Mike James, Diversified Products Years in financial services: 33
Trusted Advisors“To succeed as an insurance provider we must be consistentlysuperior in helping customers identify their specific risks,understand their insurance choices, select cost-effective protection,and be comfortable with their choice. Success in all of these helpsthem, and us, be financially successful.
Like checking, investments and a mortgage, insurance is a coreWells Fargo product: when customers buy it from us they’re morelikely to buy more products from us.That’s why we’re a full-serviceprovider of insurance solutions through our insurance agencies,banking stores, phone, mail and internet.
We’re the world’s fifth largest insurance brokerage company,and America’s largest crop insurance provider—but we haveunlimited potential for growth and more success. Only four percent of our banking customers buy their insurance through us!”
Pete Wissinger, InsuranceYears in financial services: 30
Insurance: Core Product
Team members: 5,000#1 U.S. small business lender#2 U.S. debit card issuerStudent loan customers: 1 million
(l to r): Ciony Catangui, EducationFinance Services, Sioux Falls,South Dakota; Danny Ayala, GlobalRemittances, Concord, California;Mike James
Team members: 2,000Customers: 300,000World’s 5th largest insurance broker#1 U.S. crop insurer#1 bank-owned insurance agency
(l to r): Pete Wissinger; John Tebbs,Rural Community Insurance Services,Winchester, Kentucky; Paul Gauro,Wells Fargo Insurance, Minneapolis,Minnesota

1 8
“Our business is all about relationships. If we earn our customers’trustthen they’ll rely on us as their financial institution and we can earn alltheir business.We offer valued advice to deepen every relationship, tohelp every customer be financially successful. Relationship managersare key in building successful partnerships. Our talented team ofbankers is trained and equipped with extensive product knowledge.
We know our customers well.We listen and respond bycustomizing specific solutions tailored to each customer’s financialneeds.We anticipate challenges and design solutions they may nothave even thought about.The more they value our relationship, themore resources we can provide them—credit for their operations,a term loan for capital expenditures or acquisitions, investmentalternatives, insurance solutions, or treasury management.When our customers succeed, we succeed.”
Iris Chan, Commercial BankingYears in financial services: 30
Growing with Customers“We’re a diverse, complex group—22 businesses and 150 locationsnationwide. Our team members do everything from making loansand leases to investing in securities and providing capital marketsadvice.Our customers range from tribal governments and local schooldistricts to real estate developers and Fortune 1000 companies.
Our picture of success: understand our customers’businessesbetter than anyone else and offer them great ideas and sophisticatedsolutions so they can be more successful.We ring the bell when wehelp create value for them.”
Tim Sloan, Specialized Financial Services Years in financial services: 21
Ringing the Bell
Team members: 1,100Customers: 8,200#1 financial services provider to middle-market companies inwestern U.S.
(l to r): Richard Gan, CommercialBanking, Austin,Texas; Iris Chan;Gary Dyshaw, Commercial Banking,St. Paul, Minnesota
Team members: 1,800Customers: 33,000Assets: $30 billion
(l to r): Alex Idichandy, CorporateBanking, Atlanta, Georgia;Kristine Netjes, Media Finance,Minneapolis, Minnesota;Tim Sloan

1 9
“Success happens when we deliver terrific results for our clients and help them meet their investment goals.When we do that, theyentrust us with even more of their money.The more high qualityinvestment choices we offer—such as more funds that carry 4-staror 5-star ratings from Morningstar and those top-ranked by Lipper—the more successful we are.
For us,great service is a given.Successful investment managementis the result of our talented team delivering superior performance.”
Mike Niedermeyer, Asset Management Years in financial services: 22
Results“In our group, definitions of success are as varied as the wide range of business customers we serve.They look to us to give them alternatives to cash flow loans that help them achieve theirobjectives, and the financial flexibility they need to move from one phase to the next in the life cycle of their business.
Success for us is providing this flexibility but balancing thecommon sense of a lender with the innovative spirit of anentrepreneur.”
Peter Schwab, Asset-Based LendingYears in financial services: 30
Staying Flexible
Team members: 3,300Customers: 32,000Assets managed: $219 billion17th largest U.S. mutual fundcompany
(l to r): Mike Niedermeyer;Tom Hooley, Institutional Trust,Minneapolis, Minnesota; JamesAlexander, Institutional Brokerageand Sales, Chicago, Illinois
Team members: 1,100Customers: 1,200Among top U.S. asset-based lenders
(l to r): Peter Schwab; Eileen Quinn, Wells Fargo Foothill, Boston,Massachusetts; Paz Hernandez,Wells Fargo Foothill, Los Angeles,California

2 0
“Success means helping our domestic customers succeed whereverthey do business in the world—to grow their earnings, seize globalopportunities, and be their one-stop shop through our internetportal, Commercial Electronic Office.
We can open bank accounts for them in 66 countries, facilitatetrade in 80 countries, and help reduce currency risk, paymentprocessing risk, regulatory risk, and cultural risk.We succeed when We Make the Complex Simple®!”
Dave Zuercher, International, Correspondent Banking, Insurance Years in financial services: 36
Making the Complex Simple“For our team—even before real estate and credit—people comefirst.That’s what creates success for our customers, our communities,Wells Fargo and our stockholders.
We work with our partners across Wells Fargo to develop creativefinancial solutions—such as flexible acquisition, re-hab andconstruction loans—to help our customers build communities thatprovide people with housing, offices, factories, warehouses, schools,stores, shopping, recreation, lodging and jobs.”
Larry Chapman, Real Estate Years in financial services: 32
People First
Team members: 5,000Customers: 2,300Includes Foreign Exchange,TreasuryManagement,Wells Fargo HSBC Trade Bank
(l to r): Lillie Axelrod, Acordia,Atlanta,Georgia; Dave Zuercher;Sara Wardell-Smith,International Group,San Francisco, California
Team members: 360Customers: 485One of U.S.’s leading lenders to developers and investors
(l to r): Larry Chapman;Debora Welsh, Real Estate, Atlanta,Georgia; Juan Carlos Wallace,Real Estate, San Francisco, California

2 1
“Our mission is homeownership. Our team members believepassionately in that mission.They live it every day.They believe andknow that homeownership provides a rich, stable foundation uponwhich to achieve personal and financial success. It’s the primarysource of financial net worth for most American households.Theyknow that working together, we can help people reach theirpersonal and financial goals—through homeownership.
We’re privileged to work in a business that helps people buildwealth and provide a safe, secure environment for their families.Businesses measure success with numbers and so do we—but ourmost important measure is how we feel every time we know we’vehelped someone achieve the dream of homeownership.That’s howwe picture success. It comes from the home and from the heart.”
Cara Heiden and Mike Heid, Mortgage Years in financial services: 25 and 26
Home and Heart
Team members: 28,000Customers: 5.7 million#1 U.S. retail mortgage originator #2 U.S. mortgage servicer
(l to r): Christiaan Lidstrom, Wells FargoHome Mortgage, Des Moines, Iowa;Cara Heiden; Patrick Carey, Wells FargoHome Mortgage, Fort Mill, SouthCarolina; Mike Heid

2 2
“Our success starts with attracting, keeping and growing the best team of professionals in financial services.We’ve built a high-performing business model based on many partnerships.This allowsus to deliver our products and services through our banking stores,mortgage stores,Wells Fargo Financial, wellsfargo.com, direct mail,telesales, Wells Fargo Phone Bank centers,brokers and correspondents.
We listen to and educate customers.We guide them to the home equity and personal credit solutions that help them succeedfinancially with smart management of their home asset andpersonal credit. Our innovative products and solutions sustain ourlead in market share and earning more business from loyalcustomers helps grow it.”
Doreen Woo Ho, Consumer Credit, Corporate Trust Years in financial services: 32
Right Solutions“Our business model has changed profoundly the last few years.So hasour picture of success.We’ve moved from offering small, unsecuredloans to larger, secured loans, auto loans and first mortgage products—and we’ve expanded credit card offerings to our best customers.
To be more efficient and give our customers faster service, we’vefreed up our store team members to spend most of their timeserving and selling to customers—we now score all our loanselectronically and collect all payments centrally. Our goal: commonwhere possible, custom where it counts.
These fundamental changes in our business model have drivenunprecedented growth for Wells Fargo Financial—19 percent annualcompound growth in receivables for the last six years—but they’vealso reduced our cost per loan which helps us lower interest ratesfor customers.”
Tom Shippee, Wells Fargo Financial Years in financial services: 32
Serving and Selling
Team members: 21,000Customers: 6.7 millionStores: 1,307One of North America’s premierconsumer finance companies
(l to r): Stephanie D’Itri, Wells FargoFinancial Canada Corporation,Mississauga, Ontario; Susan Hack,Auto Finance, Chester,Pennsylvania; Tom Shippee
Team members: 6,000Households: 2.4 million#1 home equity lender, personalcredit provider in U.S.
(l to r): Doreen Woo Ho; Jody Bhagat,Consumer Credit, San Francisco,California; Tracy Schaefbauer,Home and Consumer Finance,Minneapolis, Minnesota

2 3
“We’ve partnered with entrepreneurs for 45 years to build greattechnology businesses.We pride ourselves on doing whatever it takes to help them build leading companies—facilitatingcustomer and partner relationships for these companies, helpingentrepreneurs evolve their business strategies, or working withCEOs to drive their recruiting processes. If our portfolio companiesare successful, then we’re successful.What characterizes thissuccess? Extreme dedication to these entrepreneurs. Deepoperating experience. High integrity. And, a strong network ofdomestic and international relationships.”
John Lindahl, Norwest Equity Partners Years in financial services: 39
Resourceful, Approachable“Our success is built on strong partnerships. Strong partnerships with our portfolio companies. Strong partnerships with experiencedmanagement teams to acquire leading middle-market companies.To these relationships our investment professionals bring significantresources to help management grow their business—includingadequate capital to grow organically and by acquisition.We cansupplement the company’s management team, provide operatingexpertise, and, when we exit the investment, guidance to maximizeshareholder value. Our success, built on our 45-year history, requiresskill, ability and integrity — the skill to recognize great companies,the ability to offer valuable expertise, the integrity to be resourceful,resilient and reliable partners.We succeed when, during our time asowners, the investors and our management partners create an evenbetter company.”
Promod Haque, Norwest Venture Partners Years in financial services: 15
Dedicated Partners
Early stage investments in informationtechnology including semiconductorand components, systems, software,services and consumer/internettechnologies.
Invests in management buyouts,recapitalizations, and growth financingfor middle-market companies; one ofoldest private equity firms in U.S.

2 4
Picturing the Next Stage of Successfor Our CommunitiesOur picture of success for our communities begins with our teammembers.They know their cities, towns and neighborhoodsbetter than anyone else because they live and work there—sothey’re the major voice in deciding how Wells Fargo responds tothe distinct needs of their own community.We want them to careas much about their community’s quality of life as they do abouttheir business’s bottom-line because the two are related. A reporton our achievements in corporate citizenship for 2005 is availableat www.wellsfargo.com/about/csr.
St. Paul, MinnesotaOnce a polluted industrial site,these 200 acres now are home toindigenous plants and animals.
Duane Ostlund,Business Banking Manager

2 5
Eleven years ago, the Phalen Corridor was an environmental mess—11 contaminated industrial sites covering 200 acres in a distressedcommunity on the east side of St. Paul, Minnesota.Wells Fargo and60 other public and private organizations came together to restorePhalen Corridor.The result: today it’s a thriving neighborhood withparks, wetlands, new homes, retailers and jobs.
Wells Fargo team members Duane Ostlund (opposite page) andJudy Chapman serve on the Phalen Corridor Steering Committee.Thanks to their leadership, hundreds of hours volunteered by morethan 30 other team members, and thousands of dollars in corporatecontributions, the Phalen Corridor is now a revitalized communitywith 19 new businesses, 2,100 new jobs and 1,100 new homes.
“This is a great example of tremendous results that can be achievedthrough a public, private and community partnership,”said Ostlund.
As part of the extensive environmental cleanup,Wells Fargohelped restore Ames Lake wetlands, once filled-in with asphalt andused as a parking lot.Today Ames Lake is a habitat for hundreds ofindigenous plants and animals.
Other examples of Wells Fargo’s commitment to the environ-ment include:
• A 10-point commitment to more effectively integrateenvironmental responsibility into our business practices.
• A $1 billion lending, investment and other financial commitmenttarget for environmentally-beneficial businesses.
• Reducing in paper, energy and water consumption throughservices such as online statements and e-bills.
• Promoting environmental responsibility for team membersthrough an awareness campaign called “everyday actions.”
Cleaning Up Polluted Land

2 6
Oklahoma City, OklahomaAs the nation’s #1 retail mortgageoriginator, we work with non-profitsto help build and renovate homesfor low-income families.
(l to r): Wells Fargo HomeMortgage team membersChris Hunter, John Snodgrass andShelley Pruitt with homeownerClara Myers (second from left)
The dream of living in a clean, warm, safe home can be a challengefor homeowners who are low-income, elderly or who havedisabilities.Who do they turn to if the roof leaks or a handrailbreaks? Over the past nine years, thanks in part to Wells Fargo’spartnership with Rebuilding Together, many seniors and families arenow living independently and comfortably in their own homes.Wells Fargo has contributed over $650,000 and hundreds of teammember volunteer hours to Rebuilding Together in 27 cities.
Last April, a platoon of more than 20 Wells Fargo team membersin Oklahoma City, Oklahoma, descended upon 10 houses onNational Rebuilding Day for a hands-on renovation project.Theyhelped install windows, fix porches, paint, and add grab-bars andrailings.“Everyone deserves to live in their own home,”saidWells Fargo team member Shelley Pruitt, board member for thelocal chapter of Rebuilding Together.“We’re fortunate to helpimprove the quality of life for residents in our community.”
Since 1993, the Wells Fargo HousingFoundation has teamed up with hundreds of local housing non-profitssuch as Rebuilding Together and Habitatfor Humanity to help make the dream ofhomeownership a reality for low-incomefamilies.The Foundation, through grants and the volunteerism of Wells Fargo teammembers, has helped build or renovate more than 1,900 homes.
Who Do You Turn to When the Roof Leaks?

2 7
Santa Ana, CaliforniaSeeking to increase student academicperformance by encouraging parents to be active participants in their child's education.
Wells Fargo team member andmentor Gabriela Cachua and student
Colorado Springs, ColoradoEducating and inspiring youngpeople to become learners and leaders.
Fifth grader Lucia (below),who attends Willard Intermediate School inSanta Ana, California, probably wouldn’t be reading the Americanclassic “Tom Sawyer”if it weren’t for Wells Fargo team memberGabriela Cachua, Regional Banking, Orange County, California.She’s just one of the eight volunteer mentors who visited the schoolevery week for a 10-week Reading Club.
Two years ago,Wells Fargo connected with the Santa AnaFoundation to help out with Avanzando Familias Program, whichengages parents in their child’s education to improve studentacademic performance.Mentors also teach students and their parentsabout budgeting,the importance of saving,bank accounts,and creditthrough Wells Fargo’s financial literacy curriculum, Hands on Banking®.More than 5,000 team members have been trained to teach theHands on Banking curriculum,available in both English and Spanish,in schools and community groups (handsonbanking.com).
“It is never too early, or too late, to learn—whether it’s aboutenjoying a new book, or the basics of banking,”said Cachua.
Engaging Parents in Education
“Stay in school and you’ll be more successful on the job.” That’s beenthe message to eighth grade students for the past several yearsduring Junior Achievement’s Job Shadow Day. Students interestedin learning more about careers in banking visit a Wells Fargo store inColorado Springs, Colorado to see a typical day in the banking worldup close. More importantly, they learn about teamwork and howmath, problem solving and communication skills are used each dayon the job.
Wells Fargo has partnered with Junior Achievement for morethan 11 years and is one of the top three largest providers ofvolunteers to Junior Achievement in the nation. In 2005, over 1,500team members volunteered in 1,630 classrooms nationwide toteach financial literacy, leadership skills, and life lessons such as self confidence and the importance of staying in school. First grader Sierra (below),Whittier Elementary School, participated inJunior Achievement workshops with Wells Fargo team memberDoug Brewer last year.
The Economics of Life

2 8
Portland, OregonHelping satisfy the basic needs ofthe homeless as they transition to housing.
Why spend time helping others? Just ask any of the severalthousand team members at Wells Fargo who volunteer in theircommunities.They’ll say that every smile, hug and “thank you”they receive makes it more than worthwhile. Every day, hundreds of team members across the country give their time, talent andresources to improve the quality of life in their communities.
In 2005,Wells Fargo created a company-wide process to better manage and measure the company’s volunteer efforts.VolunteerWellsFargo! is an internet-based tool that helps connectteam members with volunteer activities that match their interestsand time.They use it to find projects and recruit colleagues forbeach clean ups, Habitat for Humanity house builds, fun runs, andtutoring projects, and to record their volunteer hours or boardmembership activities.
Team members in Portland, Oregon use VolunteerWellsFargo!to organize groups of volunteers to prepare and serve hot meals to90 homeless individuals at Transition Projects Inc., a non-profit that
provides shelter and helps the homeless get back on their feet.Team members (below, from left) Kellie Pearse, Mary Hills,Denise Sandefur, Robin Thomas, Fe Dolor, Charlie Jones,Michelle Trofitter and Karen Schmidt are among over 30 teammembers who take turns volunteering every month to plan,provide, prepare and serve meals at the shelter.
So far, over 20 percent of our team members have logged onto the VolunteerWellsFargo! website and over nine percent have recorded their hours.“This new tool will give us a betterunderstanding of how we make our communities even betterplaces to live and work,”said Tim Schreck, community supportmanager.“It will also show us for the first time the incrediblequantity and quality of all our volunteer efforts, which we believeare just as important if not more important than the $95 million our company contributed to non-profits this year.We can now track our progress toward becoming one of the top contributors in team member volunteerism in all of corporate America.”
VolunteerWellsFargo!

2 9
Wells Fargo Receives Highest PossibleRating for Community Reinvestment Wells Fargo Bank, N.A. received an “Outstanding”rating—the highestrating possible, earned by less than one of every five national banks—in its most recent Community Reinvestment Act examination bythe Office of the Comptroller of the Currency (OCC).The Bank met or exceeded community needs in areas such as affordable housing,financial education and small business lending. For Wells Fargo,community reinvestment is not just about meeting the requirementsof a law, it’s about helping our communities grow and prosper. It’sjust good business.We’d do it even if there was no CRA!
Here are just some of the more than 15,000 non-profits we supported in 2005:
Arts
Santa Rosa, California – $3.75 million in financial support over 10 years. Wells Fargo provided a grant to the Luther Burbank Centerfor the Arts to help renovate and operate the 140,000 square footart and performance venue. Greg Morgan, community bankingpresident, serves on the board.
Des Moines, Iowa – $1.2 million in financial support and 56 prints by American artists to the Des Moines Art Center.The project is one reason Wells Fargo was recognized as one of the “Ten BestCompanies Supporting the Arts in America”by the New York-basedBusiness Committee for the Arts.
Billings, Montana – 33 years as lead sponsor of Symphony in thePark, a free cultural event for the community showcasing the BillingsSymphony and other local musicians. Last year 55 team membershelped staff the event.
Lincoln, Nebraska – For the second year in a row, Wells Fargosponsored Celebrate Lincoln, an outdoor cultural event featuringlive music, dancing, arts and crafts, and food from around the globe.Over 40 Wells Fargo team members volunteered at the event.
Hurricane Katrina:The “Next Stage”Hurricane Katrina caused unprecedented devastation in the Gulf States. Our response to help our affected customers also was unprecedented:
• We allowed them to defer mortgage payments for an initial 90 days, through November 2005.
• We then extended that mortgage deferral period another 90 days, through February 2006.
• During those deferral periods, we suspended all late fees,negative credit reports and collection calls for them.
• Using dedicated toll-free phone numbers, we helped affected customers with personal financial counseling todetermine the most reasonable payment solution after the deferral period ended.
• Residents of Alabama, Louisiana and Mississippi could make free withdrawals from any Wells Fargo ATM, nationwide throughyear-end 2005, whether or not they had a Wells Fargo account.
• We increased the daily spending limit for our ATM and CheckCard customers in affected areas of those states.
• Our affected small business customers could get emergencyincreases in their credit lines, bridge loans, term loans, creditprotection, deferred loan payments and fee waivers.
• We deferred credit card payments for affected customersthrough year-end 2005, waived over-limit, late, or non-sufficientfunds fees, and suspended collection calls and negative credit bureau reporting.
• Our Company and team members contributed a total of $1.5 million to the American Red Cross and United WayHurricane Katrina Relief Funds.
$66
01
82
02
83
03
93
04
95
05
Wells Fargo Contributions – 2005(millions, cash basis)
Corporate America’s 10 Largest Givers–2004(dollars in millions)
1. Wal-Mart Stores $188.02. Johnson & Johnson 121.83. Altria Group 113.44. Citigroup 111.35. Ford Motor 109.86. Bank of America 108.07. Target 107.88. Exxon Mobil 106.59. Wells Fargo 93.0
10. Wachovia 81.7Source: BusinessWeek 11/28/05

3 0
Community Development
Anchorage, Alaska – $100,000 grant for affordable housingthrough the Wells Fargo Housing Foundation’s seventh annualFocus Communities Initiative.Wells Fargo team members raised an additional $1,400 for Cook Inlet Housing Authority.
Oakland, California – $6 million investment in the East Bay AsianLocal Development Corporation for Preservation Park, a renovatedVictorian-style business park that provides affordable office space to non-profits facing eviction.
Pueblo, Colorado – 35 home improvement projects. Wells Fargopartnered with NeighborWorks, a non-profit that provides affordablehousing, education and down payment assistance.Team memberBrad Ahl led a group of co-workers to help paint the trims andgarages of 35 homes during their annual Operation Paintbrush event.
Mission, South Dakota – $125,000 to help families of the RosebudSioux Tribe.Wells Fargo team members are working with Habitat forHumanity to build five homes on the Rosebud Indian Reservation.Team member Samantha Keller used the company’s new onlinetool, VolunteerWellsFargo!, to recruit over 75 volunteers.
Austin,Texas – $20,000 so far to help 10 families buy first homes.Wells Fargo supports the Austin Area Urban League’s new downpayment assistance program. Low-income individuals who completea free,monthly workshop receive $2,000 in down payment assistance.
Brigham City, Utah – $17,500 grant and eight new homes. Wells Fargoprovided a grant to the Neighborhood Nonprofit Housing Agencyfor affordable housing.Wells Fargo team members volunteeredevery Saturday for seven weeks to help build homes.
Richmond,Virginia – 700 African American adults attended a freeworkshop on practical approaches to financial management,including homeownership and saving for retirement.This was oneof 23 wealth-building seminars held around the country in 2005.
Education
Phoenix,Arizona – Every week, two dozen Wells Fargo team membersvisit students at Lowell Elementary School as part of the Big Brothersand Big Sisters “Lunch Buddy”mentoring program.Team membersalso raised $15,000 to renovate the school’s playground.
Fort Wayne, Indiana – For the tenth year in a row, Wells Fargosponsored the YMCA Celebration of Youth event. Every year eightstudents receive a $700 college scholarship from Wells Fargo inhonor of their community involvement activities.
Las Vegas, Nevada – $50,000 to teachers in 17 schools. Wells Fargo’s“Grant a Wish for Your School”program awarded up to $3,000 eachto teachers across the state for special classroom projects focusedon financial literacy, math, technology and careers.
Chester, Pennsylvania – 720 backpacks and $5,000 grant. Teammembers from Wells Fargo Auto Finance partnered with the JuniorLeague to kick off the school year in style.Team members visitedColumbus Elementary School and gave each student a backpackfilled with school supplies.
Milwaukee,Wisconsin – A decade of support. Wells Fargo workedwith the Greater Milwaukee Committee and other business leadersto create the School Partnership Program.The program helpsprepare young people for their future by teaching them healthyfinancial habits and other life-skills. During the past 10 years, over100 team members have volunteered.
Environment
San Francisco, California – Energy consumption reduced by 20 percent at Wells Fargo’s buildings throughout California since2001.Wells Fargo modernized the energy management technologyat its headquarters building and earned the Energy Star Award from the Environmental Protection Agency for being among the top 10 percent of the nation’s most energy-efficient buildings.
Santa Ana, California – For the second year, Wells Fargo participatedin the California Coastal Commission’s Coastal Cleanup Day.Thirty-two team members helped clean up two miles of coastline, pickingup over 50 bags of trash and debris.
Beaverton, Oregon – 15,000+ red wiggler worms are helping reduce and recycle waste at Wells Fargo’s William Barnhart Center(operations and customer service).The “worm ranch”residents eat up to 20 pounds of fruits, vegetables, coffee grounds and other leftovers every day from the cafeteria, and their castings arerecycled for fertilizer.
Human Services
Los Angeles, California – $20,000 grant and seven school makeovers.240 Wells Fargo team members helped celebrate Mayor Villaraigosa’s100th day in office by lending a hand during a “Day of Service.”Volunteers helped seven local schools get a much-needed face liftby planting flowers, cleaning up graffiti and painting classrooms.
Boise, Idaho – 114 computers for K-12 students thanks in part to adonation from Wells Fargo to Computers for Kids, a non-profit thatupgrades computers for children in need. Fourteen Wells Fargoteam members volunteered to deliver the computers.
Minneapolis, Minnesota – $50,000 to help the developmentallydisabled become more independent. Team member Gary Johnsonwon the Wells Fargo Volunteer Service Award on behalf of Reach for Resources, where he volunteers and serves on the board. He isone of 164 team members awarded $321,000 in grants in 2005 for their designated non-profits.
McKinney,Texas – 2,000 hurricane evacuees sheltered. When Jack Haye of Wholesale Banking learned that his community would be providing shelter to Hurricane Katrina evacuees, hestepped up to the plate. Haye managed a shelter and helpedcoordinate hundreds of volunteers to collect and distributedonations and provide disaster relief services.
Seattle,Washington – Two years of board participation and $25,000in financial support. Wells Fargo donated a 9,000 square foot formerbanking store to Domestic Abuse Women’s Network for its officespace.Team member Jennifer Politakis serves as a board member.
Casper,Wyoming – $33,500 raised for United Way. Wells Fargo regionalpresident Michael Matthews rallied team members to donate fundsduring the annual Community Support Campaign. Each donationearned them a two-foot section of duct tape which was later usedto tape community bank president, Tom Kugler, to a wall.
Newfoundland, Canada – 1 new laptop. When Wells Fargo FinancialCanada team member Valerie Clarke heard about a bedriddenyoung man with Crohn’s disease whose computer broke down,she teamed up with Lion’s Club to give him a new laptop.

3 1
Board of Directors
Executive Officers and Corporate Staff
Richard M. Kovacevich, Chairman, CEO *
John G. Stumpf, President, COO *
Senior Executive Vice Presidents
Howard I. Atkins, Chief Financial Officer *
David A. Hoyt, Wholesale Banking *
Mark C. Oman, Home and Consumer Finance *
Paul R. Ackerman,Treasurer
Patricia R. Callahan, Compliance and Risk Management *
Bruce E. Helsel, Corporate Development
Lawrence P. Haeg, Corporate Communications
Ellen Haude, Investment Portfolio
Laurel A. Holschuh, Corporate Secretary
Richard D. Levy, Controller *
Kevin McCabe, Chief Auditor
Avid Modjtabai, Human Resources *
David J. Munio, Chief Credit Officer *
Michael J. Loughlin, Deputy Chief Credit Officer
Victor K. Nichols,Technology
Eric D. Shand, Chief Loan Examiner
Diana L. Starcher, Customer Service, Sales, Operations
Robert S. Strickland, Investor Relations
James M. Strother, General Counsel,Government Relations *
Carrie L.Tolstedt, Regional Banking *
J.A. Blanchard III 1, 2, 4
ChairmanADC TelecommunicationsEden Prairie, Minnesota(Communications equipment,services)
Robert L. Joss 2, 3
Philip H. Knight Professor and DeanStanford U. Graduate School of BusinessPalo Alto, California(Higher education)
Philip J. Quigley 1, 2, 4
Retired Chairman,President, CEOPacific Telesis GroupSan Francisco, California(Telecommunications)
Reatha Clark King 1, 3
Retired President, Board ChairGeneral Mills FoundationMinneapolis, Minnesota(Corporate foundation)
Donald B. Rice 4, 5
Chairman, President, CEOAgensys, Inc.Santa Monica, California(Biotechnology)
Lloyd H. Dean 1, 3
President, CEOCatholic Healthcare WestSan Francisco, California(Health care)
Richard M. KovacevichChairman, CEOWells Fargo & CompanySan Francisco, California
Judith M. Runstad 1, 3
Of CounselFoster Pepper & Shefelman PLLCSeattle, Washington(Law firm)
Susan E. Engel 2, 3, 5
Chairwoman, CEOLenox Group Inc.Eden Prairie, Minnesota(Specialty retailer)
Stephen W. Sanger 3, 5
Chairman, CEOGeneral Mills, Inc.Minneapolis, Minnesota(Packaged foods)
Enrique Hernandez, Jr. 1, 3
Chairman, CEOInter-Con Security Systems, Inc.Pasadena, California(Security services)
Cynthia H. Milligan 1, 4
DeanCollege of BusinessAdministrationUniversity of Nebraska –Lincoln(Higher education)
Susan G. Swenson 1, 2, 4
Former COOT-Mobile USA, Inc.Bellevue, Washington(Wireless communications)
Standing Committees: 1. Audit and Examination; 2. Credit; 3. Finance; 4. Governance and Nominating; 5. Human Resources
Michael W. Wright 2, 4, 5
Retired Chairman, CEOSUPERVALU INC.Eden Prairie, Minnesota(Food distribution, retailing)
* “Executive officers” according to Securities and Exchange Commission rules
Richard D. McCormick 3
Chairman EmeritusUS WEST, Inc.Denver, Colorado(Communications)

3 2
COMMUNITY BANKING
Regional Banking
Carrie L.Tolstedt
Regional Presidents
James O. Prunty, Great Lakes and Plains
Debra J. Paterson, Metro Minnesota
Norbert D. Harrington, Greater Minnesota
J. Lanier Little, Illinois, Michigan, Wisconsin
Carl A. Miller, Jr., Indiana, Ohio
Daniel P. Murphy, South Dakota
Peter J. Fullerton, North Dakota
Paul W.“Chip” Carlisle,Texas
George W. Cone, Heart of Texas
John T. Gavin, Dallas-Fort Worth
Glenn V. Godkin, Houston
Don C. Kendrick, Central Texas
Kenneth A.Telg, West Texas
Thomas W. Honig, Colorado, Montana,Utah, Wyoming
Joy N. Ott, Montana
Robert A. Hatch, Utah
Matthew J. Lynett, Metro Denver
Donald R. Sall, Greater Colorado
Michael J. Matthews, Wyoming
H. Lynn Horak, Iowa, Nebraska
Kirk L. Kellner, Nebraska
J. Scott Johnson, Iowa
Laura A. Schulte, Western Banking
Michael F. Billeci, Greater San Francisco Bay Area
Nathan E. Christian, Southern California,Border Banking
William J. Dewhurst, Central California
Felix S. Fernandez, Northern California
Shelley Freeman, Los Angeles Metro
Alan V. Johnson, Oregon
J. Pat McMurray, Idaho
Lisa J. Stevens, San Francisco Metro
Richard Strutz, Alaska
Robert D.Worth, California Business Banking
Patrick G.Yalung, Washington State
Kim M.Young, Orange County
Gerrit van Huisstede, Arizona, Nevada,New Mexico
Kirk V. Clausen, Nevada
Gregory A.Winegardner, New Mexico
Mergers and Acquisitions
Jon R. Campbell
Business Banking Support Group
Timothy J. Coughlon
Marketing
Sylvia L. Reynolds
Senior Business Officers
Private Client Services/Internet Services
Clyde W. Ostler
Jay Welker, Private Client Services
Regional Managing Directors
Anne D. Copeland, Northern California,Central California, Nevada
Joe W. DeFur, Los Angeles Metro
James Cimino, Southern California,Orange County, Arizona
Jeffrey Grubb, Washington, Oregon,Idaho, Alaska
David J. Kasper, Colorado, Utah,Montana, Wyoming
Russell A. Labrasca,Texas, New Mexico
David J. Pittman, Illinois, Iowa, Nebraska
Timothy N.Traudt, Minnesota,North Dakota, South Dakota, Wisconsin,Indiana, Ohio, Michigan
Tracey B.Warson, San Francisco Bay Area
Lance P. Fox, Credit Administration
Diversified Products
Michael R. James
Marc L. Bernstein, Business Direct Lending
Louis M. Cosso, Auto Finance
Jerry E. Gray, SBA Lending
Michael T. Borchert, Payroll Services
Rebecca Macieira-Kaufmann,Small Business Segment
Kevin A. Rhein, Wells Fargo Card Services
Daniel I. Ayala, Global Remittance Services
Edward M. Kadletz, Debit Card
Debra B. Rossi, Payment Solutions
Jon A.Veenis, Education Finance Services
HOME AND CONSUMER FINANCE
Mark C. Oman
Wells Fargo Home Mortgage
Michael J. Heid, Division President, CapitalMarkets, Finance, Administration
Cara K. Heiden, Division President, NationalConsumer Lending, Institutional Lending
Susan A. Davis, Centralized Retail/Retail Administration
Michael Lepore, Institutional Lending
Consumer Credit
Doreen Woo Ho, President
Brian J. Bartlett, Corporate Trust
John W. Barton, Regional Banking/PersonalCredit Management
Scott Gable, Personal Credit Management
Meheriar M. Hasan, Direct to Consumer
Kathleen L.Vaughan, Equity Direct,Institutional Lending
Wells Fargo Financial, Inc.
Thomas P. Shippee, CEO, President
Greg M. Janasko, Commercial Business
David R. Kvamme, Consumer Business
Gary D. Lorenz, Auto Business
Jaime Marti, Latin American Auto
Oriol Segarra, Latin American Consumer and U.S. Hispanic
WHOLESALE BANKING
David A. Hoyt
Commercial Banking
Iris S. Chan
John C. Adams, Northern California
JoAnn N. Bertges, Western
Robert A. Chereck,Texas
Albert F. (Rick) Ehrke, Southern California
Mark D. Howell, Intermountain/Southwest
Paul D. Kalsbeek, Southeast
Richard J. Kerbis, Northeast
Edmund O. Lelo, Greater Los Angeles
Perry G. Pelos, Midwest
John V. Rindlaub, Pacific Northwest
Credit Administration
Thomas J. Davis, Real Estate
David J.Weber, Commercial/Corporate
Specialized Financial Services
Timothy J. Sloan
J. Edward Blakey, Commercial Mortgage
David B. Marks, Corporate Banking,Shareowner Services
John P. Hullar, Wells Fargo Securities
Jay Kornmayer, Gaming
Mark L. Myers, Real Estate Merchant Banking,Homebuilder Finance
J. Michael Johnson, Financial Sponsors,Leveraged, Media and Mezzanine Finance,Distribution
John M. McQueen, Wells Fargo EquipmentFinance
John R. Shrewsberry, Securities Investment
Real Estate
A. Larry Chapman
Charles H. Fedalen, Jr., SouthernCalifornia/Southwest
Shirley O. Griffin, Real Estate Portfolio Services
Christopher J. Jordan, Mid-Atlantic/New England
Robin W. Michel, Northern California/Northwest
James H. Muir, Eastern/Midwest
Stephen P. Prinz, Central/Texas
International and Insurance Services
David J. Zuercher
Peter J.Wissinger, President, CEO, Acordia, Inc.
Michael E. Connealy, Rural Community Insurance Services
Neal Aton, Wells Fargo Insurance
Ronald A. Caton, Global Correspondent Banking
Peter P. Connolly, Foreign Exchange/International Financial Services
Sanjiv S. Sanghvi, Wells Fargo HSBC Trade Bank
Asset-Based Lending
John F. Nickoll
Peter E. Schwab, Wells Fargo Foothill
Henry K. Jordan, Wells Fargo Foothill
Thomas Pizzo, Wells Fargo Century
Martin J. McKinley, Wells Fargo Business Credit
Jeffrey T. Nikora, Alternative InvestmentManagement
Eastdil Secured, LLC
Benjamin V. Lambert, Chairman
Roy H. March, CEO
D. Michael Van Konynenburg, President
W. Jay Borzi, Managing Director
Asset Management
Michael J. Niedermeyer
Robert W. Bissell, Wells Capital Management
James W. Paulsen, Wells Capital Management
John S. McCune, Institutional Brokerage
Laurie B. Nordquist, Institutional Trust
Karla M. Rabusch, Wells Fargo Funds
Wholesale Services
Stephen M. Ellis
Norwest Equity Partners
John E. Lindahl, Managing Partner
Norwest Venture Partners
Promod Haque, Managing Partner

Financial Review
34 Overview
38 Critical Accounting Policies
41 Earnings Performance41 Net Interest Income44 Noninterest Income45 Noninterest Expense45 Income Tax Expense45 Operating Segment Results
46 Balance Sheet Analysis46 Securities Available for Sale
(table on page 71)46 Loan Portfolio (table on page 73)46 Deposits
47 Off-Balance Sheet Arrangements andAggregate Contractual Obligations
47 Off-Balance Sheet Arrangements,Variable Interest Entities, Guarantees and Other Commitments
48 Contractual Obligations48 Transactions with Related Parties
49 Risk Management49 Credit Risk Management Process49 Nonaccrual Loans and Other Assets50 Loans 90 Days or More Past Due
and Still Accruing51 Allowance for Credit Losses
(table on page 75)52 Asset/Liability and
Market Risk Management
52 Interest Rate Risk52 Mortgage Banking Interest Rate Risk54 Market Risk – Trading Activities54 Market Risk – Equity Markets54 Liquidity and Funding
56 Capital Management
57 Comparison of 2004 with 2003
Controls and Procedures
58 Disclosure Controls and Procedures
58 Internal Control over Financial Reporting
58 Management’s Report on Internal Controlover Financial Reporting
59 Report of Independent Registered PublicAccounting Firm
Financial Statements
60 Consolidated Statement of Income
61 Consolidated Balance Sheet
62 Consolidated Statement of Changes in Stockholders’ Equity and Comprehensive Income
63 Consolidated Statement of Cash Flows
64 Notes to Financial Statements
112 Report of Independent RegisteredPublic Accounting Firm
113 Quarterly Financial Data
115 Glossary
33

34
Wells Fargo & Company is a $482 billion diversified financialservices company providing banking, insurance, investments,mortgage banking and consumer finance through bankingstores, the internet and other distribution channels to con-sumers, businesses and institutions in all 50 states of the U.S. and in other countries. We ranked fifth in assets andfourth in market value of our common stock among U.S.bank holding companies at December 31, 2005. When werefer to “the Company,” “we,” “our” and “us” in thisReport, we mean Wells Fargo & Company and Subsidiaries(consolidated). When we refer to “the Parent,” we meanWells Fargo & Company.
We had another exceptional year in 2005, with recorddiluted earnings per share of $4.50, record net income of$7.7 billion and solid market share growth across our morethan 80 businesses. Our earnings growth from a year ago wasbroad based, with nearly every consumer and commercialbusiness line achieving double-digit profit growth, includingregional banking, private client services, corporate trust,business direct, asset-based lending, student lending, consumercredit, commercial real estate and international trade services.Both net interest income and noninterest income for 2005grew solidly from last year and virtually all of our fee-basedproducts had double-digit revenue growth. We took significantactions to reposition our balance sheet in 2005 designed toimprove yields on earning assets, including the sale of $48 billionof our lowest-yielding adjustable rate mortgages (ARMs),resulting in $119 million of sales-related losses, and the sale of $17 billion of debt securities, including low-yieldingfixed-income securities, resulting in $120 million of losses.
Our growth in earnings per share was driven by revenuegrowth, operating leverage (revenue growth in excess ofexpense growth) and credit quality, which remained soliddespite the following credit-related events:
• $171 million of net charge-offs from incremental consumer bankruptcy filings nationwide due to a change in bankruptcy law in October 2005;
• $163 million first quarter 2005 initial implementation of conforming to more stringent Federal FinancialInstitutions Examination Council (FFIEC) charge-offrules at Wells Fargo Financial; and
• $100 million provision for credit losses for our assessment of the effect of Hurricane Katrina.
Our primary sources of earnings are driven by lendingand deposit taking activities, which generate net interestincome, and providing financial services that generate feeincome.
Revenue grew 10% from 2004. In addition to double-digitgrowth in earnings per share, we also had double-digit growthin average loans. We have been achieving these results not justfor one year, but for the past five, 10, 15 and 20 years. Ourtotal shareholder return the past five years was 10 times thatof the S&P 500®, and almost double the S&P 500 includingthe past 10, 15 and 20 years. These periods included almostevery economic cycle and economic condition a financialinstitution can experience, including high and low interestrates, high and low unemployment, bubbles and recessionsand all types of yield curves – steep, flat and inverted. For usto achieve double-digit growth through different economiccycles, our primary strategy, consistent for 20 years, is to satisfy all our customers’ financial needs, help them succeedfinancially and, through cross-selling, gain market share, wallet share and earn 100% of their business.
We have stated in the past that to consistently grow over the long term, successful companies must invest in theircore businesses and in maintaining strong balance sheets. We continued to make investments in 2005 by opening 92banking stores, seven commercial banking offices, 47 mortgagestores and 20 consumer finance stores. We continued to be #1 nationally in retail mortgage originations, home equity lending, small business lending, agricultural lending, consumer internet banking, and providing financial servicesto middle-market companies in the western U.S.
Overview
This Annual Report, including the Financial Review and the Financial Statements and related Notes, has forward-lookingstatements, which may include forecasts of our financial results and condition, expectations for our operations and business, andour assumptions for those forecasts and expectations. Do not unduly rely on forward-looking statements. Actual results mightdiffer significantly from our forecasts and expectations due to several factors. Some of these factors are described in the FinancialReview and in the Financial Statements and related Notes. For a discussion of other factors, refer to the “Risk Factors” and“Regulation and Supervision” sections of our Annual Report on Form 10-K for the year ended December 31, 2005, filed withthe Securities and Exchange Commission (SEC) and available on the SEC’s website at www.sec.gov.
-5
0
5
10
15
20
25
5%.5
17
12
21
11
10 15 205 years
(percent) Wells Fargo Common Stock S&P 500
LONG-TERM PERFORMANCE – TOTAL COMPOUND ANNUAL STOCKHOLDER RETURN (Including reinvestment of dividends)
21
9
Financial Review

35
Our solid financial performance enables us to be one of the top givers to non-profits among all U.S. companies.We continued to have the only “Aaa” rated bank in the U.S., the highest possible credit rating issued by Moody’sInvestors Service.
Our vision is to satisfy all the financial needs of our customers, help them succeed financially, be recognized asthe premier financial services company in our markets andbe one of America’s great companies. Our primary strategyto achieve this vision is to increase the number of productsour customers buy from us and to give them all the financialproducts that fulfill their needs. Our cross-sell strategy anddiversified business model facilitate growth in strong andweak economic cycles, as we can grow by expanding thenumber of products our current customers have with us. Atyear-end 2005, our average cross-sell set new records for theCompany – our average retail banking household now has 4.8 products with us, up from 4.6 a year ago and our averageWholesale Banking customer now has a record 5.7 products.Our goal is eight products per customer, which is currentlyhalf of our estimate of potential demand.
Our core products grew this year: • Average loans grew by 10%;• Average retail core deposits grew by 10%
(average core deposits grew by 9%); and• Assets managed and administered were up 11%.
We believe it is important to maintain a well controlledenvironment as we continue to grow our businesses. Wemanage our credit risk by maintaining prudent credit policiesfor underwriting with effective procedures for monitoring andreview. We have a well diversified loan portfolio, measuredby industry, geography and product type. We manage theinterest rate and market risks inherent in our asset and liabilitybalances within prudent ranges, while ensuring adequate liquidity and funding. Our stockholder value has increasedover time due to customer satisfaction, strong financial results,investment in our businesses and the prudent way we attemptto manage our business risks.
Our financial results included the following:
Net income in 2005 increased 9% to $7.7 billion from$7.0 billion in 2004. Diluted earnings per common shareincreased 10% to $4.50 in 2005 from $4.09 in 2004. Returnon average total assets was 1.72% and return on averagecommon equity was 19.57% in 2005, and 1.71% and19.56%, respectively, in 2004.
Net interest income on a taxable-equivalent basis was$18.6 billion in 2005, compared with $17.3 billion a yearago, reflecting solid loan growth (other than ARMs) and arelatively flat net interest margin. Average earning assetsgrew 8% from a year ago, or 15% excluding 1-4 family firstmortgages. Our net interest margin was 4.86% for 2005,compared with 4.89% in 2004. Given the prospect of highershort-term interest rates and a flatter yield curve, beginning insecond quarter 2004, as part of our asset/liability management
strategy, we sold the lowest-yielding ARMs on our balancesheet, replacing some of these loans with higher-yielding ARMs.At the end of 2005, new ARMs being held for investmentwithin real estate 1-4 family mortgage loans had yields more than 1% higher than the average yield on the ARMssold since second quarter 2004.
Noninterest income increased 12% to $14.4 billion in2005 from $12.9 billion in 2004. Double-digit growth innoninterest income was driven by growth across our busi-nesses, with particular strength in trust, investment and IRAfees, card fees, loan fees, mortgage banking income andgains on equity investments.
Revenue, the sum of net interest income and noninterestincome, increased 10% to a record $32.9 billion in 2005from $30.1 billion in 2004 despite balance sheet reposition-ing actions, including losses from the sales of low-yieldingARMs and debt securities. For the year, Wells Fargo HomeMortgage (Home Mortgage) revenue increased $455 million,or 10%, from $4.4 billion in 2004 to $4.9 billion in 2005.Operating leverage improved during 2005 with revenuegrowing 10% and noninterest expense up only 8%.
Noninterest expense was $19.0 billion in 2005, up 8%from $17.6 billion in 2004, primarily due to increased mortgage production and continued investments in newstores and additional sales-related team members. Noninterestexpense also included a $117 million expense to adjust theestimated lives for certain depreciable assets, primarily buildingimprovements, $62 million of airline lease write-downs, $56 million of integration expense and $25 million for theadoption of FIN 47. We began expensing stock options, as required, on January 1, 2006. Taking into account ourFebruary 2006 option grant, we anticipate that total stockoption expense will reduce earnings by approximately $.06 per share for 2006.
During 2005, net charge-offs were $2.28 billion, or .77%of average total loans, compared with $1.67 billion, or .62%,during 2004. Credit losses for 2005 included $171 million ofincremental fourth quarter bankruptcy losses and increasedlosses of $163 million for first quarter 2005 initial implementation of conforming to more stringent FFIECcharge-off timing rules at Wells Fargo Financial. The provisionfor credit losses was $2.38 billion in 2005, up $666 millionfrom $1.72 billion in 2004. The 2005 provision for creditlosses also included $100 million for estimated credit lossesrelated to Hurricane Katrina. The allowance for credit losses,which consists of the allowance for loan losses and thereserve for unfunded credit commitments, was $4.06 billion,or 1.31% of total loans, at December 31, 2005, comparedwith $3.95 billion, or 1.37%, at December 31, 2004.
At December 31, 2005, total nonaccrual loans were $1.34 billion, or .43% of total loans, down from $1.36 billion,or .47%, at December 31, 2004. Foreclosed assets were$191 million at December 31, 2005, compared with $212 million at December 31, 2004.

36
The ratio of stockholders’ equity to total assets was8.44% at December 31, 2005, compared with 8.85% atDecember 31, 2004. Our total risk-based capital (RBC)ratio at December 31, 2005, was 11.64% and our Tier 1RBC ratio was 8.26%, exceeding the minimum regulatoryguidelines of 8% and 4%, respectively, for bank holdingcompanies. Our RBC ratios at December 31, 2004, were12.07% and 8.41%, respectively. Our Tier 1 leverage ratioswere 6.99% and 7.08% at December 31, 2005 and 2004,respectively, exceeding the minimum regulatory guideline of3% for bank holding companies.
stock plans, performance-based awards, stock appreciationrights, and employee stock purchase plans. FAS 123R requiresthat we measure the cost of employee services received inexchange for an award of equity instruments based on thefair value of the award on the grant date. That cost must berecognized in the income statement over the vesting periodof the award. Under the “modified prospective” transitionmethod, awards that are granted, modified or settled begin-ning at the date of adoption will be measured and accountedfor in accordance with FAS 123R. In addition, expense mustbe recognized in the income statement for unvested awardsthat were granted prior to the date of adoption. The expensewill be based on the fair value determined at the grant date.Taking into account our February 2006 option grant, weanticipate that total stock option expense will reduce 2006earnings by approximately $.06 per share.
On March 30, 2005, the FASB issued Interpretation No. 47,Accounting for Conditional Asset Retirement Obligations –An Interpretation of FASB Statement No. 143 (FIN 47). FIN47 was issued to address diverse accounting practices thatdeveloped with respect to the timing of liability recognitionfor legal obligations associated with the retirement of tangiblelong-lived assets, such as building and leasehold improvements,when the timing and/or method of settlement of the obligationsare conditional on a future event. FIN 47 requires companiesto recognize a liability for the fair value of a conditional assetretirement obligation when incurred if the liability’s fair valuecan be reasonably estimated. We adopted FIN 47 in 2005and recorded a $25 million charge to noninterest expense.
We continuously monitor emerging accounting issues,including proposed standards issued by the FASB, for anyimpact on our financial statements. We are currently awareof a proposed FASB Staff Position (FSP) related to theaccounting for leveraged lease transactions for which therehave been cash flow estimate changes based on when incometax benefits are recognized. Certain leveraged lease transac-tions have been challenged by the Internal Revenue Service(IRS). While we have not made investments in a broad classof transactions that the IRS commonly refers to as “Lease-In,Lease-Out” (LILO) transactions, we have previously investedin certain leveraged lease transactions that the IRS labels as“Sale-In, Lease-Out” (SILO) transactions. We have paid theIRS the income tax associated with our SILO transactions.However, we are continuing to vigorously defend our initialfiling position as to the timing of the tax benefits associatedwith these transactions. If the draft FSP had been effective atDecember 31, 2005, we would have been required to recorda pre-tax charge of approximately $125 million as a cumula-tive effect of change in accounting principle. However, subse-quent deliberations by the FASB could significantly changethe draft FSP, which, in turn, could affect our estimate andthe method of adoption. We will continue to monitor theFASB’s deliberations regarding this proposal.
Table 1: Ratios and Per Common Share Data
Year ended December 31,2005 2004 2003
PROFITABILITY RATIOSNet income to average total assets (ROA) 1.72% 1.71% 1.64%Net income applicable to common stock to
average common stockholders’ equity (ROE) 19.57 19.56 19.36Net income to average stockholders’ equity 19.59 19.57 19.34
EFFICIENCY RATIO (1) 57.7 58.5 60.6
CAPITAL RATIOSAt year end:
Stockholders’ equity to assets 8.44 8.85 8.89Risk-based capital (2)
Tier 1 capital 8.26 8.41 8.42Total capital 11.64 12.07 12.21
Tier 1 leverage (2) 6.99 7.08 6.93Average balances:
Stockholders’ equity to assets 8.78 8.73 8.49
PER COMMON SHARE DATADividend payout (3) 44.0 44.8 40.7Book value $24.25 $22.36 $20.31Market price (4)
High $64.70 $64.04 $59.18Low 57.62 54.32 43.27Year end 62.83 62.15 58.89
(1) The efficiency ratio is noninterest expense divided by total revenue (net interestincome and noninterest income).
(2) See Note 25 (Regulatory and Agency Capital Requirements) to FinancialStatements for additional information.
(3) Dividends declared per common share as a percentage of earnings per common share.
(4) Based on daily prices reported on the New York Stock Exchange CompositeTransaction Reporting System.
Current Accounting DevelopmentsOn December 16, 2004, the Financial Accounting StandardsBoard (FASB) issued Statement of Financial AccountingStandards No. 123 (revised 2004), Share-Based Payment(FAS 123R), which replaced FAS 123, Accounting for Stock-Based Compensation, and superceded Accounting PrinciplesBoard Opinion No. 25, Accounting for Stock Issued toEmployees. We adopted FAS 123R on January 1, 2006,using the “modified prospective” transition method. Thescope of FAS 123R includes a wide range of stock-basedcompensation arrangements including stock options, restricted

37
On August 11, 2005, the FASB issued for public comment an Exposure Draft that would amend FAS 140,Accounting for Transfers and Servicing of Financial Assetsand Extinguishments of Liabilities. This Exposure Draft,Accounting for Servicing of Financial Assets – An Amendmentof FASB Statement No. 140, would require that all separatelyrecognized servicing rights be initially measured at fair value,if practicable. For each class of separately recognized servicingassets and liabilities, this proposed standard would permit anentity to choose from two subsequent measurement methods.Specifically, an entity could amortize servicing assets and
liabilities in proportion to and over the period of estimatednet servicing income or servicing loss (effectively the existingrequirement in FAS 140) or an entity could report servicingassets or liabilities at fair value at each reporting date withany changes reported currently in operations. We expect thisguidance to be finalized and issued in early 2006. Based onthe guidance in the current Exposure Draft, it is likely thatwe will adopt the fair value alternative upon issuance of the standard. We will continue to monitor this emergingguidance in order to finalize our decision and determine the impact on our financial statements.
Table 2: Six-Year Summary of Selected Financial Data
(in millions, except % Change Five-yearper share amounts) 2005/ compound
2005 2004 2003 2002 2001 2000 2004 growth rate
INCOME STATEMENTNet interest income $ 18,504 $ 17,150 $ 16,007 $ 14,482 $ 11,976 $ 10,339 8% 12%Noninterest income 14,445 12,909 12,382 10,767 9,005 10,360 12 7Revenue 32,949 30,059 28,389 25,249 20,981 20,699 10 10Provision for credit losses 2,383 1,717 1,722 1,684 1,727 1,284 39 13Noninterest expense 19,018 17,573 17,190 14,711 13,794 12,889 8 8
Before effect of change in accounting principle (1)
Net income $ 7,671 $ 7,014 $ 6,202 $ 5,710 $ 3,411 $ 4,012 9 14Earnings per common share 4.55 4.15 3.69 3.35 1.99 2.35 10 14Diluted earnings
per common share 4.50 4.09 3.65 3.32 1.97 2.32 10 14
After effect of change in accounting principle
Net income $ 7,671 $ 7,014 $ 6,202 $ 5,434 $ 3,411 $ 4,012 9 14Earnings per common share 4.55 4.15 3.69 3.19 1.99 2.35 10 14Diluted earnings
per common share 4.50 4.09 3.65 3.16 1.97 2.32 10 14Dividends declared
per common share 2.00 1.86 1.50 1.10 1.00 .90 8 17
BALANCE SHEET(at year end)Securities available for sale $ 41,834 $ 33,717 $ 32,953 $ 27,947 $ 40,308 $ 38,655 24 2Loans 310,837 287,586 253,073 192,478 167,096 155,451 8 15Allowance for loan losses 3,871 3,762 3,891 3,819 3,717 3,681 3 1Goodwill 10,787 10,681 10,371 9,753 9,527 9,303 1 3Assets 481,741 427,849 387,798 349,197 307,506 272,382 13 12Core deposits (2) 253,341 229,703 211,271 198,234 182,295 156,710 10 10Long-term debt 79,668 73,580 63,642 47,320 36,095 32,046 8 20Guaranteed preferred beneficial
interests in Company’ssubordinated debentures (3) — — — 2,885 2,435 935 — —
Stockholders’ equity 40,660 37,866 34,469 30,319 27,175 26,461 7 9
(1) Change in accounting principle is for a transitional goodwill impairment charge recorded in 2002 upon adoption of FAS 142, Goodwill and Other Intangible Assets.(2) Core deposits consist of noninterest-bearing deposits, interest-bearing checking, savings certificates and market rate and other savings.(3) At December 31, 2003, upon adoption of FIN 46 (revised December 2003), Consolidation of Variable Interest Entities (FIN 46R), these balances were reflected in long-term
debt. See Note 12 (Long-Term Debt) to Financial Statements for more information.

38
Critical Accounting Policies
Our significant accounting policies (see Note 1 (Summary ofSignificant Accounting Policies) to Financial Statements) arefundamental to understanding our results of operations andfinancial condition, because some accounting policies requirethat we use estimates and assumptions that may affect thevalue of our assets or liabilities and financial results. Threeof these policies are critical because they require managementto make difficult, subjective and complex judgments aboutmatters that are inherently uncertain and because it is likelythat materially different amounts would be reported underdifferent conditions or using different assumptions. Thesepolicies govern the allowance for credit losses, the valuationof mortgage servicing rights and pension accounting.Management has reviewed and approved these criticalaccounting policies and has discussed these policies with the Audit and Examination Committee.
Allowance for Credit LossesThe allowance for credit losses, which consists of theallowance for loan losses and the reserve for unfunded creditcommitments, is management’s estimate of credit losses inherent in the loan portfolio at the balance sheet date. Wehave an established process, using several analytical tools andbenchmarks, to calculate a range of possible outcomes anddetermine the adequacy of the allowance. No single statisticor measurement determines the adequacy of the allowance.Loan recoveries and the provision for credit losses increasethe allowance, while loan charge-offs decrease the allowance.
PROCESS TO DETERMINE THE ADEQUACY OF THE ALLOWANCE
FOR CREDIT LOSSES
While we allocate a portion of the allowance to specific loancategories (the allocated allowance), the entire allowance(both allocated and unallocated) is used to absorb creditlosses inherent in the total loan portfolio.
Approximately two-thirds of the allocated allowance isdetermined at a pooled level for consumer loans and somesegments of commercial small business loans. We use forecasting models to measure the losses inherent in theseportfolios. We frequently validate and update these models tocapture recent behavioral characteristics of the portfolios, aswell as changes in our loss mitigation or marketing strategies.
The remaining allocated allowance is for commercialloans, commercial real estate loans and lease financing. Weinitially estimate this portion of the allocated allowance byapplying historical loss factors statistically derived fromtracking loss content associated with actual portfolio move-ments over a specified period of time, using a standardizedloan grading process. Based on this process, we assign lossfactors to each pool of graded loans and a loan equivalentamount for unfunded loan commitments and letters of credit.These estimates are then adjusted or supplemented wherenecessary from additional analysis of long term average lossexperience, external loss data, or other risks identified fromcurrent conditions and trends in selected portfolios. Also, weindividually review nonperforming loans over $3 million forimpairment based on cash flows or collateral. We includeimpairment on these nonperforming loans in the allocatedallowance unless it has already been recognized as a loss.
The allocated allowance is supplemented by the unallo-cated allowance to adjust for imprecision and to incorporatethe range of probable outcomes inherent in estimates usedfor the allocated allowance. The unallocated allowance is the result of our judgment of risks inherent in the portfolio,economic uncertainties, historical loss experience and othersubjective factors, including industry trends, not reflected inthe allocated allowance.
The ratios of the allocated allowance and the unallocatedallowance to the total allowance may change from period toperiod. The total allowance reflects management’s estimateof credit losses inherent in the loan portfolio at the balancesheet date.
The allowance for credit losses, and the resulting provision,is based on judgments and assumptions, including:
• general economic conditions;• loan portfolio composition;• loan loss experience;• management’s evaluation of the credit risk relating to
pools of loans and individual borrowers;• sensitivity analysis and expected loss models; and• observations from our internal auditors, internal loan
review staff or banking regulators.To estimate the possible range of allowance required at
December 31, 2005, and the related change in provisionexpense, we assumed the following scenarios of a reasonablypossible deterioration or improvement in loan credit quality.

39
Assumptions for deterioration in loan credit quality were:• for retail loans, a 12 basis point increase in estimated
loss rates from actual 2005 loss levels, moving closer tolonger term average loss rates; and
• for wholesale loans, a 30 basis point increase in esti-mated loss rates, moving closer to historical averages.
Assumptions for improvement in loan credit quality were:• for retail loans, an 8 basis point decrease in estimated
loss rates from actual 2005 loss levels, adjusting forincremental consumer bankruptcy losses; and
• for wholesale loans, no change from the essentially zero2005 net loss performance.
Under the assumptions for deterioration in loan creditquality, another $550 million in expected losses could occurand under the assumptions for improvement, a $170 millionreduction in expected losses could occur.
Changes in the estimate of the allowance for credit losses can materially affect net income. The example above is only one of a number of reasonably possible scenarios.Determining the allowance for credit losses requires us tomake forecasts that are highly uncertain and require a highdegree of judgment.
Valuation of Mortgage Servicing RightsWe recognize as assets the rights to service mortgage loansfor others, or mortgage servicing rights (MSRs), whether wepurchase the servicing rights, or keep them after the sale orsecuritization of loans we originate. Purchased MSRs arecapitalized at cost. Originated MSRs are recorded based onthe relative fair value of the retained servicing right and themortgage loan on the date the mortgage loan is sold. Bothpurchased and originated MSRs are carried at the lower of(1) the capitalized amount, net of accumulated amortizationand hedge accounting adjustments, or (2) fair value. If MSRsare designated as a hedged item in a fair value hedge, theMSRs’ carrying value is adjusted for changes in fair valueresulting from the application of hedge accounting. The carrying value of these MSRs is subject to a fair value testunder FAS 140, Accounting for Transfers and Servicing ofFinancial Assets and Extinguishments of Liabilities.
MSRs are amortized in proportion to and over the periodof estimated net servicing income. We analyze the amortizationof MSRs monthly and adjust amortization to reflect changesin prepayment speeds, discount rates and other factors thataffect estimated net servicing income.
We determine the fair value of MSRs using a valuationmodel that calculates the present value of estimated futurenet servicing income. The model incorporates assumptionsthat market participants use in estimating future net servicingincome, including estimates of prepayment speeds, discountrate, cost to service, escrow account earnings, contractualservicing fee income, ancillary income and late fees. The valuation of MSRs is discussed further in this section and in
Note 1 (Summary of Significant Accounting Policies), Note 20(Securitizations and Variable Interest Entities) and Note 21(Mortgage Banking Activities) to Financial Statements.
At the end of each quarter, we evaluate MSRs for possibleimpairment based on the difference between the carryingamount and current estimated fair value. To evaluate andmeasure impairment, we stratify the portfolio based on certain risk characteristics, including loan type and note rate.If temporary impairment exists, we establish a valuationallowance through a charge to income for those risk stratifications with an excess of amortized cost over the current fair value. If we later determine that all or part ofthe temporary impairment no longer exists for a particularrisk stratification, we may reduce the valuation allowancethrough an increase to income.
Under our policy, we also evaluate other-than-temporaryimpairment of MSRs by considering both historical and pro-jected trends in interest rates, pay-off activity and whetherthe impairment could be recovered through interest rateincreases. We recognize a direct write-down if we determinethat the recoverability of a recorded valuation allowance is remote. A direct write-down permanently reduces the carrying value of the MSRs, while a valuation allowance(temporary impairment) can be reversed.
To reduce the sensitivity of earnings to interest rate andmarket value fluctuations, we hedge the change in value ofMSRs primarily with derivative contracts. Reductions orincreases in the value of the MSRs are generally offset bygains or losses in the value of the derivatives. We immediatelyrecognize a gain or loss for the amount of change in thevalue of MSRs that is not offset by the change in value ofthe hedge instrument (i.e., hedge ineffectiveness). We maychoose not to fully hedge MSRs partly because originationvolume tends to act as a “natural hedge” (for example, asinterest rates decline, servicing values decrease and fees fromorigination volume increase). Conversely, as interest ratesincrease, the value of the MSRs increases, while fees fromorigination volume tend to decline.
Servicing income—net of amortization, provision forimpairment and net derivative gains and losses—is recordedin mortgage banking noninterest income.
We use a dynamic and sophisticated model to estimate the value of our MSRs. Mortgage loan prepayment speed—akey assumption in the model—is the annual rate at whichborrowers are forecasted to repay their mortgage loan principal. The discount rate—another key assumption in the model—is the required rate of return the market wouldexpect for an asset with similar risk. To determine the discountrate, we consider the risk premium for uncertainties fromservicing operations (e.g., possible changes in future servicingcosts, ancillary income and earnings on escrow accounts). Bothassumptions can and generally will change quarterly andannual valuations as market conditions and interest rateschange. Senior management reviews all assumptions quarterly.
40
Our key economic assumptions and the sensitivity of thecurrent fair value of MSRs to an immediate adverse changein those assumptions are shown in Note 20 (Securitizationsand Variable Interest Entities) to Financial Statements.
In recent years, there have been significant market-drivenfluctuations in loan prepayment speeds and the discountrate. These fluctuations can be rapid and may be significantin the future. Therefore, estimating prepayment speeds withina range that market participants would use in determining thefair value of MSRs requires significant management judgment.
Pension AccountingWe use four key variables to calculate our annual pensioncost; size and characteristics of the employee population,actuarial assumptions, expected long-term rate of return onplan assets, and discount rate. We describe below the effectof each of these variables on our pension expense.
SIZE AND CHARACTERISTICS OF THE EMPLOYEE POPULATION
Pension expense is directly related to the number of employ-ees covered by the plans, and other factors including salary,age and years of employment.
ACTUARIAL ASSUMPTIONS
To estimate the projected benefit obligation, actuarialassumptions are required about factors such as the rates ofmortality, turnover, retirement, disability and compensationincreases for our participant population. These demographicassumptions are reviewed periodically. In general, the rangeof assumptions is narrow.
EXPECTED LONG-TERM RATE OF RETURN ON PLAN ASSETS
We determine the expected return on plan assets each yearbased on the composition of assets and the expected long-term rate of return on that portfolio. The expected long-termrate of return assumption is a long-term assumption and isnot anticipated to change significantly from year to year.
To determine if the expected rate of return is reasonable,we consider such factors as (1) the actual return earned onplan assets, (2) historical rates of return on the various assetclasses in the plan portfolio, (3) projections of returns onvarious asset classes, and (4) current/prospective capital mar-ket conditions and economic forecasts. Including 2005, wehave used an expected rate of return of 9% on plan assetsfor the past nine years. In light of the market conditions inrecent years, including a marked increase in volatility, we
reduced the expected long-term rate of return on plan assetsto 8.75% for 2006. Differences in each year, if any, betweenexpected and actual returns are included in our unrecognizednet actuarial gain or loss amount. We generally amortize anyunrecognized net actuarial gain or loss in excess of a 5%corridor (as defined in FAS 87, Employers’ Accounting forPensions) in net periodic pension expense calculations overthe next five years. Our average remaining service period isapproximately 11 years. See Note 15 (Employee Benefits andOther Expenses) to Financial Statements for information onfunding, changes in the pension benefit obligation, and planassets (including the investment categories, asset allocationand the fair value).
We use November 30 as the measurement date for ourpension assets and projected benefit obligations. If we wereto assume a 1% increase/decrease in the expected long-termrate of return, holding the discount rate and other actuarialassumptions constant, pension expense would decrease/increaseby approximately $50 million.
DISCOUNT RATE
We use the discount rate to determine the present value ofour future benefit obligations. It reflects the rates availableon long-term high-quality fixed-income debt instruments,and is reset annually on the measurement date. As the basisfor determining our discount rate, we review the Moody’sAa Corporate Bond Index, on an annualized basis, and therate of a hypothetical portfolio using the Hewitt Yield Curve(HYC) methodology, which was developed by our indepen-dent actuary. The instruments used in both the Moody’s AaCorporate Bond Index and the HYC consist of high qualitybonds for which the timing and amount of cash outflowsapproximates the estimated payouts of our Cash BalancePlan. We lowered our discount rate to 5.75% in 2005 from6% in 2004 and 6.5% in 2003, reflecting the decline in market interest rates during these periods.
If we were to assume a 1% increase in the discount rate,and keep the expected long-term rate of return and otheractuarial assumptions constant, pension expense woulddecrease by approximately $59 million. If we were toassume a 1% decrease in the discount rate, and keep otherassumptions constant, pension expense would increase by approximately $104 million. The decrease in pensionexpense due to a 1% increase in discount rate differs from theincrease in pension expense due to a 1% decrease in discountrate due to the impact of the 5% gain/loss corridor.

41
Earnings Performance
Net Interest IncomeNet interest income is the interest earned on debt securities,loans (including yield-related loan fees) and other interest-earning assets minus the interest paid for deposits and long-term and short-term debt. The net interest margin is theaverage yield on earning assets minus the average interestrate paid for deposits and our other sources of funding. Netinterest income and the net interest margin are presented ona taxable-equivalent basis to consistently reflect income fromtaxable and tax-exempt loans and securities based on a 35%marginal tax rate.
Net interest income on a taxable-equivalent basis was$18.6 billion in 2005, compared with $17.3 billion in 2004,an increase of 8%, reflecting solid loan growth (other thanARMs) and a relatively flat net interest margin.
Our net interest margin was 4.86% for 2005 and 4.89%for 2004. During a year in which the Federal Reserve raisedrates eight times and the yield curve flattened, our net interestmargin remained essentially flat compared with a year ago.Given the prospect of higher short-term interest rates and a flatter yield curve, beginning in second quarter 2004, as part of our asset/liability management strategy, we sold thelowest-yielding ARMs on our balance sheet, replacing someof these loans with higher-yielding ARMs. Over the lastseven quarters, we sold $65 billion in ARMs at an averageyield of 4.28%. As a result, the average yield on our 1-4family first mortgage portfolio—which includes ARMs—increased from 5.19% on an average balance of $89.4 billionin second quarter 2004 to 6.75% on an average balance of $76.2 billion in fourth quarter 2005. At year-end 2005,yields on new ARMs being held for investment within realestate 1-4 family mortgage loans were more than 1% higher
than the average yield on the ARMs sold since second quarter2004. Our net interest margin has performed better than ourpeers’ due to our balance sheet repositioning actions and ourability to grow transaction and savings deposits while main-taining our deposit pricing discipline.
Average earning assets increased $29.2 billion to $383.5 billion in 2005 from $354.3 billion in 2004. Loansaveraged $296.1 billion in 2005, compared with $269.6 billionin 2004. Average mortgages held for sale were $39.0 billionin 2005 and $32.3 billion in 2004. Debt securities availablefor sale averaged $33.1 billion in both 2005 and 2004.
Average core deposits are an important contributor togrowth in net interest income and the net interest margin.This low-cost source of funding rose 9% from 2004. Averagecore deposits were $242.8 billion and $223.4 billion andfunded 54.5% and 54.4% of average total assets in 2005and 2004, respectively. Total average retail core deposits,which exclude Wholesale Banking core deposits and retailmortgage escrow deposits, for 2005 grew $18.2 billion, or 10%, from a year ago. Average mortgage escrow deposits were $16.7 billion in 2005 and $14.1 billion in2004. Savings certificates of deposits increased on averagefrom $18.9 billion in 2004 to $22.6 billion in 2005 and noninterest-bearing checking accounts and other core deposit categories increased on average from $204.5 billionin 2004 to $220.1 billion in 2005. Total average interest-bearing deposits increased to $194.6 billion in 2005 from$182.6 billion a year ago. Total average noninterest-bearingdeposits increased to $87.2 billion in 2005 from $79.3 billiona year ago.
Table 3 presents the individual components of net interestincome and the net interest margin.

42
Table 3: Average Balances, Yields and Rates Paid (Taxable-Equivalent Basis) (1)(2)
(in millions) 2005 2004Average Yields/ Interest Average Yields/ Interestbalance rates income/ balance rates income/
expense expense
EARNING ASSETSFederal funds sold, securities purchased under
resale agreements and other short-term investments $ 5,448 3.01% $ 164 $ 4,254 1.49% $ 64Trading assets 5,411 3.52 190 5,286 2.75 145Debt securities available for sale (3):
Securities of U.S. Treasury and federal agencies 997 3.81 38 1,161 4.05 46Securities of U.S. states and political subdivisions 3,395 8.27 266 3,501 8.00 267Mortgage-backed securities:
Federal agencies 19,768 6.02 1,162 21,404 6.03 1,248Private collateralized mortgage obligations 5,128 5.60 283 3,604 5.16 180
Total mortgage-backed securities 24,896 5.94 1,445 25,008 5.91 1,428Other debt securities (4) 3,846 7.10 266 3,395 7.72 236
Total debt securities available for sale (4) 33,134 6.24 2,015 33,065 6.24 1,977Mortgages held for sale (3) 38,986 5.67 2,213 32,263 5.38 1,737Loans held for sale (3) 2,857 5.10 146 8,201 3.56 292Loans:
Commercial and commercial real estate:Commercial 58,434 6.76 3,951 49,365 5.77 2,848Other real estate mortgage 29,098 6.31 1,836 28,708 5.35 1,535Real estate construction 11,086 6.67 740 8,724 5.30 463Lease financing 5,226 5.91 309 5,068 6.23 316
Total commercial and commercial real estate 103,844 6.58 6,836 91,865 5.62 5,162Consumer:
Real estate 1-4 family first mortgage 78,170 6.42 5,016 87,700 5.44 4,772Real estate 1-4 family junior lien mortgage 55,616 6.61 3,679 44,415 5.18 2,300Credit card 10,663 12.33 1,315 8,878 11.80 1,048Other revolving credit and installment 43,102 8.80 3,794 33,528 9.01 3,022
Total consumer 187,551 7.36 13,804 174,521 6.38 11,142Foreign 4,711 13.49 636 3,184 15.30 487
Total loans (5) 296,106 7.19 21,276 269,570 6.23 16,791Other 1,581 4.34 68 1,709 3.81 65
Total earning assets $383,523 6.81 26,072 $354,348 5.97 21,071
FUNDING SOURCESDeposits:
Interest-bearing checking $ 3,607 1.43 51 $ 3,059 .44 13Market rate and other savings 129,291 1.45 1,874 122,129 .69 838Savings certificates 22,638 2.90 656 18,850 2.26 425Other time deposits 27,676 3.29 910 29,750 1.43 427Deposits in foreign offices 11,432 3.12 357 8,843 1.40 124
Total interest-bearing deposits 194,644 1.98 3,848 182,631 1.00 1,827Short-term borrowings 24,074 3.09 744 26,130 1.35 353Long-term debt 79,137 3.62 2,866 67,898 2.41 1,637Guaranteed preferred beneficial interests in Company’s
subordinated debentures (6) — — — — — —Total interest-bearing liabilities 297,855 2.50 7,458 276,659 1.38 3,817
Portion of noninterest-bearing funding sources 85,668 — — 77,689 — —
Total funding sources $383,523 1.95 7,458 $354,348 1.08 3,817
Net interest margin and net interest income ona taxable-equivalent basis (7) 4.86% $18,614 4.89% $17,254
NONINTEREST-EARNING ASSETSCash and due from banks $ 13,173 $ 13,055Goodwill 10,705 10,418Other 38,389 32,758
Total noninterest-earning assets $ 62,267 $ 56,231
NONINTEREST-BEARING FUNDING SOURCESDeposits $ 87,218 $ 79,321Other liabilities 21,559 18,764Stockholders’ equity 39,158 35,835Noninterest-bearing funding sources used to
fund earning assets (85,668) (77,689)Net noninterest-bearing funding sources $ 62,267 $ 56,231
TOTAL ASSETS $445,790 $410,579
(1) Our average prime rate was 6.19%, 4.34%, 4.12%, 4.68% and 6.91% for 2005, 2004, 2003, 2002 and 2001, respectively. The average three-month London InterbankOffered Rate (LIBOR) was 3.56%, 1.62%, 1.22%, 1.80% and 3.78% for the same years, respectively.
(2) Interest rates and amounts include the effects of hedge and risk management activities associated with the respective asset and liability categories.(3) Yields are based on amortized cost balances computed on a settlement date basis.(4) Includes certain preferred securities.

43
2003 2002 2001Average Yields/ Interest Average Yields/ Interest Average Yields/ Interestbalance rates income/ balance rates income/ balance rates income/
expense expense expense
$ 4,174 1.16% $ 49 $ 2,961 1.73% $ 51 $ 2,741 3.72% $ 1026,110 2.56 156 4,747 3.58 169 2,580 4.44 115
1,286 4.74 58 1,770 5.57 95 2,158 6.55 1372,424 8.62 196 2,106 8.33 167 2,026 7.98 154
18,283 7.37 1,276 26,718 7.23 1,856 27,433 7.19 1,917 2,001 6.24 120 2,341 7.18 163 1,766 8.55 148
20,284 7.26 1,396 29,059 7.22 2,019 29,199 7.27 2,065 3,302 7.75 240 3,029 7.74 232 3,343 7.80 254
27,296 7.32 1,890 35,964 7.25 2,513 36,726 7.32 2,61058,672 5.34 3,136 39,858 6.13 2,450 23,677 6.72 1,595
7,142 3.51 251 5,380 4.69 252 4,820 6.58 317
47,279 6.08 2,876 46,520 6.80 3,164 48,648 8.01 3,89625,846 5.44 1,405 25,413 6.17 1,568 24,194 7.99 1,934
7,954 5.11 406 7,925 5.69 451 8,073 8.10 654 4,453 6.22 277 4,079 6.32 258 4,024 6.90 278
85,532 5.80 4,964 83,937 6.48 5,441 84,939 7.96 6,762
56,252 5.54 3,115 32,669 6.69 2,185 23,359 7.54 1,76131,670 5.80 1,836 25,220 7.07 1,783 17,587 9.20 1,619
7,640 12.06 922 6,810 12.27 836 6,270 13.36 838 29,838 9.09 2,713 24,072 10.28 2,475 23,459 11.40 2,674125,400 6.85 8,586 88,771 8.20 7,279 70,675 9.75 6,892 2,200 18.00 396 1,774 18.90 335 1,603 20.82 333213,132 6.54 13,946 174,482 7.48 13,055 157,217 8.90 13,987 1,626 4.57 74 1,436 4.87 72 1,262 5.50 69
$318,152 6.16 19,502 $264,828 7.04 18,562 $229,023 8.24 18,795
$ 2,571 .27 7 $ 2,494 .55 14 $ 2,178 1.59 35106,733 .66 705 93,787 .95 893 80,585 2.08 1,675
20,927 2.53 529 24,278 3.21 780 29,850 5.13 1,53025,388 1.20 305 8,191 1.86 153 1,332 5.04 67
6,060 1.11 67 5,011 1.58 79 6,209 3.96 246161,679 1.00 1,613 133,761 1.43 1,919 120,154 2.96 3,553
29,898 1.08 322 33,278 1.61 536 33,885 3.76 1,27353,823 2.52 1,355 42,158 3.33 1,404 34,501 5.29 1,826
3,306 3.66 121 2,780 4.23 118 1,394 6.40 89248,706 1.37 3,411 211,977 1.88 3,977 189,934 3.55 6,741 69,446 — — 52,851 — — 39,089 — —
$318,152 1.08 3,411 $264,828 1.51 3,977 $229,023 2.95 6,741
5.08% $16,091 5.53% $14,585 5.29% $12,054
$ 13,433 $ 13,820 $ 14,6089,905 9,737 9,514
36,123 33,340 32,222
$ 59,461 $ 56,897 $ 56,344
$ 76,815 $ 63,574 $ 55,33320,030 17,054 13,21432,062 29,120 26,886
(69,446) (52,851) (39,089)$ 59,461 $ 56,897 $ 56,344
$377,613 $321,725 $285,367
(5) Nonaccrual loans and related income are included in their respective loan categories.(6) At December 31, 2003, upon adoption of FIN 46 (revised December 2003), Consolidation of Variable Interest Entities (FIN 46R), these balances were reflected in
long-term debt. See Note 12 (Long-Term Debt) to Financial Statements for more information.(7) Includes taxable-equivalent adjustments primarily related to tax-exempt income on certain loans and securities. The federal statutory tax rate was 35% for all
years presented.

44
We earn trust, investment and IRA fees from managing andadministering assets, including mutual funds, corporate trust,personal trust, employee benefit trust and agency assets. AtDecember 31, 2005, these assets totaled $783 billion, up 11%from $705 billion at December 31, 2004. At December 31, 2004,we acquired $24 billion in mutual fund assets and $5 billionin institutional investment accounts from Strong FinancialCorporation (Strong Financial). When the Wells FargoFunds® and certain Strong Financial funds merged in April2005, we renamed our mutual fund family the Wells FargoAdvantage FundsSM. Generally, trust, investment and IRAfees are based on the market value of the assets that aremanaged, administered, or both. The increase in these feeswas due to additional revenue from the December 31, 2004,acquisition of assets from the Strong Financial transactionand our successful efforts to grow our investment businesses.
Also, we receive commissions and other fees for providingservices for retail and discount brokerage customers. AtDecember 31, 2005 and 2004, brokerage balances were $97 billion and $86 billion, respectively. Generally, these fees are based on the number of transactions executed at the customer’s direction.
Card fees increased 19% to $1,458 million in 2005 from$1,230 million in 2004, predominantly due to increases in creditcard accounts and credit and debit card transaction volume.
Mortgage banking noninterest income increased to$2,422 million in 2005 from $1,860 million in 2004, due toan increase in net gains on mortgage loan origination/salesactivities partly offset by the decline in net servicing income.
Net gains on mortgage loan origination/sales activitieswere $1,085 million in 2005, up from $539 million in 2004,primarily due to higher origination volume. Originations were$366 billion in 2005 and $298 billion in 2004. The 1-4 familyfirst mortgage unclosed pipeline was $50 billion at bothyear-end 2005 and 2004.
Net servicing income was $987 million in 2005 comparedwith $1,037 million in 2004. Servicing income includes netderivative gains and losses and is net of amortization andimpairment of MSRs, which are all influenced by both thelevel and direction of mortgage interest rates. The Company’sportfolio of loans serviced for others was $871 billion atDecember 31, 2005, up 27% from $688 billion at year-end2004. Given a larger servicing portfolio year over year, the increase in servicing income was partly offset by higheramortization of MSRs. Servicing fees increased to $2,457 million in 2005 from $2,101 million in 2004 andamortization of MSRs increased to $1,991 million in 2005from $1,826 million in 2004. Servicing income in 2005 also included a higher MSRs valuation allowance release of$378 million in 2005 compared with $208 million in 2004,due to higher long-term interest rates in certain quarters of 2005. The increase in fee revenue and the higher MSRsvaluation allowance release were mostly offset by thedecrease in net derivative gains to $143 million in 2005 from $554 million in 2004.
Net losses on debt securities were $120 million for 2005,compared with $15 million for 2004. Net gains from equityinvestments were $511 million in 2005, compared with $394 million in 2004, primarily reflecting the continuedstrong performance of our venture capital business.
We routinely review our investment portfolios and recognizeimpairment write-downs based primarily on issuer-specificfactors and results, and our intent to hold such securities. We also consider general economic and market conditions,including industries in which venture capital investments are made, and adverse changes affecting the availability ofventure capital. We determine impairment based on all of theinformation available at the time of the assessment, but newinformation or economic developments in the future couldresult in recognition of additional impairment.
Noninterest Income
Table 4: Noninterest Income
(in millions) Year ended December 31, ___% Change2005 2004 2003 2005/ 2004/
2004 2003
Service charges on deposit accounts $ 2,512 $ 2,417 $ 2,297 4% 5%
Trust and investment fees:Trust, investment and IRA fees 1,855 1,509 1,345 23 12Commissions and all other fees 581 607 592 (4) 3
Total trust and investment fees 2,436 2,116 1,937 15 9
Card fees 1,458 1,230 1,079 19 14
Other fees:Cash network fees 180 180 179 — 1Charges and fees on loans 1,022 921 756 11 22All other 727 678 625 7 8
Total other fees 1,929 1,779 1,560 8 14
Mortgage banking:Servicing income,net of amortization
and provision for impairment 987 1,037 (954) (5) —Net gains on mortgage loan
origination/sales activities 1,085 539 3,019 101 (82)All other 350 284 447 23 (36)
Total mortgage banking 2,422 1,860 2,512 30 (26)
Operating leases 812 836 937 (3) (11)Insurance 1,215 1,193 1,071 2 11Trading assets 571 523 502 9 4Net gains (losses) on debt
securities available for sale (120) (15) 4 700 —Net gains from
equity investments 511 394 55 30 616Net gains on sales of loans 5 11 28 (55) (61)Net gains (losses) on dispositions
of operations 14 (15) 29 — —All other 680 580 371 17 56
Total $14,445 $12,909 $12,382 12 4
45
Noninterest expense in 2005 increased 8% to $19.0 billionfrom $17.6 billion in 2004, primarily due to increased mort-gage production and continued investments in new storesand additional sales-related team members. Noninterestexpense in 2005 included a $117 million expense to adjustthe estimated lives for certain depreciable assets, primarilybuilding improvements, $62 million of airline lease write-downs, $56 million of integration expense and $25 millionfor the adoption of FIN 47, which relates to recognition of obligations associated with the retirement of long-livedassets, such as building and leasehold improvements. HomeMortgage expenses increased $426 million from 2004,reflecting higher production costs from an increase in loanorigination volume. For 2004, employee benefits included a $44 million special 401(k) contribution and charitabledonations included a $217 million contribution to the Wells Fargo Foundation.
See “Current Accounting Developments” for informationon accounting for share-based awards, such as stock optiongrants. On January 1, 2006, we adopted FAS 123R, whichrequires that we include the cost of such grants in ourincome statement over the vesting period of the award.
Income Tax ExpenseOur effective income tax rate for 2005 decreased to 33.57%from 34.87% for 2004, due primarily to higher tax-exemptincome and income tax credits, and the tax benefit associatedwith our donation of appreciated securities.
Noninterest Expense Operating Segment ResultsOur lines of business for management reporting are CommunityBanking, Wholesale Banking and Wells Fargo Financial. For a more complete description of our operating segments,including additional financial information and the underlyingmanagement accounting process, see Note 19 (OperatingSegments) to Financial Statements.
COMMUNITY BANKING’S net income increased 13% to $5.5 billion in 2005 from $4.9 billion in 2004. Total revenue for 2005 increased 9%, driven by loan and depositgrowth and higher mortgage origination volumes. The provision for credit losses for 2005 increased $108 million,or 14%, reflecting incremental consumer bankruptcy filingsbefore the mid-October legislative reform. Noninterestexpense for 2005 increased $982 million, or 8%, driven by mortgage production, growth in other businesses, andinvestments in new stores, sales staff and technology.Average loans were $187.0 billion in 2005, up 5% from$178.9 billion in 2004.
WHOLESALE BANKING’S net income was a record $1.73 billionin 2005, up 8% from $1.60 billion in 2004, driven largely by a 15% increase in earning assets, as well as very low loanlosses. Average loans increased 17% to $62.2 billion in 2005from $53.1 billion in 2004, with double-digit increasesacross wholesale lending businesses. The provision for creditlosses decreased to $1 million in 2005 from $62 million in2004, with loan charge-offs at very low levels throughout2005. Noninterest income increased 13% to $3.4 billion in 2005 from $3.0 billion in 2004, largely due to the Strong Financial acquisition completed at the end of 2004.Noninterest expense increased 16% to $3.17 billion in 2005from $2.73 billion in 2004, due to the Strong Financial acquisition and airline lease writedowns.
WELLS FARGO FINANCIAL’S net income decreased 34% to $409 million in 2005 from $617 million in 2004. Netincome was reduced by incremental bankruptcies related to the change in bankruptcy law and the $163 million firstquarter 2005 initial implementation of conforming to morestringent FFIEC charge-off timing rules. Also, a $100 millionprovision for credit losses was taken in third quarter 2005for estimated losses from Hurricane Katrina. Total revenuerose 12% in 2005, reaching $4.7 billion, compared with$4.2 billion in 2004, due to higher net interest income.Noninterest expense increased $202 million, or 9%, in 2005from 2004, reflecting investments in new consumer financestores and additional team members.
Segment results for prior periods have been revised due to the realignment of our automobile financing businessesinto Wells Fargo Financial in 2005, designed to leverage theexpertise, systems and resources of the existing businesses.
Table 5: Noninterest Expense
(in millions) Year ended December 31, _ _ % Change2005 2004 2003 2005/ 2004/
2004 2003
Salaries $ 6,215 $ 5,393 $ 4,832 15% 12%Incentive compensation 2,366 1,807 2,054 31 (12)Employee benefits 1,874 1,724 1,560 9 11Equipment 1,267 1,236 1,246 3 (1)Net occupancy 1,412 1,208 1,177 17 3Operating leases 635 633 702 — (10)Outside professional services 835 669 509 25 31Contract services 596 626 866 (5) (28)Travel and entertainment 481 442 389 9 14Outside data processing 449 418 404 7 3Advertising and promotion 443 459 392 (3) 17Postage 281 269 336 4 (20)Telecommunications 278 296 343 (6) (14)Insurance 224 247 197 (9) 25Stationery and supplies 205 240 241 (15) —Operating losses 194 192 193 1 (1)Security 167 161 163 4 (1)Core deposit intangibles 123 134 142 (8) (6)Charitable donations 61 248 237 (75) 5Net losses from debt
extinguishment 11 174 — (94) —All other 901 997 1,207 (10) (17)
Total $19,018 $17,573 $17,190 8 2

46
Balance Sheet Analysis
Table 6: Mortgage-Backed Securities
(in billions) Fair Net unrealized Remainingvalue gain (loss) maturity
At December 31, 2005 $32.4 $ .4 5.3 yrs.
At December 31, 2005,assuming a 200 basis point:Increase in interest rates 29.9 (2.1) 7.5 yrs.Decrease in interest rates 33.5 1.5 2.0 yrs.
Table 8: Deposits
(in millions) December 31, %2005 2004 Change
Noninterest-bearing $ 87,712 $ 81,082 8%Interest-bearing checking 3,324 3,122 6Market rate and
other savings 134,811 126,648 6Savings certificates 27,494 18,851 46
Core deposits 253,341 229,703 10Other time deposits 46,488 36,622 27Deposits in foreign offices 14,621 8,533 71
Total deposits $314,450 $274,858 14
Table 7: Maturities for Selected Loan Categories
(in millions) December 31, 2005Within After After Total
one one year fiveyear through years
fiveyears
Selected loan maturities:Commercial $18,748 $31,627 $11,177 $ 61,552Other real estate mortgage 3,763 11,777 13,005 28,545Real estate construction 5,081 6,887 1,438 13,406Foreign 525 3,995 1,032 5,552
Total selected loans $28,117 $54,286 $26,652 $109,055
Sensitivity of loans due after one year to changes in interest rates:Loans at fixed interest rates $11,145 $ 7,453Loans at floating/variable
interest rates 43,141 19,199Total selected loans $54,286 $26,652
2005 from $32.3 billion in 2004, due to higher originationvolume. Residential mortgage originations of $366 billionwere up 23% from $298 billion in 2004. Loans held for sale decreased to $612 million at December 31, 2005, from$8.7 billion a year ago, due to the transfer of student loansheld for sale to the held for investment portfolio. Our decisionto hold these loans for investment was based on present yieldsand our intent and ability to hold this portfolio for the foreseeable future.
Table 7 shows contractual loan maturities and interestrate sensitivities for selected loan categories.
DepositsYear-end deposit balances are in Table 8. Comparative detail of average deposit balances is included in Table 3.Average core deposits funded 54.5% and 54.4% of averagetotal assets in 2005 and 2004, respectively. Total averageinterest-bearing deposits rose from $182.6 billion in 2004 to $194.6 billion in 2005. Total average noninterest-bearingdeposits rose from $79.3 billion in 2004 to $87.2 billion in 2005. Savings certificates increased on average from $18.9 billion in 2004 to $22.6 billion in 2005.
Securities Available for SaleOur securities available for sale portfolio consists of bothdebt and marketable equity securities. We hold debt securities available for sale primarily for liquidity, interestrate risk management and yield enhancement. Accordingly,this portfolio primarily includes very liquid, high-qualityfederal agency debt securities. At December 31, 2005, we held$40.9 billion of debt securities available for sale, comparedwith $33.0 billion at December 31, 2004, with a net unrealizedgain of $591 million and $1.2 billion for the same periods,respectively. We also held $900 million of marketable equitysecurities available for sale at December 31, 2005, and$696 million at December 31, 2004, with a net unrealizedgain of $342 million and $189 million for the same periods, respectively.
The weighted-average expected maturity of debt securitiesavailable for sale was 5.9 years at December 31, 2005. Since79% of this portfolio is mortgage-backed securities, theexpected remaining maturity may differ from contractualmaturity because borrowers may have the right to prepayobligations before the underlying mortgages mature.
The estimated effect of a 200 basis point increase ordecrease in interest rates on the fair value and the expectedremaining maturity of the mortgage-backed securities available for sale portfolio is shown in Table 6.
See Note 5 (Securities Available for Sale) to FinancialStatements for securities available for sale by security type.
Loan PortfolioA comparative schedule of average loan balances is includedin Table 3; year-end balances are in Note 6 (Loans andAllowance for Credit Losses) to Financial Statements.
Loans averaged $296.1 billion in 2005, compared with$269.6 billion in 2004, an increase of 10%. Total loans atDecember 31, 2005, were $310.8 billion, compared with$287.6 billion at year-end 2004, an increase of 8%. Average1-4 family first mortgages decreased $9.5 billion, or 11%,and average junior liens increased $11.2 billion, or 25%, in2005 compared with a year ago. Average commercial andcommercial real estate loans increased $12.0 billion, or 13%,in 2005 compared with a year ago. Average mortgages heldfor sale increased $6.7 billion, or 21%, to $39.0 billion in

47
Off-Balance Sheet Arrangements and Aggregate Contractual Obligations
Off-Balance Sheet Arrangements, Variable InterestEntities, Guarantees and Other CommitmentsWe consolidate our majority-owned subsidiaries and sub-sidiaries in which we are the primary beneficiary. Generally,we use the equity method of accounting if we own at least20% of an entity and we carry the investment at cost if weown less than 20% of an entity. See Note 1 (Summary ofSignificant Accounting Policies) to Financial Statements forour consolidation policy.
In the ordinary course of business, we engage in financialtransactions that are not recorded on the balance sheet, ormay be recorded on the balance sheet in amounts that aredifferent than the full contract or notional amount of thetransaction. These transactions are designed to (1) meet thefinancial needs of customers, (2) manage our credit, marketor liquidity risks, (3) diversify our funding sources or (4) optimize capital, and are accounted for in accordancewith U.S. generally accepted accounting principles (GAAP).
Almost all of our off-balance sheet arrangements resultfrom securitizations. We routinely securitize home mortgageloans and, from time to time, other financial assets, includingstudent loans, commercial mortgages and automobile receiv-ables. We normally structure loan securitizations as sales, in accordance with FAS 140. This involves the transfer offinancial assets to certain qualifying special-purpose entitiesthat we are not required to consolidate. In a securitization,we can convert the assets into cash earlier than if we held the assets to maturity. Special-purpose entities used in thesetypes of securitizations obtain cash to acquire assets by issuing securities to investors. In a securitization, we record a liability related to standard representations and warrantieswe make to purchasers and issuers for receivables transferred.Also, we generally retain the right to service the transferredreceivables and to repurchase those receivables from the special-purpose entity if the outstanding balance of thereceivable falls to a level where the cost exceeds the benefitsof servicing such receivables.
At December 31, 2005, securitization arrangementssponsored by the Company consisted of $121 billion insecuritized loan receivables, including $75 billion of homemortgage loans. At December 31, 2005, the retained servicingrights and other beneficial interests related to these securiti-zations were $4,426 million, consisting of $3,501 million insecurities, $784 million in servicing assets and $141 millionin other retained interests. Related to our securitizations, we have committed to provide up to $40 million in credit enhancements.
We also hold variable interests greater than 20% but less than 50% in certain special-purpose entities formed toprovide affordable housing and to securitize corporate debt that had approximately $3 billion in total assets atDecember 31, 2005. We are not required to consolidate
these entities. Our maximum exposure to loss as a result ofour involvement with these unconsolidated variable interestentities was approximately $870 million at December 31, 2005,predominantly representing investments in entities formed toinvest in affordable housing. We, however, expect to recoverour investment over time primarily through realization offederal low-income housing tax credits.
For more information on securitizations including salesproceeds and cash flows from securitizations, see Note 20(Securitizations and Variable Interest Entities) to FinancialStatements.
Home Mortgage, in the ordinary course of business, origi-nates a portion of its mortgage loans through unconsolidatedjoint ventures in which we own an interest of 50% or less.Loans made by these joint ventures are funded by Wells FargoBank, N.A., or an affiliated entity, through an established lineof credit and are subject to specified underwriting criteria. At December 31, 2005, the total assets of these mortgageorigination joint ventures were approximately $55 million.We provide liquidity to these joint ventures in the form ofoutstanding lines of credit and, at December 31, 2005, theseliquidity commitments totaled $358 million.
We also hold interests in other unconsolidated joint ventures formed with unrelated third parties to provide efficiencies from economies of scale. A third party managesour real estate lending services joint ventures and providescustomers title, escrow, appraisal and other real estate relatedservices. Our merchant services joint venture includes creditcard processing and related activities. At December 31, 2005,total assets of our real estate lending and merchant servicesjoint ventures were approximately $715 million.
When we acquire brokerage, asset management andinsurance agencies, the terms of the acquisitions may providefor deferred payments or additional consideration, based on certain performance targets. At December 31, 2005, theamount of contingent consideration we expected to pay wasnot significant to our financial statements.
As a financial services provider, we routinely commit toextend credit, including loan commitments, standby letters of credit and financial guarantees. A significant portion ofcommitments to extend credit may expire without being drawnupon. These commitments are subject to the same creditpolicies and approval process used for our loans. For moreinformation, see Note 6 (Loans and Allowance for CreditLosses) and Note 24 (Guarantees) to Financial Statements.
In our venture capital and capital markets businesses, wecommit to fund equity investments directly to investmentfunds and to specific private companies. The timing of futurecash requirements to fund these commitments generallydepends on the venture capital investment cycle, the periodover which privately-held companies are funded by venturecapital investors and ultimately sold or taken public. This

48
Table 9: Contractual Obligations
(in millions) Note(s) to Less than 1-3 3-5 More than Indeterminate TotalFinancial Statements 1 year years years 5 years maturity (1)
Contractual payments by period:
Deposits 10 $80,461 $ 5,785 $ 1,307 $ 231 $226,666 $314,450Long-term debt (2) 7, 12 11,124 27,704 15,869 24,971 — 79,668Operating leases 7 514 786 535 898 — 2,733Purchase obligations (3) 548 244 28 — — 820Total contractual obligations $92,647 $34,519 $17,739 $26,100 $226,666 $397,671
(1) Represents interest-bearing and noninterest-bearing checking, market rate and other savings accounts.(2) Includes capital leases of $14 million.(3) Represents agreements to purchase goods or services.
cycle can vary based on market conditions and the industryin which the companies operate. We expect that many ofthese investments will become public, or otherwise becomeliquid, before the balance of unfunded equity commitmentsis used. At December 31, 2005, these commitments wereapproximately $650 million. Our other investment commit-ments, principally related to affordable housing, civic andother community development initiatives, were approximately$465 million at December 31, 2005.
In the ordinary course of business, we enter into indem-nification agreements, including underwriting agreementsrelating to offers and sales of our securities, acquisitionagreements, and various other business transactions orarrangements, such as relationships arising from service as a director or officer of the Company. For more information,see Note 24 (Guarantees) to Financial Statements.
Contractual Obligations In addition to the contractual commitments and arrange-ments described above, which, depending on the nature ofthe obligation, may or may not require use of our resources,we enter into other contractual obligations in the ordinarycourse of business, including debt issuances for the fundingof operations and leases for premises and equipment.
Table 9 summarizes these contractual obligations atDecember 31, 2005, except obligations for short-term borrowing arrangements and pension and postretirementbenefit plans. More information on these obligations is inNote 11 (Short-Term Borrowings) and Note 15 (EmployeeBenefits and Other Expenses) to Financial Statements. Thetable also excludes other commitments more fully describedunder “Off-Balance Sheet Arrangements, Variable InterestEntities, Guarantees and Other Commitments.”
We enter into derivatives, which create contractual obligations, as part of our interest rate risk managementprocess, for our customers or for other trading activities. See “Asset/Liability and Market Risk Management” in thisreport and Note 26 (Derivatives) to Financial Statements formore information.
Transactions with Related PartiesFAS 57, Related Party Disclosures, requires disclosure ofmaterial related party transactions, other than compensationarrangements, expense allowances and other similar items inthe ordinary course of business. The Company had no relatedparty transactions required to be reported under FAS 57 forthe years ended December 31, 2005, 2004 and 2003.

49
Credit Risk Management ProcessOur credit risk management process provides for decentral-ized management and accountability by our lines of business.Our overall credit process includes comprehensive creditpolicies, frequent and detailed risk measurement and model-ing, extensive credit training programs and a continual loanaudit review process. In addition, regulatory examinersreview and perform detailed tests of our credit underwriting,loan administration and allowance processes.
Managing credit risk is a company-wide process. We havecredit policies for all banking and nonbanking operationsincurring credit risk with customers or counterparties thatprovide a consistent, prudent approach to credit risk man-agement. We use detailed tracking and analysis to measurecredit performance and exception rates and we routinelyreview and modify credit policies as appropriate. We havecorporate data integrity standards to ensure accurate andcomplete credit performance reporting. We strive to identifyproblem loans early and have dedicated, specialized collec-tion and work-out units.
The Chief Credit Officer, who reports directly to theChief Executive Officer, provides company-wide credit over-sight. Each business unit with direct credit risks has a creditofficer and has the primary responsibility for managing itsown credit risk. The Chief Credit Officer delegates authority,limits and other requirements to the business units. Thesedelegations are routinely reviewed and amended if there aresignificant changes in personnel, credit performance, or busi-ness requirements. The Chief Credit Officer is a member ofthe Company’s Management Committee.
Our business units and the office of the Chief CreditOfficer periodically review all credit risk portfolios to ensurethat the risk identification processes are functioning properlyand that credit standards are followed. Business units con-duct quality assurance reviews to ensure that loans meetportfolio or investor credit standards. Our loan examinersand internal auditors also independently review portfolioswith credit risk.
Our primary business focus in middle-market commercialand residential real estate, auto and small consumer lending,results in portfolio diversification. We ensure that we useappropriate methods to understand and underwrite risk.
In our wholesale portfolios, larger or more complex loansare individually underwritten and judgmentally risk rated.They are periodically monitored and prompt correctiveactions are taken on deteriorating loans. Smaller, morehomogeneous loans are approved and monitored using statistical techniques.
Retail loans are typically underwritten with statisticaldecision-making tools and are managed throughout their lifecycle on a portfolio basis. The Chief Credit Officer establishescorporate standards for model development and validationto ensure sound credit decisions and regulatory compliance.
Each business unit completes quarterly asset quality fore-casts to quantify its intermediate-term outlook for loan lossesand recoveries, nonperforming loans and market trends. Tomake sure our overall allowance for credit losses is adequatewe conduct periodic stress tests. This includes a portfolio losssimulation model that simulates a range of possible losses for various sub-portfolios assuming various trends in loanquality. We assess loan portfolios for geographic, industry, or other concentrations and use mitigation strategies, whichmay include loan sales, syndications or third party insurance,to minimize these concentrations, as we deem necessary.
We routinely review and evaluate risks that are not borrower specific but that may influence the behavior of aparticular credit, group of credits or entire sub-portfolios. Wealso assess risk for particular industries, geographic locationssuch as states or Metropolitan Statistical Areas (MSAs) andspecific macroeconomic trends.
NONACCRUAL LOANS AND OTHER ASSETS
Table 10 shows the five-year trend for nonaccrual loans and other assets. We generally place loans on nonaccrual status when:
• the full and timely collection of interest or principalbecomes uncertain;
• they are 90 days (120 days with respect to real estate1-4 family first and junior lien mortgages) past due forinterest or principal (unless both well-secured and inthe process of collection); or
• part of the principal balance has been charged off. Note 1 (Summary of Significant Accounting Policies) to
Financial Statements describes our accounting policy fornonaccrual loans.
The decrease in nonaccrual loans was primarily due to payoffs of commercial and commercial real estate nonaccrual loans.
We expect that the amount of nonaccrual loans willchange due to portfolio growth, portfolio seasoning, routineproblem loan recognition and resolution through collections,sales or charge-offs. The performance of any one loan can be affected by external factors, such as economic conditions,or factors particular to a borrower, such as actions of a borrower’s management.
If interest due on the book balances of all nonaccrualloans (including loans that were but are no longer on nonac-crual at year end) had been accrued under the original terms,approximately $85 million of interest would have beenrecorded in 2005, compared with payments of $35 millionrecorded as interest income.
Most of the foreclosed assets at December 31, 2005, havebeen in the portfolio one year or less.
Risk Management

50
LOANS 90 DAYS OR MORE PAST DUE AND STILL ACCRUING
Loans in this category are 90 days or more past due as tointerest or principal and still accruing, because they are (1) well-secured and in the process of collection or (2) realestate 1-4 family first mortgage loans or consumer loans exemptunder regulatory rules from being classified as nonaccrual.
The total of loans 90 days or more past due and stillaccruing was $3,606 million, $2,578 million, $2,337 million,$672 million and $698 million at December 31, 2005, 2004,2003, 2002 and 2001, respectively. At December 31, 2005, 2004,and 2003, the total included $2,923 million, $1,820 millionand $1,641 million, respectively, in advances pursuant toour servicing agreements to Government National MortgageAssociation (GNMA) mortgage pools whose repayments areinsured by the Federal Housing Administration or guaranteedby the Department of Veterans Affairs. Before clarifyingguidance issued in 2003 as to classification as loans, GNMAadvances were included in other assets. Table 11 providesdetail by loan category excluding GNMA advances.
Table 11: Loans 90 Days or More Past Due and Still Accruing(Excluding Insured/Guaranteed GNMA Advances)
(in millions) December 31,2005 2004 2003 2002 2001
Commercial and commercial real estate:Commercial $ 18 $ 26 $ 87 $ 92 $ 60Other real estate
mortgage 13 6 9 7 22Real estate construction 9 6 6 11 47
Total commercialand commercial real estate 40 38 102 110 129
Consumer:Real estate
1-4 family first mortgage 103 148 117 104 145
Real estate 1-4 family junior lien mortgage 50 40 29 18 17
Credit card 159 150 134 130 116Other revolving credit
and installment 290 306 271 282 268Total consumer 602 644 551 534 546
Foreign 41 76 43 28 23
Total $683 $758 $696 $672 $698
Table 10: Nonaccrual Loans and Other Assets
(in millions) December 31,2005 2004 2003 2002 2001
Nonaccrual loans:Commercial and commercial real estate:
Commercial $ 286 $ 345 $ 592 $ 796 $ 827Other real estate mortgage 165 229 285 192 210Real estate construction 31 57 56 93 145Lease financing 45 68 73 79 163
Total commercial and commercial real estate 527 699 1,006 1,160 1,345Consumer:
Real estate 1-4 family first mortgage 471 386 274 230 205Real estate 1-4 family junior lien mortgage 144 92 87 49 22Other revolving credit and installment 171 160 88 48 59
Total consumer 786 638 449 327 286Foreign 25 21 3 5 9
Total nonaccrual loans (1) 1,338 1,358 1,458 1,492 1,640As a percentage of total loans .43% .47% .58% .78% .98%
Foreclosed assets 191 212 198 195 160Real estate investments (2) 2 2 6 4 2
Total nonaccrual loans and other assets $1,531 $1,572 $1,662 $1,691 $1,802
As a percentage of total loans .49% .55% .66% .88% 1.08%
(1) Includes impaired loans of $190 million, $309 million, $629 million, $612 million and $823 million at December 31, 2005, 2004, 2003, 2002 and 2001, respectively.(See Note 1 (Summary of Significant Accounting Policies) and Note 6 (Loans and Allowance for Credit Losses) to Financial Statements for further discussion of impaired loans.)
(2) Real estate investments (contingent interest loans accounted for as investments) that would be classified as nonaccrual if these assets were recorded as loans.Real estate investments totaled $84 million, $4 million, $9 million, $9 million and $24 million at December 31, 2005, 2004, 2003, 2002 and 2001, respectively.

51
ALLOWANCE FOR CREDIT LOSSES
The allowance for credit losses, which consists of theallowance for loan losses and the reserve for unfunded creditcommitments, is management’s estimate of credit lossesinherent in the loan portfolio at the balance sheet date. Weassume that our allowance for credit losses as a percentageof charge-offs and nonaccrual loans will change at differentpoints in time based on credit performance, loan mix andcollateral values. Any loan with past due principal or interestthat is not both well-secured and in the process of collectiongenerally is charged off (to the extent that it exceeds the fairvalue of any related collateral) based on loan category after adefined period of time. Also, a loan is charged off when clas-sified as a loss by either internal loan examiners or regulatoryexaminers. The detail of the changes in the allowance forcredit losses, including charge-offs and recoveries by loancategory, is in Note 6 (Loans and Allowance for CreditLosses) to Financial Statements.
At December 31, 2005, the allowance for loan losses was $3.87 billion, or 1.25% of total loans, compared with $3.76 billion, or 1.31%, at December 31, 2004, and$3.89 billion, or 1.54%, at December 31, 2003. The decreasein the ratio of the allowance for loan losses to total loans wasprimarily due to a continued shift toward a higher percentageof consumer loans in our portfolio, including consumer loansand some small business loans, which have shorter lossemergence periods, and home mortgage loans, which haveinherently lower losses that emerge over a longer time framecompared to other consumer products. We have historicallyexperienced lower losses on our residential real estate securedconsumer loan portfolio.
The allowance for credit losses was $4.06 billion atDecember 31, 2005, and $3.95 billion at December 31, 2004.The ratio of the allowance for credit losses to net charge-offswas 178% and 237% at December 31, 2005 and 2004,respectively. This ratio fluctuates from period to period andthe decrease in 2005 reflects increased loss rates within thevarious consumer and small business portfolios impacted byhigher consumer bankruptcies in fourth quarter 2005.
The ratio of the allowance for credit losses to total nonac-crual loans was 303% and 291% at December 31, 2005 and2004, respectively. This ratio may fluctuate significantly fromperiod to period due to such factors as the mix of loan typesin the portfolio, borrower credit strength and the value andmarketability of collateral. Over half of nonaccrual loanswere home mortgages and other consumer loans atDecember 31, 2005. Nonaccrual loans are generally writtendown to a net realizable value at the time they are placed onnonaccrual and accounted for on a cost recovery basis.
The provision for credit losses totaled $2.38 billion in2005, and $1.72 billion in both 2004 and 2003. In 2005, theprovision included $100 million in excess of net charge-offs,
which was our estimate of probable credit losses related to Hurricane Katrina. We continue to work with customersunder various payment moratoriums and forbearance programs to re-evaluate and refine our estimates as moreinformation becomes available and can be confirmed in subsequent quarters.
Net charge-offs in 2005 were .77% of average totalloans, compared with .62% in 2004 and .81% in 2003.Higher net charge-offs in 2005 included the additional creditlosses from the change in bankruptcy laws and conformingWells Fargo Financial to FFIEC charge-off rules. A portionof these bankruptcy charge-offs represent an acceleration ofcharge-offs that would have likely occurred in 2006. Theincrease in consumer bankruptcies primarily impacted ourcredit card, unsecured consumer loans and lines, auto andsmall business portfolios.
The reserve for unfunded credit commitments was $186 million at December 31, 2005, and $188 million atDecember 31, 2004, less than 5% of the total allowance forcredit losses related to this potential risk for both years.
The allocated component of the allowance for credit losseswas $3.41 billion at December 31, 2005, and $3.06 billion atDecember 31, 2004, an increase of $347 million year overyear. Changes in the allocated allowance reflect changes instatistically derived loss estimates, historical loss experience,and current trends in borrower risk and/or general economicactivity on portfolio performance. The unallocated allowancedecreased to $648 million, or 16% of the allowance for creditlosses, at December 31, 2005, from $888 million, or 22%, atDecember 31, 2004.
We consider the allowance for credit losses of $4.06 billionadequate to cover credit losses inherent in the loan portfolio,including unfunded credit commitments, at December 31, 2005.The process for determining the adequacy of the allowancefor credit losses is critical to our financial results. It requiresdifficult, subjective and complex judgments, as a result of the need to make estimates about the effect of matters thatare uncertain. (See “Financial Review – Critical AccountingPolicies – Allowance for Credit Losses.”) Therefore, we cannot provide assurance that, in any particular period, wewill not have sizeable credit losses in relation to the amountreserved. We may need to significantly adjust the allowancefor credit losses, considering current factors at the time,including economic conditions and ongoing internal andexternal examination processes. Our process for determiningthe adequacy of the allowance for credit losses is discussedin Note 6 (Loans and Allowance for Credit Losses) toFinancial Statements.

52
Asset/Liability and Market Risk ManagementAsset/liability management involves the evaluation, monitoringand management of interest rate risk, market risk, liquidityand funding. The Corporate Asset/Liability ManagementCommittee (Corporate ALCO)—which oversees these risks and reports periodically to the Finance Committee of the Board of Directors—consists of senior financial and business executives. Each of our principal businessgroups—Community Banking (including Mortgage Banking),Wholesale Banking and Wells Fargo Financial—have individual asset/liability management committees andprocesses linked to the Corporate ALCO process.
INTEREST RATE RISK
Interest rate risk, which potentially can have a significantearnings impact, is an integral part of being a financial inter-mediary. We are subject to interest rate risk because:
• assets and liabilities may mature or reprice at differenttimes (for example, if assets reprice faster than liabilitiesand interest rates are generally falling, earnings will initially decline);
• assets and liabilities may reprice at the same time butby different amounts (for example, when the generallevel of interest rates is falling, we may reduce ratespaid on checking and savings deposit accounts by anamount that is less than the general decline in marketinterest rates);
• short-term and long-term market interest rates maychange by different amounts (for example, the shape of the yield curve may affect new loan yields and funding costs differently); or
• the remaining maturity of various assets or liabilitiesmay shorten or lengthen as interest rates change (forexample, if long-term mortgage interest rates declinesharply, mortgage-backed securities held in the securitiesavailable for sale portfolio may prepay significantly earlierthan anticipated—which could reduce portfolio income).
Interest rates may also have a direct or indirect effect onloan demand, credit losses, mortgage origination volume, thevalue of MSRs, the value of the pension liability and othersources of earnings.
We assess interest rate risk by comparing our most likelyearnings plan with various earnings simulations using manyinterest rate scenarios that differ in the direction of interestrate changes, the degree of change over time, the speed ofchange and the projected shape of the yield curve. For exam-ple, as of December 31, 2005, our most recent simulationindicated estimated earnings at risk of less than 1% of ourmost likely earnings plan over the next 12 months using ascenario in which the federal funds rate dropped 200 basispoints to 2.25% and the 10-year Constant Maturity Treasurybond yield dropped 125 basis points to 3.25% over thesame period. Simulation estimates depend on, and willchange with, the size and mix of our actual and projected
balance sheet at the time of each simulation. Due to timingdifferences between the quarterly valuation of MSRs andthe eventual impact of interest rates on mortgage bankingvolumes, earnings at risk in any particular quarter could be higher than the average earnings at risk over the twelvemonth simulation period, depending on the path of interestrates and on our MSRs hedging strategies. See “MortgageBanking Interest Rate Risk” below.
We use exchange-traded and over-the-counter interest ratederivatives to hedge our interest rate exposures. The notionalor contractual amount, credit risk amount and estimated netfair values of these derivatives as of December 31, 2005 and2004, are presented in Note 26 (Derivatives) to FinancialStatements. We use derivatives for asset/liability managementin three ways:
• to convert a major portion of our long-term fixed-ratedebt, which we issue to finance the Company, fromfixed-rate payments to floating-rate payments by entering into receive-fixed swaps;
• to convert the cash flows from selected asset and/or liability instruments/portfolios from fixed-rate paymentsto floating-rate payments or vice versa; and
• to hedge our mortgage origination pipeline, fundedmortgage loans and MSRs using interest rate swaps,swaptions, futures, forwards and options.
MORTGAGE BANKING INTEREST RATE RISK
We originate, fund and service mortgage loans, which subjectsus to various risks, including credit, liquidity and interest raterisks. We avoid unwanted credit and liquidity risks by sellingor securitizing virtually all of the long-term fixed-rate mort-gage loans we originate and most of the ARMs we originate.From time to time, we hold originated ARMs in portfolio asan investment for our growing base of core deposits, and wemay subsequently sell some or all of these ARMs as part ofour corporate asset/liability management.
While credit and liquidity risks are relatively low for mortgage banking activities, interest rate risk can be substantial. Changes in interest rates may potentially impactorigination and servicing fees, the value of our MSRs, theincome and expense associated with instruments used to hedgechanges in the value of MSRs, and the value of derivativeloan commitments extended to mortgage applicants.
Interest rates impact the amount and timing of origina-tion and servicing fees because consumer demand for newmortgages and the level of refinancing activity are sensitiveto changes in mortgage interest rates. Typically, a decline inmortgage interest rates will lead to an increase in mortgageoriginations and fees and, depending on our ability to retainmarket share, may also lead to an increase in servicing fees.Given the time it takes for consumer behavior to fully reactto interest rate changes, as well as the time required for processing a new application, providing the commitment, and securitizing and selling the loan, interest rate changes will

53
impact origination and servicing fees with a lag. The amountand timing of the impact on origination and servicing feeswill depend on the magnitude, speed and duration of thechange in interest rates.
Under GAAP, MSRs are adjusted at the end of each quarter to the lower of cost or market. While the valuation of MSRs can be highly subjective and involve complex judgments by management about matters that are inherentlyunpredictable, changes in interest rates influence a variety of assumptions included in the periodic valuation of MSRs.Assumptions affected include prepayment speed, expectedreturns and potential risks on the servicing asset portfolio,the value of escrow balances and other servicing valuationelements impacted by interest rates.
A decline in interest rates increases the propensity for refinancing, reduces the expected duration of the servicingportfolio and therefore reduces the estimated value of MSRs.This reduction in value causes a charge to income as a resultof increasing the valuation allowance for potential MSRsimpairment (net of any gains on derivatives used to hedgeMSRs). We typically do not fully hedge with financial instruments (derivatives or securities) all of the potentialdecline in the value of our MSRs to a decline in interest ratesbecause the potential increase in origination/servicing fees in that scenario provides a partial “natural business hedge.”In a rising rate period, when the MSRs valuation is not fullyhedged with derivatives, the amount of valuation allowancethat can be recaptured into income will typically—althoughnot always—exceed the losses on any derivatives hedgingthe MSRs.
Hedging the various sources of interest rate risk in mort-gage banking is a complex process that requires sophisticatedmodeling and constant monitoring. While we attempt to balance these various aspects of the mortgage business, there are several potential risks to earnings:
• MSRs valuation changes associated with interest ratechanges are recorded in earnings immediately withinthe accounting period in which those interest ratechanges occur, whereas the impact of those samechanges in interest rates on origination and servicingfees occur with a lag and over time. Thus, the mortgagebusiness could be protected from adverse changes ininterest rates over a period of time on a cumulativebasis but still display large variations in income in anyaccounting period.
• The degree to which the “natural business hedge” off-sets changes in MSRs valuations is imperfect, varies atdifferent points in the interest rate cycle, and dependsnot just on the direction of interest rates but on thepattern of quarterly interest rate changes. For example,given the relatively high level of refinancing activity inrecent years and the increase in interest rates in 2005,any significant increase in refinancing activity wouldlikely occur only if rates drop substantially from year-end 2005 levels.
• Origination volumes, the valuation of MSRs and hedgingresults and associated costs are also impacted by manyfactors. Such factors include the mix of new businessbetween ARMs and fixed-rated mortgages, the relation-ship between short-term and long-term interest rates,the degree of volatility in interest rates, the relationshipbetween mortgage interest rates and other interest ratemarkets, and other interest rate factors. Many of thesefactors are hard to predict and we may not be able todirectly or perfectly hedge their effect.
• While our hedging activities are designed to balanceour mortgage banking interest rate risks, the financialinstruments we use, including mortgage, U.S. Treasury,and LIBOR-based futures, forwards, swaps and options,may not perfectly correlate with the values and incomebeing hedged.
Our MSRs totaled $12.5 billion, net of a valuationallowance of $1.2 billion at December 31, 2005, and $7.9 billion, net of a valuation allowance of $1.6 billion, atDecember 31, 2004. The weighted-average note rate of ourowned servicing portfolio was 5.72% at December 31, 2005,and 5.75% at December 31, 2004. Our MSRs were 1.44%of mortgage loans serviced for others at December 31, 2005,and 1.15% at December 31, 2004.
As part of our mortgage banking activities, we enter intocommitments to fund residential mortgage loans at specifiedtimes in the future. A mortgage loan commitment is an interestrate lock that binds us to lend funds to a potential borrowerat a specified interest rate and within a specified period oftime, generally up to 60 days after inception of the rate lock.These loan commitments are derivative loan commitments ifthe loans that will result from the exercise of the commitmentswill be held for sale. Under FAS 133, Accounting for DerivativeInstruments and Hedging Activities (as amended), these derivative loan commitments are recognized at fair value on the consolidated balance sheet with changes in their fairvalues recorded as part of income from mortgage bankingoperations. Consistent with EITF 02-3, Issues Involved in Accounting for Derivative Contracts Held for TradingPurposes and Contracts Involved in Energy Trading and RiskManagement Activities, and SEC Staff Accounting BulletinNo. 105, Application of Accounting Principles to LoanCommitments, we record no value for the loan commitmentat inception. Subsequent to inception, we recognize fair value of the derivative loan commitment based on estimatedchanges in the fair value of the underlying loan that wouldresult from the exercise of that commitment and on changesin the probability that the loan will fund within the terms ofthe commitment. The value of that loan is affected primarilyby changes in interest rates and the passage of time. We alsoapply a fall-out factor to the valuation of the derivative loancommitment for the probability that the loan will not fundwithin the terms of the commitments. The value of the MSRs isrecognized only after the servicing asset has been contractuallyseparated from the underlying loan by sale or securitization.

54
Outstanding derivative loan commitments expose us to the risk that the price of the loans underlying the commitmentsmight decline due to increases in mortgage interest rates frominception of the rate lock to the funding of the loan. To minimize this risk, we utilize options, futures and forwardsto economically hedge the potential decreases in the valuesof the loans that could result from the exercise of the loancommitments. We expect that these derivative financialinstruments will experience changes in fair value that willeither fully or partially offset the changes in fair value of the derivative loan commitments.
MARKET RISK – TRADING ACTIVITIES
From a market risk perspective, our net income is exposed to changes in interest rates, credit spreads, foreign exchangerates, equity and commodity prices and their implied volatilities. The primary purpose of our trading businesses is to accommodate customers in the management of theirmarket price risks. Also, we take positions based on marketexpectations or to benefit from price differences betweenfinancial instruments and markets, subject to risk limitsestablished and monitored by Corporate ALCO. All securities,foreign exchange transactions, commodity transactions andderivatives—transacted with customers or used to hedgecapital market transactions with customers—are carried atfair value. The Institutional Risk Committee establishes andmonitors counterparty risk limits. The notional or contractualamount, credit risk amount and estimated net fair value ofall customer accommodation derivatives at December 31, 2005and 2004, are included in Note 26 (Derivatives) to FinancialStatements. Open, “at risk” positions for all trading businessare monitored by Corporate ALCO.
The standardized approach for monitoring and reportingmarket risk for the trading activities is the value-at-risk(VAR) metrics complemented with factor analysis and stresstesting. VAR measures the worst expected loss over a giventime interval and within a given confidence interval. Wemeasure and report daily VAR at 99% confidence intervalbased on actual changes in rates and prices over the past250 days. The analysis captures all financial instrumentsthat are considered trading positions. The average one-dayVAR throughout 2005 was $18 million, with a lower boundof $11 million and an upper bound of $24 million.
MARKET RISK – EQUITY MARKETS
We are directly and indirectly affected by changes in theequity markets. We make and manage direct equity invest-ments in start-up businesses, emerging growth companies,management buy-outs, acquisitions and corporate recapital-izations. We also invest in non-affiliated funds that makesimilar private equity investments. These private equityinvestments are made within capital allocations approved by management and the Board of Directors (the Board).
The Board reviews business developments, key risks and historical returns for the private equity investments at leastannually. Management reviews these investments at leastquarterly and assesses them for possible other-than-temporaryimpairment. For nonmarketable investments, the analysis isbased on facts and circumstances of each investment and theexpectations for that investment’s cash flows and capital needs,the viability of its business model and our exit strategy. Privateequity investments totaled $1,537 million at December 31, 2005,and $1,449 million at December 31, 2004.
We also have marketable equity securities in the availablefor sale investment portfolio, including securities relating toour venture capital activities. We manage these investmentswithin capital risk limits approved by management and theBoard and monitored by Corporate ALCO. Gains and losseson these securities are recognized in net income when realizedand other-than-temporary impairment may be periodicallyrecorded when identified. The initial indicator of impairmentfor marketable equity securities is a sustained decline in marketprice below the amount recorded for that investment. Weconsider a variety of factors, such as the length of time andthe extent to which the market value has been less than cost;the issuer’s financial condition, capital strength, and near-termprospects; any recent events specific to that issuer and economic conditions of its industry; and, to a lesser degree,our investment horizon in relationship to an anticipated near-term recovery in the stock price, if any. The fair value of marketable equity securities was $900 million and costwas $558 million at December 31, 2005, and $696 millionand $507 million, respectively, at December 31, 2004.
Changes in equity market prices may also indirectly affectour net income (1) by affecting the value of third party assetsunder management and, hence, fee income, (2) by affectingparticular borrowers, whose ability to repay principal and/orinterest may be affected by the stock market, or (3) byaffecting brokerage activity, related commission income andother business activities. Each business line monitors andmanages these indirect risks.
LIQUIDITY AND FUNDING
The objective of effective liquidity management is to ensurethat we can meet customer loan requests, customer depositmaturities/withdrawals and other cash commitments effi-ciently under both normal operating conditions and underunpredictable circumstances of industry or market stress. To achieve this objective, Corporate ALCO establishes andmonitors liquidity guidelines that require sufficient asset-basedliquidity to cover potential funding requirements and to avoidover-dependence on volatile, less reliable funding markets. We set these guidelines for both the consolidated balance sheetand for the Parent to ensure that the Parent is a source ofstrength for its regulated, deposit-taking banking subsidiaries.

55
Debt securities in the securities available for sale portfolioprovide asset liquidity, in addition to the immediately liquidresources of cash and due from banks and federal funds sold andsecurities purchased under resale agreements. The weighted-average expected remaining maturity of the debt securitieswithin this portfolio was 5.9 years at December 31, 2005. Ofthe $40.3 billion (cost basis) of debt securities in this portfolioat December 31, 2005, $5.1 billion, or 13%, is expected tomature or be prepaid in 2006 and an additional $5.5 billion,or 14%, in 2007. Asset liquidity is further enhanced by ourability to sell or securitize loans in secondary markets throughwhole-loan sales and securitizations. In 2005, we sold mortgageloans of approximately $435 billion, including securitizedhome mortgage loans and commercial mortgage loans ofapproximately $190 billion. The amount of mortgage loans,home equity loans and other consumer loans available to be sold or securitized was approximately $150 billion atDecember 31, 2005.
Core customer deposits have historically provided a sizeablesource of relatively stable and low-cost funds. Average coredeposits and stockholders’ equity funded 63.2% and 63.1%of average total assets in 2005 and 2004, respectively.
The remaining assets were funded by long-term debt,deposits in foreign offices, short-term borrowings (federalfunds purchased, securities sold under repurchase agreements,commercial paper and other short-term borrowings) andtrust preferred securities. Short-term borrowings averaged$24.1 billion in 2005 and $26.1 billion in 2004. Long-termdebt averaged $79.1 billion in 2005 and $67.9 billion in 2004.
We anticipate making capital expenditures of approxi-mately $900 million in 2006 for our stores, relocation andremodeling of Company facilities, and routine replacementof furniture, equipment and servers. We fund expendituresfrom various sources, including cash flows from operations,retained earnings and borrowings.
Liquidity is also available through our ability to raisefunds in a variety of domestic and international money andcapital markets. We access capital markets for long-termfunding by issuing registered debt, private placements andasset-backed secured funding. Rating agencies base theirratings on many quantitative and qualitative factors, includingcapital adequacy, liquidity, asset quality, business mix andlevel and quality of earnings. Material changes in these factors could result in a different debt rating; however, achange in debt rating would not cause us to violate any ofour debt covenants. In September 2003, Moody’s InvestorsService rated Wells Fargo Bank, N.A. as “Aaa,” its highestinvestment grade, and rated the Company’s senior debt rating as “Aa1.” In July 2005, Dominion Bond RatingService raised the Company’s senior debt rating to “AA”from “AA(low).”
Table 12 provides the credit ratings of the Company andWells Fargo Bank, N.A. as of December 31, 2005.
Table 12: Credit Ratings
Wells Fargo & Company Wells Fargo Bank, N.A.Senior Subordinated Commercial Long-term Short-term debt debt paper deposits borrowings
Moody’s Aa1 Aa2 P-1 Aaa P-1Standard &
Poor’s AA- A+ A-1+ AA A-1+Fitch, Inc. AA AA- F1+ AA+ F1+Dominion Bond
Rating Service AA AA(low) R-1(middle) AA(high) R-1(high)
On June 29, 2005, the SEC adopted amendments to itsrules with respect to the registration, communications andofferings processes under the Securities Act of 1933. The rules,which became effective December 1, 2005, facilitate accessto the capital markets by well-established public companies,modernize the existing restrictions on corporate communicationsduring a securities offering and further integrate disclosuresunder the Securities Act of 1933 and the Securities ExchangeAct of 1934. The amended rules provide the most flexibilityto “well-known seasoned issuers” (Seasoned Issuers),including the option of automatic effectiveness upon filing of shelf registration statements and relief under the lessrestrictive communications rules. Seasoned Issuers generallyinclude those companies with a public float of common equity of at least $700 million or those companies that haveissued at least $1 billion in aggregate principal amount ofnon-convertible securities, other than common equity, in thelast three years. Based on each of these criteria calculated as of December 1, 2005, the Company met the eligibilityrequirements to qualify as a Seasoned Issuer.
PARENT. In July 2005, the Parent’s registration statement withthe SEC for issuance of $30 billion in senior and subordinatednotes, preferred stock and other securities became effective.During 2005, the Parent issued a total of $16.0 billion of seniornotes, including approximately $1.3 billion (denominated in pounds sterling) sold primarily in the United Kingdom.Also, in 2005, the Parent issued $1.5 billion (denominated in Australian dollars) in senior notes under the Parent’sAustralian debt issuance program. At December 31, 2005,the Parent’s remaining authorized issuance capacity under itseffective registration statements was $24.8 billion. We used theproceeds from securities issued in 2005 for general corporatepurposes and expect that the proceeds in the future willalso be used for general corporate purposes. In January andFebruary 2006, the Parent issued a total of $3.6 billion in seniornotes, including approximately $900 million denominated in pounds sterling. The Parent also issues commercial paperfrom time to time.

56
Capital Management
We have an active program for managing stockholder capital.We use capital to fund organic growth, acquire banks andother financial services companies, pay dividends and repur-chase our shares. Our objective is to produce above-marketlong-term returns by opportunistically using capital whenreturns are perceived to be high and issuing/accumulatingcapital when such costs are perceived to be low.
From time to time our Board of Directors authorizes the Company to repurchase shares of our common stock.Although we announce when our Board authorizes sharerepurchases, we typically do not give any public noticebefore we repurchase our shares. Various factors determinethe amount and timing of our share repurchases, includingour capital requirements, the number of shares we expect to issue for acquisitions and employee benefit plans, marketconditions (including the trading price of our stock), andlegal considerations. These factors can change at any time,and there can be no assurance as to the number of shares we will repurchase or when we will repurchase them.
Historically, our policy has been to repurchase sharesunder the “safe harbor” conditions of Rule 10b-18 of theExchange Act including a limitation on the daily volume ofrepurchases. Rule 10b-18 imposes an additional daily volumelimitation on share repurchases during a pending merger oracquisition in which shares of our stock will constitute someor all of the consideration. Our management may determinethat during a pending stock merger or acquisition when the safe harbor would otherwise be available, it is in theCompany’s best interest to repurchase shares in excess of
this additional daily volume limitation. In such cases, weintend to repurchase shares in compliance with the otherconditions of the safe harbor, including the standing dailyvolume limitation that applies whether or not there is apending stock merger or acquisition.
In 2005, the Board of Directors authorized the repurchase of up to 75 million additional shares of our outstandingcommon stock. During 2005, we repurchased approximately53 million shares of our common stock. At December 31, 2005,the total remaining common stock repurchase authority wasapproximately 35 million shares.
Our potential sources of capital include retained earnings,and issuances of common and preferred stock and subordi-nated debt. In 2005, retained earnings increased $4.1 billion,predominantly as a result of net income of $7.7 billion lessdividends of $3.4 billion. In 2005, we issued $1.9 billion ofcommon stock under various employee benefit and directorplans and under our dividend reinvestment and direct stockpurchase programs.
The Company and each of our subsidiary banks are subject to various regulatory capital adequacy requirementsadministered by the Federal Reserve Board and the OCC.Risk-based capital guidelines establish a risk-adjusted ratiorelating capital to different categories of assets and off-balancesheet exposures. At December 31, 2005, the Company andeach of our covered subsidiary banks were “well capitalized”under applicable regulatory capital adequacy guidelines. SeeNote 25 (Regulatory and Agency Capital Requirements) toFinancial Statements for additional information.
WELLS FARGO BANK, N.A. In March 2003, Wells Fargo Bank, N.A.established a $50 billion bank note program under which it may issue up to $20 billion in short-term senior notes outstanding at any time and up to a total of $30 billion inlong-term senior notes. Securities are issued under this program as private placements in accordance with Office ofthe Comptroller of the Currency (OCC) regulations. During2005, Wells Fargo Bank, N.A. issued $2.3 billion in long-termsenior notes. At December 31, 2005, the remaining long-termissuance authority was $6.7 billion. Wells Fargo Bank, N.A.also issued $1.5 billion in subordinated debt in 2005.
WELLS FARGO FINANCIAL. In November 2003, Wells FargoFinancial Canada Corporation (WFFCC), a wholly-ownedCanadian subsidiary of Wells Fargo Financial, Inc. (WFFI),qualified for distribution with the provincial securitiesexchanges in Canada $1.5 billion (Canadian) of issuanceauthority. In December 2004, WFFCC amended its existingshelf registration by adding $2.5 billion (Canadian) ofissuance authority. During 2005, WFFCC issued $2.2 billion(Canadian) in senior notes. The remaining issuance capacityfor WFFCC of $700 million (Canadian) expired inDecember 2005. In January 2006, a $7.0 billion (Canadian)shelf registration became effective. In 2005, WFFI enteredinto a secured borrowing arrangement for $1 billion (U.S.).Under the terms of the arrangement, WFFI pledged autoloans as security for the borrowing.

57
Comparison of 2004 with 2003
Net income in 2004 increased 13% to $7.0 billion from $6.2 billion in 2003. Diluted earnings per common shareincreased 12% to $4.09 in 2004 from $3.65 in 2003. Inaddition to incremental investments in new stores, sales-focused team members and technology, 2004 results included$217 million ($.08 per share) of charitable contributionexpense for the Wells Fargo Foundation, $44 million ($.02per share) for a special 401(k) contribution and $19 million($.01 per share) in integration expense related to the StrongFinancial transaction. We also took significant actions toreposition our balance sheet in 2004 designed to improveearning asset yields and to reduce long-term debt costs. Theextinguishment of high interest rate debt reduced earnings by$174 million ($.06 per share) for 2004. Return on averageassets was 1.71% and return on average common equity was19.56% in 2004, up from 1.64% and 19.36%, respectively,for 2003.
Net interest income on a taxable-equivalent basis was$17.3 billion in 2004, compared with $16.1 billion in 2003,an increase of 7%. The increase was primarily due to strongconsumer loan growth, especially in mortgage products. Thebenefit of this growth was partially offset by lower loan yieldsas new volumes were added below the portfolio average.
The net interest margin for 2004 decreased to 4.89%from 5.08% in 2003. The decrease was primarily due tolower investment portfolio yields following maturities andprepayments of higher yielding mortgage-backed securities,and the addition of new consumer and commercial loanswith yields below the existing portfolio average. These factors were partially offset by the benefits of balance sheet repositioning actions taken in 2004.
Noninterest income was $12.9 billion in 2004, comparedwith $12.4 billion in 2003, an increase of 4%, driven bygrowth across our business, with particular strength in trust,investment and IRA fees, card fees, loan fees and gains onequity investments.
Mortgage banking noninterest income was $1,860 millionin 2004, compared with $2,512 million in 2003. Net servicingincome was $1,037 million in 2004, compared with losses of $954 million in 2003. The increase in net servicing incomein 2004, compared with 2003, reflected a reduction of $934 million in amortization due to an increase in average
interest rates and higher gross servicing fees resulting fromgrowth in the servicing portfolio. In addition, to reflect thehigher value of our MSRs, we reversed $208 million of thevaluation allowance in 2004, compared with an impairmentprovision of $1,092 million in 2003. Net derivative gains onfair value hedges of our MSRs were $554 million and$1,111 million in 2004 and 2003, respectively.
Net gains on mortgage loan origination/sales activitieswere $539 million in 2004, compared with $3,019 millionfor 2003. Lower gains in 2004 compared with 2003 reflectedlower origination volume and a decrease in margins, due primarily to the increase in average interest rates and lowerconsumer demand. Originations during 2004 declined to$298 billion from $470 billion in 2003.
Revenue, the sum of net interest income and noninterestincome, increased 6% to a record $30.1 billion in 2004 from$28.4 billion in 2003, despite a 37% decrease in mortgageoriginations as the refinance driven market declined from itsexceptional 2003 level. Despite our balance sheet reposition-ing actions in 2004, which reduced 2004 revenue growth byapproximately 1 percentage point due to the loss on sale oflower yielding assets, and our significant level of investmentspending, operating leverage improved during 2004 with revenue growing 6% and noninterest expense up only 2%.For the year, Home Mortgage revenue declined $807 million,or 16%, from $5.2 billion in 2003 to $4.4 billion in 2004.
Noninterest expense was $17.6 billion in 2004, comparedwith $17.2 billion in 2003, an increase of 2%.
During 2004, net charge-offs were $1.67 billion, or.62% of average total loans, compared with $1.72 billion,or .81%, during 2003. The provision for credit losses was$1.72 billion in 2004, flat compared with 2003. The allowancefor credit losses, which consists of the allowance for loan losses and the reserve for unfunded credit commitments, was$3.95 billion, or 1.37% of total loans, at December 31, 2004,and $3.89 billion, or 1.54%, at December 31, 2003.
At December 31, 2004, total nonaccrual loans were $1.36 billion, or .47% of total loans, down from $1.46 billion,or .58%, at December 31, 2003. Foreclosed assets were$212 million at December 31, 2004, compared with $198 million at December 31, 2003.

58
Internal control over financial reporting is defined in Rule 13a-15(f) promulgated under the Securities Exchange Act of 1934 as a process designed by, or under the supervision of, the company’s principal executive and principalfinancial officers and effected by the company’s board of directors, management and other personnel, to provide reasonable assurance regarding the reliability of financial reporting and the preparation of financial statements forexternal purposes in accordance with GAAP and includes those policies and procedures that:
• pertain to the maintenance of records that in reasonable detail accurately and fairly reflect the transactions and dispositions of assets of the company;
• provide reasonable assurance that transactions are recorded as necessary to permit preparation of financialstatements in accordance with GAAP, and that receipts and expenditures of the company are being made onlyin accordance with authorizations of management and directors of the company; and
• provide reasonable assurance regarding prevention or timely detection of unauthorized acquisition, use or disposition of the company’s assets that could have a material effect on the financial statements.
Because of its inherent limitations, internal control over financial reporting may not prevent or detect misstatements.Projections of any evaluation of effectiveness to future periods are subject to the risk that controls may become inadequate because of changes in conditions, or that the degree of compliance with the policies or procedures maydeteriorate. No change occurred during fourth quarter 2005 that has materially affected, or is reasonably likely tomaterially affect, the Company’s internal control over financial reporting. Management’s report on internal controlover financial reporting is set forth below, and should be read with these limitations in mind.
Management’s Report on Internal Control over Financial ReportingThe Company’s management is responsible for establishing and maintaining adequate internal control over financialreporting for the Company. Management assessed the effectiveness of the Company’s internal control over financialreporting as of December 31, 2005, using the criteria set forth by the Committee of Sponsoring Organizations of theTreadway Commission (COSO) in Internal Control – Integrated Framework. Based on this assessment, managementconcluded that as of December 31, 2005, the Company’s internal control over financial reporting was effective.
KPMG LLP, the independent registered public accounting firm that audited the Company’s financial statementsincluded in this Annual Report, issued an audit report on management’s assessment of the Company’s internal control over financial reporting. KPMG’s audit report appears on the following page.
Internal Control over Financial Reporting
Controls and Procedures
Disclosure Controls and Procedures
As required by SEC rules, the Company’s management evaluated the effectiveness, as of December 31, 2005, of theCompany’s disclosure controls and procedures. The Company’s chief executive officer and chief financial officer participated in the evaluation. Based on this evaluation, the Company’s chief executive officer and the chief financialofficer concluded that the Company’s disclosure controls and procedures were effective as of December 31, 2005.

59
Report of Independent Registered Public Accounting Firm
The Board of Directors and Stockholders Wells Fargo & Company:
We have audited management’s assessment, included in the accompanying Management’s Report on Internal Controlover Financial Reporting, that Wells Fargo & Company and Subsidiaries (“the Company”) maintained effective internal control over financial reporting as of December 31, 2005, based on criteria established in Internal Control –Integrated Framework issued by the Committee of Sponsoring Organizations of the Treadway Commission (COSO).The Company’s management is responsible for maintaining effective internal control over financial reporting and for its assessment of the effectiveness of internal control over financial reporting. Our responsibility is to express anopinion on management’s assessment and an opinion on the effectiveness of the Company’s internal control overfinancial reporting based on our audit.
We conducted our audit in accordance with the standards of the Public Company Accounting Oversight Board(United States). Those standards require that we plan and perform the audit to obtain reasonable assurance aboutwhether effective internal control over financial reporting was maintained in all material respects. Our audit includedobtaining an understanding of internal control over financial reporting, evaluating management’s assessment, testingand evaluating the design and operating effectiveness of internal control, and performing such other procedures as weconsidered necessary in the circumstances. We believe that our audit provides a reasonable basis for our opinion.
A company’s internal control over financial reporting is a process designed to provide reasonable assurance regardingthe reliability of financial reporting and the preparation of financial statements for external purposes in accordancewith generally accepted accounting principles. A company’s internal control over financial reporting includes thosepolicies and procedures that (1) pertain to the maintenance of records that, in reasonable detail, accurately and fairlyreflect the transactions and dispositions of the assets of the company; (2) provide reasonable assurance that transactionsare recorded as necessary to permit preparation of financial statements in accordance with generally accepted accountingprinciples, and that receipts and expenditures of the company are being made only in accordance with authorizationsof management and directors of the company; and (3) provide reasonable assurance regarding prevention or timelydetection of unauthorized acquisition, use, or disposition of the company’s assets that could have a material effect onthe financial statements.
Because of its inherent limitations, internal control over financial reporting may not prevent or detect misstatements.Also, projections of any evaluation of effectiveness to future periods are subject to the risk that controls may becomeinadequate because of changes in conditions, or that the degree of compliance with the policies or procedures may deteriorate.
In our opinion, management’s assessment that the Company maintained effective internal control over financialreporting as of December 31, 2005, is fairly stated, in all material respects, based on criteria established in InternalControl – Integrated Framework issued by COSO. Also in our opinion, the Company maintained, in all materialrespects, effective internal control over financial reporting as of December 31, 2005, based on criteria established in Internal Control – Integrated Framework issued by COSO.
We also have audited, in accordance with the standards of the Public Company Accounting Oversight Board(United States), the consolidated balance sheet of the Company as of December 31, 2005 and 2004, and the relatedconsolidated statements of income, changes in stockholders’ equity and comprehensive income, and cash flows foreach of the years in the three-year period ended December 31, 2005, and our report dated February 21, 2006,expressed an unqualified opinion on those consolidated financial statements.
San Francisco, CaliforniaFebruary 21, 2006

60
Wells Fargo & Company and Subsidiaries
Consolidated Statement of Income
(in millions, except per share amounts) Year ended December 31,2005 2004 2003
INTEREST INCOMETrading assets $ 190 $ 145 $ 156Securities available for sale 1,921 1,883 1,816Mortgages held for sale 2,213 1,737 3,136Loans held for sale 146 292 251Loans 21,260 16,781 13,937Other interest income 232 129 122
Total interest income 25,962 20,967 19,418
INTEREST EXPENSEDeposits 3,848 1,827 1,613Short-term borrowings 744 353 322Long-term debt 2,866 1,637 1,355Guaranteed preferred beneficial interests
in Company’s subordinated debentures — — 121Total interest expense 7,458 3,817 3,411
NET INTEREST INCOME 18,504 17,150 16,007Provision for credit losses 2,383 1,717 1,722Net interest income after provision for credit losses 16,121 15,433 14,285
NONINTEREST INCOMEService charges on deposit accounts 2,512 2,417 2,297Trust and investment fees 2,436 2,116 1,937Card fees 1,458 1,230 1,079Other fees 1,929 1,779 1,560Mortgage banking 2,422 1,860 2,512Operating leases 812 836 937Insurance 1,215 1,193 1,071Net gains (losses) on debt securities available for sale (120) (15) 4Net gains from equity investments 511 394 55Other 1,270 1,099 930
Total noninterest income 14,445 12,909 12,382
NONINTEREST EXPENSESalaries 6,215 5,393 4,832Incentive compensation 2,366 1,807 2,054Employee benefits 1,874 1,724 1,560Equipment 1,267 1,236 1,246Net occupancy 1,412 1,208 1,177Operating leases 635 633 702Other 5,249 5,572 5,619
Total noninterest expense 19,018 17,573 17,190
INCOME BEFORE INCOME TAX EXPENSE 11,548 10,769 9,477Income tax expense 3,877 3,755 3,275
NET INCOME $ 7,671 $ 7,014 $ 6,202
EARNINGS PER COMMON SHARE $ 4.55 $ 4.15 $ 3.69
DILUTED EARNINGS PER COMMON SHARE $ 4.50 $ 4.09 $ 3.65
DIVIDENDS DECLARED PER COMMON SHARE $ 2.00 $ 1.86 $ 1.50
Average common shares outstanding 1,686.3 1,692.2 1,681.1
Diluted average common shares outstanding 1,705.5 1,713.4 1,697.5
The accompanying notes are an integral part of these statements.
Financial Statements

61
Wells Fargo & Company and Subsidiaries
Consolidated Balance Sheet
(in millions, except shares) December 31,2005 2004
ASSETSCash and due from banks $ 15,397 $ 12,903Federal funds sold, securities purchased under
resale agreements and other short-term investments 5,306 5,020Trading assets 10,905 9,000Securities available for sale 41,834 33,717Mortgages held for sale 40,534 29,723Loans held for sale 612 8,739
Loans 310,837 287,586Allowance for loan losses (3,871) (3,762)
Net loans 306,966 283,824
Mortgage servicing rights, net 12,511 7,901Premises and equipment, net 4,417 3,850Goodwill 10,787 10,681Other assets 32,472 22,491
Total assets $481,741 $427,849
LIABILITIESNoninterest-bearing deposits $ 87,712 $ 81,082Interest-bearing deposits 226,738 193,776
Total deposits 314,450 274,858Short-term borrowings 23,892 21,962Accrued expenses and other liabilities 23,071 19,583Long-term debt 79,668 73,580
Total liabilities 441,081 389,983
STOCKHOLDERS’ EQUITYPreferred stock 325 270Common stock – $12/3 par value, authorized 6,000,000,000 shares;
issued 1,736,381,025 shares 2,894 2,894Additional paid-in capital 9,934 9,806Retained earnings 30,580 26,482Cumulative other comprehensive income 665 950Treasury stock – 58,797,993 shares and 41,789,388 shares (3,390) (2,247)Unearned ESOP shares (348) (289)
Total stockholders’ equity 40,660 37,866
Total liabilities and stockholders’ equity $481,741 $427,849
The accompanying notes are an integral part of these statements.

62
Wells Fargo & Company and Subsidiaries
Consolidated Statement of Changes in Stockholders’ Equity and Comprehensive Income
(in millions, except shares) Number Preferred Common Additional Retained Cumulative Treasury Unearned Totalof common stock stock paid-in earnings other stock ESOP stock-
shares capital comprehensive shares holders’income equity
BALANCE DECEMBER 31, 2002 1,685,906,507 $ 251 $ 2,894 $ 9,498 $ 19,355 $ 976 $ (2,465) $(190) $ 30,319Comprehensive income
Net income – 2003 6,202 6,202Other comprehensive income, net of tax:
Translation adjustments 26 26Net unrealized losses on securities available
for sale and other retained interests (117) (117)Net unrealized gains on derivatives and
hedging activities 53 53Total comprehensive income 6,164Common stock issued 26,063,731 63 (190) 1,221 1,094Common stock issued for acquisitions 12,399,597 66 585 651Common stock repurchased (30,779,500) (1,482) (1,482)Preferred stock (260,200) issued to ESOP 260 19 (279) —Preferred stock released to ESOP (16) 240 224Preferred stock (223,660) converted
to common shares 4,519,039 (224) 13 211 —Preferred stock (1,460,000) redeemed (73) (73)Preferred stock dividends (3) (3)Common stock dividends (2,527) (2,527)Change in Rabbi trust assets and similar
arrangements (classified as treasury stock) 97 97Other, net ___________ ____ ______ ______ 5 _____ ______ _____ 5Net change 12,202,867 (37) — 145 3,487 (38) 632 (39) 4,150
BALANCE DECEMBER 31, 2003 1,698,109,374 214 2,894 9,643 22,842 938 (1,833) (229) 34,469Comprehensive income
Net income – 2004 7,014 7,014Other comprehensive income, net of tax:
Translation adjustments 12 12Net unrealized losses on securities available
for sale and other retained interests (22) (22)Net unrealized gains on derivatives and
hedging activities 22 22Total comprehensive income 7,026Common stock issued 29,969,653 129 (206) 1,523 1,446Common stock issued for acquisitions 153,482 1 8 9Common stock repurchased (38,172,556) (2,188) (2,188)Preferred stock (321,000) issued to ESOP 321 23 (344) —Preferred stock released to ESOP (19) 284 265Preferred stock (265,537) converted
to common shares 4,531,684 (265) 29 236 —Common stock dividends (3,150) (3,150)Change in Rabbi trust assets and similar
arrangements (classified as treasury stock) 7 7Other, net ______________ _____ _______ _______ (18) ______ _________ ______ (18)Net change (3,517,737) 56 — 163 3,640 12 (414) (60) 3,397
BALANCE DECEMBER 31, 2004 1,694,591,637 270 2,894 9,806 26,482 950 (2,247) (289) 37,866Comprehensive income
Net income – 2005 7,671 7,671Other comprehensive income, net of tax:
Translation adjustments 5 5Net unrealized losses on securities available
for sale and other retained interests (298) (298)Net unrealized gains on derivatives and
hedging activities 8 8Total comprehensive income 7,386Common stock issued 28,764,493 91 (198) 1,617 1,510Common stock issued for acquisitions 1,954,502 12 110 122Common stock repurchased (52,798,864) (3,159) (3,159)Preferred stock (363,000) issued to ESOP 362 25 (387) —Preferred stock released to ESOP (21) 328 307Preferred stock (307,100) converted
to common shares 5,071,264 (307) 21 286 —Common stock dividends (3,375) (3,375)Other, net _____________ _____ ______ ______ ________ _____ 3 _____ 3Net change (17,008,605) 55 — 128 4,098 (285) (1,143) (59) 2,794
BALANCE DECEMBER 31, 2005 1,677,583,032 $325 $2,894 $9,934 $30,580 $ 665 $(3,390) $(348) $40,660
The accompanying notes are an integral part of these statements.

63
Wells Fargo & Company and Subsidiaries
Consolidated Statement of Cash Flows
(in millions) Year ended December 31,
2005 2004 2003
Cash flows from operating activities:Net income $ 7,671 $ 7,014 $ 6,202Adjustments to reconcile net income to net cash provided by operating activities:
Provision for credit losses 2,383 1,717 1,722Provision (reversal of provision) for mortgage servicing rights in excess of fair value (378) (208) 1,092Depreciation and amortization 4,161 3,449 4,305Net gains on securities available for sale (40) (60) (62)Net gains on mortgage loan origination/sales activities (1,085) (539) (3,019)Other net losses (gains) (75) 9 (11)Preferred shares released to ESOP 307 265 224Net decrease (increase) in trading assets (1,905) (81) 1,248Net increase in deferred income taxes 813 432 1,698Net increase in accrued interest receivable (796) (196) (148)Net increase (decrease) in accrued interest payable 311 47 (63)Originations of mortgages held for sale (230,897) (221,978) (382,335)Proceeds from sales of mortgages originated for sale 214,740 217,272 404,207Principal collected on mortgages originated for sale 1,426 1,409 3,136Net decrease (increase) in loans originated for sale 683 (1,331) (832)Other assets, net (10,237) (2,468) (5,099)Other accrued expenses and liabilities, net 3,585 1,732 (1,070)
Net cash provided (used) by operating activities (9,333) 6,485 31,195
Cash flows from investing activities:Securities available for sale:
Sales proceeds 19,059 6,322 7,357Prepayments and maturities 6,972 8,823 13,152Purchases (28,634) (16,583) (25,131)
Net cash acquired from (paid for) acquisitions 66 (331) (822)Increase in banking subsidiaries’ loan originations, net of collections (42,309) (33,800) (36,235)Proceeds from sales (including participations) of loans by banking subsidiaries 42,239 14,540 1,590Purchases (including participations) of loans by banking subsidiaries (8,853) (5,877) (15,087)Principal collected on nonbank entities’ loans 22,822 17,996 17,638Loans originated by nonbank entities (33,675) (27,751) (21,792)Purchases of loans by nonbank entities — — (3,682)Proceeds from sales of foreclosed assets 444 419 264Net increase in federal funds sold, securities purchased
under resale agreements and other short-term investments (281) (1,287) (208)Net increase in mortgage servicing rights (4,595) (1,389) (3,875)Other, net (3,324) (516) 3,852
Net cash used by investing activities (30,069) (39,434) (62,979)
Cash flows from financing activities:Net increase in deposits 38,961 27,327 28,643Net increase (decrease) in short-term borrowings 1,878 (2,697) (8,901)Proceeds from issuance of long-term debt 26,473 29,394 29,490Long-term debt repayment (18,576) (19,639) (17,931)Proceeds from issuance of guaranteed preferred beneficial interests
in Company’s subordinated debentures — — 700Proceeds from issuance of common stock 1,367 1,271 944Preferred stock redeemed — — (73)Common stock repurchased (3,159) (2,188) (1,482)Cash dividends paid on preferred and common stock (3,375) (3,150) (2,530)Other, net (1,673) (13) 651
Net cash provided by financing activities 41,896 30,305 29,511
Net change in cash and due from banks 2,494 (2,644) (2,273)
Cash and due from banks at beginning of year 12,903 15,547 17,820
Cash and due from banks at end of year $ 15,397 $ 12,903 $ 15,547
Supplemental disclosures of cash flow information:Cash paid during the year for:
Interest $ 7,769 $ 3,864 $ 3,348Income taxes 3,584 2,326 2,713
Noncash investing and financing activities:Net transfers from loans to mortgages held for sale 41,270 11,225 368Net transfers from loans held for sale to loans 7,444 — —Transfers from loans to foreclosed assets 567 603 411Transfers from mortgages held for sale to securities available for sale 5,490 — —
The accompanying notes are an integral part of these statements.

64
Notes to Financial Statements
Wells Fargo & Company is a diversified financial servicescompany. We provide banking, insurance, investments, mortgage banking and consumer finance through bankingstores, the internet and other distribution channels to consumers, businesses and institutions in all 50 states of the U.S. and in other countries. In this Annual Report, Wells Fargo & Company and Subsidiaries (consolidated) are called the Company. Wells Fargo & Company (the Parent)is a financial holding company and a bank holding company.
Our accounting and reporting policies conform with U.S. generally accepted accounting principles (GAAP) andpractices in the financial services industry. To prepare thefinancial statements in conformity with GAAP, managementmust make estimates and assumptions that affect the reportedamounts of assets and liabilities at the date of the financialstatements and income and expenses during the reportingperiod. Management has made significant estimates in severalareas, including the allowance for credit losses (Note 6),valuing mortgage servicing rights (Notes 20 and 21) andpension accounting (Note 15). Actual results could differfrom those estimates.
The following is a description of our significant accounting policies.
ConsolidationOur consolidated financial statements include the accountsof the Parent and our majority-owned subsidiaries and vari-able interest entities (VIEs) (defined below) in which we arethe primary beneficiary. Significant intercompany accountsand transactions are eliminated in consolidation. If we ownat least 20% of an entity, we generally account for theinvestment using the equity method. If we own less than20% of an entity, we generally carry the investment at cost,except marketable equity securities, which we carry at fairvalue with changes in fair value included in other compre-hensive income. Assets accounted for under the equity orcost method are included in other assets.
We are a variable interest holder in certain special pur-pose entities in which we do not have a controlling financialinterest or do not have enough equity at risk for the entity tofinance its activities without additional subordinated finan-cial support from other parties. Our variable interest arisesfrom contractual, ownership or other monetary interests inthe entity, which change with fluctuations in the entity’s netasset value. We consolidate a VIE if we are the primary ben-eficiary because we will absorb a majority of the entity’sexpected losses, receive a majority of the entity’s expectedresidual returns, or both.
Trading AssetsTrading assets are primarily securities, including corporatedebt, U.S. government agency obligations and other securitiesthat we acquire for short-term appreciation or other tradingpurposes, and the fair value of derivatives held for customeraccommodation purposes or proprietary trading. Tradingassets are carried at fair value, with realized and unrealizedgains and losses recorded in noninterest income.
SecuritiesSECURITIES AVAILABLE FOR SALE Debt securities that we mightnot hold until maturity and marketable equity securities areclassified as securities available for sale and reported at esti-mated fair value. Unrealized gains and losses, after applicabletaxes, are reported in cumulative other comprehensive income.We use current quotations, where available, to estimate thefair value of these securities. Where current quotations arenot available, we estimate fair value based on the presentvalue of future cash flows, adjusted for the credit rating ofthe securities, prepayment assumptions and other factors.
We reduce the asset value when we consider the declinesin the value of debt securities and marketable equity securi-ties to be other-than-temporary and record the estimated lossin noninterest income. The initial indicator of impairmentfor both debt and marketable equity securities is a sustaineddecline in market price below the amount recorded for thatinvestment. We consider the length of time and the extent to which market value has been less than cost, any recentevents specific to the issuer and economic conditions of itsindustry and our investment horizon in relationship to ananticipated near-term recovery in the stock or bond price, if any.
For marketable equity securities, we also consider theissuer’s financial condition, capital strength, and near-termprospects.
For debt securities we also consider:• the cause of the price decline – general level of interest
rates and industry and issuer-specific factors;• the issuer’s financial condition, near term prospects
and current ability to make future payments in a timely manner;
• the issuer’s ability to service debt; and• any change in agencies’ ratings at evaluation date from
acquisition date and any likely imminent action.
Note 1: Summary of Significant Accounting Policies

65
We manage these investments within capital risk limitsapproved by management and the Board of Directors andmonitored by the Corporate Asset/Liability ManagementCommittee. We recognize realized gains and losses on thesale of these securities in noninterest income using the specific identification method.
Unamortized premiums and discounts are recognized ininterest income over the contractual life of the security usingthe interest method. As principal repayments are received on securities (i.e., primarily mortgage-backed securities) apro-rata portion of the unamortized premium or discount isrecognized in interest income.
NONMARKETABLE EQUITY SECURITIES Nonmarketable equitysecurities include venture capital equity securities that arenot publicly traded and securities acquired for various pur-poses, such as to meet regulatory requirements (for example,Federal Reserve Bank and Federal Home Loan Bank stock).We review these assets at least quarterly for possible other-than-temporary impairment. Our review typically includesan analysis of the facts and circumstances of each invest-ment, the expectations for the investment’s cash flows andcapital needs, the viability of its business model and our exitstrategy. These securities are accounted for under the cost orequity method and are included in other assets. We reducethe asset value when we consider declines in value to beother-than-temporary. We recognize the estimated loss as a loss from equity investments in noninterest income.
Mortgages Held for SaleMortgages held for sale include residential mortgages thatwere originated in accordance with secondary market pricingand underwriting standards and certain mortgages originatedinitially for investment and not underwritten to secondarymarket standards, and are stated at the lower of cost or marketvalue. Gains and losses on loan sales (sales proceeds minuscarrying value) are recorded in noninterest income. Directloan origination costs and fees are deferred at origination of the loan. These deferred costs and fees are recognized inmortgage banking noninterest income upon sale of the loan.
Loans Held for SaleLoans held for sale are carried at the lower of cost or marketvalue. Gains and losses on loan sales (sales proceeds minuscarrying value) are recorded in noninterest income. Directloan origination costs and fees are deferred at origination of the loan. These deferred costs and fees are recognized innoninterest income upon the sale of the loan.
LoansLoans are reported at their outstanding principal balancesnet of any unearned income, charge-offs, unamortized deferredfees and costs on originated loans and premiums or discountson purchased loans, except for certain purchased loans, whichare recorded at fair value on their purchase date. Unearnedincome, deferred fees and costs, and discounts and premiumsare amortized to income over the contractual life of the loanusing the interest method.
Lease financing assets include aggregate lease rentals, netof related unearned income, which includes deferred investmenttax credits, and related nonrecourse debt. Leasing income isrecognized as a constant percentage of outstanding leasefinancing balances over the lease terms.
Loan commitment fees are generally deferred and amor-tized into noninterest income on a straight-line basis over thecommitment period.
From time to time, we pledge loans, primarily 1-4 familymortgage loans, to secure borrowings from the FederalHome Loan Bank.
NONACCRUAL LOANS We generally place loans on nonaccrualstatus when:
• the full and timely collection of interest or principalbecomes uncertain;
• they are 90 days (120 days with respect to real estate1-4 family first and junior lien mortgages) past due forinterest or principal (unless both well-secured and inthe process of collection); or
• part of the principal balance has been charged off. Generally, consumer loans not secured by real estate are
placed on nonaccrual status only when part of the principalhas been charged off. These loans are entirely charged offwhen deemed uncollectible or when they reach a definednumber of days past due based on loan product, industrypractice, country, terms and other factors.
When we place a loan on nonaccrual status, we reverse theaccrued and unpaid interest receivable against interest incomeand account for the loan on the cash or cost recovery method,until it qualifies for return to accrual status. Generally, wereturn a loan to accrual status when (a) all delinquent interestand principal becomes current under the terms of the loanagreement or (b) the loan is both well-secured and in theprocess of collection and collectibility is no longer doubtful,after a period of demonstrated performance.
IMPAIRED LOANS We assess, account for and disclose asimpaired certain nonaccrual commercial and commercial real estate loans that are over $3 million. We consider a loanto be impaired when, based on current information andevents, we will probably not be able to collect all amountsdue according to the loan contract, including scheduledinterest payments.
When we identify a loan as impaired, we measure theimpairment based on the present value of expected futurecash flows, discounted at the loan’s effective interest rate,except when the sole (remaining) source of repayment forthe loan is the operation or liquidation of the collateral. Inthese cases we use an observable market price or the currentfair value of the collateral, less selling costs, instead of dis-counted cash flows.
If we determine that the value of the impaired loan is lessthan the recorded investment in the loan (net of previouscharge-offs, deferred loan fees or costs and unamortized premium or discount), we recognize impairment through anallocated reserve or a charge-off to the allowance.

66
ALLOWANCE FOR CREDIT LOSSES The allowance for credit losses,which consists of the allowance for loan losses and the reservefor unfunded credit commitments, is management’s estimateof credit losses inherent in the loan portfolio at the balancesheet date. Our determination of the allowance, and theresulting provision, is based on judgments and assumptions,including:
• general economic conditions;• loan portfolio composition;• loan loss experience;• management’s evaluation of credit risk relating to pools
of loans and individual borrowers;• sensitivity analysis and expected loss models; and • observations from our internal auditors, internal loan
review staff or banking regulators.
Transfers and Servicing of Financial AssetsWe account for a transfer of financial assets as a sale whenwe surrender control of the transferred assets. Servicingrights and other retained interests in the sold assets arerecorded by allocating the previously recorded investmentbetween the assets sold and the interest retained based ontheir relative fair values at the date of transfer. We determinethe fair values of servicing rights and other retained interestsat the date of transfer using the present value of estimatedfuture cash flows, using assumptions that market partici-pants use in their estimates of values. We use quoted marketprices when available to determine the value of otherretained interests.
We recognize the rights to service mortgage loans for oth-ers, or mortgage servicing rights (MSRs), as assets whetherwe purchase the servicing rights or sell or securitize loans weoriginate and retain servicing rights. MSRs are amortized inproportion to, and over the period of, estimated net servicingincome. The amortization of MSRs is analyzed monthly andis adjusted to reflect changes in prepayment speeds, as wellas other factors.
To determine the fair value of MSRs, we use a valuationmodel that calculates the present value of estimated futurenet servicing income. We use assumptions in the valuationmodel that market participants use in estimating future netservicing income, including estimates of prepayment speeds,discount rate, cost to service, escrow account earnings, con-tractual servicing fee income, ancillary income and late fees.
At the end of each quarter, we evaluate MSRs for possibleimpairment based on the difference between the carryingamount and current fair value, in accordance with Statementof Financial Accounting Standards No. 140, Accounting forTransfers and Servicing of Financial Assets and Extinguishmentsof Liabilities (FAS 140). To evaluate and measure impairmentwe stratify the portfolio based on certain risk characteristics,including loan type and note rate. If temporary impairment
exists, we establish a valuation allowance through a charge toincome for those risk stratifications with an excess of amortizedcost over the current fair value. If we later determine that allor a portion of the temporary impairment no longer existsfor a particular risk stratification, we will reduce the valuationallowance through an increase to income.
Under our policy, we evaluate other-than-temporaryimpairment of MSRs by considering both historical andprojected trends in interest rates, pay off activity and whetherthe impairment could be recovered through interest rateincreases. We recognize a direct write-down when we determine that the recoverability of a recorded valuationallowance is remote. A direct write-down permanentlyreduces the carrying value of the MSRs, while a valuationallowance (temporary impairment) can be reversed.
Premises and EquipmentPremises and equipment are carried at cost less accumulateddepreciation and amortization. Capital leases are included in premises and equipment at the capitalized amount lessaccumulated amortization.
We primarily use the straight-line method of depreciationand amortization. Estimated useful lives range up to 40 yearsfor buildings, up to 10 years for furniture and equipment,and the shorter of the estimated useful life or lease term forleasehold improvements. We amortize capitalized leased assetson a straight-line basis over the lives of the respective leases.
Goodwill and Identifiable Intangible AssetsGoodwill is recorded when the purchase price is higher thanthe fair value of net assets acquired in business combinationsunder the purchase method of accounting.
We assess goodwill for impairment annually, and morefrequently in certain circumstances. We assess goodwill forimpairment on a reporting unit level by applying a fair-value-based test using discounted estimated future net cashflows. Impairment exists when the carrying amount of thegoodwill exceeds its implied fair value. We recognize impair-ment losses as a charge to noninterest expense (unless relatedto discontinued operations) and an adjustment to the carry-ing value of the goodwill asset. Subsequent reversals ofgoodwill impairment are prohibited.
We amortize core deposit intangibles on an acceleratedbasis based on useful lives of 10 to 15 years. We reviewcore deposit intangibles for impairment whenever events or changes in circumstances indicate that their carryingamounts may not be recoverable. Impairment is indicatedif the sum of undiscounted estimated future net cash flowsis less than the carrying value of the asset. Impairment ispermanently recognized by writing down the asset to the extent that the carrying value exceeds the estimatedfair value.

67
Operating Lease AssetsOperating lease rental income for leased assets, generallyautomobiles, is recognized in other income on a straight-linebasis over the lease term. Related depreciation expense isrecorded on a straight-line basis over the life of the lease,taking into account the estimated residual value of the leasedasset. On a periodic basis, leased assets are reviewed forimpairment. Impairment loss is recognized if the carryingamount of leased assets exceeds fair value and is not recover-able. The carrying amount of leased assets is not recoverableif it exceeds the sum of the undiscounted cash flows expectedto result from the lease payments and the estimated residualvalue upon the eventual disposition of the equipment. Autolease receivables are written off when 120 days past due.
Pension AccountingWe account for our defined benefit pension plans using anactuarial model required by FAS 87, Employers’ Accountingfor Pensions. This model allocates pension costs over the service period of employees in the plan. The underlying principle is that employees render service ratably over thisperiod and, therefore, the income statement effects of pensions should follow a similar pattern.
One of the principal components of the net periodic pension calculation is the expected long-term rate of return onplan assets. The use of an expected long-term rate of returnon plan assets may cause us to recognize pension incomereturns that are greater or less than the actual returns of plan assets in any given year.
The expected long-term rate of return is designed toapproximate the actual long-term rate of return over timeand is not expected to change significantly. Therefore, thepattern of income/expense recognition should closely matchthe stable pattern of services provided by our employees overthe life of our pension obligation. To determine if the expectedrate of return is reasonable, we consider such factors as (1) the actual return earned on plan assets, (2) historicalrates of return on the various asset classes in the plan portfolio, (3) projections of returns on various asset classes,and (4) current/prospective capital market conditions andeconomic forecasts. Differences in each year, if any, betweenexpected and actual returns are included in our unrecognizednet actuarial gain or loss amount. We generally amortize any unrecognized net actuarial gain or loss in excess of a 5% corridor (as defined in FAS 87) in net periodic pension calculations over the next five years.
We use a discount rate to determine the present value of our future benefit obligations. The discount rate reflectsthe rates available at the measurement date on long-termhigh-quality fixed-income debt instruments and is reset annually on the measurement date (November 30).
Income TaxesWe file a consolidated federal income tax return and, in certain states, combined state tax returns.
We determine deferred income tax assets and liabilitiesusing the balance sheet method. Under this method, the netdeferred tax asset or liability is based on the tax effects ofthe differences between the book and tax bases of assets andliabilities, and recognizes enacted changes in tax rates andlaws. Deferred tax assets are recognized subject to manage-ment judgment that realization is more likely than not.Foreign taxes paid are generally applied as credits to reducefederal income taxes payable.
Stock-Based CompensationWe have several stock-based employee compensation plans,which are described more fully in Note 14. As permitted byFAS 123, Accounting for Stock-Based Compensation, we haveelected to apply the intrinsic value method of AccountingPrinciples Board Opinion 25, Accounting for Stock Issued toEmployees (APB 25), in accounting for stock-based employeecompensation plans through December 31, 2005. Pro formanet income and earnings per common share information isprovided below, as if we accounted for employee stockoption plans under the fair value method of FAS 123.
On December 16, 2004, the FASB issued FAS 123(revised 2004), Share-Based Payment (FAS 123R), whichreplaced FAS 123 and superceded APB 25. We adopted FAS123R on January 1, 2006, which requires us to measure thecost of employee services received in exchange for an awardof equity instruments, such as stock options or restrictedstock, based on the fair value of the award on the grantdate. This cost must be recognized in the income statementover the vesting period of the award.
(in millions, except per Year ended December 31,share amounts) 2005 2004 2003
Net income, as reported $7,671 $7,014 $6,202
Add: Stock-based employee compensation expense included in reported net income, net of tax 1 2 3
Less: Total stock-based employee compensation expense under the fair value method for all awards,net of tax (188) (275) (198)
Net income, pro forma $7,484 $6,741 $6,007
Earnings per common share As reported $ 4.55 $ 4.15 $ 3.69Pro forma 4.44 3.99 3.57
Diluted earnings per common shareAs reported $ 4.50 $ 4.09 $ 3.65Pro forma 4.38 3.93 3.53

68
Stock options granted in each of our February 2005 and February 2004 annual grants, under our Long-TermIncentive Compensation Plan (the Plan), fully vested upongrant, resulting in full recognition of stock-based compensa-tion expense for both grants in the year of the grant underthe fair value method in the table on the previous page.Stock options granted in our 2003, 2002 and 2001 annualgrants under the Plan vest over a three-year period, andexpense reflected in the table for these grants is recognizedover the vesting period.
Earnings Per Common ShareWe present earnings per common share and diluted earningsper common share. We compute earnings per common shareby dividing net income (after deducting dividends on preferredstock) by the average number of common shares outstandingduring the year. We compute diluted earnings per commonshare by dividing net income (after deducting dividends onpreferred stock) by the average number of common sharesoutstanding during the year, plus the effect of common stockequivalents (for example, stock options, restricted sharerights and convertible debentures) that are dilutive.
Derivatives and Hedging ActivitiesWe recognize all derivatives on the balance sheet at fairvalue. On the date we enter into a derivative contract, wedesignate the derivative as (1) a hedge of the fair value of a recognized asset or liability (“fair value” hedge), (2) ahedge of a forecasted transaction or of the variability of cash flows to be received or paid related to a recognized asset or liability (“cash flow” hedge) or (3) held for trading,customer accommodation or for risk management not qualifying for hedge accounting (“free-standing derivative”).For a fair value hedge, we record changes in the fair value ofthe derivative and, to the extent that it is effective, changesin the fair value of the hedged asset or liability attributableto the hedged risk, in current period earnings in the samefinancial statement category as the hedged item. For a cash flow hedge, we record changes in the fair value of thederivative to the extent that it is effective in other compre-hensive income. We subsequently reclassify these changes in fair value to net income in the same period(s) that thehedged transaction affects net income in the same financialstatement category as the hedged item. For free-standingderivatives, we report changes in the fair values in currentperiod noninterest income.
We formally document at inception the relationshipbetween hedging instruments and hedged items, our riskmanagement objective, strategy and our evaluation of effec-tiveness for our hedge transactions. This includes linking all derivatives designated as fair value or cash flow hedges to specific assets and liabilities on the balance sheet or to specific forecasted transactions. Periodically, as required, we
also formally assess whether the derivative we designated in each hedging relationship is expected to be and has beenhighly effective in offsetting changes in fair values or cashflows of the hedged item using either the dollar offset or theregression analysis method. If we determine that a derivative isnot highly effective as a hedge, we discontinue hedge accounting.
We discontinue hedge accounting prospectively when (1) a derivative is no longer highly effective in offsettingchanges in the fair value or cash flows of a hedged item, (2) a derivative expires or is sold, terminated, or exercised,(3) a derivative is dedesignated as a hedge, because it isunlikely that a forecasted transaction will occur, or (4) wedetermine that designation of a derivative as a hedge is nolonger appropriate.
When we discontinue hedge accounting because a deriva-tive no longer qualifies as an effective fair value hedge, wecontinue to carry the derivative on the balance sheet at itsfair value with changes in fair value included in earnings,and no longer adjust the previously hedged asset or liabilityfor changes in fair value. Previous adjustments to the hedgeditem are accounted for in the same manner as other compo-nents of the carrying amount of the asset or liability.
When we discontinue hedge accounting because it isprobable that a forecasted transaction will not occur, wecontinue to carry the derivative on the balance sheet at itsfair value with changes in fair value included in earnings,and immediately recognize gains and losses that were accumulated in other comprehensive income in earnings.
When we discontinue hedge accounting because the hedg-ing instrument is sold, terminated, or no longer designated(dedesignated), the amount reported in other comprehensiveincome up to the date of sale, termination or dedesignationcontinues to be reported in other comprehensive incomeuntil the forecasted transaction affects earnings.
In all other situations in which we discontinue hedgeaccounting, the derivative will be carried at its fair value onthe balance sheet, with changes in its fair value recognized incurrent period earnings.
We occasionally purchase or originate financial instru-ments that contain an embedded derivative. At inception of the financial instrument, we assess (1) if the economiccharacteristics of the embedded derivative are clearly andclosely related to the economic characteristics of the financialinstrument (host contract), (2) if the financial instrument that embodies both the embedded derivative and the hostcontract is measured at fair value with changes in fair valuereported in earnings, or (3) if a separate instrument with the same terms as the embedded instrument would meet thedefinition of a derivative. If the embedded derivative doesnot meet any of these conditions, we separate it from thehost contract and carry it at fair value with changes recordedin current period earnings.

69
We regularly explore opportunities to acquire financial servicescompanies and businesses. Generally, we do not make a publicannouncement about an acquisition opportunity until adefinitive agreement has been signed.
Effective December 31, 2004, we completed the acquisitionof $29 billion in assets under management, consisting of $24 billion in mutual fund assets and $5 billion in institutionalinvestment accounts, from Strong Financial Corporation.Other business combinations completed in 2005, 2004 and2003 are presented below.
Note 2: Business Combinations
At December 31, 2005, we had three pending businesscombinations with total assets of approximately $278 million.We expect to complete these transactions by second quarter 2006.
For information on contingent consideration related to acquisitions, which is considered to be a guarantee, seeNote 24.
(in millions) Date Assets
2005Certain branches of PlainsCapital Bank, Amarillo, Texas July 22 $ 190First Community Capital Corporation, Houston, Texas July 31 644Other (1) Various 40
$ 874
2004Other (2) Various $ 74
2003Certain assets of Telmark, LLC, Syracuse, New York February 28 $ 660Pacific Northwest Bancorp, Seattle, Washington October 31 3,245Two Rivers Corporation, Grand Junction, Colorado October 31 74Other (3) Various 136
$ 4,115
(1) Consists of 8 acquisitions of insurance brokerage and lockbox processing businesses.(2) Consists of 13 acquisitions of insurance brokerage and payroll services businesses.(3) Consists of 14 acquisitions of asset management, commercial real estate brokerage, bankruptcy and insurance brokerage businesses.

70
Note 4: Federal Funds Sold, Securities Purchased Under Resale Agreements and Other Short-Term Investments
The table to the right provides the detail of federal fundssold, securities purchased under resale agreements and othershort-term investments.
(in millions) December 31,2005 2004
Federal funds sold and securities purchased under resale agreements $3,789 $3,009
Interest-earning deposits 847 1,397
Other short-term investments 670 614
Total $5,306 $5,020
Federal Reserve Board regulations require that each of oursubsidiary banks maintain reserve balances on deposits withthe Federal Reserve Banks. The average required reserve balance was $1.4 billion in 2005 and $1.2 billion in 2004.
Federal law restricts the amount and the terms of bothcredit and non-credit transactions between a bank and itsnonbank affiliates. They may not exceed 10% of the bank’scapital and surplus (which for this purpose represents Tier 1and Tier 2 capital, as calculated under the risk-based capitalguidelines, plus the balance of the allowance for credit lossesexcluded from Tier 2 capital) with any single nonbank affili-ate and 20% of the bank’s capital and surplus with all itsnonbank affiliates. Transactions that are extensions of creditmay require collateral to be held to provide added security tothe bank. (For further discussion of risk-based capital, seeNote 25.)
Dividends paid by our subsidiary banks are subject tovarious federal and state regulatory limitations. Dividendsthat may be paid by a national bank without the express
Note 3: Cash, Loan and Dividend Restrictions
approval of the Office of the Comptroller of the Currency(OCC) are limited to that bank’s retained net profits for thepreceding two calendar years plus retained net profits up tothe date of any dividend declaration in the current calendaryear. Retained net profits, as defined by the OCC, consist of net income less dividends declared during the period. Wealso have state-chartered subsidiary banks that are subject to state regulations that limit dividends. Under those provi-sions, our national and state-chartered subsidiary bankscould have declared additional dividends of $1,185 millionat December 31, 2005, without obtaining prior regulatoryapproval. Our nonbank subsidiaries are also limited by cer-tain federal and state statutory provisions and regulationscovering the amount of dividends that may be paid in anygiven year. Based on retained earnings at year-end 2005, our nonbank subsidiaries could have declared additional dividends of $2,411 million at December 31, 2005, withoutobtaining prior approval.

71
The following table shows the unrealized gross losses and fair value of securities in the securities available for sale portfolio at December 31, 2005 and 2004, by length of time that individual securities in each category had been in a continuous loss position.
The decline in fair value for the debt securities that hadbeen in a continuous loss position for 12 months or more atDecember 31, 2005, was primarily due to changes in market
The following table provides the cost and fair value for themajor categories of securities available for sale carried at fair
Note 5: Securities Available for Sale
value. There were no securities classified as held to maturityas of the periods presented.
interest rates and not due to the credit quality of the securities.We believe that the principal and interest on these securitiesare fully collectible and we have the intent and ability toretain our investment for a period of time to allow for anyanticipated recovery in market value. We have reviewed thesesecurities in accordance with our policy and do not considerthem to be other-than-temporarily impaired.
(in millions) December 31, 2005 2004
Cost Unrealized Unrealized Fair Cost Unrealized Unrealized Fairgross gross value gross gross valuegains losses gains losses
Securities of U.S. Treasury and federal agencies $ 845 $ 4 $ (10) $ 839 $ 1,128 $ 16 $ (4) $ 1,140Securities of U.S. states and political subdivisions 3,048 149 (6) 3,191 3,429 196 (4) 3,621Mortgage-backed securities:
Federal agencies 25,304 336 (24) 25,616 20,198 750 (4) 20,944Private collateralized
mortgage obligations (1) 6,628 128 (6) 6,750 4,082 121 (4) 4,199Total mortgage-backed securities 31,932 464 (30) 32,366 24,280 871 (8) 25,143
Other 4,518 75 (55) 4,538 2,974 157 (14) 3,117Total debt securities 40,343 692 (101) 40,934 31,811 1,240 (30) 33,021
Marketable equity securities 558 349 (7) 900 507 198 (9) 696
Total (2) $40,901 $1,041 $(108) $41,834 $32,318 $1,438 $(39) $33,717
(1) Substantially all of the private collateralized mortgage obligations are AAA-rated bonds collateralized by 1-4 family residential first mortgages.(2) At December 31, 2005, we held no securities of any single issuer (excluding the U.S.Treasury and federal agencies) with a book value that exceeded 10% of stockholders’ equity.
(in millions) Less than 12 months 12 months or more TotalUnrealized Fair Unrealized Fair Unrealized Fair
gross value gross value gross valuelosses losses losses
December 31, 2005
Securities of U.S. Treasury and federal agencies $ (6) $ 341 $ (4) $142 $ (10) $ 483Securities of U.S. states and political subdivisions (3) 204 (3) 57 (6) 261Mortgage-backed securities:
Federal agencies (22) 2,213 (2) 89 (24) 2,302Private collateralized
mortgage obligations (6) 1,494 — — (6) 1,494Total mortgage-backed securities (28) 3,707 (2) 89 (30) 3,796
Other (38) 890 (17) 338 (55) 1,228Total debt securities (75) 5,142 (26) 626 (101) 5,768
Marketable equity securities (7) 185 — — (7) 185
Total $(82) $5,327 $(26) $626 $(108) $5,953
December 31, 2004
Securities of U.S. Treasury and federal agencies $ (4) $ 304 $ — $ — $ (4) $ 304Securities of U.S. states and political subdivisions (1) 65 (3) 62 (4) 127Mortgage-backed securities:
Federal agencies (4) 450 — — (4) 450Private collateralized
mortgage obligations (4) 981 — — (4) 981Total mortgage-backed securities (8) 1,431 — — (8) 1,431
Other (11) 584 (3) 56 (14) 640Total debt securities (24) 2,384 (6) 118 (30) 2,502
Marketable equity securities (9) 44 — — (9) 44
Total $(33) $ 2,428 $ (6) $118 $ (39) $ 2,546

72
(in millions) December 31, 2005Total Weighted- Remaining contractual principal maturity
amount average After one year After five yearsyield Within one year through five years through ten years After ten years
Amount Yield Amount Yield Amount Yield Amount Yield
Securities of U.S. Treasury and federal agencies $ 839 4.38% $ 50 5.11% $ 677 4.21% $ 93 4.69% $ 19 6.88%
Securities of U.S. states andpolitical subdivisions 3,191 7.57 86 6.63 281 6.06 560 7.25 2,264 7.87
Mortgage-backed securities:Federal agencies 25,616 5.68 33 6.02 49 6.51 69 5.91 25,465 5.68Private collateralized
mortgage obligations 6,750 5.40 — — — — 42 6.45 6,708 5.40Total mortgage-backed securities 32,366 5.62 33 6.02 49 6.51 111 6.12 32,173 5.62
Other 4,538 6.11 225 5.80 2,773 5.70 953 7.13 587 6.53
Total debt securities at fair value (1) $40,934 5.80% $394 5.91% $3,780 5.47% $1,717 6.97% $35,043 5.78%
(1) The weighted-average yield is computed using the contractual life amortization method.
(in millions) Year ended December 31,2005 2004 2003
Realized gross gains $ 355 $ 168 $ 178
Realized gross losses (1) (315) (108) (116)
Realized net gains $ 40 $ 60 $ 62
(1) Includes other-than-temporary impairment of $45 million, $9 million and $50 million for 2005, 2004 and 2003, respectively.
Securities pledged where the secured party has the right to sell or repledge totaled $5.3 billion at December 31, 2005,and $2.3 billion at December 31, 2004. Securities pledgedwhere the secured party does not have the right to sell orrepledge totaled $24.3 billion at December 31, 2005, and$19.4 billion at December 31, 2004, primarily to secure trustand public deposits and for other purposes as required orpermitted by law. We have accepted collateral in the form of securities that we have the right to sell or repledge of $3.4 billion at December 31, 2005, and $2.5 billion atDecember 31, 2004, of which we sold or repledged $2.3 billion and $1.7 billion, respectively.
The following table shows the remaining contractualprincipal maturities and contractual yields of debt securitiesavailable for sale. The remaining contractual principal maturities for mortgage-backed securities were allocatedassuming no prepayments. Remaining expected maturitieswill differ from contractual maturities because borrowers mayhave the right to prepay obligations before the underlyingmortgages mature.
The following table shows the realized net gains on thesales of securities from the securities available for sale portfolio, including marketable equity securities.

73
14% of total loans at December 31, 2005, compared with18% at the end of 2004. These loans are mostly within thelarger metropolitan areas in California, with no single areaconsisting of more than 3% of our total loans. Changes inreal estate values and underlying economic conditions forthese areas are monitored continuously within our credit risk management process.
Some of our real estate 1-4 family mortgage loans, includingfirst mortgage and home equity products, include an interest-only feature as part of the loan terms. At December 31, 2005,such loans were approximately 26% of total loans, comparedwith 28% at the end of 2004. Substantially all of these loansare considered to be prime or near prime. We do not offeroption adjustable-rate mortgage products, nor do we offervariable-rate mortgage products with fixed payment amounts,commonly referred to within the financial services industry asnegative amortizing mortgage loans.
A summary of the major categories of loans outstanding isshown in the following table. Outstanding loan balancesreflect unearned income, net deferred loan fees, and unamor-tized discount and premium totaling $3,918 million and$3,766 million at December 31, 2005 and 2004, respectively.
Loan concentrations may exist when there are amountsloaned to a multiple number of borrowers engaged in similaractivities or similar types of loans extended to a diverse groupof borrowers that would cause them to be similarly impactedby economic or other conditions. At December 31, 2005 and2004, we did not have concentrations representing 10% ormore of our total loan portfolio in commercial loans (byindustry); commercial real estate loans (other real estatemortgage and real estate construction) (by state or propertytype); or other revolving credit and installment loans (byproduct type). Our real estate 1-4 family mortgage loans toborrowers in the state of California represented approximately
Note 6: Loans and Allowance for Credit Losses
(in millions) December 31,2005 2004 2003 2002 2001
Commercial and commercial real estate:Commercial $ 61,552 $ 54,517 $ 48,729 $ 47,292 $ 47,547Other real estate mortgage 28,545 29,804 27,592 25,312 24,808Real estate construction 13,406 9,025 8,209 7,804 7,806Lease financing 5,400 5,169 4,477 4,085 4,017
Total commercial and commercial real estate 108,903 98,515 89,007 84,493 84,178Consumer:
Real estate 1-4 family first mortgage 77,768 87,686 83,535 44,119 29,317Real estate 1-4 family junior lien mortgage 59,143 52,190 36,629 28,147 21,801Credit card 12,009 10,260 8,351 7,455 6,700Other revolving credit and installment 47,462 34,725 33,100 26,353 23,502
Total consumer 196,382 184,861 161,615 106,074 81,320Foreign 5,552 4,210 2,451 1,911 1,598
Total loans $310,837 $287,586 $253,073 $192,478 $167,096
For certain extensions of credit, we may require collateral,based on our assessment of a customer’s credit risk. We holdvarious types of collateral, including accounts receivable,inventory, land, buildings, equipment, automobiles, financialinstruments, income-producing commercial properties and residential real estate. Collateral requirements for each customermay vary according to the specific credit underwriting, termsand structure of loans funded immediately or under a commitment to fund at a later date.
A commitment to extend credit is a legally binding agree-ment to lend funds to a customer, usually at a stated interestrate and for a specified purpose. These commitments have
fixed expiration dates and generally require a fee. When wemake such a commitment, we have credit risk. The liquidityrequirements or credit risk will be lower than the contractualamount of commitments to extend credit because a significantportion of these commitments are expected to expire withoutbeing used. Certain commitments are subject to loan agree-ments with covenants regarding the financial performance of the customer that must be met before we are required tofund the commitment. We use the same credit policies inextending credit for unfunded commitments and letters ofcredit that we use in making loans. For information onstandby letters of credit, see Note 24.

74
(in millions) December 31,2005 2004
Commercial and commercial real estate:Commercial $ 71,548 $ 59,603Other real estate mortgage 2,398 2,788Real estate construction 9,369 7,164
Total commercial and commercial real estate 83,315 69,555
Consumer:Real estate 1-4 family first mortgage 10,229 9,009Real estate 1-4 family junior lien mortgage 37,909 31,396Credit card 45,270 38,200Other revolving credit and installment 13,957 15,427
Total consumer 107,365 94,032Foreign 675 407
Total unfunded loan commitments $191,355 $163,994
In addition, we manage the potential risk in credit com-mitments by limiting the total amount of arrangements, bothby individual customer and in total, by monitoring the sizeand maturity structure of these portfolios and by applyingthe same credit standards for all of our credit activities.
The total of our unfunded loan commitments, net of allfunds lent and all standby and commercial letters of creditissued under the terms of these commitments, is summarizedby loan category in the following table:
We have an established process to determine the adequacyof the allowance for credit losses that assesses the risks andlosses inherent in our portfolio. This process supports anallowance consisting of two components, allocated andunallocated. For the allocated component, we combine estimates of the allowances needed for loans analyzed on a pooled basis and loans analyzed individually (includingimpaired loans).
Approximately two-thirds of the allocated allowance is determined at a pooled level for consumer loans and somesegments of commercial small business loans. We use fore-casting models to measure inherent loss in these portfolios.We frequently validate and update these models to capturerecent behavioral characteristics of the portfolios, as well aschanges in our loss mitigation or marketing strategies.
The remaining allocated allowance is for commercial loans,commercial real estate loans and lease financing. We initiallyestimate this portion of the allocated allowance by applyinghistorical loss factors statistically derived from tracking losscontent associated with actual portfolio movements over aspecified period of time, using a standardized loan grading
process. Based on this process, we assign loss factors to eachpool of graded loans and a loan equivalent amount forunfunded loan commitments and letters of credit. These estimates are then adjusted or supplemented where necessaryfrom additional analysis of long term average loss experience,external loss data, or other risks identified from current conditions and trends in selected portfolios. Also, we individually review nonperforming loans over $3 million for impairment based on cash flows or collateral. We includethe impairment on these nonperforming loans in the allocatedallowance unless it has already been recognized as a loss.
The potential risk from unfunded loan commitments andletters of credit for wholesale loan portfolios is consideredalong with the loss analysis of loans outstanding. Unfundedcommercial loan commitments and letters of credit are converted to a loan equivalent factor as part of the analysis.The reserve for unfunded credit commitments was $186 millionat December 31, 2005, and $188 million at December 31, 2004,both representing less than 5% of the total allowance forcredit losses.
The allocated allowance is supplemented by the unallo-cated allowance to adjust for imprecision and to incorporatethe range of probable outcomes inherent in estimates usedfor the allocated allowance. The unallocated allowance is the result of our judgment of risks inherent in the portfolio,economic uncertainties, historical loss experience and othersubjective factors, including industry trends.
No material changes in estimation methodology for theallowance for credit losses were made in 2005.
The ratios of the allocated allowance and the unallocatedallowance to the total allowance may change from period toperiod. The total allowance reflects management’s estimateof credit losses inherent in the loan portfolio, includingunfunded credit commitments, at December 31, 2005.
Like all national banks, our subsidiary national bankscontinue to be subject to examination by their primary regulator, the Office of the Comptroller of the Currency(OCC), and some have OCC examiners in residence. TheOCC examinations occur throughout the year and targetvarious activities of our subsidiary national banks, includingboth the loan grading system and specific segments of theloan portfolio (for example, commercial real estate andshared national credits). The Parent and its nonbank subsidiaries are examined by the Federal Reserve Board.
We consider the allowance for credit losses of $4.06 billionadequate to cover credit losses inherent in the loan portfolio,including unfunded credit commitments, at December 31, 2005.

75
(in millions) Year ended December 31,2005 2004 2003 2002 2001
Balance, beginning of year $ 3,950 $ 3,891 $ 3,819 $ 3,717 $ 3,681
Provision for credit losses 2,383 1,717 1,722 1,684 1,727
Loan charge-offs:Commercial and commercial real estate:
Commercial (406) (424) (597) (716) (692)Other real estate mortgage (7) (25) (33) (24) (32)Real estate construction (6) (5) (11) (40) (37)Lease financing (35) (62) (41) (21) (22)
Total commercial and commercial real estate (454) (516) (682) (801) (783)Consumer:
Real estate 1-4 family first mortgage (111) (53) (47) (39) (40)Real estate 1-4 family junior lien mortgage (136) (107) (77) (55) (36)Credit card (553) (463) (476) (407) (421)Other revolving credit and installment (1,480) (919) (827) (770) (770)
Total consumer (2,280) (1,542) (1,427) (1,271) (1,267)Foreign (298) (143) (105) (84) (78)
Total loan charge-offs (3,032) (2,201) (2,214) (2,156) (2,128)Loan recoveries:
Commercial and commercial real estate:Commercial 133 150 177 162 96Other real estate mortgage 16 17 11 16 22Real estate construction 13 6 11 19 3Lease financing 21 26 8 — —
Total commercial and commercial real estate 183 199 207 197 121Consumer:
Real estate 1-4 family first mortgage 21 6 10 8 6Real estate 1-4 family junior lien mortgage 31 24 13 10 8Credit card 86 62 50 47 40Other revolving credit and installment 365 220 196 205 203
Total consumer 503 312 269 270 257Foreign 63 24 19 14 18
Total loan recoveries 749 535 495 481 396Net loan charge-offs (2,283) (1,666) (1,719) (1,675) (1,732)
Other 7 8 69 93 41
Balance, end of year $ 4,057 $ 3,950 $ 3,891 $ 3,819 $ 3,717
Components:Allowance for loan losses $ 3,871 $ 3,762 $ 3,891 $ 3,819 $ 3,717Reserve for unfunded credit commitments (1) 186 188 — — —
Allowance for credit losses $ 4,057 $ 3,950 $ 3,891 $ 3,819 $ 3,717
Net loan charge-offs as a percentage of average total loans .77% .62% .81% .96% 1.10%
Allowance for loan losses as a percentage of total loans 1.25% 1.31% 1.54% 1.98% 2.22%Allowance for credit losses as a percentage of total loans 1.31 1.37 1.54 1.98 2.22
(1) Effective September 30, 2004, we transferred the portion of the allowance for loan losses related to commercial lending commitments and letters of credit to other liabilities.
The allowance for credit losses consists of the allowance for loan losses and the reserve for unfunded credit commitments.Changes in the allowance for credit losses were:

(in millions) December 31,2005 2004
Impairment measurement based on:Collateral value method $115 $183Discounted cash flow method 75 126
Total (1) $190 $309
(1) Includes $56 million and $107 million of impaired loans with a related allowanceof $10 million and $17 million at December 31, 2005 and 2004, respectively.
The average recorded investment in impaired loans during2005, 2004 and 2003 was $260 million, $481 million and$668 million, respectively.
All of our impaired loans are on nonaccrual status. Whenthe ultimate collectibility of the total principal of an impairedloan is in doubt, all payments are applied to principal, underthe cost recovery method. When the ultimate collectibility of the total principal of an impaired loan is not in doubt,contractual interest is credited to interest income whenreceived, under the cash basis method. Total interest incomerecognized for impaired loans in 2005, 2004 and 2003 underthe cash basis method was not significant.
Nonaccrual loans were $1,338 million and $1,358 millionat December 31, 2005 and 2004, respectively. Loans past due90 days or more as to interest or principal and still accruinginterest were $3,606 million at December 31, 2005, and$2,578 million at December 31, 2004. The 2005 and 2004balances included $2,923 million and $1,820 million, respectively, in advances pursuant to our servicing agree-ments to the Government National Mortgage Associationmortgage pools whose repayments are insured by the FederalHousing Administration or guaranteed by the Department ofVeteran Affairs.
The recorded investment in impaired loans and themethodology used to measure impairment was:
76

77
(in millions) Year ended December 31,2005 2004 2003
Net gains (losses) from private equity investments $351 $319 $ (3)
Net gains from all other nonmarketable equity investments 43 33 116Net gains from nonmarketable
equity investments $394 $352 $113
(1) At December 31, 2005 and 2004, $3.1 billion and $3.3 billion, respectively,of nonmarketable equity investments, including all federal bank stock,were accounted for at cost.
Note 7: Premises, Equipment, Lease Commitments and Other Assets
Operating lease rental expense (predominantly for premises),net of rental income, was $583 million, $586 million and $574 million in 2005, 2004 and 2003, respectively.
The components of other assets were:
Depreciation and amortization expense for premises andequipment was $810 million, $654 million and $666 millionin 2005, 2004 and 2003, respectively.
Net gains (losses) on dispositions of premises and equipment,included in noninterest expense, were $56 million, $(5) millionand $(46) million in 2005, 2004 and 2003, respectively.
We have obligations under a number of noncancelableoperating leases for premises (including vacant premises) and equipment. The terms of these leases, including renewaloptions, are predominantly up to 15 years, with the longestup to 72 years, and many provide for periodic adjustment of rentals based on changes in various economic indicators.The future minimum payments under noncancelable operatingleases and capital leases, net of sublease rentals, with termsgreater than one year as of December 31, 2005, were:
Income related to nonmarketable equity investments was:
(in millions) December 31,2005 2004
Land $ 649 $ 585Buildings 3,617 2,974Furniture and equipment 3,425 3,110Leasehold improvements 1,115 1,049Premises and equipment leased
under capital leases 60 60Total premises and equipment 8,866 7,778
Less: Accumulated depreciation and amortization 4,449 3,928
Net book value, premises and equipment $4,417 $3,850
(in millions) Operating leases Capital leases
Year ended December 31,2006 $ 514 $ 42007 426 22008 360 22009 298 12010 237 1Thereafter 898 14
Total minimum lease payments $2,733 24
Executory costs (2)Amounts representing interest (8)
Present value of net minimum lease payments $14
(in millions) December 31,2005 2004
Nonmarketable equity investments:Private equity investments $ 1,537 $ 1,449Federal bank stock 1,402 1,713All other 2,151 2,067
Total nonmarketable equityinvestments (1) 5,090 5,229
Operating lease assets 3,414 3,642Accounts receivable 11,606 2,682Interest receivable 2,279 1,483Core deposit intangibles 489 603Foreclosed assets 191 212Due from customers on acceptances 104 170Other 9,299 8,470
Total other assets $32,472 $22,491
77

78
The gross carrying amount of intangible assets and accumulated amortization was:
Note 8: Intangible Assets
We based the projections of amortization expense formortgage servicing rights shown above on existing asset balances and the existing interest rate environment as of December 31, 2005. Future amortization expense may be significantly different depending upon changes in themortgage servicing portfolio, mortgage interest rates andmarket conditions. We based the projections of amortizationexpense for core deposit intangibles shown above on existingasset balances at December 31, 2005. Future amortizationexpense may vary based on additional core deposit intangibles acquired through business combinations.
(in millions) December 31,2005 2004
Gross Accumulated Gross Accumulatedcarrying amortization carrying amortizationamount amount
Amortized intangible assets:Mortgage servicing
rights, beforevaluation allowance (1) $ 25,126 $ 11,428 $18,903 $ 9,437
Core deposit intangibles 2,432 1,943 2,426 1,823
Other 567 312 567 296Total amortized
intangible assets $28,125 $13,683 $21,896 $11,556Unamortized
intangible asset (trademark) $ 14 $ 14
(1) See Note 21 for additional information on MSRs and the related valuation allowance.
(in millions) Mortgage Core Other Totalservicing deposit
rights intangibles
Year ended December 31, 2005 $1,991 $123 $55 $2,169
Estimate for year ended December 31,
2006 $ 1,959 $111 $48 $ 2,1182007 1,659 101 46 1,8062008 1,426 93 30 1,5492009 1,246 85 25 1,3562010 1,068 77 23 1,168
As of December 31, 2005, the current year and estimatedfuture amortization expense for amortized intangible assets was:

79
The changes in the carrying amount of goodwill as allocated to our operating segments for goodwill impairment analysis were:
Note 9: Goodwill
For goodwill impairment testing, enterprise-level goodwillacquired in business combinations is allocated to reporting unitsbased on the relative fair value of assets acquired and recordedin the respective reporting units. Through this allocation, weassigned enterprise-level goodwill to the reporting units that are expected to benefit from the synergies of the combination.We used discounted estimated future net cash flows to evaluategoodwill reported at all reporting units.
For our goodwill impairment analysis, we allocate all of the goodwill to the individual operating segments. Formanagement reporting we do not allocate all of the goodwillto the individual operating segments: some is allocated at the enterprise level. See Note 19 for further information on management reporting. The balances of goodwill formanagement reporting were:
(in millions) Community Wholesale Wells Fargo Enterprise ConsolidatedBanking Banking Financial Company
December 31, 2004 $ 3,433 $ 1,087 $364 $ 5,797 $ 10,681
December 31, 2005 $3,527 $1,097 $366 $5,797 $10,787
(in millions) Community Wholesale Wells Fargo ConsolidatedBanking Banking Financial Company
December 31, 2003 $ 7,286 $ 2,735 $ 350 $ 10,371Goodwill from business combinations 5 302 — 307Foreign currency translation adjustments — — 3 3
December 31, 2004 7,291 3,037 353 10,681Reduction in goodwill related to divested businesses (31) (3) — (34)Goodwill from business combinations 125 13 — 138Realignment of automobile financing business (11) — 11 —Foreign currency translation adjustments — — 2 2
December 31, 2005 $7,374 $3,047 $366 $10,787

80
(in millions) December 31, 2005
Three months or less $45,763After three months through six months 2,154After six months through twelve months 5,867After twelve months 2,339
Total $56,123
The total of time certificates of deposit and other timedeposits issued by domestic offices was $74,023 million and $55,495 million at December 31, 2005 and 2004,respectively. Substantially all of those deposits were interest bearing. The contractual maturities of those deposits were:
Note 10: Deposits
Of those deposits, the amount of time deposits with adenomination of $100,000 or more was $56,123 million and $41,851 million at December 31, 2005 and 2004,respectively. The contractual maturities of these deposits were:
(in millions) December 31, 2005
2006 $66,7002007 3,8862008 1,8992009 7692010 538Thereafter 231
Total $74,023 Time certificates of deposit and other time deposits issuedby foreign offices with a denomination of $100,000 or morerepresent the majority of all of our foreign deposit liabilitiesof $14,621 million and $8,533 million at December 31, 2005and 2004, respectively.
Demand deposit overdrafts of $618 million and $470 mil-lion were included as loan balances at December 31, 2005and 2004, respectively.
The table below shows selected information for short-term borrowings, which generally mature in less than 30 days.
Note 11: Short-Term Borrowings
(in millions) 2005 2004 2003Amount Rate Amount Rate Amount Rate
As of December 31,Commercial paper and other short-term borrowings $ 3,958 3.80% $ 6,225 2.40% $ 6,709 1.26%
Federal funds purchased and securities sold under agreements to repurchase 19,934 3.99 15,737 2.04 17,950 .84
Total $23,892 3.96 $21,962 2.14 $24,659 .95
Year ended December 31,Average daily balanceCommercial paper and other short-term borrowings $ 9,548 3.09% $10,010 1.56% $11,506 1.22%
Federal funds purchased and securities sold under agreements to repurchase 14,526 3.09 16,120 1.22 18,392 .99
Total $24,074 3.09 $26,130 1.35 $29,898 1.08
Maximum month-end balanceCommercial paper and other short-term borrowings (1) $15,075 N/A $16,492 N/A $14,462 N/A
Federal funds purchased and securities sold under agreements to repurchase (2) 22,315 N/A 22,117 N/A 24,132 N/A
N/A – Not applicable.(1) Highest month-end balance in each of the last three years was in January 2005, July 2004 and January 2003.(2) Highest month-end balance in each of the last three years was in August 2005, June 2004 and April 2003.

81
Following is a summary of our long-term debt based on original maturity (reflecting unamortized debt discounts and premiums,where applicable):
Note 12: Long-Term Debt
(in millions) December 31,Maturity Stated 2005 2004date(s) interest
rate(s)
Wells Fargo & Company (Parent only)
SeniorFixed-Rate Notes (1) 2006-2035 2.20-6.875% $16,081 $12,970Floating-Rate Notes 2006-2015 Varies 21,711 20,155Extendable Notes (2) 2008-2015 Varies 10,000 5,500Equity-Linked Notes (3) 2006-2014 Varies 444 472Convertible Debenture (4) 2033 Varies 3,000 3,000
Total senior debt – Parent 51,236 42,097
SubordinatedFixed-Rate Notes (1) 2011-2023 4.625-6.65% 4,558 4,502FixFloat Notes 2012 4.00% through 2006, varies 300 299
Total subordinated debt – Parent 4,858 4,801
Junior SubordinatedFixed-Rate Notes (1)(5) 2031-2034 5.625-7.00% 3,247 3,248
Total junior subordinated debt – Parent 3,247 3,248
Total long-term debt – Parent 59,341 50,146
Wells Fargo Bank, N.A. and its subsidiaries (WFB, N.A.)
SeniorFixed-Rate Notes (1) 2006-2019 1.16-4.24% 256 218Floating-Rate Notes 2006-2034 Varies 3,138 7,615Floating-Rate Federal Home Loan Bank (FHLB) Advances (6) — — — 1,400FHLB Notes and Advances 2012 5.20% 203 200Equity-Linked Notes (3) 2006-2014 Varies 229 40Notes payable by subsidiaries — — — 79Obligations of subsidiaries under capital leases (Note 7) 14 19
Total senior debt – WFB, N.A. 3,840 9,571
SubordinatedFixFloat Notes (7) — — — 998Fixed-Rate Notes (1) 2010-2015 4.07-7.55% 4,330 2,821Other notes and debentures 2006-2013 4.50-12.00% 13 11
Total subordinated debt – WFB, N.A. 4,343 3,830
Total long-term debt – WFB, N.A. 8,183 13,401
Wells Fargo Financial, Inc., and its subsidiaries (WFFI)
SeniorFixed-Rate Notes 2006-2034 2.06-7.47% 7,159 5,343Floating-Rate Notes 2007-2010 Varies 1,714 1,303
Total long-term debt – WFFI $ 8,873 $ 6,646
(1) We entered into interest rate swap agreements for a major portion of these notes, whereby we receive fixed-rate interest payments approximately equal to interest on the notes and make interest payments based on an average one-month, three-month or six-month London Interbank Offered Rate (LIBOR).
(2) The extendable notes are floating-rate securities with an initial maturity of 13 months or 2 years, which can be extended, respectively, on a rolling monthly basis,to a final maturity of 5 or 6 years, or, on a 6 month rolling basis, to a final maturity of 10 years, at the investor’s option.
(3) These notes are linked to baskets of equities, commodities or equity indices.(4) On April 15, 2003, we issued $3 billion of convertible senior debentures as a private placement. In November 2004, we amended the indenture under which the
debentures were issued to eliminate a provision in the indenture that prohibited us from paying cash upon conversion of the debentures if an event of default as defined in the indenture exists at the time of conversion. We then made an irrevocable election under the indenture on December 15, 2004, that upon conversion of the debentures, we must satisfy the accreted value of the obligation (the amount accrued to the benefit of the holder exclusive of the conversion spread) in cash and may satisfy the conversion spread (the excess conversion value over the accreted value) in either cash or stock. We can also redeem all or some of the convertibledebt securities for cash at any time on or after May 5, 2008, at their principal amount plus accrued interest, if any.
(5) Effective December 31, 2003, as a result of the adoption of FIN 46R we deconsolidated certain wholly-owned trusts formed for the sole purpose of issuing trust preferred securities (the Trusts). The junior subordinated debentures held by the Trusts are included in the Company’s long-term debt.
(6) During 2005, the FHLB exercised their put options on all outstanding floating-rate advances.(7) Note was called in June 2005.
(continued on following page)

82
(in millions) December 31,Maturity Stated 2005 2004date(s) interest
rate(s)
Other consolidated subsidiaries
SeniorFixed-Rate Notes 2006-2045 1.50-6.90% $ 502 $ 564Floating-Rate FHLB Advances 2008-2009 Varies 500 500Other notes and debentures – Floating-Rate 2012 Varies 14 1Obligations of subsidiaries under capital leases (Note 7) — 1
Total senior debt – Other consolidated subsidiaries 1,016 1,066
SubordinatedFixed-Rate Notes (1) 2006-2009 1.00-13.87% 1,138 1,194Other notes and debentures – Floating-Rate 2011-2015 Varies 66 95
Total subordinated debt – Other consolidated subsidiaries 1,204 1,289
Junior SubordinatedFixed-Rate Notes (5) 2026-2031 7.73-10.18% 869 865Floating-Rate Notes (5) 2027-2034 Varies 182 167
Total junior subordinated debt – Other consolidated subsidiaries 1,051 1,032
Total long-term debt – Other consolidated subsidiaries 3,271 3,387
Total long-term debt $79,668 $73,580
At December 31, 2005, aggregate annual maturities oflong-term debt obligations (based on final maturity dates)were as follows:
(in millions) Parent Company
2006 $ 7,309 $11,1242007 10,557 13,9622008 11,648 13,7422009 5,904 6,9262010 6,911 8,943Thereafter 17,012 24,971
Total $59,341 $79,668
(continued from previous page)
The interest rates on floating-rate notes are determinedperiodically by formulas based on certain money marketrates, subject, on certain notes, to minimum or maximuminterest rates.
As part of our long-term and short-term borrowingarrangements, we are subject to various financial and operational covenants. Some of the agreements under whichdebt has been issued have provisions that may limit themerger or sale of certain subsidiary banks and the issuanceof capital stock or convertible securities by certain subsidiarybanks. At December 31, 2005, we were in compliance withall the covenants.

83
We are authorized to issue 20 million shares of preferredstock and 4 million shares of preference stock, both withoutpar value. Preferred shares outstanding rank senior to com-mon shares both as to dividends and liquidation preferencebut have no general voting rights. We have not issued anypreference shares under this authorization.
ESOP CUMULATIVE CONVERTIBLE PREFERRED STOCK
All shares of our ESOP (Employee Stock Ownership Plan)Cumulative Convertible Preferred Stock (ESOP PreferredStock) were issued to a trustee acting on behalf of the Wells Fargo & Company 401(k) Plan (the 401(k) Plan).Dividends on the ESOP Preferred Stock are cumulative from the date of initial issuance and are payable quarterly
Note 13: Preferred Stock
at annual rates ranging from 8.50% to 12.50%, dependingupon the year of issuance. Each share of ESOP PreferredStock released from the unallocated reserve of the 401(k)Plan is converted into shares of our common stock based on the stated value of the ESOP Preferred Stock and the then current market price of our common stock. The ESOPPreferred Stock is also convertible at the option of the holderat any time, unless previously redeemed. We have the optionto redeem the ESOP Preferred Stock at any time, in whole orin part, at a redemption price per share equal to the higherof (a) $1,000 per share plus accrued and unpaid dividends or(b) the fair market value, as defined in the Certificates ofDesignation for the ESOP Preferred Stock.
(1) Liquidation preference $1,000.(2) In accordance with the American Institute of Certified Public Accountants (AICPA) Statement of Position 93-6, Employers’ Accounting for Employee Stock Ownership
Plans, we recorded a corresponding charge to unearned ESOP shares in connection with the issuance of the ESOP Preferred Stock. The unearned ESOP shares arereduced as shares of the ESOP Preferred Stock are committed to be released. For information on dividends paid, see Note 14.
Shares issued Carrying amountand outstanding (in millions) Adjustable December 31, December 31, dividend rate
2005 2004 2005 2004 Minimum Maximum
ESOP Preferred Stock (1):
2005 102,184 — $ 102 $ — 9.75% 10.75%
2004 74,880 89,420 75 90 8.50 9.50
2003 52,643 60,513 53 61 8.50 9.50
2002 39,754 46,694 40 47 10.50 11.50
2001 28,263 34,279 28 34 10.50 11.50
2000 19,282 24,362 19 24 11.50 12.50
1999 6,368 8,722 6 9 10.30 11.30
1998 1,953 2,985 2 3 10.75 11.75
1997 136 2,206 — 2 9.50 10.50
1996 — 382 — — 8.50 9.50
Total ESOP Preferred Stock 325,463 269,563 $ 325 $ 270
Unearned ESOP shares (2) $(348) $(289)

84
Note 14: Common Stock and Stock Plans
Common StockOur reserved, issued and authorized shares of common stockat December 31, 2005, were:
Options also may include the right to acquire a “reload”stock option. If an option contains the reload feature and if a participant pays all or part of the exercise price of theoption with shares of stock purchased in the market or held by the participant for at least six months, upon exerciseof the option, the participant is granted a new option to purchase, at the fair market value of the stock as of the dateof the reload, the number of shares of stock equal to the sum of the number of shares used in payment of the exerciseprice and a number of shares with respect to related statutoryminimum withholding taxes. Options granted after 2003 didnot include a reload feature.
We did not record any compensation expense for theoptions granted under the plans during 2005, 2004 and2003, as the exercise price was equal to the quoted marketprice of the stock at the date of grant. The total number ofshares of common stock available for grant under the plansat December 31, 2005, was 116,604,733.
Holders of restricted shares and restricted share rights are entitled to the related shares of common stock at no costgenerally over three to five years after the restricted shares or restricted share rights were granted. Holders of restrictedshares generally are entitled to receive cash dividends paidon the shares. Holders of restricted share rights generally areentitled to receive cash payments equal to the cash dividendsthat would have been paid had the restricted share rightsbeen issued and outstanding shares of common stock. Exceptin limited circumstances, restricted shares and restrictedshare rights are canceled when employment ends.
In 2005, 26,400 restricted shares and restricted sharerights were granted with a weighted-average grant-date per share fair value of $61.59. In 2004, no restricted shares or restricted share rights were granted. In 2003, 61,740restricted shares and restricted share rights were grantedwith a weighted-average grant-date per share fair value of $56.05. At December 31, 2005, 2004 and 2003, therewere 353,022, 448,150 and 577,722 restricted shares and restricted share rights outstanding, respectively. Thecompensation expense for the restricted shares and restrictedshare rights equals the quoted market price of the relatedstock at the date of grant and is accrued over the vestingperiod. We recognized total compensation expense for therestricted shares and restricted share rights of $2 million in 2005, $3 million in 2004 and $4 million in 2003.
For various acquisitions and mergers since 1992, we converted employee and director stock options of acquiredor merged companies into stock options to purchase ourcommon stock based on the terms of the original stockoption plan and the agreed-upon exchange ratio.
Dividend Reinvestment and Common Stock Purchase PlansParticipants in our dividend reinvestment and common stockdirect purchase plans may purchase shares of our commonstock at fair market value by reinvesting dividends and/ormaking optional cash payments, under the plan’s terms.
Director PlansWe provide a stock award to non-employee directors as part of their annual retainer under our director plans. Wealso provide annual grants of options to purchase commonstock to each non-employee director elected or re-elected at the annual meeting of stockholders. The options can beexercised after six months and through the tenth anniversaryof the grant date.
Employee Stock PlansLONG-TERM INCENTIVE PLANS Our stock incentive plans providefor awards of incentive and nonqualified stock options, stockappreciation rights, restricted shares, restricted share rights,performance awards and stock awards without restrictions.Options must have an exercise price at or above fair marketvalue (as defined in the plan) of the stock at the date of grant(except for substitute or replacement options granted in connection with mergers or other acquisitions) and a term of no more than 10 years. Options granted in 2003 andprior generally become exercisable over three years from the date of grant. Options granted in 2004 and the beginningof 2005 generally were fully vested upon grant. EffectiveApril 26, 2005, options granted under our plan generallycannot fully vest in less than one year. Options granted generally have a contractual term of 10 years. Except as otherwise permitted under the plan, if employment is endedfor reasons other than retirement, permanent disability ordeath, the option period is reduced or the options are canceled.
Number of shares
Dividend reinvestment and common stock purchase plans 3,088,307
Director plans 651,102Stock plans (1) 307,357,126
Total shares reserved 311,096,535Shares issued 1,736,381,025Shares not reserved 3,952,522,440
Total shares authorized 6,000,000,000
(1) Includes employee option, restricted shares and restricted share rights, 401(k),profit sharing and compensation deferral plans.

85
date of grant, or (2) when the quoted market price of thestock reaches a predetermined price. These options generallyexpire 10 years after the date of grant. Because the exerciseprice of each PartnerShares grant has been equal to or higherthan the quoted market price of our common stock at thedate of grant, we have not recognized any compensationexpense in 2005 and prior years.
The following table summarizes stock option activity and related information for the three years ended December 31, 2005.
Director Plans Long-Term Incentive Plans Broad-Based PlansNumber Weighted-average Number Weighted-average Number Weighted-average
exercise price exercise price exercise price
Options outstanding as of December 31, 2002 349,108 $ 36.78 93,379,737 $ 40.35 50,088,196 $ 43.25
2003:Granted 62,346 47.22 23,052,384 (1) 46.04 — —Canceled — — (1,529,868) 46.76 (4,293,930) 46.85Exercised (59,707) 26.90 (13,884,561) 31.96 (6,408,797) 34.09Acquisitions 4,769 31.42 889,842 25.89 — —
Options outstanding as of December 31, 2003 356,516 40.19 101,907,534 42.56 39,385,469 44.35
2004:Granted 50,960 56.39 21,983,690 (1) 57.41 — —Canceled — — (1,241,637) 48.06 (2,895,200) 48.26Exercised (21,427) 18.81 (18,574,660) 37.89 (3,792,605) 34.84
Options outstanding as of December 31, 2004 386,049 43.51 104,074,927 46.46 32,697,664 45.10
2005:Granted 64,252 59.33 21,601,697(1) 60.12 — —Canceled (3,594) 19.93 (623,384) 51.80 (2,475,617) 47.51Exercised (57,193) 27.66 (14,514,952) 42.20 (5,729,286) 42.78Acquisitions — — 52,824 27.35 — —
Options outstanding as of December 31, 2005 389,514 $48.67 110,591,112 $49.65 24,492,761 $45.51
Outstanding options exercisable as of:
December 31, 2003 353,131 $ 40.08 63,257,541 $ 40.33 12,063,244 $ 35.21December 31, 2004 386,049 43.51 84,702,073 46.64 8,590,539 35.99December 31, 2005 389,514 48.67 103,053,320 49.80 14,444,786 42.10
(1) Includes 4,014,597, 4,909,864 and 2,311,824 reload grants in 2005, 2004 and 2003, respectively.
The following table presents the weighted-average pershare fair value of options granted estimated using a Black-Scholes option-pricing model and the weighted-averageassumptions used.
2005 2004 2003
Per share fair value of options granted:Director Plans $6.27 $9.34 $9.59Long-Term Incentive Plans 7.50 9.32 9.48
Expected life (years) 4.4 4.4 4.3Expected volatility 16.1% 23.8% 29.2%Risk-free interest rate 4.0 2.9 2.5Expected annual dividend yield 3.4 3.4 2.9
BROAD-BASED PLANS In 1996, we adopted the PartnerShares®
Stock Option Plan, a broad-based employee stock optionplan. It covers full- and part-time employees who were generally not included in the long-term incentive plansdescribed on the preceding page. The total number of shares of common stock authorized for issuance under theplan since inception through December 31, 2005, was54,000,000, including 3,669,903 shares available for grant.No options have been granted under the PartnerShares Plansince 2002. The exercise date of options granted under thePartnerShares Plan is the earlier of (1) five years after the

86
EMPLOYEE STOCK OWNERSHIP PLAN Under the Wells Fargo &Company 401(k) Plan (the 401(k) Plan), a defined contributionESOP, the 401(k) Plan may borrow money to purchase ourcommon or preferred stock. Since 1994, we have loanedmoney to the 401(k) Plan to purchase shares of our ESOPPreferred Stock. As we release and convert ESOP PreferredStock into common shares, we record compensation expenseequal to the current market price of the common shares.Dividends on the common shares allocated as a result of therelease and conversion of the ESOP Preferred Stock reduceretained earnings and the shares are considered outstanding
This table is a summary of our stock option plans described on the preceding page.
(in millions, except shares) Shares outstanding Dividends paid __________December 31, Year ended December 31,
2005 2004 2003 2005 2004 2003
Allocated shares (common) 36,917,501 33,921,758 31,927,982 $71 $61 $46Unreleased shares (preferred) 325,463 269,563 214,100 39 32 26
Fair value of unearned ESOP shares $325 $270 $214
Deferred Compensation Plan for Independent Sales AgentsWF Deferred Compensation Holdings, Inc. is a whollyowned subsidiary of the Parent formed solely to sponsor a deferred compensation plan for independent sales agentswho provide investment, financial and other qualifying services for or with respect to participating affiliates.
The balance of ESOP shares, the dividends on allocated shares of common stock and unreleased preferred shares paid to the401(k) Plan and the fair value of unearned ESOP shares were:
The plan, which became effective January 1, 2002, allowsparticipants to defer all or part of their eligible compensationpayable to them by a participating affiliate. The Parent has fully and unconditionally guaranteed the deferred compensation obligations of WF Deferred CompensationHoldings, Inc. under the plan.
December 31, 2005 Options outstanding Options exercisable
Range of exercise prices Number Weighted-average Weighted-average Number Weighted-averageexercise price remaining contractual exercise price
life (in yrs.)
Director Plans$13.49-$16.00 2,530 $13.49 1.01 2,530 $13.49$16.01-$25.04 17,010 24.09 .49 17,010 24.09$25.05-$38.29 34,620 33.09 1.88 34,620 33.09$38.30-$51.00 197,942 46.51 5.60 197,942 46.51$51.01-$69.01 137,412 59.38 7.69 137,412 59.38
Long-Term Incentive Plans$3.37-$5.06 29,012 $ 4.23 6.50 29,012 $ 4.23$5.07-$7.60 4,366 5.84 20.02 4,366 5.84$11.42-$17.13 101,430 16.53 .60 101,430 16.53$17.14-$25.71 57,574 23.33 3.53 57,574 23.33$25.72-$38.58 16,442,280 34.24 2.98 16,277,280 34.22$38.59-$71.30 93,956,450 52.41 5.99 86,583,658 52.80
Broad-Based Plans$16.56 287,403 $16.56 .56 287,403 $16.56$24.85-$37.81 5,107,673 35.35 2.42 5,107,673 35.35$37.82-$46.50 8,661,248 46.44 4.86 8,540,348 46.50$46.51-$51.15 10,436,437 50.50 6.22 509,362 50.50
for computing earnings per share. Dividends on the unallocatedESOP Preferred Stock do not reduce retained earnings, andthe shares are not considered to be common stock equivalentsfor computing earnings per share. Loan principal and interestpayments are made from our contributions to the 401(k)Plan, along with dividends paid on the ESOP PreferredStock. With each principal and interest payment, a portionof the ESOP Preferred Stock is released and, after conversionof the ESOP Preferred Stock into common shares, allocatedto the 401(k) Plan participants.

87
Note 15: Employee Benefits and Other Expenses
Employee BenefitsWe sponsor noncontributory qualified defined benefit retirement plans including the Cash Balance Plan. The Cash Balance Plan is an active plan that covers eligibleemployees (except employees of certain subsidiaries).
Under the Cash Balance Plan, eligible employees’ CashBalance Plan accounts are allocated a compensation creditbased on a percentage of their certified compensation. Thecompensation credit percentage is based on age and years of credited service. In addition, investment credits are allocated to participants quarterly based on their accumulatedbalances. Employees become vested in their Cash BalancePlan accounts after completing five years of vesting service or reaching age 65, if earlier.
Although we were not required to make a contribution in 2005 for our Cash Balance Plan, we funded the maximumamount deductible under the Internal Revenue Code, or$288 million. The total amount contributed for our pensionplans was $340 million. We expect that we will not berequired to make a contribution in 2006 for the CashBalance Plan. The maximum we can contribute in 2006 forthe Cash Balance Plan depends on several factors, includingthe finalization of participant data. Our decision on howmuch to contribute, if any, depends on other factors, including the actual investment performance of plan assets.Given these uncertainties, we cannot at this time reliablyestimate the maximum deductible contribution or theamount that we will contribute in 2006 to the Cash
Balance Plan. For the unfunded nonqualified pension plansand postretirement benefit plans, we will contribute the minimum required amount in 2006, which equals the benefitspaid under the plans. In 2005, we paid $78 million in benefitsfor the postretirement plans, which included $29 million in retiree contributions, and $13 million for the unfundedpension plans.
We sponsor defined contribution retirement plans including the 401(k) Plan. Under the 401(k) Plan, after one month of service, eligible employees may contribute upto 25% of their pretax certified compensation, although there may be a lower limit for certain highly compensatedemployees in order to maintain the qualified status of the401(k) Plan. Eligible employees who complete one year of service are eligible for matching company contributions,which are generally a 100% match up to 6% of an employee’scertified compensation. The matching contributions generallyvest over four years.
Expenses for defined contribution retirement plans were$370 million, $356 million and $257 million in 2005, 2004and 2003, respectively.
We provide health care and life insurance benefits for certain retired employees and reserve the right to terminateor amend any of the benefits at any time.
The information set forth in the following tables is based on current actuarial reports using the measurementdate of November 30 for our pension and postretirementbenefit plans.

88
(in millions) Year ended December 31, 2005 2004
Pension benefits Pension benefitsNon- Other Non- Other
Qualified qualified benefits Qualified qualified benefits
Fair value of plan assets at beginning of year $4,457 $ — $329 $3,690 $ — $272Actual return on plan assets 400 — 34 450 — 27Employer contribution 327 13 56 555 25 74Plan participants’ contributions — — 29 — — 26Benefits paid (242) (13) (78) (240) (25) (70)Foreign exchange impact 2 — — 2 — —Fair value of plan assets at end of year $4,944 $ — $370 $4,457 $ — $329
We seek to achieve the expected long-term rate of returnwith a prudent level of risk given the benefit obligations of the pension plans and their funded status. We target theCash Balance Plan’s asset allocation for a target mix range of 40–70% equities, 20–50% fixed income, and approximately10% in real estate, venture capital, private equity and otherinvestments. The target ranges employ a Tactical Asset
Allocation overlay, which is designed to overweight stocks or bonds when a compelling opportunity exists. The EmployeeBenefit Review Committee (EBRC), which includes severalmembers of senior management, formally reviews the investment risk and performance of the Cash Balance Plan on a quarterly basis. Annual Plan liability analysis and periodic asset/liability evaluations are also conducted.
The weighted-average assumptions used to determine theprojected benefit obligation were:
Year ended December 31, 2005 2004
Pension Other Pension Otherbenefits(1) benefits benefits(1) benefits
Discount rate 5.75% 5.75% 6.0% 6.0%Rate of compensation increase 4.0 — 4.0 —
The accumulated benefit obligation for the defined benefitpension plans was $4,076 million and $3,786 million atDecember 31, 2005 and 2004, respectively.
(in millions) December 31, 2005 2004 Pension benefits Pension benefits
Non- Other Non- OtherQualified qualified benefits Qualified qualified benefits
Projected benefit obligation at beginning of year $3,777 $228 $751 $3,387 $202 $698Service cost 208 21 21 170 23 17Interest cost 220 14 41 215 13 43Plan participants’ contributions — — 29 — — 26Amendments 37 — (44) (54) (12) (1)Actuarial gain (loss) 43 27 (12) 296 27 37Benefits paid (242) (13) (78) (240) (25) (70)Foreign exchange impact 2 — 1 3 — 1Projected benefit obligation at end of year $4,045 $277 $709 $3,777 $228 $751
The changes in the projected benefit obligation during 2005 and 2004 and the amounts included in the Consolidated BalanceSheet at December 31, 2005 and 2004, were:
(1) Includes both qualified and nonqualified pension benefits.
The changes in the fair value of plan assets during 2005 and 2004 were:

89
The table to the right provides information for pensionplans with benefit obligations in excess of plan assets, substantially due to our nonqualified pension plans.
(in millions) December 31,2005 2004
Projected benefit obligation $359 $294Accumulated benefit obligation 297 247Fair value of plan assets 60 55
Percentage of plan assets at December 31, 2005 2004
Pension Other Pension Otherplan benefit plan benefit
assets plan assets assets plan assets
Equity securities 69% 58% 63% 51%Debt securities 27 40 33 46Real estate 3 1 3 1Other 1 1 1 2
Total 100% 100% 100% 100%
This table reconciles the funded status of the plans to the amounts included in the Consolidated Balance Sheet.
(in millions) December 31, 2005 2004
Pension benefits Pension benefitsNon- Other Non- Other
Qualified qualified benefits Qualified qualified benefits
Funded status (1) $ 899 $(277) $(339) $ 680 $(228) $(422)Employer contributions in December — 2 4 — 1 5Unrecognized net actuarial loss 615 42 131 647 25 158Unrecognized net transition asset — — 3 — — 3Unrecognized prior service cost (25) (11) (51) (67) (20) (8)Accrued benefit income (cost) $1,489 $(244) $(252) $1,260 $(222) $(264)
Amounts recognized in the balance sheetconsist of:
Prepaid benefit cost $1,489 $ — $ — $1,260 $ — $ —Accrued benefit liability — (245) (252) — (223) (264)Accumulated other
comprehensive income — 1 — — 1 —Accrued benefit income (cost) $1,489 $(244) $(252) $1,260 $(222) $(264)
(1) Fair value of plan assets at year end less projected benefit obligation at year end.
The weighted-average allocation of plan assets was:
The net periodic benefit cost was:
(in millions) Year ended December 31, 2005 2004 2003
Pension benefits Pension benefits Pension benefitsNon- Other Non- Other Non- Other
Qualified qualified benefits Qualified qualified benefits Qualified qualified benefits
Service cost $ 208 $21 $ 21 $ 170 $23 $ 17 $ 164 $22 $ 15Interest cost 220 14 41 215 13 43 209 14 42Expected return
on plan assets (393) — (25) (327) — (23) (275) — (18)Recognized
net actuarial loss (gain) (1) 68 3 6 51 1 2 85 7 (3)
Amortization of prior service cost (4) (2) (1) (1) (1) (1) 16 — (1)
Amortization of unrecognized transition asset — — — — — — — — 1
Settlement — — — (2) 2 — — — —Net periodic
benefit cost $ 99 $36 $ 42 $ 106 $38 $ 38 $ 199 $43 $ 36
(1) Net actuarial loss (gain) is generally amortized over five years.

90
(in millions) Year ended December 31,2005 2004 2003
Outside professional services $835 $669 $509Contract services 596 626 866Travel and entertainment 481 442 389Outside data processing 449 418 404Advertising and promotion 443 459 392Postage 281 269 336Telecommunications 278 296 343
Year ended December 31, 2005 2004 2003
Pension Other Pension Other Pension Otherbenefits(1) benefits benefits(1) benefits benefits(1) benefits
Discount rate 6.0% 6.0% 6.5% 6.5% 7.0% 7.0%Expected
return on plan assets 9.0 9.0 9.0 9.0 9.0 9.0
Rate of compensation increase 4.0 — 4.0 — 4.0 —
(1) Includes both qualified and nonqualified pension benefits.
The weighted-average assumptions used to determine thenet periodic benefit cost were:
The long-term rate of return assumptions above werederived based on a combination of factors including (1) long-term historical return experience for major assetclass categories (for example, large cap and small cap domestic equities, international equities and domestic fixedincome), and (2) forward-looking return expectations forthese major asset classes.
To account for postretirement health care plans we use ahealth care cost trend rate to recognize the effect of expectedchanges in future health care costs due to medical inflation,utilization changes, new technology, regulatory requirementsand Medicare cost shifting. We assumed average annualincreases of 9.5% for health care costs for 2006. The rate of average annual increases is assumed to trend down 1%each year between 2006 and 2010. By 2010 and thereafter,we assumed rates of 5.5% for HMOs and for all other typesof coverage. Increasing the assumed health care trend by one percentage point in each year would increase the benefitobligation as of December 31, 2005, by $52 million and the total of the interest cost and service cost components of the net periodic benefit cost for 2005 by $4 million.Decreasing the assumed health care trend by one percentagepoint in each year would decrease the benefit obligation as of December 31, 2005, by $48 million and the total of theinterest cost and service cost components of the net periodicbenefit cost for 2005 by $4 million.
Other ExpensesExpenses exceeding 1% of total interest income and noninterestincome that are not otherwise shown separately in the financialstatements or Notes to Financial Statements were:
(in millions) Pension benefits OtherQualified Non-qualified benefits
Year ended December 31,
2006 $ 288 $ 24 $ 542007 315 27 552008 366 28 562009 329 34 572010 339 33 622011-2015 1,986 158 313
The investment strategy for the postretirement plans ismaintained separate from the strategy for the pension plans.The general target asset mix is 55–65% equities and 35–45%fixed income. In addition, the Retiree Medical Plan VoluntaryEmployees’ Beneficiary Association (VEBA) considers theeffect of income taxes by utilizing a combination of variableannuity and low turnover investment strategies. Members ofthe EBRC formally review the investment risk and performanceof the postretirement plans on a quarterly basis.
Future benefits, reflecting expected future service that we expect to pay under the pension and other benefit plans, were:

91
(in millions) December 31,2005 2004
Deferred Tax AssetsAllowance for loan losses $1,471 $1,430Net tax-deferred expenses 179 217Other 461 402
Total deferred tax assets 2,111 2,049
Deferred Tax LiabilitiesCore deposit intangibles 153 188Leasing 2,430 2,461Mark to market 708 448Mortgage servicing 3,517 2,848FAS 115 adjustment 368 535FAS 133 adjustment 29 23Other 501 486
Total deferred tax liabilities 7,706 6,989
Net Deferred Tax Liability $5,595 $4,940
The components of income tax expense were:
The tax benefit related to the exercise of employee stock options recorded in stockholders’ equity was $143 million, $175 million and $148 million for 2005, 2004 and 2003, respectively.
We had a net deferred tax liability of $5,595 million and$4,940 million at December 31, 2005 and 2004, respectively.The tax effects of temporary differences that gave rise to significant portions of deferred tax assets and liabilities are presented in the table to the right.
We have determined that a valuation reserve is notrequired for any of the deferred tax assets since it is morelikely than not that these assets will be realized principallythrough carry back to taxable income in prior years, futurereversals of existing taxable temporary differences, and, to a lesser extent, future taxable income and tax planningstrategies. Our conclusion that it is “more likely than not”that the deferred tax assets will be realized is based on federaltaxable income in excess of $17 billion in the carry-backperiod, substantial state taxable income in the carry-backperiod, as well as a history of growth in earnings.
Note 16: Income Taxes
(in millions) Year ended December 31,2005 2004 2003
Current:Federal $2,627 $2,815 $1,298State and local 346 354 165Foreign 91 154 114
3,064 3,323 1,577Deferred:
Federal 715 379 1,492State and local 98 53 206
813 432 1,698
Total $3,877 $3,755 $3,275
The deferred tax liability related to 2005, 2004 or 2003unrealized gains and losses on securities available for salealong with the deferred tax liability related to certain derivativeand hedging activities for 2005 and 2004, had no effect onincome tax expense as these gains and losses, net of taxes,were recorded in cumulative other comprehensive income.
The table below reconciles the statutory federal incometax expense and rate to the effective income tax expense and rate.
(in millions) Year ended December 31, 2005 2004 2003
Amount Rate Amount Rate Amount Rate
Statutory federal income tax expense and rate $4,042 35.0% $3,769 35.0% $3,317 35.0%Change in tax rate resulting from:
State and local taxes on income, net offederal income tax benefit 289 2.5 265 2.5 241 2.5
Tax-exempt income and tax credits (327) (2.8) (224) (2.1) (161) (1.7)Donations of appreciated securities (33) (.3) — — (90) (.9)Other (94) (.8) (55) (.5) (32) (.3)
Effective income tax expense and rate $3,877 33.6% $3,755 34.9% $3,275 34.6%

(in millions, except per share amounts) Year ended December 31,2005 2004 2003
Net income $ 7,671 $ 7,014 $ 6,202
Less: Preferred stock dividends — — 3
Net income applicable to common stock (numerator) $ 7,671 $ 7,014 $ 6,199
EARNINGS PER COMMON SHARE
Average common shares outstanding (denominator) 1,686.3 1,692.2 1,681.1
Per share $ 4.55 $ 4.15 $ 3.69
DILUTED EARNINGS PER COMMON SHARE
Average common shares outstanding 1,686.3 1,692.2 1,681.1
Add: Stock options 18.9 20.8 16.0
Restricted share rights .3 .4 .4
Diluted average common shares outstanding (denominator) 1,705.5 1,713.4 1,697.5
Per share $ 4.50 $ 4.09 $ 3.65
92
The table below shows earnings per common share anddiluted earnings per common share and reconciles thenumerator and denominator of both earnings per commonshare calculations.
Note 17: Earnings Per Common Share
At December 31, 2005, 2004 and 2003, options to purchase4.9 million, 3.3 million and 4.4 million shares, respectively,were outstanding but not included in the calculation of earn-ings per common share because the exercise price was higherthan the market price, and therefore they were antidilutive.

93
(in millions) Translation Net unrealized Net unrealized Cumulative other adjustments gains (losses) on gains (losses) on comprehensive income
securities and other derivatives and otherretained interests hedging activities
Balance, December 31, 2002 $(14) $1,030 $(40) $ 976
Net change 26 (117) 53 (38)Balance, December 31, 2003 12 913 13 938
Net change 12 (22) 22 12Balance, December 31, 2004 $ 24 $ 891 $ 35 $ 950
Net change 5 (298) 8 (285)Balance, December 31, 2005 $ 29 $ 593 $ 43 $ 665
(in millions) Year ended December 31, 2005 2004 2003
Before Tax Net of Before Tax Net of Before Tax Net oftax effect tax tax effect tax tax effect tax
Translation adjustments $ 8 $ 3 $ 5 $ 20 $ 8 $ 12 $ 42 $ 16 $ 26
Securities available for sale and other retained interests:Net unrealized gains (losses) arising
during the year (401) (143) (258) 35 12 23 (117) (42) (75)Reclassification of gains included
in net income (64) (24) (40) (72) (27) (45) (68) (26) (42)Net unrealized losses arising
during the year (465) (167) (298) (37) (15) (22) (185) (68) (117)
Derivatives and hedging activities:Net unrealized gains (losses) arising
during the year 349 134 215 (376) (137) (239) (1,629) (603) (1,026)Reclassification of net losses (gains)
on cash flow hedges included in net income (335) (128) (207) 413 152 261 1,707 628 1,079
Net unrealized gains arising during the year 14 6 8 37 15 22 78 25 53
Other comprehensive income $(443) $(158) $(285) $ 20 $ 8 $ 12 $ (65) $ (27) $ (38)
Note 18: Other Comprehensive Income
The components of other comprehensive income and the related tax effects were:
Cumulative other comprehensive income balances were:

94
Note 19: Operating Segments
We have three lines of business for management reporting:Community Banking, Wholesale Banking and Wells FargoFinancial. The results for these lines of business are based on our management accounting process, which assigns balance sheet and income statement items to each responsibleoperating segment. This process is dynamic and, unlikefinancial accounting, there is no comprehensive, authoritativeguidance for management accounting equivalent to generallyaccepted accounting principles. The management accountingprocess measures the performance of the operating segmentsbased on our management structure and is not necessarilycomparable with similar information for other financial services companies. We define our operating segments byproduct type and customer segments. If the managementstructure and/or the allocation process changes, allocations,transfers and assignments may change. To reflect the realignment of our automobile financing businesses intoWells Fargo Financial in 2005, segment results for prior periods have been revised.
The Community Banking Group offers a complete line of banking and diversified financial products and services toconsumers and small businesses with annual sales generallyup to $20 million in which the owner generally is the financialdecision maker. Community Banking also offers investmentmanagement and other services to retail customers and highnet worth individuals, insurance, securities brokerage throughaffiliates and venture capital financing. These products andservices include the Wells Fargo Advantage FundsSM, a familyof mutual funds, as well as personal trust and agency assets.Loan products include lines of credit, equity lines and loans,equipment and transportation (recreational vehicle andmarine) loans, education loans, origination and purchase of residential mortgage loans and servicing of mortgageloans and credit cards. Other credit products and financialservices available to small businesses and their ownersinclude receivables and inventory financing, equipment leases, real estate financing, Small Business Administrationfinancing, venture capital financing, cash management, payroll services, retirement plans, Health Savings Accountsand credit and debit card processing. Consumer and businessdeposit products include checking accounts, savings deposits,market rate accounts, Individual Retirement Accounts(IRAs), time deposits and debit cards.
Community Banking serves customers through a widerange of channels, which include traditional banking stores,in-store banking centers, business centers and ATMs. Also,Phone BankSM centers and the National Business BankingCenter provide 24-hour telephone service. Online bankingservices include single sign-on to online banking, bill pay and brokerage, as well as online banking for small business.
The Wholesale Banking Group serves businesses acrossthe United States with annual sales generally in excess of$10 million. Wholesale Banking provides a complete line of commercial, corporate and real estate banking productsand services. These include traditional commercial loans and lines of credit, letters of credit, asset-based lending,equipment leasing, mezzanine financing, high-yield debt,international trade facilities, foreign exchange services, treasury management, investment management, institutionalfixed income and equity sales, interest rate, commodity andequity risk management, online/electronic products such asthe Commercial Electronic Office® (CEO®) portal, insurancebrokerage services and investment banking services.Wholesale Banking manages and administers institutionalinvestments, employee benefit trusts and mutual funds,including the Wells Fargo Advantage Funds. WholesaleBanking includes the majority ownership interest in theWells Fargo HSBC Trade Bank, which provides trade financing, letters of credit and collection services and issometimes supported by the Export-Import Bank of theUnited States (a public agency of the United States offeringexport finance support for American-made products).Wholesale Banking also supports the commercial real estate market with products and services such as constructionloans for commercial and residential development, landacquisition and development loans, secured and unsecuredlines of credit, interim financing arrangements for completedstructures, rehabilitation loans, affordable housing loans and letters of credit, permanent loans for securitization,commercial real estate loan servicing and real estate andmortgage brokerage services.
Wells Fargo Financial includes consumer finance and autofinance operations. Consumer finance operations make directconsumer and real estate loans to individuals and purchasesales finance contracts from retail merchants from officesthroughout the United States and in Canada, Latin America,the Caribbean, Guam and Saipan. Automobile finance oper-ations specialize in purchasing sales finance contracts directlyfrom automobile dealers and making loans secured by auto-mobiles in the United States, Canada and Puerto Rico. Wells Fargo Financial also provides credit cards and leaseand other commercial financing.
The “Other” Column consists of unallocated goodwillbalances held at the enterprise level. This column also mayinclude separately identified transactions recorded at theenterprise level for management reporting.

95
(income/expense in millions,average balances in billions) Community Wholesale Wells Fargo Other (2) Consolidated
Banking Banking Financial Company
2005Net interest income (1) $12,708 $2,387 $3,409 $ — $18,504Provision for credit losses 895 1 1,487 — 2,383Noninterest income 9,822 3,352 1,271 — 14,445Noninterest expense 13,294 3,165 2,559 — 19,018Income before income
tax expense 8,341 2,573 634 — 11,548Income tax expense 2,812 840 225 — 3,877
Net income $ 5,529 $1,733 $ 409 $ — $ 7,671
2004Net interest income (1) $ 12,019 $ 2,209 $ 2,922 $ — $ 17,150Provision for credit losses 787 62 868 — 1,717Noninterest income 8,670 2,974 1,265 — 12,909Noninterest expense 12,312 2,728 2,357 176 17,573Income (loss) before income
tax expense (benefit) 7,590 2,393 962 (176) 10,769Income tax expense (benefit) 2,678 794 345 (62) 3,755
Net income (loss) $ 4,912 $ 1,599 $ 617 $(114) $ 7,014
2003Net interest income (1) $ 11,360 $ 2,228 $ 2,435 $ (16) $ 16,007Provision for credit losses 817 177 698 30 1,722Noninterest income 8,336 2,707 1,339 — 12,382Noninterest expense 12,332 2,579 2,228 51 17,190Income (loss) before income
tax expense (benefit) 6,547 2,179 848 (97) 9,477Income tax expense (benefit) 2,259 733 317 (34) 3,275
Net income (loss) $ 4,288 $ 1,446 $ 531 $ (63) $ 6,202
2005Average loans $ 187.0 $ 62.2 $ 46.9 $ — $ 296.1Average assets 298.6 88.7 52.7 5.8 445.8Average core deposits 218.2 24.6 — — 242.8
2004Average loans $ 178.9 $ 53.1 $ 37.6 $ — $ 269.6Average assets 284.2 77.6 43.0 5.8 410.6Average core deposits 197.8 25.5 .1 — 223.4
(1) Net interest income is the difference between interest earned on assets and the cost of liabilities to fund those assets. Interest earned includes actual interest earned on segment assets and, if the segment has excess liabilities, interest credits for providing funding to other segments. The cost of liabilities includes interest expense onsegment liabilities and, if the segment does not have enough liabilities to fund its assets, a funding charge based on the cost of excess liabilities from another segment.In general, Community Banking has excess liabilities and receives interest credits for the funding it provides the other segments.
(2) The items recorded at the enterprise level included a $176 million loss on debt extinguishment for 2004 and a $30 million non-recurring loss on sale of a sub-prime credit card portfolio and $51 million of other charges related to employee benefits and software for 2003.

96
In the normal course of creating securities to sell toinvestors, we may sponsor special-purpose entities that hold, for the benefit of the investors, financial instrumentsthat are the source of payment to the investors. Special-purposeentities are consolidated unless they meet the criteria for a qualifying special-purpose entity in accordance with FAS 140 or are not required to be consolidated under existing accounting guidance.
For securitizations completed in 2005 and 2004, we used the following assumptions to determine the fair valueof mortgage servicing rights and other retained interests atthe date of securitization.
Key economic assumptions and the sensitivity of the current fair value to immediate adverse changes in thoseassumptions at December 31, 2005, for the AAA-rated floating-rate mortgage-backed securities related to residentialmortgage loan securitizations are presented in the table onthe next page. The fair value of these securities was determinedusing quoted market prices.
(in millions) Year ended December 31, 2005 2004
Mortgage Other Mortgage Other loans financial loans financial
assets assets
Sales proceeds from securitizations $40,982 $225 $33,550 $ —
Servicing fees 154 — 88 —Cash flows on other
retained interests 560 6 138 11
Note 20: Securitizations and Variable Interest Entities
We routinely originate, securitize and sell into the secondarymarket home mortgage loans and, from time to time, otherfinancial assets, including student loans, commercial mortgageloans, home equity loans, auto receivables and securities. We typically retain the servicing rights and may retain other beneficial interests from these sales. Through thesesecuritizations, which are structured without recourse to us and with no restrictions on the retained interests, we maybe exposed to a liability under standard representations andwarranties we make to purchasers and issuers. The amountrecorded for this liability was not material to our consolidatedfinancial statements at year-end 2005 or 2004. We do nothave significant credit risks from the retained interests.
We recognized gains of $326 million from sales of financial assets in securitizations in 2005 and $199 millionin 2004. Additionally, we had the following cash flows withour securitization trusts.
Key economic assumptions and the sensitivity of the current fair value to immediate adverse changes in thoseassumptions at December 31, 2005, for mortgage servicingrights, both purchased and retained, and other retainedinterests related to residential mortgage loan securitizationsare presented in the following table.
($ in millions) Mortgage Other retained servicing rights interests
Fair value of retained interests $12,687 $ 223Expected weighted-average life (in years) 5.8 6.4
Prepayment speed assumption (annual CPR) 11.6% 8.6%Decrease in fair value from
10% adverse change $ 441 $ 7 Decrease in fair value from
25% adverse change 1,032 17
Discount rate assumption 10.5% 10.5%Decrease in fair value from
100 basis point adverse change $ 476 $ 7 Decrease in fair value from
200 basis point adverse change 916 14
Mortgage Other retainedservicing rights interests
2005 2004 2005 2004
Prepayment speed (annual CPR (1)) (2) 16.9% 16.8% 12.7% 14.9%
Life (in years) (2) 5.6 4.9 7.0 3.9Discount rate (2) 10.1% 9.9% 10.2% 10.3%
(1) Constant prepayment rate.(2) Represents weighted averages for all retained interests resulting from
securitizations completed in 2005 and 2004.
Retained interest – AAAmortgage-backed securities
2005 2004
Prepayment speed (annual CPR) 26.8% 34.8%Life (in years) 2.4 2.2Discount spread to LIBOR curve .22% .32%
We also retained some AAA-rated floating-rate mortgage-backed securities. The fair value at the date of securitizationwas determined using quoted market prices. The impliedCPR, life, and discount spread to the London InterbankOffered Rate (LIBOR) curve at the date of securitization is presented in the following table.

97
(in millions) December 31, Year ended December 31,Total loans (1) Delinquent loans (2) Net charge-offs (recoveries)
2005 2004 2005 2004 2005 2004
Commercial and commercial real estate:Commercial $ 61,552 $ 54,517 $ 304 $ 371 $ 273 $ 274Other real estate mortgage 45,042 48,402 344 370 11 32Real estate construction 13,406 9,025 40 63 (7) (1)Lease financing 5,400 5,169 45 68 14 36
Total commercial and commercial real estate 125,400 117,113 733 872 291 341Consumer:
Real estate 1-4 family first mortgage 136,261 132,703 709 724 90 47Real estate 1-4 family junior lien mortgage 59,143 52,190 194 132 105 83Credit card 12,009 10,260 159 150 467 401Other revolving credit and installment 48,287 43,744 470 476 1,115 699
Total consumer 255,700 238,897 1,532 1,482 1,777 1,230Foreign 5,930 4,527 71 99 239 122
Total loans owned and securitized 387,030 360,537 $2,336 $2,453 $2,307 $1,693Less:
Securitized loans 35,047 34,489Mortgages held for sale 40,534 29,723Loans held for sale 612 8,739
Total loans held $310,837 $287,586
(1) Represents loans on the balance sheet or that have been securitized, but excludes securitized loans that we continue to service but as to which we have no othercontinuing involvement.
(2) Includes nonaccrual loans and loans 90 days or more past due and still accruing.
This table presents information about the principal balances of owned and securitized loans.
We are a variable interest holder in certain special-purposeentities that are consolidated because we absorb a majorityof each entity’s expected losses, receive a majority of eachentity’s expected returns or both. We do not hold a majorityvoting interest in these entities. Our consolidated variableinterest entities (VIEs), substantially all of which wereformed to invest in securities and to securitize real estateinvestment trust securities, had approximately $2.5 billionand $6 billion in total assets at December 31, 2005 and2004, respectively. The primary activities of these entitiesconsist of acquiring and disposing of, and investing and reinvesting in securities, and issuing beneficial interests securedby those securities to investors. The creditors of most of theseconsolidated entities have no recourse against us.
We also hold variable interests greater than 20% but less than 50% in certain special-purpose entities formed to provide affordable housing and to securitize corporatedebt that had approximately $3 billion in total assets atDecember 31, 2005 and 2004. We are not required to consolidate these entities. Our maximum exposure to loss as a result of our involvement with these unconsolidatedvariable interest entities was approximately $870 million and $950 million at December 31, 2005 and 2004, respectively,predominantly representing investments in entities formed toinvest in affordable housing. We, however, expect to recoverour investment over time primarily through realization offederal low-income housing tax credits.
($ in millions) Retained interest – AAA
mortgage- backed
securities
Fair value of retained interests $3,358Expected weighted-average life (in years) 2.2
Prepayment speed assumption (annual CPR) 28.1%Decrease in fair value from 10% adverse change $ —Decrease in fair value from 25% adverse change —
Discount spread to LIBOR curve assumption .22%Decrease in fair value from 10 basis point adverse change $ 7Decrease in fair value from 20 basis point adverse change 14
The sensitivities in the previous tables are hypotheticaland should be relied on with caution. Changes in fair valuebased on a 10% variation in assumptions generally cannotbe extrapolated because the relationship of the change in the assumption to the change in fair value may not be linear.Also, in the previous tables, the effect of a variation in a particular assumption on the fair value of the retained interest is calculated independently without changing anyother assumption. In reality, changes in one factor may resultin changes in another (for example, changes in prepaymentspeed estimates could result in changes in the discount rates),which might magnify or counteract the sensitivities.

98
Mortgage banking activities, included in the CommunityBanking and Wholesale Banking operating segments, consist of residential and commercial mortgage originationsand servicing.
The components of mortgage banking noninterest income were:
Note 21: Mortgage Banking Activities
(in millions) Year ended December 31,2005 2004 2003
Servicing income, net:Servicing fees (1) $ 2,457 $ 2,101 $ 1,787Amortization (1,991) (1,826) (2,760)Reversal of provision (provision)
for mortgage servicing rightsin excess of fair value 378 208 (1,092)
Net derivative gains (losses):Fair value hedges (2) (46) 554 1,111Other (3) 189 — —
Total servicing income, net 987 1,037 (954)
Net gains on mortgage loanorigination/sales activities 1,085 539 3,019
All other 350 284 447Total mortgage banking
noninterest income $ 2,422 $ 1,860 $ 2,512
At the end of each quarter, we evaluate MSRs for possibleimpairment based on the difference between the carryingamount and current fair value of the MSRs by risk stratification.If a temporary impairment exists, we establish a valuationallowance for any excess of amortized cost, as adjusted for hedge accounting, over the current fair value through a charge to income. We have a policy of reviewing MSRs for other-than-temporary impairment each quarter and recognize a direct write-down when the recoverability of a recorded valuation allowance is determined to be remote.Unlike a valuation allowance, a direct write-down permanentlyreduces the carrying value of the MSRs and the valuationallowance, precluding subsequent reversals. (See Note 1 –Transfers and Servicing of Financial Assets for additional discussion of our policy for valuation of MSRs.)
(in millions) Year ended December 31,2005 2004 2003
Mortgage servicing rights:Balance, beginning of year $ 9,466 $ 8,848 $ 6,677
Originations (1) 2,652 1,769 3,546Purchases (1) 2,683 1,353 2,140Amortization (1,991) (1,826) (2,760)Write-down — (169) (1,338)Other (includes changes in
mortgage servicing rights due to hedging) 888 (509) 583
Balance, end of year $13,698 $ 9,466 $ 8,848
Valuation allowance:Balance, beginning of year $ 1,565 $ 1,942 $ 2,188
Provision (reversal of provision) for mortgage servicing rights in excess of fair value (378) (208) 1,092
Write-down of mortgage servicing rights — (169) (1,338)
Balance, end of year $ 1,187 $ 1,565 $ 1,942
Mortgage servicing rights, net $12,511 $ 7,901 $ 6,906
Ratio of mortgage servicing rights to related loans serviced for others 1.44% 1.15% 1.15%
(in billions) December 31,2005 2004
Loans serviced for others (1) $ 871 $688
Owned loans serviced (2) 118 117
Total owned servicing 989 805Sub-servicing 27 27
Total managed servicing portfolio $1,016 $832
(1) Consists of 1-4 family first mortgage and commercial mortgage loans.(2) Consists of mortgages held for sale and 1-4 family first mortgage loans.
(1) Based on December 31, 2005, assumptions, the weighted-average amortizationperiod for mortgage servicing rights added during the year was approximately5.6 years.
(1) Includes impairment write-downs on other retained interests of $79 million for 2003. There were no impairment write-downs on other retained interestsfor 2005 and 2004.
(2) Results related to mortgage servicing rights fair value hedging activities consist of gains (losses) excluded from the evaluation of hedge effectivenessand the ineffective portion of the change in the value of these derivatives.Gains and losses excluded from the evaluation of hedge effectiveness arethose caused by market conditions (volatility) and the spread between spotand forward rates priced into the derivative contracts (the passage of time).See Note 26 – Fair Value Hedges for additional discussion and detail.
(3) Other consists of results from free-standing derivatives used to economicallyhedge the risk of changes in fair value of mortgage servicing rights. See Note26 – Free-Standing Derivatives for additional discussion and detail.
The changes in mortgage servicing rights were:
The components of our managed servicing portfolio were:

99
Note 22: Condensed Consolidating Financial Statements
Condensed Consolidating Statement of Income
(in millions) Parent WFFI Other Eliminations Consolidatedconsolidating Company
subsidiaries
Year ended December 31, 2005
Dividends from subsidiaries:Bank $4,675 $ — $ — $(4,675) $ —Nonbank 763 — — (763) —
Interest income from loans — 4,467 16,809 (16) 21,260Interest income from subsidiaries 2,215 — — (2,215) —Other interest income 105 104 4,493 — 4,702
Total interest income 7,758 4,571 21,302 (7,669) 25,962
Deposits — — 3,848 — 3,848Short-term borrowings 256 223 897 (632) 744Long-term debt 2,000 1,362 598 (1,094) 2,866
Total interest expense 2,256 1,585 5,343 (1,726) 7,458
NET INTEREST INCOME 5,502 2,986 15,959 (5,943) 18,504Provision for credit losses — 1,582 801 — 2,383Net interest income after provision for credit losses 5,502 1,404 15,158 (5,943) 16,121
NONINTEREST INCOMEFee income – nonaffiliates — 224 8,111 — 8,335Other 298 223 5,727 (138) 6,110
Total noninterest income 298 447 13,838 (138) 14,445
NONINTEREST EXPENSESalaries and benefits 92 985 9,378 — 10,455Other 50 759 8,398 (644) 8,563
Total noninterest expense 142 1,744 17,776 (644) 19,018
INCOME BEFORE INCOME TAX EXPENSE (BENEFIT) AND EQUITY IN UNDISTRIBUTED INCOME OF SUBSIDIARIES 5,658 107 11,220 (5,437) 11,548
Income tax expense (benefit) 145 (2) 3,734 — 3,877Equity in undistributed income of subsidiaries 2,158 — — (2,158) —
NET INCOME $7,671 $ 109 $ 7,486 $(7,595) $ 7,671
Following are the condensed consolidating financial statements of the Parent and Wells Fargo Financial, Inc. and its wholly-owned subsidiaries (WFFI). The Wells FargoFinancial business segment for management reporting
(see Note 19) consists of WFFI and other affiliated consumerfinance entities managed by WFFI that are included withinother consolidating subsidiaries in the following tables.

100
Condensed Consolidating Statements of Income
(in millions) Parent WFFI Other Eliminations Consolidatedconsolidating Company
subsidiariesYear ended December 31, 2004
Dividends from subsidiaries:Bank $3,652 $ — $ — $(3,652) $ —Nonbank 307 — — (307) —
Interest income from loans — 3,548 13,233 — 16,781Interest income from subsidiaries 1,117 — — (1,117) —Other interest income 91 84 4,011 — 4,186
Total interest income 5,167 3,632 17,244 (5,076) 20,967
Deposits — — 1,827 — 1,827Short-term borrowings 106 47 458 (258) 353Long-term debt 872 1,089 387 (711) 1,637
Total interest expense 978 1,136 2,672 (969) 3,817
NET INTEREST INCOME 4,189 2,496 14,572 (4,107) 17,150Provision for credit losses — 833 884 — 1,717Net interest income after provision for credit losses 4,189 1,663 13,688 (4,107) 15,433
NONINTEREST INCOMEFee income – nonaffiliates — 223 7,319 — 7,542Other 139 256 5,053 (81) 5,367
Total noninterest income 139 479 12,372 (81) 12,909
NONINTEREST EXPENSESalaries and benefits 64 944 7,916 — 8,924Other 313 746 7,820 (230) 8,649
Total noninterest expense 377 1,690 15,736 (230) 17,573
INCOME BEFORE INCOME TAX EXPENSE (BENEFIT) AND EQUITY IN UNDISTRIBUTED INCOME OF SUBSIDIARIES 3,951 452 10,324 (3,958) 10,769
Income tax expense (benefit) (97) 159 3,693 — 3,755Equity in undistributed income of subsidiaries 2,966 — — (2,966) —
NET INCOME $7,014 $ 293 $ 6,631 $(6,924) $ 7,014
Year ended December 31, 2003
Dividends from subsidiaries:Bank $5,194 $ — $ — $(5,194) $ — Nonbank 841 — — (841) —
Interest income from loans 2 2,799 11,136 — 13,937Interest income from subsidiaries 567 — — (567) —Other interest income 75 77 5,329 — 5,481
Total interest income 6,679 2,876 16,465 (6,602) 19,418
Short-term borrowings 81 73 413 (245) 322Long-term debt 560 730 321 (256) 1,355Other interest expense — — 1,734 — 1,734
Total interest expense 641 803 2,468 (501) 3,411
NET INTEREST INCOME 6,038 2,073 13,997 (6,101) 16,007Provision for credit losses — 814 908 — 1,722Net interest income after provision for credit losses 6,038 1,259 13,089 (6,101) 14,285
NONINTEREST INCOMEFee income – nonaffiliates — 209 6,664 — 6,873Other 167 239 5,195 (92) 5,509
Total noninterest income 167 448 11,859 (92) 12,382
NONINTEREST EXPENSESalaries and benefits 134 745 7,567 — 8,446Other 18 583 8,301 (158) 8,744
Total noninterest expense 152 1,328 15,868 (158) 17,190
INCOME BEFORE INCOME TAX EXPENSE (BENEFIT) AND EQUITY IN UNDISTRIBUTED INCOME OF SUBSIDIARIES 6,053 379 9,080 (6,035) 9,477
Income tax expense (benefit) (48) 143 3,180 — 3,275Equity in undistributed income of subsidiaries 101 — — (101) —
NET INCOME $6,202 $ 236 $ 5,900 $(6,136) $ 6,202

101
Condensed Consolidating Balance Sheets
(in millions) Parent WFFI Other Eliminations Consolidatedconsolidating Company
subsidiaries
December 31, 2005
ASSETSCash and cash equivalents due from:
Subsidiary banks $ 10,720 $ 255 $ 25 $ (11,000) $ —Nonaffiliates 74 219 20,410 — 20,703
Securities available for sale 888 1,763 39,189 (6) 41,834Mortgages and loans held for sale — 32 41,114 — 41,146
Loans 1 44,598 267,121 (883) 310,837Loans to subsidiaries:
Bank 3,100 — — (3,100) —Nonbank 44,935 1,003 — (45,938) —
Allowance for loan losses — (1,280) (2,591) — (3,871)Net loans 48,036 44,321 264,530 (49,921) 306,966
Investments in subsidiaries:Bank 37,298 — — (37,298) —Nonbank 4,258 — — (4,258) —
Other assets 6,272 1,247 65,336 (1,763) 71,092
Total assets $107,546 $47,837 $430,604 $(104,246) $481,741
LIABILITIES AND STOCKHOLDERS’ EQUITYDeposits $ — $ — $325,450 $ (11,000) $314,450Short-term borrowings 81 9,005 28,746 (13,940) 23,892Accrued expenses and other liabilities 3,480 1,241 20,856 (2,506) 23,071Long-term debt 59,341 35,087 16,613 (31,373) 79,668Indebtedness to subsidiaries 3,984 — — (3,984) —
Total liabilities 66,886 45,333 391,665 (62,803) 441,081Stockholders’ equity 40,660 2,504 38,939 (41,443) 40,660
Total liabilities and stockholders’ equity $107,546 $47,837 $430,604 $(104,246) $481,741
December 31, 2004
ASSETSCash and cash equivalents due from:
Subsidiary banks $ 9,493 $ 171 $ — $ (9,664) $ —Nonaffiliates 226 311 17,386 — 17,923
Securities available for sale 1,419 1,841 30,463 (6) 33,717Mortgages and loans held for sale — 23 38,439 — 38,462
Loans 1 33,624 253,961 — 287,586Loans to subsidiaries:
Bank 700 — — (700) —Nonbank 36,368 856 — (37,224) —
Allowance for loan losses — (952) (2,810) — (3,762)Net loans 37,069 33,528 251,151 (37,924) 283,824
Investments in subsidiaries:Bank 35,357 — — (35,357) —Nonbank 4,413 — — (4,413) —
Other assets 4,720 807 48,997 (601) 53,923
Total assets $ 92,697 $36,681 $386,436 $ (87,965) $427,849
LIABILITIES AND STOCKHOLDERS’ EQUITYDeposits $ — $ — $284,522 $ (9,664) $274,858Short-term borrowings 65 5,662 27,985 (11,750) 21,962Accrued expenses and other liabilities 2,535 1,103 17,342 (1,397) 19,583Long-term debt 50,146 27,508 19,354 (23,428) 73,580Indebtedness to subsidiaries 2,085 — — (2,085) —
Total liabilities 54,831 34,273 349,203 (48,324) 389,983Stockholders’ equity 37,866 2,408 37,233 (39,641) 37,866
Total liabilities and stockholders’ equity $ 92,697 $36,681 $386,436 $ (87,965) $427,849

102
Condensed Consolidating Statement of Cash Flows
(in millions) Parent WFFI Other Consolidatedconsolidating Company
subsidiaries/eliminations
Year ended December 31, 2005
Cash flows from operating activities:Net cash provided (used) by operating activities $ 5,396 $ 1,159 $(15,888) $ (9,333)
Cash flows from investing activities:Securities available for sale:
Sales proceeds 631 281 18,147 19,059Prepayments and maturities 90 248 6,634 6,972Purchases (231) (486) (27,917) (28,634)
Net cash acquired from acquisitions — — 66 66Increase in banking subsidiaries’ loan
originations, net of collections — (953) (41,356) (42,309)Proceeds from sales (including participations) of loans by
banking subsidiaries — 232 42,007 42,239Purchases (including participations) of loans by
banking subsidiaries — — (8,853) (8,853)Principal collected on nonbank entities’ loans — 19,542 3,280 22,822Loans originated by nonbank entities — (29,757) (3,918) (33,675)Net advances to nonbank entities (3,166) — 3,166 —Capital notes and term loans made to subsidiaries (10,751) — 10,751 —Principal collected on notes/loans made to subsidiaries 2,950 — (2,950) —Net decrease (increase) in investment in subsidiaries 194 — (194) —Other, net — (1,059) (6,697) (7,756)
Net cash used by investing activities (10,283) (11,952) (7,834) (30,069)
Cash flows from financing activities:Net increase in deposits — — 38,961 38,961Net increase (decrease) in short-term borrowings 1,048 3,344 (2,514) 1,878Proceeds from issuance of long-term debt 18,297 11,891 (3,715) 26,473Long-term debt repayment (8,216) (4,450) (5,910) (18,576)Proceeds from issuance of common stock 1,367 — — 1,367Common stock repurchased (3,159) — — (3,159)Cash dividends paid on common stock (3,375) — — (3,375)Other, net — — (1,673) (1,673)
Net cash provided by financing activities 5,962 10,785 25,149 41,896
Net change in cash and due from banks 1,075 (8) 1,427 2,494
Cash and due from banks at beginning of year 9,719 482 2,702 12,903
Cash and due from banks at end of year $ 10,794 $ 474 $ 4,129 $ 15,397
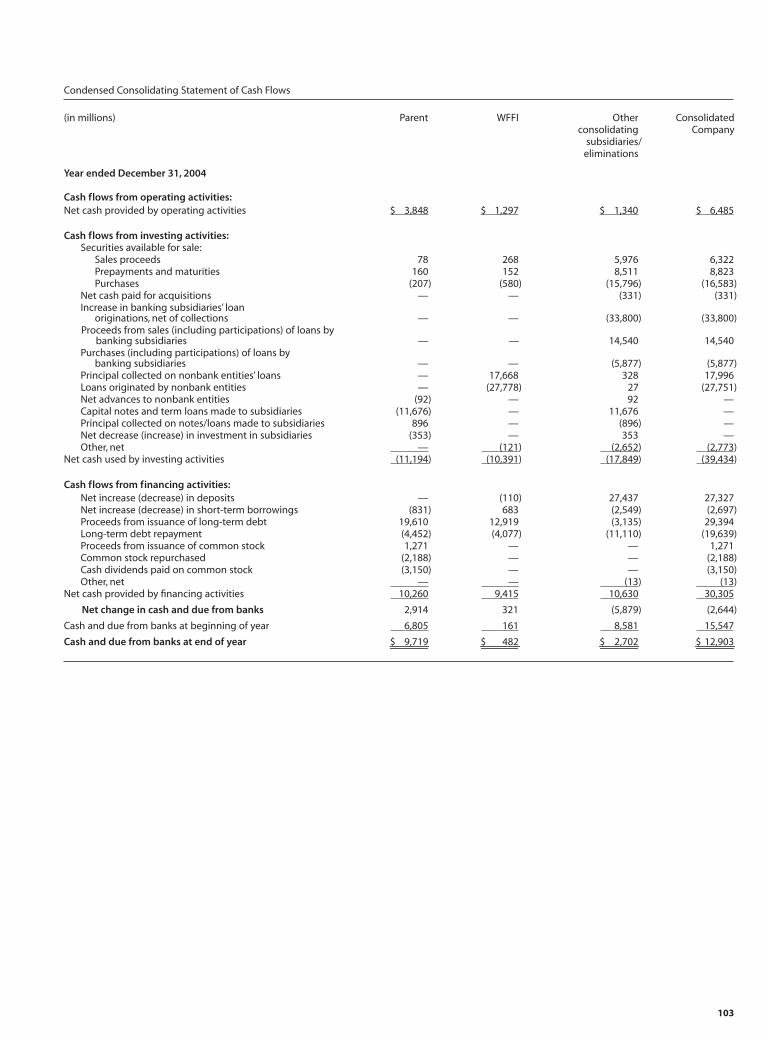
103
Condensed Consolidating Statement of Cash Flows
(in millions) Parent WFFI Other Consolidatedconsolidating Company
subsidiaries/eliminations
Year ended December 31, 2004
Cash flows from operating activities:Net cash provided by operating activities $ 3,848 $ 1,297 $ 1,340 $ 6,485
Cash flows from investing activities:Securities available for sale:
Sales proceeds 78 268 5,976 6,322Prepayments and maturities 160 152 8,511 8,823Purchases (207) (580) (15,796) (16,583)
Net cash paid for acquisitions — — (331) (331)Increase in banking subsidiaries’ loan
originations, net of collections — — (33,800) (33,800)Proceeds from sales (including participations) of loans by
banking subsidiaries — — 14,540 14,540Purchases (including participations) of loans by
banking subsidiaries — — (5,877) (5,877)Principal collected on nonbank entities’ loans — 17,668 328 17,996Loans originated by nonbank entities — (27,778) 27 (27,751)Net advances to nonbank entities (92) — 92 —Capital notes and term loans made to subsidiaries (11,676) — 11,676 —Principal collected on notes/loans made to subsidiaries 896 — (896) —Net decrease (increase) in investment in subsidiaries (353) — 353 —Other, net — (121) (2,652) (2,773)
Net cash used by investing activities (11,194) (10,391) (17,849) (39,434)
Cash flows from financing activities:Net increase (decrease) in deposits — (110) 27,437 27,327Net increase (decrease) in short-term borrowings (831) 683 (2,549) (2,697)Proceeds from issuance of long-term debt 19,610 12,919 (3,135) 29,394Long-term debt repayment (4,452) (4,077) (11,110) (19,639)Proceeds from issuance of common stock 1,271 — — 1,271Common stock repurchased (2,188) — — (2,188)Cash dividends paid on common stock (3,150) — — (3,150)Other, net — — (13) (13)
Net cash provided by financing activities 10,260 9,415 10,630 30,305
Net change in cash and due from banks 2,914 321 (5,879) (2,644)
Cash and due from banks at beginning of year 6,805 161 8,581 15,547
Cash and due from banks at end of year $ 9,719 $ 482 $ 2,702 $ 12,903

104
Note 23: Legal Actions
In the normal course of business, we are subject to pendingand threatened legal actions, some for which the relief ordamages sought are substantial. After reviewing pending and threatened actions with counsel, and any specificreserves established for such matters, management believesthat the outcome of such actions will not have a material
adverse effect on the results of operations or stockholders’equity. We are not able to predict whether the outcome ofsuch actions may or may not have a material adverse effect on results of operations in a particular future period as thetiming and amount of any resolution of such actions and itsrelationship to the future results of operations are not known.
Condensed Consolidating Statement of Cash Flows
(in millions) Parent WFFI Other Consolidatedconsolidating Company
subsidiaries/eliminations
Year ended December 31, 2003
Cash flows from operating activities:Net cash provided by operating activities $ 6,352 $ 1,271 $ 23,572 $ 31,195
Cash flows from investing activities:Securities available for sale:
Sales proceeds 146 347 6,864 7,357Prepayments and maturities 150 223 12,779 13,152Purchases (655) (732) (23,744) (25,131)
Net cash paid for acquisitions (55) (600) (167) (822)Increase in banking subsidiaries’ loan
originations, net of collections — — (36,235) (36,235)Proceeds from sales (including participations) of loans by
banking subsidiaries — — 1,590 1,590Purchases (including participations) of loans by
banking subsidiaries — — (15,087) (15,087)Principal collected on nonbank entities’ loans 3,683 13,335 620 17,638Loans originated by nonbank entities — (21,035) (757) (21,792)Purchases of loans by nonbank entities (3,682) — — (3,682)Net advances to nonbank entities (2,570) — 2,570 —Capital notes and term loans made to subsidiaries (14,614) — 14,614 —Principal collected on notes/loans made to subsidiaries 6,160 — (6,160) —Net decrease (increase) in investment in subsidiaries 122 — (122) —Other, net — 107 (74) 33
Net cash used by investing activities (11,315) (8,355) (43,309) (62,979)
Cash flows from financing activities:Net increase in deposits — 22 28,621 28,643Net decrease in short-term borrowings (1,182) (676) (7,043) (8,901)Proceeds from issuance of long-term debt 15,656 10,355 3,479 29,490Long-term debt repayment (3,425) (2,151) (12,355) (17,931)Proceeds from issuance of guaranteed preferred beneficial
interests in Company’s subordinated debentures 700 — — 700Proceeds from issuance of common stock 944 — — 944Preferred stock redeemed (73) — — (73)Common stock repurchased (1,482) — — (1,482)Cash dividends paid on preferred and common stock (2,530) (600) 600 (2,530)Other, net — — 651 651
Net cash provided by financing activities 8,608 6,950 13,953 29,511
Net change in cash and due from banks 3,645 (134) (5,784) (2,273)
Cash and due from banks at beginning of year 3,160 295 14,365 17,820
Cash and due from banks at end of year $ 6,805 $ 161 $ 8,581 $ 15,547

105
Note 24: Guarantees
We provide significant guarantees to third parties includingstandby letters of credit, various indemnification agreements,guarantees accounted for as derivatives, contingent consider-ation related to business combinations and contingent performance guarantees.
We issue standby letters of credit, which include performanceand financial guarantees, for customers in connection withcontracts between the customers and third parties. Standbyletters of credit assure that the third parties will receive specified funds if customers fail to meet their contractualobligations. We are obliged to make payment if a customerdefaults. Standby letters of credit were $10.9 billion atDecember 31, 2005, and $9.4 billion at December 31, 2004,including financial guarantees of $6.4 billion and $5.3 billion,respectively, that we had issued or purchased participationsin. Standby letters of credit are net of participations sold toother institutions of $2.1 billion at December 31, 2005, and $1.7 billion at December 31, 2004. We consider thecredit risk in standby letters of credit in determining theallowance for credit losses. Deferred fees for these standbyletters of credit were not significant to our financial statements.We also had commitments for commercial and similar letters of credit of $761 million at December 31, 2005, and $731 million at December 31, 2004. At December 31,2004, we also provided a back-up liquidity facility to a commercial paper conduit that we considered to be a financialguarantee. This credit facility, which was terminated in2005, would have required us to advance, under certain conditions, up to $860 million at December 31, 2004. Thisback-up liquidity facility was included within our commercialloan commitments at December 31, 2004, and was substantiallycollateralized in the event it was drawn upon.
We enter into indemnification agreements in the ordinarycourse of business under which we agree to indemnify thirdparties against any damages, losses and expenses incurred inconnection with legal and other proceedings arising fromrelationships or transactions with us. These relationships ortransactions include those arising from service as a director or officer of the Company, underwriting agreements relating toour securities, securities lending, acquisition agreements, andvarious other business transactions or arrangements. Becausethe extent of our obligations under these agreements dependsentirely upon the occurrence of future events, our potentialfuture liability under these agreements is not determinable.
We write options, floors and caps. Options are exercisablebased on favorable market conditions. Periodic settlementsoccur on floors and caps based on market conditions. Thefair value of the written options liability in our balance sheet
was $563 million at December 31, 2005, and $374 millionat December 31, 2004. The aggregate written floors and capsliability was $169 million and $227 million, respectively. Ourultimate obligation under written options, floors and caps isbased on future market conditions and is only quantifiableat settlement. The notional value related to written optionswas $45.5 billion at December 31, 2005, and $29.7 billionat December 31, 2004, and the aggregate notional valuerelated to written floors and caps was $24.3 billion and$34.7 billion, respectively. We offset substantially all options written to customers with purchased options.
We also enter into credit default swaps under which we buy loss protection from or sell loss protection to acounterparty in the event of default of a reference obligation.The carrying amount of the contracts sold was a liability of $6 million at December 31, 2005, and $2 million atDecember 31, 2004. The maximum amount we would berequired to pay under the swaps in which we sold protection,assuming all reference obligations default at a total loss,without recoveries, was $2.7 billion and $2.6 billion based on notional value at December 31, 2005 and 2004,respectively. We purchased credit default swaps of comparablenotional amounts to mitigate the exposure of the writtencredit default swaps at December 31, 2005 and 2004. Thesepurchased credit default swaps had terms (i.e., used the samereference obligation and maturity) that would offset ourexposure from the written default swap contracts in whichwe are providing protection to a counterparty.
In connection with certain brokerage, asset managementand insurance agency acquisitions we have made, the termsof the acquisition agreements provide for deferred paymentsor additional consideration based on certain performancetargets. At December 31, 2005 and 2004, the amount ofcontingent consideration we expected to pay was not significant to our financial statements.
We have entered into various contingent performanceguarantees through credit risk participation arrangementswith remaining terms ranging from one to 24 years. We will be required to make payments under these guarantees if acustomer defaults on its obligation to perform under certaincredit agreements with third parties. Because the extent ofour obligations under these guarantees depends entirely on future events, our potential future liability under theseagreements is not fully determinable. However, our exposureunder most of the agreements can be quantified and forthose agreements our exposure was contractually limited to an aggregate liability of approximately $110 million atDecember 31, 2005, and $370 million at December 31, 2004.

106
(in billions) To be wellcapitalized under
the FDICIAFor capital prompt corrective
Actual adequacy purposes action provisionsAmount Ratio Amount Ratio Amount Ratio
As of December 31, 2005:Total capital (to risk-weighted assets)
Wells Fargo & Company $44.7 11.64% >$30.7 >8.00%Wells Fargo Bank, N.A. 34.7 11.04 > 25.2 >8.00 >$31.5 >10.00%
Tier 1 capital (to risk-weighted assets)Wells Fargo & Company $31.7 8.26% >$15.4 >4.00%Wells Fargo Bank, N.A. 25.2 8.01 > 12.6 >4.00 >$18.9 > 6.00%
Tier 1 capital (to average assets)(Leverage ratio)
Wells Fargo & Company $31.7 6.99% >$18.1 >4.00%(1)
Wells Fargo Bank, N.A. 25.2 6.61 > 15.3 >4.00 (1) >$19.1 > 5.00%
(1) The leverage ratio consists of Tier 1 capital divided by quarterly average total assets, excluding goodwill and certain other items. The minimum leverage ratio guidelineis 3% for banking organizations that do not anticipate significant growth and that have well-diversified risk, excellent asset quality, high liquidity, good earnings,effective management and monitoring of market risk and, in general, are considered top-rated, strong banking organizations.
Note 25: Regulatory and Agency Capital Requirements
The Company and each of its subsidiary banks are subject tovarious regulatory capital adequacy requirements administeredby the Federal Reserve Board (FRB) and the OCC, respectively.The Federal Deposit Insurance Corporation ImprovementAct of 1991 (FDICIA) required that the federal regulatoryagencies adopt regulations defining five capital tiers for banks:well capitalized, adequately capitalized, undercapitalized, significantly undercapitalized and critically undercapitalized.Failure to meet minimum capital requirements can initiatecertain mandatory and possibly additional discretionaryactions by regulators that, if undertaken, could have a direct material effect on our financial statements.
Quantitative measures, established by the regulators toensure capital adequacy, require that the Company and eachof the subsidiary banks maintain minimum ratios (set forthin the table below) of capital to risk-weighted assets. Thereare three categories of capital under the guidelines. Tier 1capital includes common stockholders’ equity, qualifying preferred stock and trust preferred securities, less goodwilland certain other deductions (including a portion of servicingassets and the unrealized net gains and losses, after taxes, on securities available for sale). Tier 2 capital includes preferredstock not qualifying as Tier 1 capital, subordinated debt, the allowance for credit losses and net unrealized gains onmarketable equity securities, subject to limitations by theguidelines. Tier 2 capital is limited to the amount of Tier 1capital (i.e., at least half of the total capital must be in theform of Tier 1 capital). Tier 3 capital includes certain qualifyingunsecured subordinated debt.
We do not consolidate our wholly-owned trusts (the Trusts)formed solely to issue trust preferred securities. The amount
of trust preferred securities issued by the Trusts that wasincludable in Tier 1 capital in accordance with FRB risk-based capital guidelines was $4.2 billion at December 31,2005. The junior subordinated debentures held by the Trusts were included in the Company’s long-term debt. (See Note 12.)
Under the guidelines, capital is compared with the relativerisk related to the balance sheet. To derive the risk includedin the balance sheet, a risk weighting is applied to each balance sheet asset and off-balance sheet item, primarilybased on the relative credit risk of the counterparty. Forexample, claims guaranteed by the U.S. government or oneof its agencies are risk-weighted at 0% and certain real estaterelated loans risk-weighted at 50%. Off-balance sheet items,such as loan commitments and derivatives, are also applied a risk weight after calculating balance sheet equivalentamounts. A credit conversion factor is assigned to loan commitments based on the likelihood of the off-balancesheet item becoming an asset. For example, certain loancommitments are converted at 50% and then risk-weightedat 100%. Derivatives are converted to balance sheet equivalents based on notional values, replacement costs and remaining contractual terms. (See Notes 6 and 26 forfurther discussion of off-balance sheet items.) For certainrecourse obligations, direct credit substitutes, residual interests in asset securitization, and other securitized transactions that expose institutions primarily to credit risk,the capital amounts and classification under the guidelinesare subject to qualitative judgments by the regulators aboutcomponents, risk weightings and other factors.

107
Our approach to managing interest rate risk includes the use of derivatives. This helps minimize significant, unplannedfluctuations in earnings, fair values of assets and liabilities,and cash flows caused by interest rate volatility. Thisapproach involves modifying the repricing characteristics ofcertain assets and liabilities so that changes in interest ratesdo not have a significant adverse effect on the net interestmargin and cash flows. As a result of interest rate fluctuations,hedged assets and liabilities will gain or lose market value. In a fair value hedging strategy, the effect of this unrealizedgain or loss will generally be offset by income or loss on thederivatives linked to the hedged assets and liabilities. In acash flow hedging strategy, we manage the variability of cash payments due to interest rate fluctuations by the effectiveuse of derivatives linked to hedged assets and liabilities.
We use derivatives as part of our interest rate risk management, including interest rate swaps, caps and floors,futures and forward contracts, and options. We also offervarious derivatives, including interest rate, commodity, equity, credit and foreign exchange contracts, to our customersbut usually offset our exposure from such contracts by purchasing other financial contracts. The customer accom-modations and any offsetting financial contracts are treatedas free-standing derivatives. Free-standing derivatives alsoinclude derivatives we enter into for risk management thatdo not otherwise qualify for hedge accounting. To a lesserextent, we take positions based on market expectations or to benefit from price differentials between financial instruments and markets.
By using derivatives, we are exposed to credit risk ifcounterparties to financial instruments do not perform asexpected. If a counterparty fails to perform, our credit risk is equal to the fair value gain in a derivative contract. Weminimize credit risk through credit approvals, limits andmonitoring procedures. Credit risk related to derivatives isconsidered and, if material, provided for separately. As wegenerally enter into transactions only with counterpartiesthat carry high quality credit ratings, losses from counterpartynonperformance on derivatives have not been significant.Further, we obtain collateral, where appropriate, to reducerisk. To the extent the master netting arrangements meet therequirements of FASB Interpretation No. 39, Offsetting of
Amounts Related to Certain Contracts, as amended by FASB Interpretation No. 41, Offsetting of Amounts Relatedto Certain Repurchase and Reverse Repurchase Agreements,amounts are shown net in the balance sheet.
Our derivative activities are monitored by the CorporateAsset/Liability Management Committee. Our Treasury function, which includes asset/liability management, isresponsible for various hedging strategies developed through analysis of data from financial models and otherinternal and industry sources. We incorporate the resultinghedging strategies into our overall interest rate risk management and trading strategies.
Fair Value HedgesWe use derivatives, such as interest rate swaps, swaptions,Treasury futures and options, Eurodollar futures and options,and forward contracts, to manage the risk of changes in thefair value of MSRs and other retained interests. Derivativegains or losses caused by market conditions (volatility) andthe spread between spot and forward rates priced into thederivative contracts (the passage of time) are excluded fromthe evaluation of hedge effectiveness, but are reflected inearnings. Net derivative gains and losses related to our mortgage servicing activities are included in “Servicingincome, net” in Note 21.
We use derivatives, such as Treasury and LIBOR futuresand swaptions, to hedge changes in fair value due to changesin interest rates of our commercial real estate mortgages andfranchise loans held for sale. The ineffective portion of thesefair value hedges is recorded as part of mortgage bankingnoninterest income in the income statement. We also enterinto interest rate swaps, designated as fair value hedges, toconvert certain of our fixed-rate long-term debt to floating-rate debt. In addition, we enter into cross-currency swapsand cross-currency interest rate swaps to hedge our exposureto foreign currency risk and interest rate risk associated with the issuance of non-U.S. dollar denominated debt. For commercial real estate, long-term debt and foreign currency hedges, all parts of each derivative’s gain or loss are included in the assessment of hedge effectiveness.
At December 31, 2005, all designated fair value hedgescontinued to qualify as fair value hedges.
Note 26: Derivatives
Management believes that, as of December 31, 2005, theCompany and each of the covered subsidiary banks met allcapital adequacy requirements to which they are subject.
The most recent notification from the OCC categorizedeach of the covered subsidiary banks as well capitalized,under the FDICIA prompt corrective action provisionsapplicable to banks. To be categorized as well capitalized,the institution must maintain a total risk-based capital ratioas set forth in the table on the previous page and not be subject to a capital directive order. There are no conditionsor events since that notification that management believes
have changed the risk-based capital category of any of thecovered subsidiary banks.
As an approved seller/servicer, Wells Fargo Bank, N.A.,through its mortgage banking division, is required to maintainminimum levels of shareholders’ equity, as specified by variousagencies, including the United States Department of Housingand Urban Development, Government National MortgageAssociation, Federal Home Loan Mortgage Corporation andFederal National Mortgage Association. At December 31,2005, Wells Fargo Bank, N.A. met these requirements.

108
Cash Flow HedgesWe hedge floating-rate senior debt against future interest rate increases by using interest rate swaps to convert floating-rate senior debt to fixed rates and by using interest rate capsand floors to limit variability of rates. We also use derivatives,such as Treasury futures, forwards and options, Eurodollarfutures, and forward contracts, to hedge forecasted sales of mortgage loans. Gains and losses on derivatives that arereclassified from cumulative other comprehensive income to current period earnings, are included in the line item in which the hedged item’s effect in earnings is recorded. All parts of gain or loss on these derivatives are included in the assessment of hedge effectiveness. As of December 31,2005, all designated cash flow hedges continued to qualify as cash flow hedges.
At December 31, 2005, we expected that $13 million ofdeferred net losses on derivatives in other comprehensiveincome will be reclassified as earnings during the next twelvemonths, compared with $8 million and $9 million of deferrednet losses at December 31, 2004 and 2003, respectively. We are hedging our exposure to the variability of future cash flows for all forecasted transactions for a maximum of one year for hedges converting floating-rate loans to fixedrates, 10 years for hedges of floating-rate senior debt and one year for hedges of forecasted sales of mortgage loans.
The following table provides derivative gains and lossesrelated to fair value and cash flow hedges resulting from the change in value of the derivatives excluded from theassessment of hedge effectiveness and the change in value of the ineffective portion of the derivatives.
(in millions) December 31,2005 2004 2003
Gains (losses) from derivatives related to MSRs and other retained interests from change in value of:
Derivatives excluded from the assessment of hedge effectiveness $ 338 $ 944 $ 908
Ineffective portion of derivatives (384) (390) 203
Net derivative gains (losses) related to MSRs and other retained interests $ (46) $ 554 $1,111
Losses from ineffective portion of change in the value of other fair value hedges (1) $ (15) $ (21) $ (22)
Gains from ineffective portion of change in the value of cash flow hedges $ 23 $ 10 $ 72
(1) Includes commercial real estate, long-term debt and foreign currency.
Free-Standing Derivatives We enter into various derivatives primarily to provide derivative products to customers. To a lesser extent, we take positions based on market expectations or to benefitfrom price differentials between financial instruments andmarkets. These derivatives are not linked to specific assetsand liabilities on the balance sheet or to forecasted transactionsin an accounting hedge relationship and, therefore, do notqualify for hedge accounting. We also enter into free-standingderivatives for risk management that do not otherwise qualifyfor hedge accounting. They are carried at fair value withchanges in fair value recorded as part of other noninterestincome in the income statement.
Interest rate lock commitments for residential mortgageloans that we intend to resell are considered free-standingderivatives. Our interest rate exposure on these derivativeloan commitments is economically hedged with Treasuryfutures, forwards and options, Eurodollar futures, and forward contracts. The commitments and free-standingderivatives are carried at fair value with changes in fair value recorded as a part of mortgage banking noninterestincome in the income statement. We record a zero fair valuefor a derivative loan commitment at inception consistentwith EITF 02-3, Issues Involved in Accounting for DerivativeContracts Held for Trading Purposes and Contracts Involved in Energy Trading and Risk Management Activities,
and Securities and Exchange Commission (SEC) StaffAccounting Bulletin No. 105, Application of AccountingPrinciples to Loan Commitments. Changes subsequent toinception are based on changes in fair value of the underlyingloan resulting from the exercise of the commitment andchanges in the probability that the loan will fund within theterms of the commitment, which is affected primarily bychanges in interest rates and passage of time. The aggregatefair value of derivative loan commitments on the consolidatedbalance sheet at December 31, 2005 and 2004, was a net liability of $54 million and $38 million, respectively; and is included in the caption “Interest rate contracts – Optionswritten” under Customer Accommodations and Trading in the following table.
In 2005, we also used derivatives, such as swaps, swaptions, Treasury futures and options, Eurodollar futuresand options, and forward contracts, to economically hedgethe risk of changes in the fair value of MSRs and otherretained interests, with the resulting gain or loss reflected in income. Net derivative gains of $189 million for 2005from economic hedges related to our mortgage servicingactivities are included on the income statement in “MortgageBanking – Servicing income, net.” The aggregate fair valueof these economic hedges was a net asset of $32 million at December 31, 2005, and is included on the balance sheet in “Other assets.”

109
(in millions) December 31, 2005 2004
Notional or Credit Estimated Notional or Credit Estimatedcontractual risk net fair contractual risk net fair
amount amount (1) value amount amount (1) value
ASSET/LIABILITY MANAGEMENTHEDGES
Interest rate contracts:Swaps $ 36,978 $ 409 $ 26 $ 27,145 $ 626 $ 524Futures 25,485 — — 10,314 — —Floors and caps purchased 5,250 87 87 1,400 25 25Floors and caps written 5,250 — (13) — — —Options purchased 26,508 103 103 51,670 49 49Options written 405 1 (3) — — —Forwards 106,146 126 18 103,948 137 113
Equity contracts:Options purchased 3 1 1 25 1 1Options written 75 — (3) 99 — (18) Forwards 15 2 2 19 1 —
Foreign exchange contracts:Swaps 4,217 142 93 — — —Forwards 1,000 11 — — — —
CUSTOMER ACCOMMODATIONSAND TRADING
Interest rate contracts:Swaps 92,462 1,175 133 74,659 1,631 28Futures 251,534 — — 152,943 — —Floors and caps purchased 7,169 33 33 32,715 170 170Floors and caps written 12,653 — (27) 34,119 1 (189)Options purchased 10,160 129 129 699 4 4Options written 41,124 41 (160) 26,418 45 (45)Forwards 56,644 17 (61) 46,167 13 (19)
Commodity contracts:Swaps 20,633 599 (1) 4,427 141 (27)Futures 555 — — 230 — —Floors and caps purchased 5,464 195 195 391 39 39Floors and caps written 6,356 — (130) 609 — (37)Options purchased 12 7 7 35 17 17Options written 52 — (33) 42 — (6)
Equity contracts:Swaps 55 5 (2) 4 — —Futures 480 — — 730 — —Options purchased 1,810 253 253 1,011 189 189Options written 1,601 — (263) 935 — (181)
Foreign exchange contracts:Swaps 1,078 35 1 673 53 52Futures 53 — — 24 — —Options purchased 2,280 60 60 2,211 79 79Options written 2,219 — (59) 2,187 — (79)Forwards and spots 21,516 220 22 25,788 489 19
Credit contracts:Swaps 5,454 23 (33) 5,443 36 (22)
The total notional or contractual amounts, credit risk amount and estimated net fair value for derivatives were:
(1) Credit risk amounts reflect the replacement cost for those contracts in a gain position in the event of nonperformance by all counterparties.

110
Note 27: Fair Value of Financial Instruments
LOANS HELD FOR SALE
The fair value of loans held for sale is based on what secondary markets are currently offering for portfolios with similar characteristics.
LOANS
The fair valuation calculation differentiates loans based ontheir financial characteristics, such as product classification,loan category, pricing features and remaining maturity.Prepayment estimates are evaluated by product and loan rate.
The fair value of commercial loans, other real estatemortgage loans and real estate construction loans is calculatedby discounting contractual cash flows using discount ratesthat reflect our current pricing for loans with similar characteristics and remaining maturity.
For real estate 1-4 family first and junior lien mortgages,fair value is calculated by discounting contractual cash flows,adjusted for prepayment estimates, using discount ratesbased on current industry pricing for loans of similar size,type, remaining maturity and repricing characteristics.
For consumer finance and credit card loans, the portfolio’syield is equal to our current pricing and, therefore, the fairvalue is equal to book value.
For other consumer loans, the fair value is calculated bydiscounting the contractual cash flows, adjusted for prepaymentestimates, based on the current rates we offer for loans withsimilar characteristics.
Loan commitments, standby letters of credit and commercialand similar letters of credit not included in the following table had contractual values of $191.4 billion, $10.9 billion and $761 million, respectively, at December 31, 2005, and$164.0 billion, $9.4 billion and $731 million, respectively, at December 31, 2004. These instruments generate ongoing fees at our current pricing levels. Of the commitments atDecember 31, 2005, 40% mature within one year. Deferredfees on commitments and standby letters of credit totaled $47 million and $46 million at December 31, 2005 and 2004,respectively. Carrying cost estimates fair value for these fees.
NONMARKETABLE EQUITY INVESTMENTS
There are generally restrictions on the sale and/or liquidationof our nonmarketable equity investments, including federalbank stock. Federal bank stock carrying value approximatesfair value. We use all facts and circumstances available toestimate the fair value of our cost method investments. We typically consider our access to and need for capital(including recent or projected financing activity), qualitativeassessments of the viability of the investee, and prospects for its future.
FAS 107, Disclosures about Fair Value of FinancialInstruments, requires that we disclose estimated fair valuesfor our financial instruments. This disclosure should be readwith the financial statements and Notes to Financial Statementsin this Annual Report. The carrying amounts in the followingtable are recorded in the Consolidated Balance Sheet underthe indicated captions.
We base fair values on estimates or calculations using present value techniques when quoted market prices are notavailable. Because broadly-traded markets do not exist formost of our financial instruments, we try to incorporate the effect of current market conditions in the fair value calculations. These valuations are our estimates, and areoften calculated based on current pricing policy, the economicand competitive environment, the characteristics of the financial instruments and other such factors. These calculationsare subjective, involve uncertainties and significant judgmentand do not include tax ramifications. Therefore, the resultscannot be determined with precision, substantiated by comparison to independent markets and may not be realizedin an actual sale or immediate settlement of the instruments.There may be inherent weaknesses in any calculation technique,and changes in the underlying assumptions used, includingdiscount rates and estimates of future cash flows, that couldsignificantly affect the results.
We have not included certain material items in our disclosure, such as the value of the long-term relationshipswith our deposit, credit card and trust customers, since theseintangibles are not financial instruments. For all of these reasons, the total of the fair value calculations presented do not represent, and should not be construed to represent, the underlying value of the Company.
Financial AssetsSHORT-TERM FINANCIAL ASSETS
Short-term financial assets include cash and due from banks,federal funds sold and securities purchased under resaleagreements and due from customers on acceptances. Thecarrying amount is a reasonable estimate of fair valuebecause of the relatively short time between the originationof the instrument and its expected realization.
TRADING ASSETS
Trading assets are carried at fair value.
SECURITIES AVAILABLE FOR SALE
Securities available for sale are carried at fair value. For further information, see Note 5.
MORTGAGES HELD FOR SALE
The fair value of mortgages held for sale is based on quotedmarket prices or on what secondary markets are currentlyoffering for portfolios with similar characteristics.

111
(in millions) December 31, 2005 2004
Carrying Estimated Carrying Estimatedamount fair value amount fair value
FINANCIAL ASSETSMortgages held for sale $ 40,534 $ 40,666 $ 29,723 $ 29,888Loans held for sale 612 629 8,739 8,972Loans, net 306,966 307,721 283,824 285,488Nonmarketable equity investments 5,090 5,533 5,229 5,494
FINANCIAL LIABILITIESDeposits 314,450 314,301 274,858 274,900Long-term debt (1) 79,654 78,868 73,560 74,085
(1) The carrying amount and fair value exclude obligations under capital leases of $14 million and $20 million at December 31, 2005 and 2004, respectively.
Financial LiabilitiesDEPOSIT LIABILITIES
FAS 107 states that the fair value of deposits with no statedmaturity, such as noninterest-bearing demand deposits, interest-bearing checking and market rate and other savings,is equal to the amount payable on demand at the measurementdate. The amount included for these deposits in the followingtable is their carrying value at December 31, 2005 and 2004.The fair value of other time deposits is calculated based onthe discounted value of contractual cash flows. The discountrate is estimated using the rates currently offered for likewholesale deposits with similar remaining maturities.
SHORT-TERM FINANCIAL LIABILITIES
Short-term financial liabilities include federal funds pur-chased and securities sold under repurchase agreements,commercial paper and other short-term borrowings. The carrying amount is a reasonable estimate of fair value because of the relatively short time between the origination of the instrument and its expected realization.
LONG-TERM DEBT
The discounted cash flow method is used to estimate the fair value of our fixed-rate long-term debt. Contractual cash flows are discounted using rates currently offered for new notes with similar remaining maturities.
Derivatives The fair values of derivatives are reported in Note 26.
LimitationsWe make these fair value disclosures to comply with therequirements of FAS 107. The calculations represent man-agement’s best estimates; however, due to the lack of broadmarkets and the significant items excluded from this disclosure,the calculations do not represent the underlying value of theCompany. The information presented is based on fair valuecalculations and market quotes as of December 31, 2005and 2004. These amounts have not been updated since yearend; therefore, the valuations may have changed significantlysince that point in time.
As discussed above, some of our asset and liability financialinstruments are short-term, and therefore, the carrying amountsin the Consolidated Balance Sheet approximate fair value.Other significant assets and liabilities, which are not consid-ered financial assets or liabilities and for which fair valueshave not been estimated, include mortgage servicing rights,premises and equipment, goodwill and other intangibles,deferred taxes and other liabilities.
This table is a summary of financial instruments, asdefined by FAS 107, excluding short-term financial assetsand liabilities, for which carrying amounts approximate fair value, and trading assets, securities available for sale and derivatives, which are carried at fair value.

112
The Board of Directors and Stockholders Wells Fargo & Company:
We have audited the accompanying consolidated balance sheet of Wells Fargo & Company and Subsidiaries (“the Company”) as of December 31, 2005 and 2004, and the related consolidated statements of income, changes in stockholders’ equity and comprehensive income, and cash flows for each of the years in the three-year period ended December 31, 2005. These consolidated financial statements are the responsibility of the Company’s management. Our responsibility is to express an opinion on these consolidated financial statements based on our audits.
We conducted our audits in accordance with the standards of the Public Company Accounting Oversight Board (United States). Those standards require that we plan and perform the audit to obtain reasonable assurance about whether the financial statements are free of material misstatement. An audit includes examining, on a test basis, evidence supporting the amounts and disclosures in the financial statements. An audit also includes assessing the accounting principles used and significant estimates made by management, as well as evaluating the overall financial statement presentation. We believe that our audits provide a reasonable basis for our opinion.
In our opinion, the consolidated financial statements referred to above present fairly, in all material respects, the financial position of the Company as of December 31, 2005 and 2004, and the results of their operations and their cash flows for each of the years in the three-year period ended December 31, 2005, in conformity with U.S. generally accepted accounting principles.
We also have audited, in accordance with the standards of the Public Company Accounting Oversight Board (United States), the effectiveness of the Company’s internal control over financial reporting as of December 31, 2005, based on criteria established in Internal Control – Integrated Framework issued by the Committee of Sponsoring Organizations of the Treadway Commission (COSO), and our report dated February 21, 2006, expressed an unqualified opinion on management’s assessment of, and the effective operation of, internal control over financial reporting.
San Francisco, CaliforniaFebruary 21, 2006
Report of Independent Registered Public Accounting Firm

113
Quarterly Financial DataCondensed Consolidated Statement of Income — Quarterly (Unaudited)
(in millions, except per share amounts) 2005 2004 Quarter ended Quarter ended
Dec. 31 Sept. 30 June 30 Mar. 31 Dec. 31 Sept. 30 June 30 Mar. 31
INTEREST INCOME $ 7,244 $ 6,645 $ 6,200 $ 5,873 $ 5,635 $ 5,405 $ 5,069 $ 4,858INTEREST EXPENSE 2,405 1,969 1,664 1,420 1,179 987 843 808
NET INTEREST INCOME 4,839 4,676 4,536 4,453 4,456 4,418 4,226 4,050
Provision for credit losses 703 641 454 585 465 408 440 404Net interest income after provision for credit losses 4,136 4,035 4,082 3,868 3,991 4,010 3,786 3,646
NONINTEREST INCOMEService charges on deposit accounts 655 654 625 578 594 618 611 594Trust and investment fees 623 614 597 602 543 508 530 535Card fees 394 377 361 326 321 319 308 282Other fees 478 520 478 453 479 452 437 411Mortgage banking 628 743 237 814 790 262 493 315Operating leases 200 202 202 208 211 207 209 209Insurance 272 248 358 337 265 264 347 317Net gains (losses) on debt securities available for sale (124) (31) 39 (4) 3 10 (61) 33Net gains from equity investments 93 146 201 71 170 48 81 95Other 434 354 231 251 336 212 245 306
Total noninterest income 3,653 3,827 3,329 3,636 3,712 2,900 3,200 3,097
NONINTEREST EXPENSESalaries 1,613 1,571 1,551 1,480 1,438 1,383 1,295 1,277Incentive compensation 663 676 562 465 526 449 441 391Employee benefits 428 467 432 547 451 390 391 492Equipment 328 306 263 370 410 254 271 301Net occupancy 344 354 310 404 301 309 304 294Operating leases 161 159 157 158 164 158 156 155Other 1,346 1,356 1,279 1,268 1,681 1,277 1,495 1,119
Total noninterest expense 4,883 4,889 4,554 4,692 4,971 4,220 4,353 4,029
INCOME BEFORE INCOME TAX EXPENSE 2,906 2,973 2,857 2,812 2,732 2,690 2,633 2,714Income tax expense 976 998 947 956 947 942 919 947
NET INCOME $ 1,930 $ 1,975 $ 1,910 $ 1,856 $ 1,785 $ 1,748 $ 1,714 $ 1,767
EARNINGS PER COMMON SHARE $ 1.15 $ 1.17 $ 1.14 $ 1.09 $ 1.06 $ 1.03 $ 1.02 $ 1.04
DILUTED EARNINGS PER COMMON SHARE $ 1.14 $ 1.16 $ 1.12 $ 1.08 $ 1.04 $ 1.02 $ 1.00 $ 1.03
DIVIDENDS DECLARED PER COMMON SHARE $ .52 $ .52 $ .48 $ .48 $ .48 $ .48 $ .45 $ .45
Average common shares outstanding 1,675.4 1,686.8 1,687.7 1,695.4 1,692.7 1,688.9 1,688.1 1,699.3
Diluted average common shares outstanding 1,693.9 1,705.3 1,707.2 1,715.7 1,715.0 1,708.7 1,708.3 1,721.2
Market price per common share (1)
High $ 64.70 $ 62.87 $ 62.22 $ 62.75 $ 64.04 $ 59.86 $ 59.72 $ 58.98Low 57.62 58.00 57.77 58.15 57.55 56.12 54.32 55.97Quarter end 62.83 58.57 61.58 59.80 62.15 59.63 57.23 56.67
(1) Based on daily prices reported on the New York Stock Exchange Composite Transaction Reporting System.

114
Average Balances, Yields and Rates Paid (Taxable-Equivalent Basis) — Quarterly (1)(2) (Unaudited)
(in millions) Quarter ended December 31, 2005 2004
Average Yields/ Interest Average Yields/ Interestbalance rates income/ balance rates income/
expense expenseEARNING ASSETSFederal funds sold, securities purchased
under resale agreements and other short-term investments $ 5,158 3.64% $ 47 $ 4,967 2.01% $ 26
Trading assets 5,061 3.82 48 5,040 2.73 34Debt securities available for sale (3):
Securities of U.S. Treasury and federal agencies 1,051 3.90 10 1,101 3.72 10Securities of U.S. states and political subdivisions 3,256 8.22 64 3,624 8.31 71Mortgage-backed securities:
Federal agencies 23,545 5.94 347 21,916 6.08 321Private collateralized mortgage obligations 8,060 5.71 114 3,787 5.35 49
Total mortgage-backed securities 31,605 5.88 461 25,703 5.97 370Other debt securities (4) 4,843 6.79 82 3,246 7.91 59
Total debt securities available for sale (4) 40,755 6.12 617 33,674 6.32 510Mortgages held for sale (3) 42,036 5.97 628 32,373 5.48 443Loans held for sale (3) 603 6.41 10 8,536 4.05 87Loans:
Commercial and commercial real estate:Commercial 61,297 7.35 1,135 51,896 5.93 774Other real estate mortgage 28,425 6.84 489 29,412 5.67 419Real estate construction 13,040 7.26 239 9,246 5.80 135Lease financing 5,347 5.77 77 5,109 5.84 75
Total commercial and commercial real estate 108,109 7.13 1,940 95,663 5.84 1,403Consumer:
Real estate 1-4 family first mortgage 76,233 6.75 1,291 86,389 5.70 1,233Real estate 1-4 family junior lien mortgage 58,157 7.28 1,067 50,909 5.54 709Credit card 11,326 12.81 363 9,706 11.57 281Other revolving credit and installment 46,593 9.13 1,071 34,475 8.99 779
Total consumer 192,309 7.84 3,792 181,479 6.59 3,002Foreign 5,278 13.08 174 4,025 14.00 141
Total loans (5) 305,696 7.68 5,906 281,167 6.44 4,546Other 1,415 4.49 16 1,698 4.19 17
Total earning assets $400,724 7.23 7,272 $367,455 6.16 5,663
FUNDING SOURCESDeposits:
Interest-bearing checking $ 3,797 1.79 17 $ 3,244 .68 5Market rate and other savings 132,042 1.86 619 125,350 .83 262Savings certificates 26,610 3.26 219 18,697 2.32 108Other time deposits 33,321 4.07 341 30,460 1.98 152Deposits in foreign offices 14,347 3.71 135 10,026 1.95 49
Total interest-bearing deposits 210,117 2.51 1,331 187,777 1.22 576Short-term borrowings 25,395 3.79 242 26,315 1.90 126Long-term debt 79,169 4.19 832 70,646 2.70 477
Total interest-bearing liabilities 314,681 3.04 2,405 284,738 1.65 1,179Portion of noninterest-bearing funding sources 86,043 — — 82,717 — —
Total funding sources $400,724 2.39 2,405 $367,455 1.28 1,179Net interest margin and net interest income on
a taxable-equivalent basis (6) 4.84% $4,867 4.88% $4,484
NONINTEREST-EARNING ASSETSCash and due from banks $ 13,508 $ 13,366Goodwill 10,780 10,436Other 43,469 34,002
Total noninterest-earning assets $ 67,757 $ 57,804
NONINTEREST-BEARING FUNDING SOURCESDeposits $ 90,937 $ 82,958Other liabilities 23,049 20,336Stockholders’ equity 39,814 37,227Noninterest-bearing funding sources used to
fund earning assets (86,043) (82,717)Net noninterest-bearing funding sources $ 67,757 $ 57,804
TOTAL ASSETS $468,481 $425,259
(1) Our average prime rate was 6.97% and 4.94% for the quarters ended December 31, 2005 and 2004, respectively. The average three-month London Interbank Offered Rate (LIBOR) was 4.34% and 2.30% for the same quarters, respectively.
(2) Interest rates and amounts include the effects of hedge and risk management activities associated with the respective asset and liability categories.(3) Yields are based on amortized cost balances computed on a settlement date basis.(4) Includes certain preferred securities.(5) Nonaccrual loans and related income are included in their respective loan categories.(6) Includes taxable-equivalent adjustments primarily related to tax-exempt income on certain loans and securities. The federal statutory tax rate was 35% for both quarters presented.
114

115
Collateralized debt obligations: Securitized corporate debt.
Core deposits: Deposits acquired in a bank’s natural market area,counted as a stable source of funds for lending. These deposits generally have a predictable cost and customer loyalty.
Core deposit intangibles: The present value of the difference in cost offunding provided by core deposit balances compared with alternativefunding with similar terms assigned to acquired core deposit balancesby a buyer.
Cost method of accounting: Investment in the subsidiary is carried atcost, and the parent company accounts for the subsidiary’s operationsonly to the extent that the subsidiary declares dividends. Generallyused if investment ownership is less than 20%.
Derivatives: Financial contracts whose value is derived from publiclytraded securities, interest rates, currency exchange rates or marketindices. Derivatives cover a wide assortment of financial contracts,including forward contracts, futures, options and swaps.
Diluted earnings per share: Net income divided by the average number of common shares outstanding during the year, plus the effectof common stock equivalents (for example, stock options, restrictedshare rights and convertible debentures) that are dilutive.
Earnings per share: Net income divided by the average number ofcommon shares outstanding during the year.
Effectiveness/ineffectiveness (of derivatives): Effectiveness is the gain or loss on a hedging instrument that exactly offsets the loss orgain on the hedged item. Any difference would be the effect of hedgeineffectiveness, which is recognized currently in earnings.
Equity method of accounting: Investment in the subsidiary is originally recorded at cost, and the value of the investment is increased or decreased based on the investor’s proportional share of the change in the subsidiary’s net worth. Generally used if investment ownership is 20% or more but less than 50%.
Federal Reserve Board (FRB): The Board of Governors of the FederalReserve System, charged with supervising and regulating bank holdingcompanies, including financial holding companies.
Futures and forward contracts: Contracts in which the buyer agrees topurchase and the seller agrees to deliver a specific financial instrumentat a predetermined price or yield. May be settled either in cash or bydelivery of the underlying financial instrument.
GAAP (Generally accepted accounting principles): Accounting rulesand conventions defining acceptable practices in recording transactionsand preparing financial statements. U.S. GAAP is primarily determinedby the Financial Accounting Standards Board (FASB).
Hedge: Financial technique to offset the risk of loss from price fluctuationsin the market by offsetting the risk in another transaction. The risk inone position counterbalances the risk in another transaction.
Interest rate floors and caps: Interest rate protection instrumentswhere the seller pays the buyer an interest differential, which represents the difference between a short-term rate (e.g., three-month LIBOR) and an agreed-upon rate (the strike rate) applied to a notional principal amount.
Interest rate swap contracts: Primarily an asset/liability managementstrategy to reduce interest rate risk. Interest rate swap contracts areexchanges of interest rate payments, such as fixed-rate payments forfloating-rate payments, based on notional principal amounts.
Glossary
Mortgage servicing rights: The rights to service mortgage loans forothers, which are acquired through purchases or kept after sales orsecuritizations of originated loans.
Net interest margin: The average yield on earning assets minus theaverage interest rate paid for deposits and debt.
Notional amount: A number of currency units, shares, or other unitsspecified in a derivative contract.
Office of the Comptroller of the Currency (OCC): Part of the U.S.Treasury department and the primary regulator for banks with national charters.
Options: Contracts that grant the purchaser, for a premium payment,the right, but not the obligation, to either purchase or sell the associated financial instrument at a set price during a period or at a specified date in the future.
Other-than-temporary impairment: A write-down of certain assetsrecorded when a decline in the fair market value below the carryingvalue of the asset is considered not to be temporary. Applies to goodwill, mortgage servicing rights, other intangible assets, securitiesavailable for sale and nonmarketable equity securities. (See Note 1 –Summary of Significant Accounting Policies for impairment policies for specific categories of assets.)
Qualifying special-purpose entities (QSPE): A trust or other legal vehicle that meets certain conditions, including (1) that it is distinctfrom the transferor, (2) activities are limited, and (3) the types of assets it may hold and conditions under which it may dispose of noncashassets are limited. A QSPE is not consolidated on the balance sheet.
Securitize/securitization: The process and the result of pooling financial assets together and issuing liability and equity obligationsbacked by the resulting pool of assets to convert those assets into marketable securities.
Special-purpose entities (SPE): A legal entity, sometimes a trust or alimited partnership, created solely for the purpose of holding assets.
Taxable-equivalent basis: Basis of presentation of net interest incomeand the net interest margin adjusted to consistently reflect incomefrom taxable and tax-exempt loans and securities based on a 35% marginal tax rate. The yield that a tax-free investment would provide to an investor if the tax-free yield was “grossed up” by the amount oftaxes not paid.
Underlying: A specified interest rate, security price, commodity price,foreign exchange rate, index of prices or rates or other variable. Anunderlying may be the price or rate of an asset or liability, but is not the asset or liability itself.
Value at risk: The amount or percentage of value that is at risk of beinglost from a change in prevailing interest rates.
Variable interest entity (VIE): An entity in which the equity investors (1) do not have a controlling financial interest, or (2) do not have sufficient equity at risk for the entity to finance its activities withoutsubordinated financial support from other parties.
Yield curve (shape of the yield curve, flat yield curve): A graph showing the relationship between the yields on bonds of the samecredit quality with different maturities. For example, a “normal”, or “positive”, yield curve exists when long-term bonds have higher yieldsthan short-term bonds. A “flat” yield curve exists when yields are thesame for short-term and long-term bonds. A “steep” yield curve existswhen yields on long-term bonds are significantly higher than on short-term bonds.

116
Wells Fargo & Company
Stock ListingWells Fargo & Company is listed and trades on the New York StockExchange and the Chicago Stock Exchange in the United States.Our trading symbol is WFC.
Common Stock1,677,583,032 common shares outstanding (12/31/05)
Stock Purchase and Dividend ReinvestmentYou can buy Wells Fargo stock directly from Wells Fargo, even if you’renot a Wells Fargo stockholder, through optional cash payments orautomatic monthly deductions from a bank account.You can also haveyour dividends reinvested automatically. It’s a convenient, economicalway to increase your Wells Fargo investment.
Call 1-877-840-0492 for an enrollment kit including a plan prospectus.
Form 10-KWe will send the Wells Fargo’s 2005 Annual Report on Form 10-K(including the financial statements filed with the Securities andExchange Commission) without charge to any stockholder who asks for a copy in writing. Stockholders also can ask for copies of any exhibit to the Form 10-K.We will charge a fee to cover expensesto prepare and send any exhibits. Please send requests to:Corporate Secretary, Wells Fargo & Company, Wells Fargo Center,MAC N9305-173, Sixth and Marquette, Minneapolis, MN 55479.
SEC FilingsOur annual reports on Form 10-K, quarterly reports on Form 10-Q,current reports on Form 8-K, and amendments to those reports,are available free of charge on our website (www.wellsfargo.com),as soon as reasonably practicable after they are electronically filed with or furnished to the SEC.Those reports and amendments are also available free of charge on the SEC’s website at www.sec.gov.
Independent Registered Public Accounting FirmKPMG LLPSan Francisco, CA415-963-5100
ContactsInvestor [email protected]
Stockholder CommunicationsShareholder Services and Transfer AgentWells Fargo Shareowner ServicesP.O. Box 64854Saint Paul, MN 55164-08541-877-840-0492www.wellsfargo.com/com/shareowner_services
Corporate InformationAnnual Stockholders’ Meeting 1:30 p.m.,Tuesday, April 25, 2006 The Stanford Court Hotel905 California StreetSan Francisco, CA
Proxy statement and form of proxy will be mailed to stockholdersbeginning on or about March 17, 2006.
CertificationsOur chief executive officer certified to the New York Stock Exchange(NYSE) that, as of May 23, 2005, he was not aware of any violation bythe Company of the NYSE’s corporate governance listing standards.The certifications of our chief executive officer and chief financial officerrequired under Section 302 of the Sarbanes-Oxley Act of 2002 werefiled as Exhibits 31(a) and 31(b), respectively, to our 2005 Form 10-K.
Market Fortune Rank*Cap (Revenue)
1. General Electric (GE) $372 billion 5 11. Altria Group (MO) 157 172. Exxon Mobil (XOM) 363 2 12. Procter & Gamble (PG) 140 263. Microsoft (MSFT) 287 41 13. JP Morgan Chase (JPM) 139 204. Citigroup (C) 246 8 14. Berkshire Hathaway 138 125. Wal-Mart Stores (WMT) 190 1 15. ChevronTexaco (CVX) 131 66. Bank of America (BAC) 187 18 16. IBM (IBM) 130 107. Johnson & Johnson (JNJ) 185 30 17. Cisco Systems (CSCO) 113 918. AIG (AIG) 181 9 18. Wells Fargo (WFC) 105 529. Pfizer (PFE) 181 24 19. PepsiCo (PEP) 99 61
10. Intel (INTC) 158 50 20. Coca-Cola (KO) 98 92
*4/05
FORWARD-LOOKING STATEMENTS In this report we may make forward-looking statements about our company’s financial condition, results of operations,plans, objectives and future performance and business. We make forward-looking statements when we use words such as “believe,” “expect,” “anticipate,”“estimate,” “may,” “can,” “will” or similar expressions. Forward-looking statements involve risks and uncertainties. They are based on current expectations.Several factors could cause actual results to differ significantly from expectations including • our ability to grow revenue by selling more products to our customers • the effect of an economic slowdown on the demand for our products and services • the effect of a fall in stock market prices on fee income from our brokerage and asset management businesses • the effect of changes in interest rates on our net interest margin and our mortgage originations and mortgageservicing rights • the adequacy of our loan loss allowance • changes in the value of our venture capital investments • changes in our accounting policies or inaccounting standards • mergers and acquisitions • federal and state regulations • reputational damage from negative publicity • the loss of checking and saving account deposits to other investments such as the stock market • fiscal and monetary policies of the Federal Reserve Board. For more information about factors that could cause actual results to differ from expectations, refer to the Financial Review and the Financial Statements and related Notes in thisreport and to the “Risk Factors” and “Regulation and Supervision” sections of our 2005 Annual Report on Form 10-K filed with the Securities and ExchangeCommission and available on the SEC’s website at www.sec.gov.© 2006 Wells Fargo & Company. All rights reserved.
Highest Market Caps,Year-End 2005,among Fortune 100

01 02 03 04 05
Revenue (billions)
20-year compound annual growth rate: 12%
$21.
0 25.2
28.4
30.1
32.9
02 03 04 05
Active Online Middle-Market/Large Corporate Customers(thousands)
18
01
8
22 25
28
02 03 04 05
Active Online Small Business Customers(thousands)
297
01
185
415
531
666
01 02 03 04 05
Deposits(billions)
$187
217 24
8 275 31
4
01 02 03 04 05
Mortgage Originations(billions)
$202
333
470
298 36
6
01 02 03 04 05
Mortgage ServicingPortfolio(billions)
$462
581 71
0 805
989
National Home EquityGroup Loans(billions)
01 02 03 04 05
$25
34
49
70 72
Which Measures Really Matter? 2005 Update
01 02 03 04 05
Earnings Per Share diluted**
20-year compound annual growth rate: 14%
$1.9
7
3.32
3.65
4.09
4.50
01 02 03 04 05
Return on Equity (ROE)ROE: cents earned for every dollar stockholders invest in the company
12.7
%
18.7
19.4
19.6
19.6
01 02 03 04 05
Retaining Team Members
(annual percent of team members who leave us)
** excludes Wells Fargo Financial (consumer finance)
34%
**
28
25 29
30
01 02 03 04 05
Retaining Customers
(annual percent of high-value* checking account customers who leave us)
10.4
% (e
st.)
8.9
8.0
* top 20 percent of banking customers based on balances
7.5
7.5
02 03 04 05
Assets Managed, Administered (billions) includes brokerage
$578 65
4
791 88
0
02 03 04 05
Nonperforming Assets (NPAs)/Total Loans
0.88
01
1.08
%
0.66
0.55
0.49
02 03 04 05
Products Per Banking Household
4.2
01
3.8 4.
3 4.6 4.8
02 03 04 05
Product Solutions (Sales) Per Banker* Per Day
4.3
01
4.0
4.7
* platform full-time equivalent (FTE) team member
4.8 4.9
03 04 05
Team Member Engagement Ratio of engaged to actively disengaged
Gallup survey of Wells Fargo Regional Banking team members
2.5
:1
4.1
:1
5.8
:1
1.7
:1
National average
01 02 03 04 05
Market Capitalization(billions)
$74 79
100
105
105
The higher a company’s credit rating(based on its ability to meet debt obli-gations) the less interest it has to pay to borrow money.Wells Fargo Bank:only U.S. bank rated “Aaa.”
Number of S&P companiesMoody’s with higher rating
Wells Fargo Bank, N.A.Issuer Aaa NoneLong-term deposits Aaa NoneFinancial Strength A None
Wells Fargo & CompanySubordinated Debt Aa2 OneIssuer Aa1 SixSenior Debt Aa1 Six
Financial Performance*
Retaining Customers,Team Members
Sales
Online
Earning More Business
Managing Risk
In our past two annual reports, we said to you, our owners, that wemeasure success differently than our competitors—to reflect moreaccurately how financial services companies, like ours, create value
for customers and stockholders. Here’s an update on the progresswe’re making in the areas we believe are the best long-termindicators for future success in the financial services industry.
02 03 04 05
Commercial/Corporate Products Per Banking Customer
4.9
01
4.6 5.
0 5.3 5.
702 03 04 05
Retail Banking Households with Credit Cards
23.7
01
23.2
% 26.9 31
.1 33.1
02 03 04 05
Retail Checking Households with Debit Cards
85.4
01
83.3
%
85.9
88.7
90.5
* before effect of change in accounting principles, 2001 includes venture capital impairment** includes all common stock equivalents (”in the money stock” options, warrants and rights, convertible bonds and convertible preferred stock)

Wells Fargo & Company420 Montgomery StreetSan Francisco, California 94104
1-866-878- 5865wellsfargo.com
OUR VISION:
Satisfy all our customers’ financial needs andhelp them succeed financially.
NUESTRA VISION:
Deseamos satisfacer todas las necesidadesfinancieras de nuestros clientes y ayudarlos atener éxito en el área financiera.
NOTRE VISION:
Satisfaire tous les besoins financiers de nosclients et les aider à atteindre le succès financier.
America’s “Most admired”Large Bank Fortune


