46
How do you get THIS from eating only THIS?
| Date post: | 13-Dec-2015 |
| Category: |
Documents |
| Upload: | ginger-houston |
| View: | 214 times |
| Download: | 0 times |

How do you get THIS from eating only THIS?

© 2011 Pearson Education, Inc.
CHAPTER 13Biological Productivity and Energy Transfer
© 2011 Pearson Education, Inc.
Chapter Overview
• Productivity is the same as photosynthesis, which is affected by sunlight and nutrients.
• Productivity is globally and seasonally variable.
• Feeding relationships are represented by food chains and food webs.
• Oceans are being overfished.

© 2011 Pearson Education, Inc.
Primary Productivity
• Primary productivity is the rate at which energy is stored in organic matter.
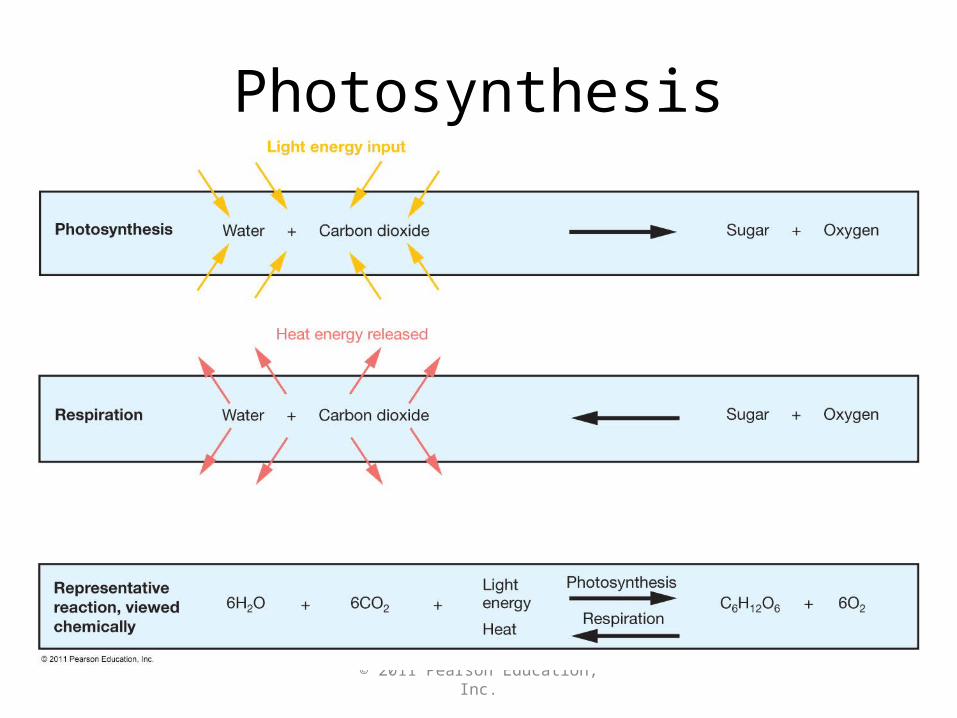
• Photosynthesis uses solar radiation.
• Chemosynthesis uses chemical reactions.
• 99.9% of the ocean’s biomass relies directly or indirectly on photosynthesis for food.
© 2011 Pearson Education, Inc.
Photosynthesis
© 2011 Pearson Education, Inc.
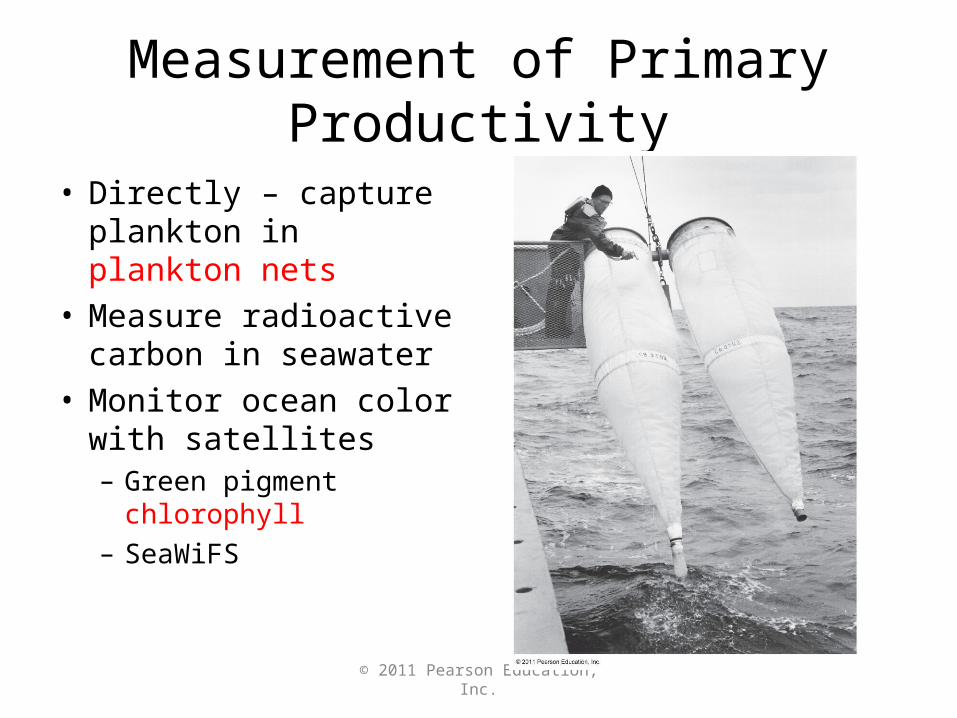
Measurement of Primary Productivity
• Directly – capture plankton in plankton nets
• Measure radioactive carbon in seawater
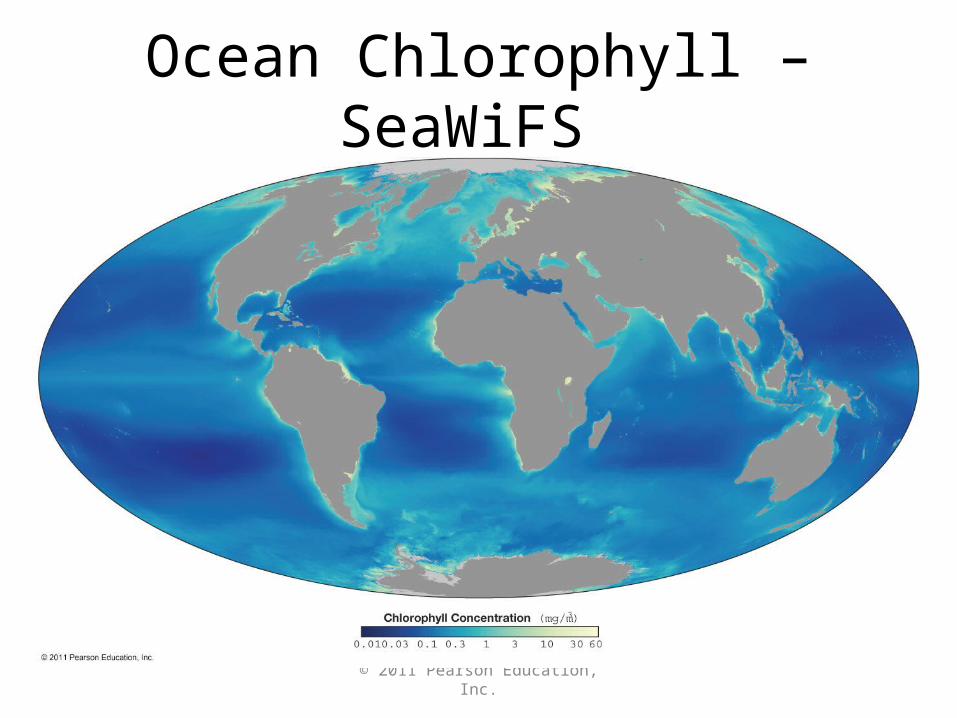
• Monitor ocean color with satellites – Green pigment
chlorophyll – SeaWiFS
© 2011 Pearson Education, Inc.
Ocean Chlorophyll – SeaWiFS
© 2011 Pearson Education, Inc.
Factors Affecting Primary Productivity
• Solar radiation – Uppermost surface seawater and shallow
seafloor– Compensation depth – net photosynthesis
becomes zero– Euphotic zone—from surface to about
100 meters (330 feet)

© 2011 Pearson Education, Inc.
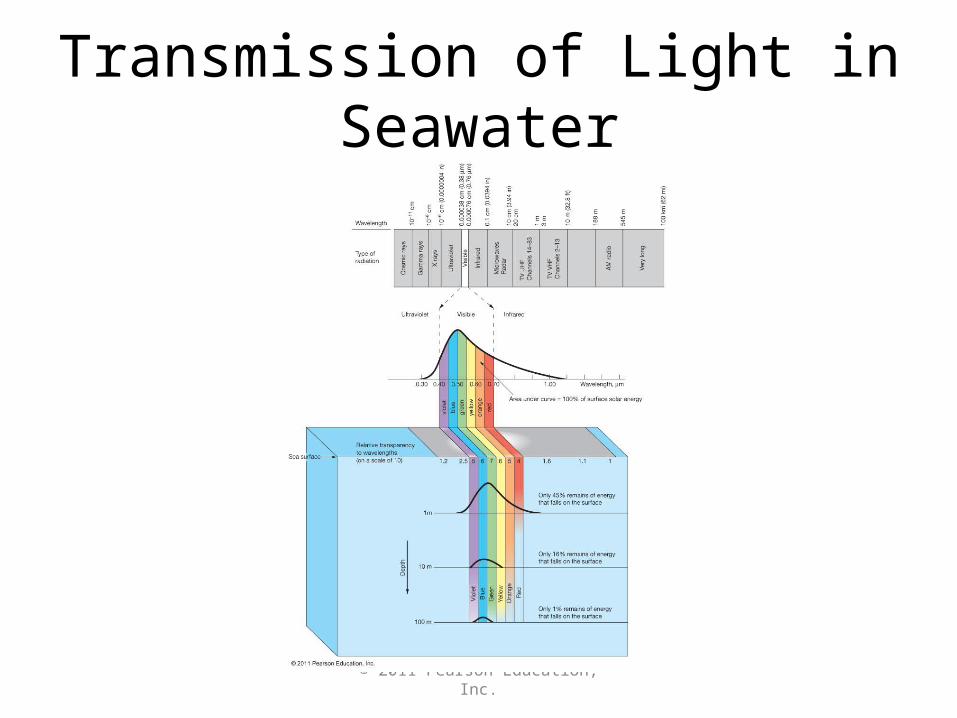
Light Transmission in Ocean Water
• Visible light of the electromagnetic spectrum
• Blue wavelengths penetrate deepest
• Longer wavelengths (red, orange) absorbed first
© 2011 Pearson Education, Inc.
Transmission of Light in Seawater
© 2011 Pearson Education, Inc.
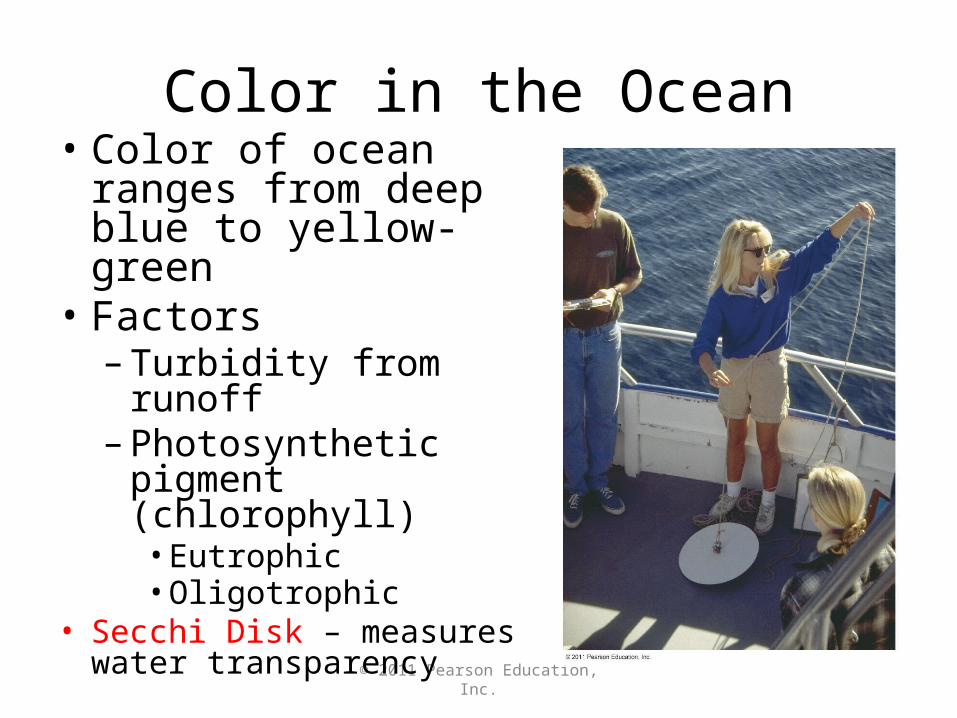
Color in the Ocean• Color of ocean
ranges from deep blue to yellow-green
• Factors– Turbidity from runoff– Photosynthetic
pigment (chlorophyll)• Eutrophic• Oligotrophic
• Secchi Disk – measures water transparency
© 2011 Pearson Education, Inc.
Types of Photosynthetic Marine Organisms
• Anthophyta
–Seed-bearing plants
• Macroscopic (large) algae
• Microscopic (small) algae
• Photosynthetic bacteria

© 2011 Pearson Education, Inc.
Macroscopic Algae
• “Seaweeds”• Brown algae• Green algae• Red algae
– Most abundant and most widespread
– Varied colors
© 2011 Pearson Education, Inc.
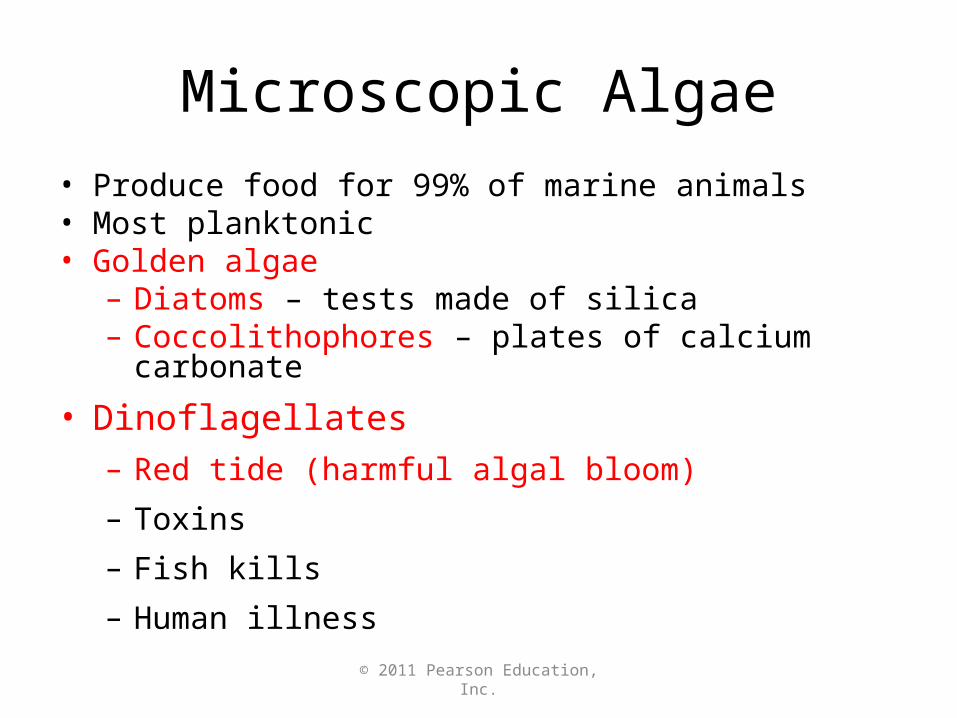
Microscopic Algae
• Produce food for 99% of marine animals• Most planktonic• Golden algae
– Diatoms – tests made of silica– Coccolithophores – plates of calcium carbonate
• Dinoflagellates
– Red tide (harmful algal bloom)
– Toxins
– Fish kills
– Human illness
© 2011 Pearson Education, Inc.
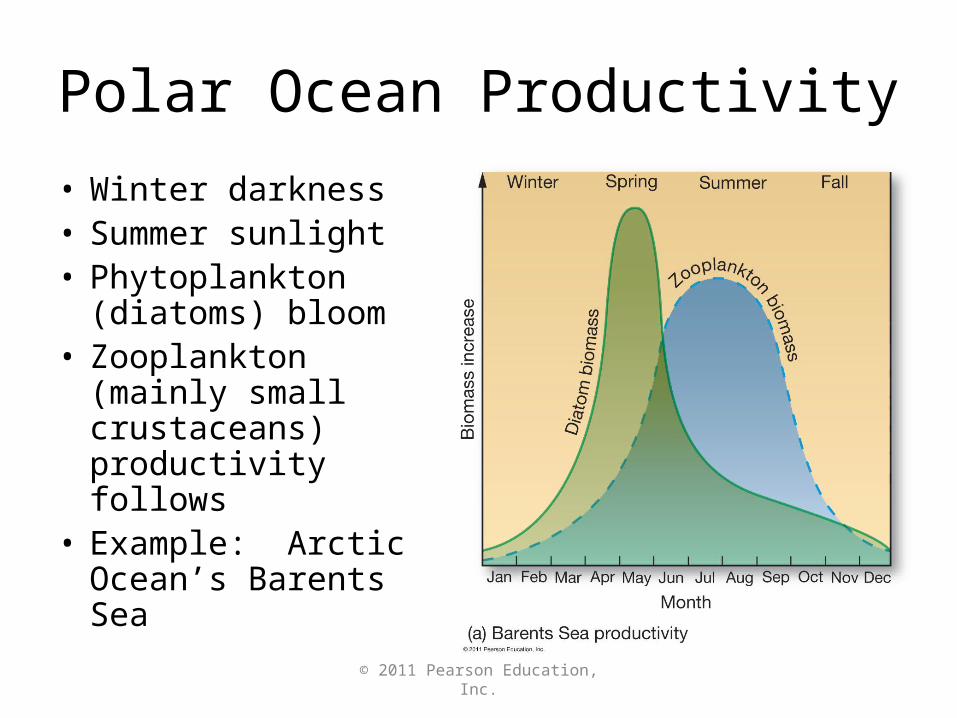
Polar Ocean Productivity
• Winter darkness• Summer sunlight• Phytoplankton
(diatoms) bloom• Zooplankton (mainly
small crustaceans) productivity follows
• Example: Arctic Ocean’s Barents Sea
© 2011 Pearson Education, Inc.
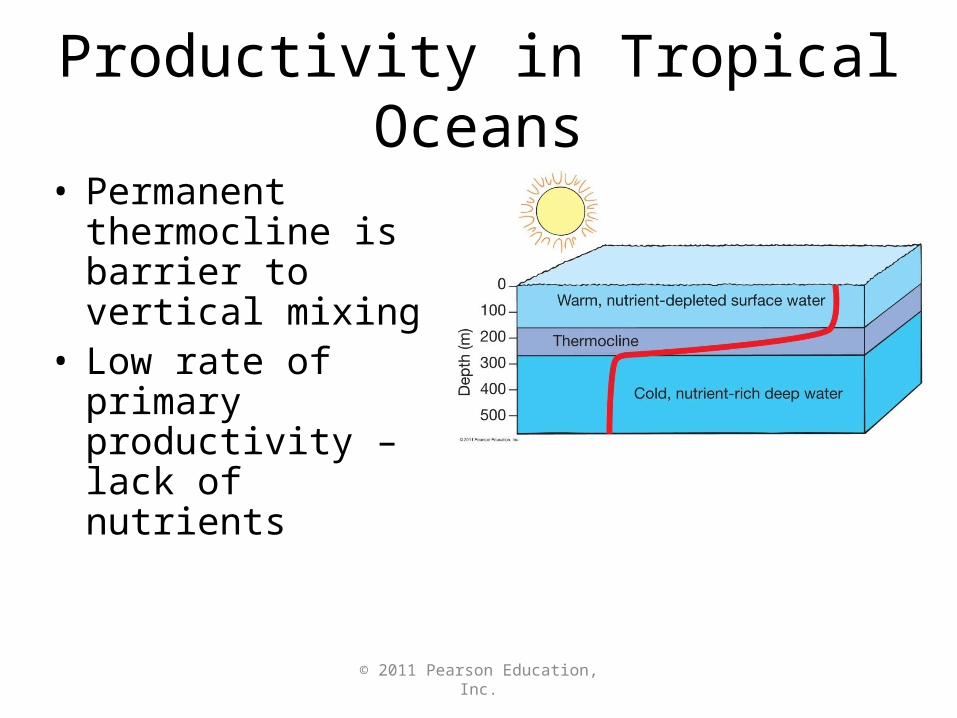
Productivity in Tropical Oceans
• Permanent thermocline is barrier to vertical mixing
• Low rate of primary productivity – lack of nutrients
© 2011 Pearson Education, Inc.
Productivity in Tropical Oceans
• High primary productivity in areas of– Equatorial upwelling– Coastal upwelling– Coral reefs
• Symbiotic algae• Recycle nutrients within the ecosystem
© 2011 Pearson Education, Inc.
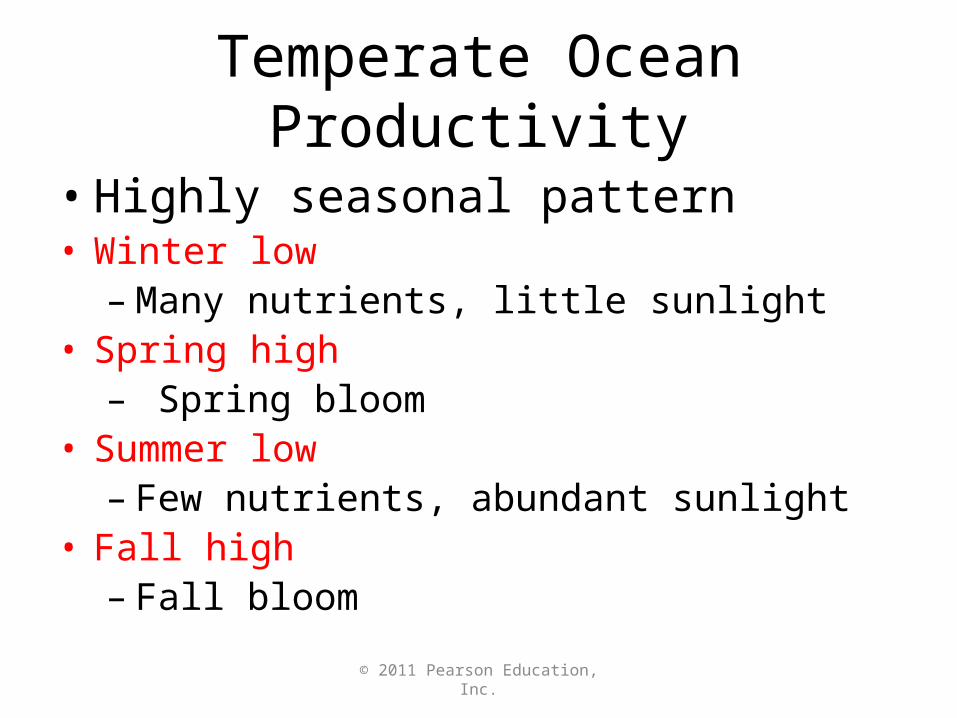
Temperate Ocean Productivity
• Highly seasonal pattern• Winter low
– Many nutrients, little sunlight• Spring high
– Spring bloom• Summer low
– Few nutrients, abundant sunlight• Fall high
– Fall bloom
© 2011 Pearson Education, Inc.
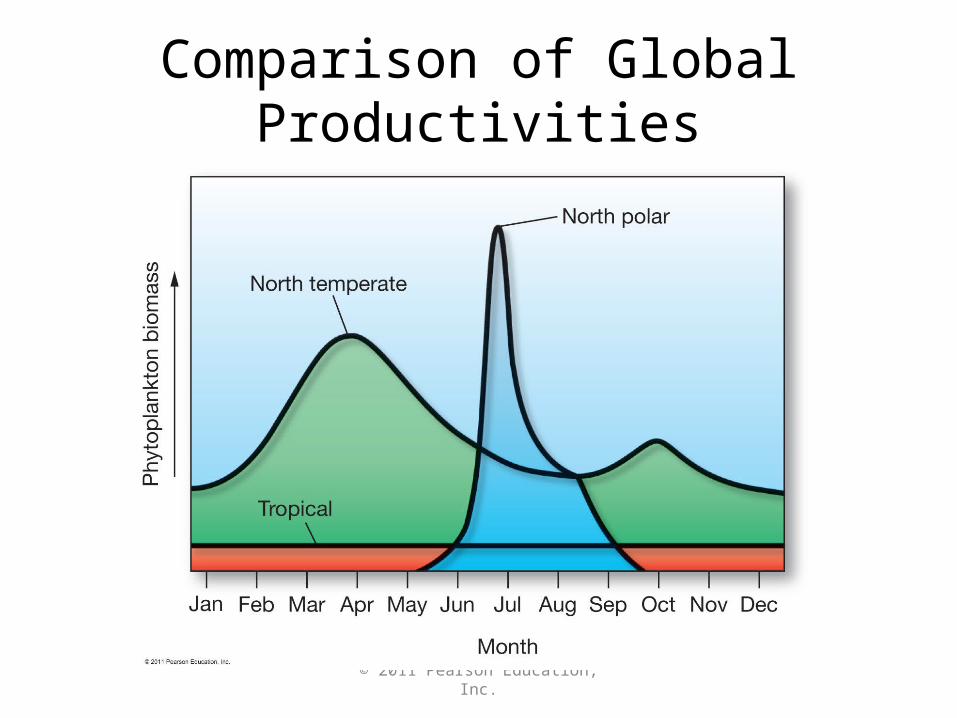
Comparison of Global Productivities

© 2011 Pearson Education, Inc.
Energy Flow in Marine Systems
• Three categories of organisms:• Producers
– Nourish themselves with photosynthesis or chemosynthesis
– Autotrophic
• Consumers– Eat other organisms– Heterotrophic
• Decomposers – break down dead organisms or waste

© 2011 Pearson Education, Inc.
Energy Flow in Marine Systems

© 2011 Pearson Education, Inc.
Consumers in Marine Ecosystems
• Herbivores – eat plants • Carnivores – eat other animals • Omnivores – eat plants and animals • Bacteriovores – eat bacteria
© 2011 Pearson Education, Inc.
Trophic Levels
• Feeding stage
• Chemical energy transferred from producers to consumers
• About 10% of energy transferred to next trophic level
• Gross ecological efficiency

© 2011 Pearson Education, Inc.
Trophic Levels

© 2011 Pearson Education, Inc.
Ecosystem Energy Flow and Efficiency
© 2011 Pearson Education, Inc.
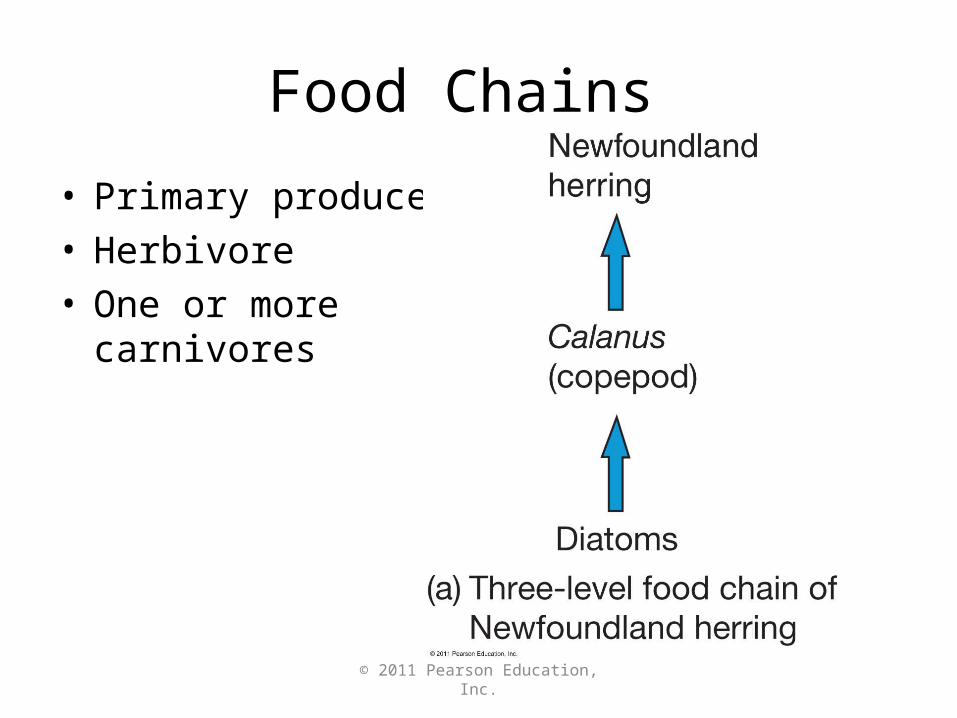
Food Chains
• Primary producer• Herbivore• One or more
carnivores
© 2011 Pearson Education, Inc.
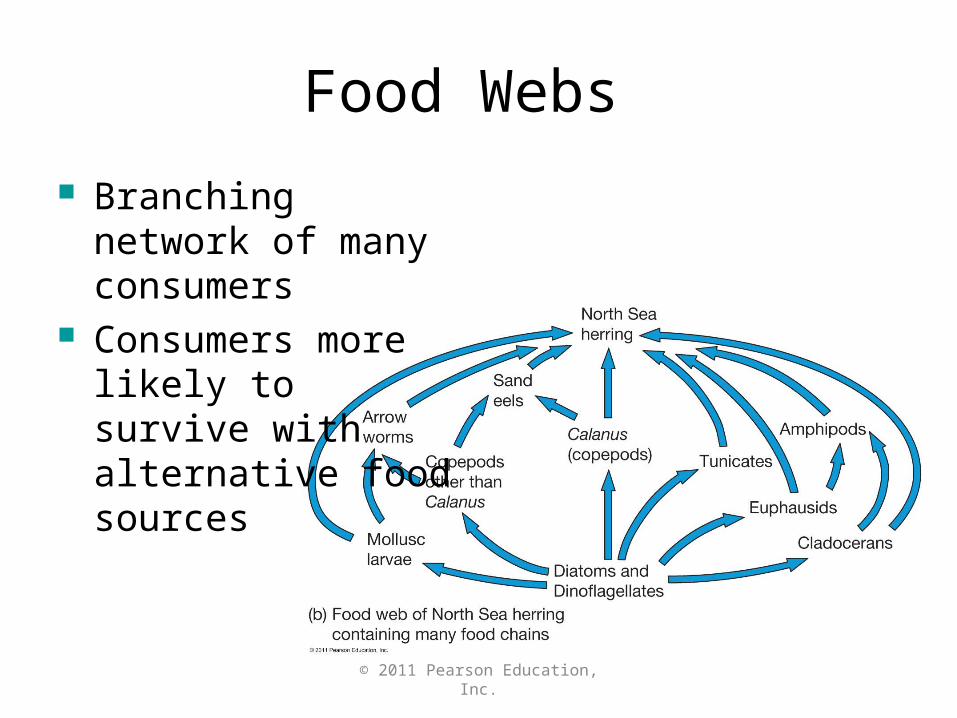
Food Webs
Branching network of many consumers
Consumers more likely to survive with alternative food sources
© 2011 Pearson Education, Inc.
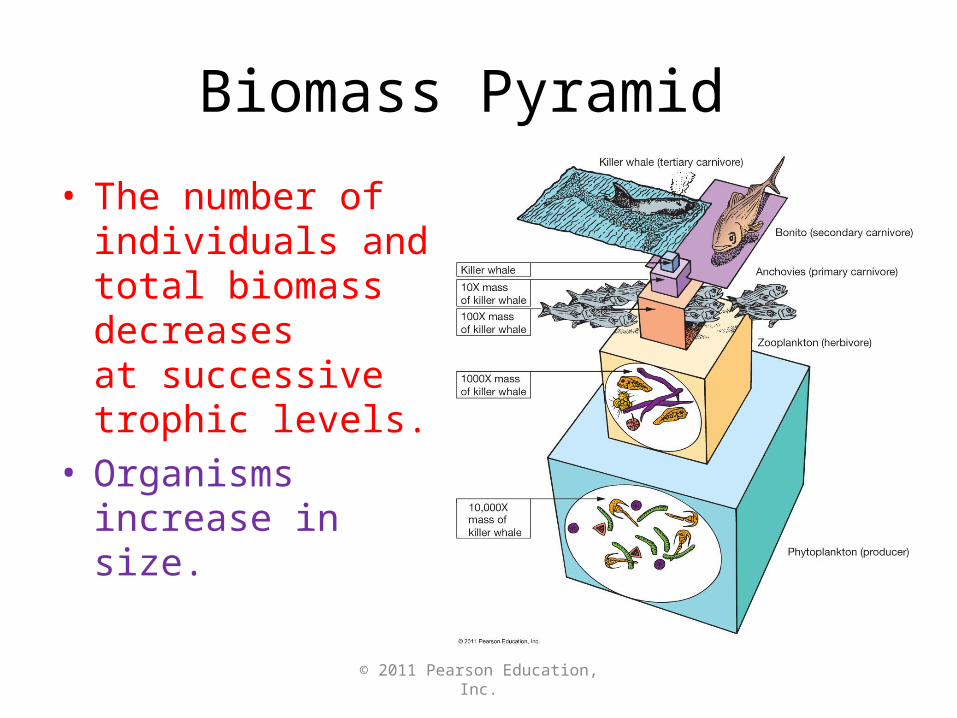
Biomass Pyramid
• The number of individuals and total biomass decreases at successive trophic levels.
• Organisms increase in size.
© 2011 Pearson Education, Inc.
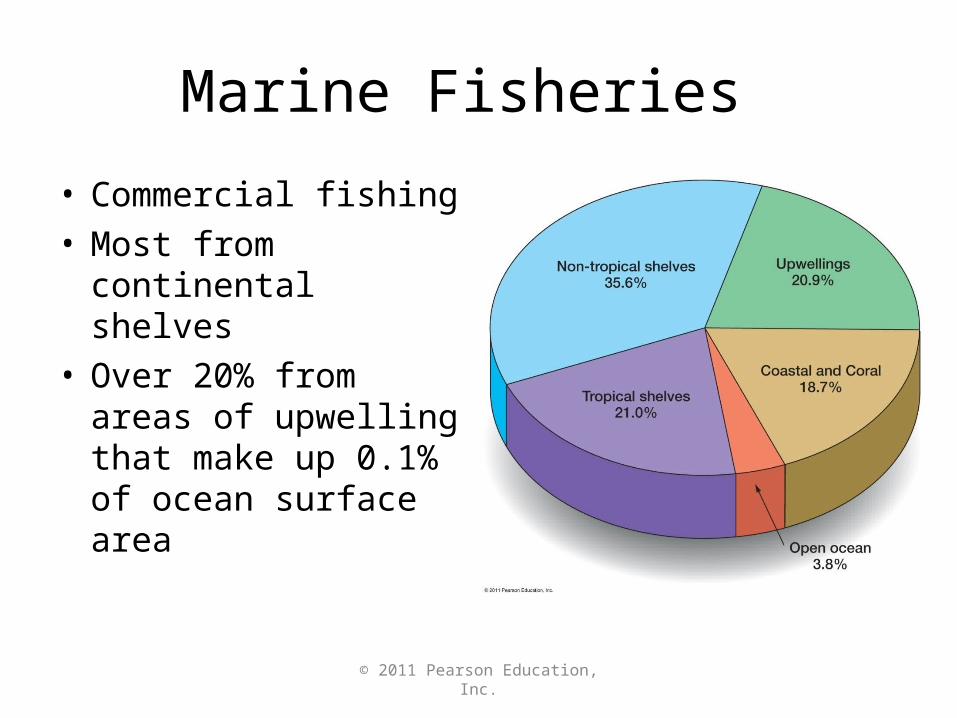
Marine Fisheries
• Commercial fishing• Most from continental
shelves• Over 20% from areas
of upwelling that make up 0.1% of ocean surface area

© 2011 Pearson Education, Inc.
Overfishing
• Fish from standing stock – the mass present in the ecosystem at any given time
• Overfishing – fish stock harvested too rapidly, juveniles not sexually mature to reproduce
• Reduction in Maximum Sustainable Yield (MSY)

© 2011 Pearson Education, Inc.
Exploitation Status of Marine Fish

© 2011 Pearson Education, Inc.
Overfishing
• 80% of available fish stock fully exploited, overexploited, or depleted/recovering
• Large predatory fish reduced
• Increased fish production, decreased stocks
© 2011 Pearson Education, Inc.
Incidental Catch or Bycatch
• Non-commercial species are taken incidentally by commercial fishers.
• Bycatch may be up to 8 times more than the intended catch.
– Birds, turtles, dolphins, sharks

© 2011 Pearson Education, Inc.
Tuna and Dolphins
• Tuna and dolphins swim together
• Caught in purse seine net
• Marine Mammals Protection Act addendum for dolphins
• Driftnets or gill nets banned in 1989

© 2011 Pearson Education, Inc.
Purse Seine Net

© 2011 Pearson Education, Inc.
Fisheries Management
• Regulate fishing
• Conflicting interests
• Human employment
• Self-sustaining marine ecosystems
• International waters
• Enforcement difficult

© 2011 Pearson Education, Inc.
Fisheries Management
• Many large fishing vessels
• Governments subsidize fishing
• 1995—world fishing fleet spent $124 billion to catch $70 billion worth of fish

© 2011 Pearson Education, Inc.
Fisheries Management
• Northwest Atlantic Fisheries such as Grand Banks and Georges Bank
• Canada and United States restrict fishing and enforce bans
• Some fish stocks in North Atlantic rebounding
• Other fish stocks still in decline (e.g., cod)
© 2011 Pearson Education, Inc.
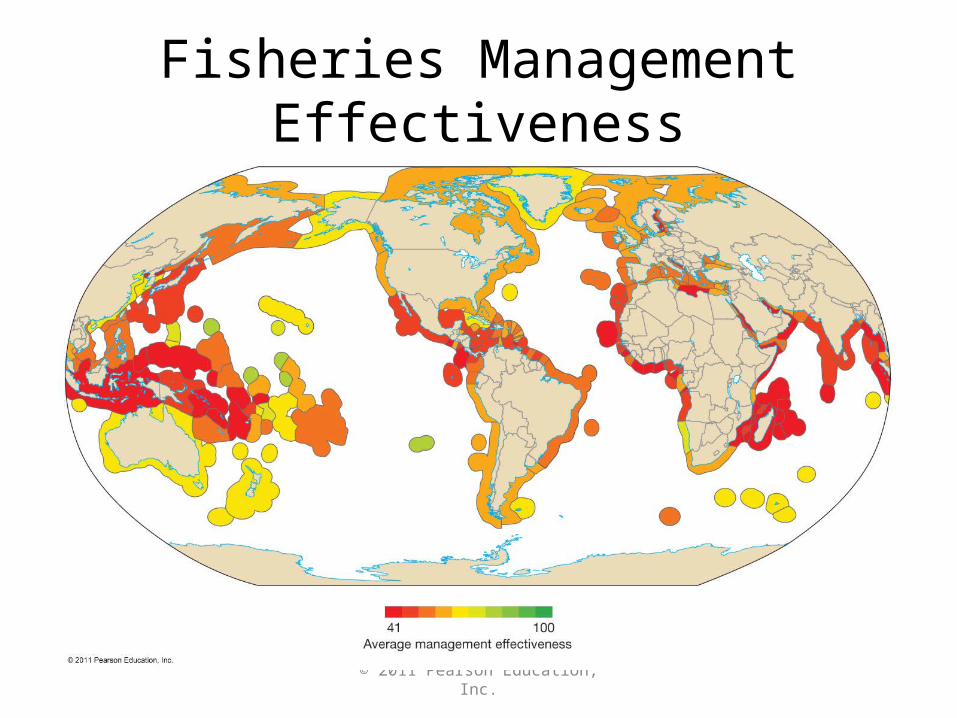
Fisheries Management Effectiveness

© 2011 Pearson Education, Inc.
Fisheries Management
• Consumer choices in seafood
• Consume and purchase seafood from healthy, thriving fisheries– Examples: farmed seafood, Alaska salmon
• Ecosystem-based fishery management
• Avoid overfished or depleted seafood– Examples: tuna, shark, shrimp

Dissostichus eleginoides
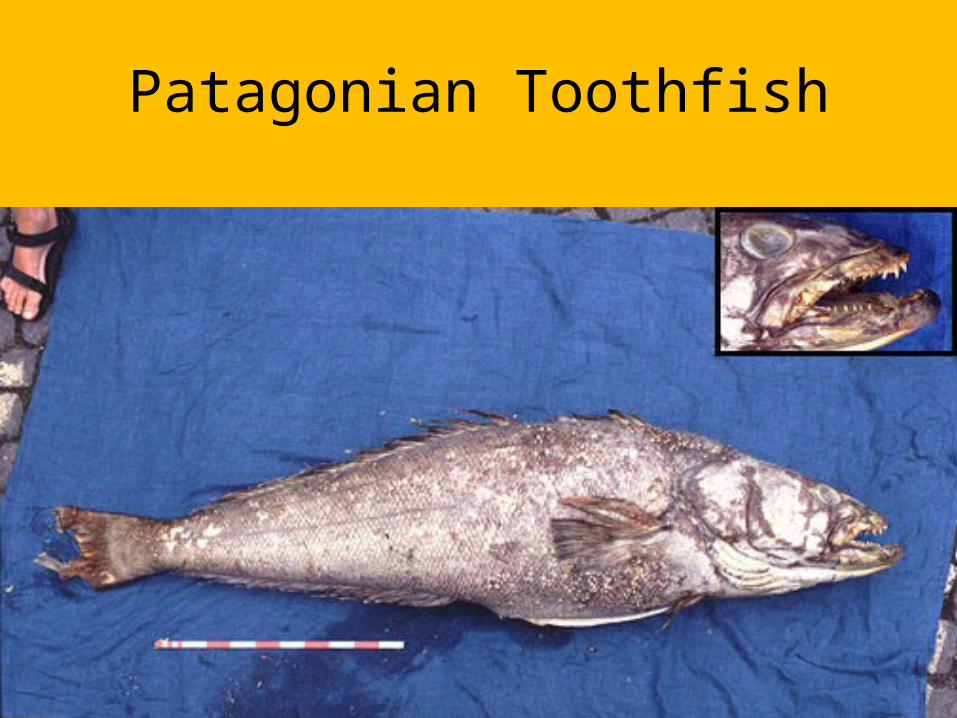
Patagonian Toothfish

Chilean Sea Bass
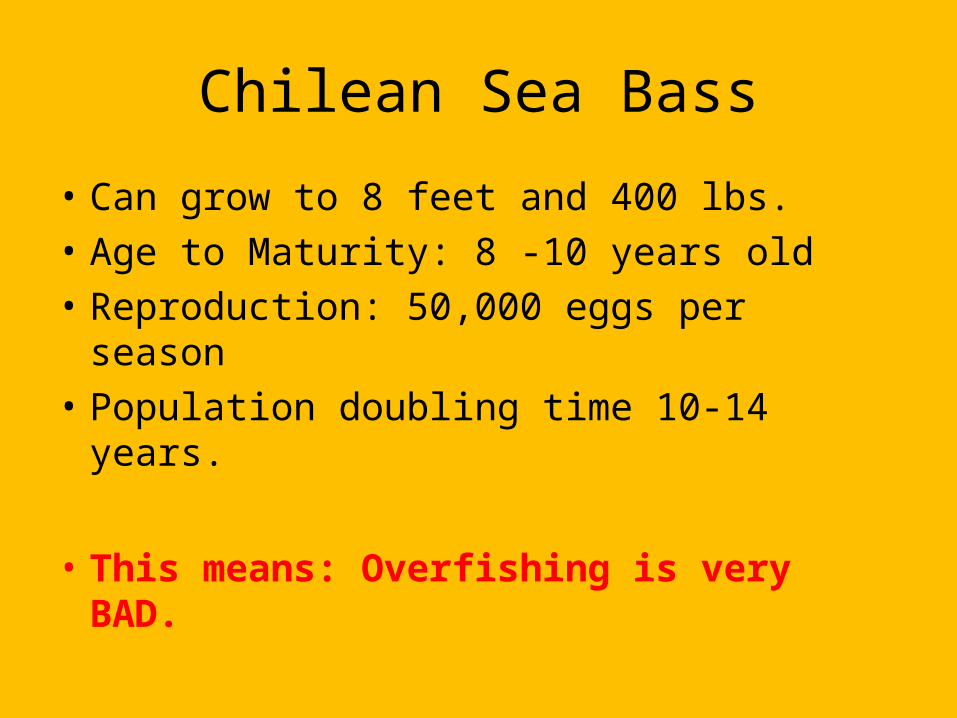
Chilean Sea Bass
• Can grow to 8 feet and 400 lbs.
• Age to Maturity: 8 -10 years old
• Reproduction: 50,000 eggs per season
• Population doubling time 10-14 years.
• This means: Overfishing is very BAD.

© 2011 Pearson Education, Inc.
Seafood Choices
© 2011 Pearson Education, Inc.
End of CHAPTER 13Biological Productivity and Energy Transfer


