HYDROLOGICAL PROCESSESHydrol Process (2012)Published online in Wiley Online Library(wileyonlinelibrarycom) DOI 101002hyp9486
How does afforestation affect the hydrology of a blanketpeatland A modelling study
Ciaran Lewis1 John Albertson2 Tan Zi2 Xianli Xu1 and Gerard Kiely11 Centre forHydrologyMicrometeorology andClimate ChangeDepartment of Civil and Environmental Engineering University College Cork Cork Ireland
2 Department of Civil and Environmental Engineering Duke University Durham NC USA
CandUnE-m
Co
Abstract
Over the last century afforestation in Ireland has increased from 1 of the land area to 10 with most plantations on uplanddrained blanket peatlands This land use change is considered to have altered the hydrological response and water balance ofupland catchments with implications for water resources Because of the difficulty of observing these long-term changes in thefield the aim of this study was to utilize a hydrological model to simulate the rainfall runoff processes of an existing pristineblanket peatland and then to simulate the hydrology of the peatland if it were drained and afforested The hydrological rainfallrunoff model (GEOtop) was calibrated and validated for an existing small (76 ha) pristine blanket peatland in the southwest ofIreland for the 2-year period 2007ndash2008 The current hydrological response of the pristine blanket peatland catchment withregard to streamflow and water table (WT) levels was captured well in the simulations Two land use change scenarios ofafforestation were also examined (A) a young 10-year-old and (B) a semi-mature 15-year-old Sitka Spruce forest Scenario Aproduced similar streamflow dynamics to the pristine peatland whereas total annual streamflow from Scenario B was 20 lowerFor Scenarios A and B on an annual average basis the WT was drawn down by 16 and 20 cm below that observed in the pristinepeatland respectively The maximum WT draw down in Scenario B was 61 cm and occurred in the summer months resulting ina significant decrease in summer streamflow Occasionally in the winter (following rainfall) the WT for Scenario B was just 2 cmlower than the pristine peatland which when coupled with the drainage networks associated with afforestation led to higher peakstreamflows Copyright copy 2012 John Wiley amp Sons Ltd
KEY WORDS peatland rainfall runoff model afforestation hydrology
Received 23 September 2011 Accepted 4 July 2012
INTRODUCTION
Peat is an organic soil composed of partially decomposedplant matter (Hoag and Price 1995) with depths thatrange from 30 cm to as much as 1000 cm Peatlands cover400 million hectares of the earthrsquos surface and storebetween 33 and 50 of the worldrsquos soil carbon pool(Holden 2005) which has been estimated at 25ndash50of the current carbon held in the atmosphere (Frolkingand Roulet 2007) This vast store of carbon is consideredto be vulnerable to climate change (Oechel et al 2000Sottocornola and Kiely 2010) artificial drainage (Holdenet al 2004) and land use change (Limpens et al 2008)More than 80 of these peatlands are located intemperate-cold climates in the northern hemisphereparticularly in Canada (Letts et al 2000) Russia USAand parts of northern Europe (Limpens et al 2008) In allregions of these northern peatlands there have been vastareas that have undergone drainage for commercialforestry (Waldron et al 2009) An estimated 500 000 haof peatland was afforested between the 1950s and 1980sin the UK (Hargreaves et al 2003) This land use change
orrespondence to Ciaran Lewis Centre for Hydrology MicrometeorologyClimate Change Department of Civil and Environmental Engineering
iversity College Cork Cork Irelandail clewisstudentuccie
pyright copy 2012 John Wiley amp Sons Ltd
and drainage is considered to have had a profound effecton vegetation water and carbon dynamics of peatlands(Strack et al 2006)From a regional perspective much of Irelandrsquos native
forestry had been felled over the centuries so much so thatby the beginning of the twentieth century forestryaccounted for only 1 of the total land cover in Ireland(Pilcher and Mac an tSaoir 1995 Eaton et al 2008)However since the 1950s it has been the policy ofsuccessive Irish governments to increase forest coverand by 2007 the national forest area had risen to 10(NFI 2007) with a planned increase to 18 by 2020(Dept of Agriculture 1996)Much of this afforestation over that past five decades
has taken place on peatlands that were traditionallyconsidered unsuitable for agricultural use An estimated49 of the afforestation between 1990 and 2000 wascarried out on peat soils (Black et al 2008) Theprincipal tree species used in peatland afforestation inIreland were Sitka spruce (Picea sitchensis (Bong) Carr)and lodgepole pine (Pinus contorta Dougl) (Byrne andFarrell 2005) Sitka spruce is non-native to Ireland but isfavoured because of its rapid growth in the temperatehumid Irish climatic conditions and its ability to survivein difficult terrain An estimated 57 of the nationalforest stock is Sitka spruce (Horgan et al 2004)Although Sitka spruce is able to thrive under the moist
C LEWIS ET AL
Irish weather conditions (Horgan et al 2004) its rootdevelopment when planted on peat soils is limited to theaerated top section of the peat profile (Lees 1972)Peatlands and particularly blanket peats in Ireland areenvironments with the water table (WT) at or close tothe surface for long periods of the year (Iritz et al 1994Bragg 2002 Holden and Burt 2002 Hogan et al 2006Laine et al 2007) Sottocornola and Kiely (2010) foundthat in a pristine blanket peatland in southwest Ireland thedaily averaged WT never fell further than 16 cm belowthe bog surface for the period 2002ndash2010 This is incontrast to blanket peatlands in places such as Canadawhere the WT falls as much as 60 cm below the surfaceThis makes Irish peatlands unsuitable for afforestation intheir natural undrained (high WT) condition which canresult in stunted root development and vulnerability towind throwFor afforestation purposes peatlands are typically
drained prior to planting with drainage normally beingcarried out using a combination of closely spaced ploughfurrows and deep (05ndash20m) but more widely spacedditches (Holden et al 2004) Frequently this results in achange in streamflow both in the short term while thedrains are active and in the long term when the forestbecomes established (Holden et al 2004) These drainsalthough beneficial for the development of the foresthave also been linked with higher peak streamflows(Robinson 1986) In an early study by Burke (1975) thestreamflow rainfall ratio from an undrained peatlandin Glenamoy Ireland was 234 compared with 792from a drained catchment Conway and Millar (1969)found that artificially drained peats produced rapidstreamflow in the north Pennines (UK) Ahti (1980)found that the flood peak increased after drainage inScandinavian peatlands However investigations byHolden et al (2006) in the same peatlands as the Conwayand Millar (1969) study found that overland flow wasgreatly reduced following drainage whereas subsurfaceflow was greatly increased within the Moor Houseblanket peatlands Investigations by Iritz et al (1994)on a selection of forested Scandinavian peatland catch-ments found that peak flows decreased followingdrainage Prevost et al (1997) reported an increase instream base flow following drainage in a Canadianpeatland Although there have been conflicting conclu-sions drawn from different international studies this islikely due to limited data and the diversity of groundconditions (eg natural variation of WT depth) which isseen as critical to the amount of storage available andsurface runoff production in peatlands (Holden et al2006) Furthermore the type of drainage will impact thedegree of change in hydrology Deep closely spaceddrains cause a peat catchment to respond differently toshallow widely spaced drains Holden et al (2011)observed that in an intact blanket bog in OughtershawMoss in northern England whereas the seasonal range ofWT depth was 0ndash20 cm the spatially weighted mean WTdepth was only 58 cm In the same bog they found for adrained section that whereas the depth of the seasonal WT
Copyright copy 2012 John Wiley amp Sons Ltd
ranged from 0 to 40 cm the spatially weighted mean WTdepth was 115 cm The natural WT depth varies fromlows of ~10 cm in Irish blanket peatlands to highs of~60 cm in Canadian and Scandinavian blanket peatlands(Koehler et al 2011) Whereas drainage always precedesblanket peat afforestation in Ireland this is not necessarilyso in Canada and ScandinaviaThe rainfall runoff response of a peatland catchment
changes once it becomes afforested (Hudson et al 1997Anderson et al 2000 Heal et al 2004) Drainage (WTlowering) peat shrinkage and compression tree canopyinterception and evapotranspiration (ET) all contribute toa changed hydrological (and hydrochemical) regime of apeatland when afforested (Institute of Hydrology 1991Iritz et al 1994 Holden et al 2004 Ballard et al2011b) Anderson et al (2000) in a study investigatingthe effects of blanket bog afforestation on the physicalproperties of the peat soil and on the quantity and timingof runoff found a reduction of 7 in streamflow afterafforestation in a Scottish peatland relative to an unforesteddrained control They noted that the reduction in streamflowwas predominantly in the spring and summer possiblelinked with higher ET from the forest canopy Comparedwith the drained control peak flows were increased byafforestation whereas the baseflow component of the totalflow was reducedOne of the major contributing factors in changing the
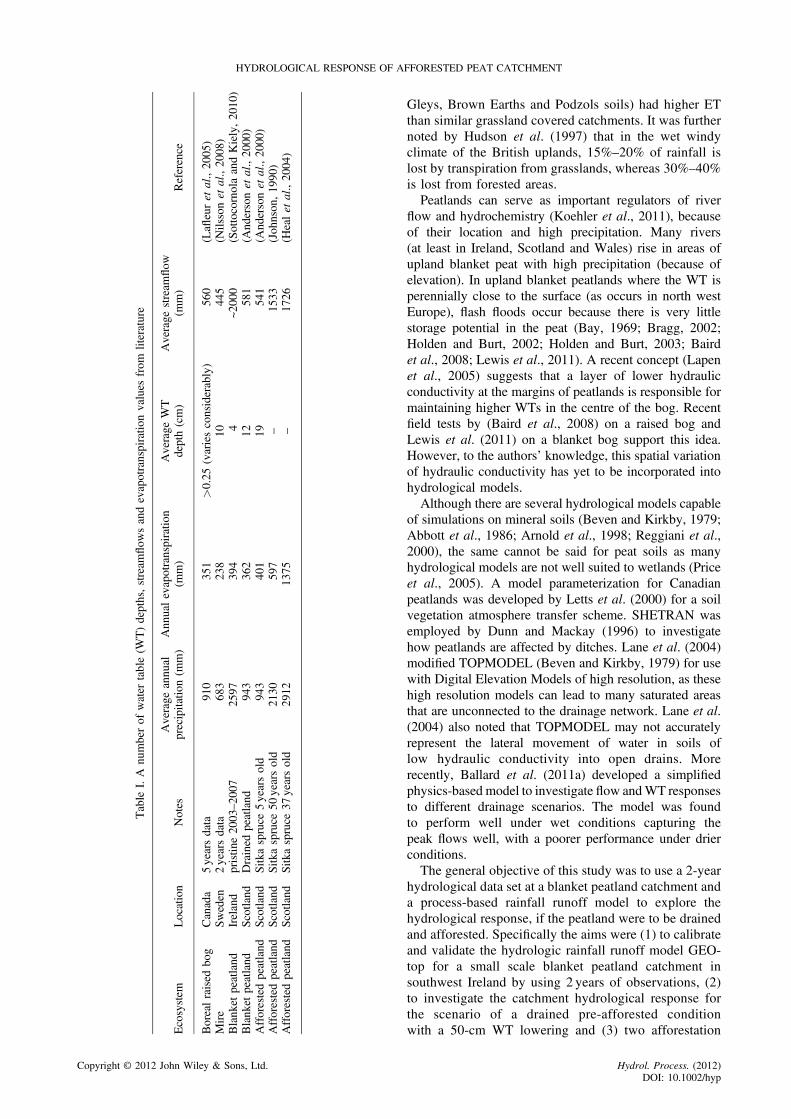
rainfall runoff response of an afforested peatland is thechange in interception losses ET from a pristine blanketpeatland in southwest Ireland was observed over 5 yearsto be 155 of the total precipitation representing anannual average of 394mm (Sottocornola and Kiely 2010)However many studies reported far greater interceptionlosses in afforested peatlands Studies in areas that may beconsidered to have similar climates to south west Irelandsuch as the Heal et al (2004) study in Scotland found thethat interception losses in a Sitka spruce forestedpeatland were reported to be greater than 50 of theannual precipitation An investigation by the Institute ofHydrology (1991) into the water resources of two uplandcatchments also in Scotland found significant interceptionlosses amounting to 38 of the precipitation Andersonet al (1990) in UK afforested peatland reported 38canopy interception and 12 transpiration loss in UKafforested peatland Johnson (1990) found that in a50-year-old Sitka spruce forest in the Scottish highlandson peat and peaty gley soils the average interceptionover a 3-year period was 28 with the greatestinterception occurring in the summer months and theleast in winter A 25-year-old Sitka spruce forest ona peaty gley soil in Northumberland UK was observedto have an average interception loss of 48 of theprecipitation (Anderson and Pyatt 1986) These studiesdemonstrate that ET increases and stream runoffdecreases after afforestation of peatlands (Table I) Areview by Hudson et al (1997) of the studies carried outon a number of catchments including the Plynlimon andLanbrynmair catchments in Wales concluded thatafforested upland catchments (on a mixture of Peaty
Hydrol Process (2012)DOI 101002hyp
Table
IA
numberof
water
table(W
T)depthsstream
flow
sandevapotranspiratio
nvalues
from
literature
Ecosystem
Location
Notes
Average
annual
precipitatio
n(m
m)
Annualevapotranspiratio
n(m
m)
Average
WT
depth(cm)
Average
stream
flow
(mm)
Reference
Borealraised
bog
Canada
5yearsdata
910
351
gt025
(variesconsiderably)
560
(Lafleuret
al2005)
Mire
Sweden
2yearsdata
683
238
10445
(Nilssonet
al2008)
Blanket
peatland
Ireland
pristin
e2003ndash2
007
2597
394
4~2
000
(SottocornolaandKiely2010)
Blanket
peatland
Scotland
Drained
peatland
943
362
12581
(Andersonet
al2000)
Afforestedpeatland
Scotland
Sitk
aspruce
5yearsold
943
401
19541
(Andersonet
al2000)
Afforestedpeatland
Scotland
Sitk
aspruce
50yearsold
2130
597
ndash1533
(Johnson1990)
Afforestedpeatland
Scotland
Sitk
aspruce
37yearsold
2912
1375
ndash1726
(Healet
al2004)
HYDROLOGICAL RESPONSE OF AFFORESTED PEAT CATCHMENT
Copyright copy 2012 John Wiley amp Sons Ltd
Gleys Brown Earths and Podzols soils) had higher ETthan similar grassland covered catchments It was furthernoted by Hudson et al (1997) that in the wet windyclimate of the British uplands 15ndash20 of rainfall islost by transpiration from grasslands whereas 30ndash40is lost from forested areasPeatlands can serve as important regulators of river
flow and hydrochemistry (Koehler et al 2011) becauseof their location and high precipitation Many rivers(at least in Ireland Scotland and Wales) rise in areas ofupland blanket peat with high precipitation (because ofelevation) In upland blanket peatlands where the WT isperennially close to the surface (as occurs in north westEurope) flash floods occur because there is very littlestorage potential in the peat (Bay 1969 Bragg 2002Holden and Burt 2002 Holden and Burt 2003 Bairdet al 2008 Lewis et al 2011) A recent concept (Lapenet al 2005) suggests that a layer of lower hydraulicconductivity at the margins of peatlands is responsible formaintaining higher WTs in the centre of the bog Recentfield tests by (Baird et al 2008) on a raised bog andLewis et al (2011) on a blanket bog support this ideaHowever to the authorsrsquo knowledge this spatial variationof hydraulic conductivity has yet to be incorporated intohydrological modelsAlthough there are several hydrological models capable
of simulations on mineral soils (Beven and Kirkby 1979Abbott et al 1986 Arnold et al 1998 Reggiani et al2000) the same cannot be said for peat soils as manyhydrological models are not well suited to wetlands (Priceet al 2005) A model parameterization for Canadianpeatlands was developed by Letts et al (2000) for a soilvegetation atmosphere transfer scheme SHETRAN wasemployed by Dunn and Mackay (1996) to investigatehow peatlands are affected by ditches Lane et al (2004)modified TOPMODEL (Beven and Kirkby 1979) for usewith Digital Elevation Models of high resolution as thesehigh resolution models can lead to many saturated areasthat are unconnected to the drainage network Lane et al(2004) also noted that TOPMODEL may not accuratelyrepresent the lateral movement of water in soils oflow hydraulic conductivity into open drains Morerecently Ballard et al (2011a) developed a simplifiedphysics-based model to investigate flow andWT responsesto different drainage scenarios The model was foundto perform well under wet conditions capturing thepeak flows well with a poorer performance under drierconditionsThe general objective of this study was to use a 2-year
hydrological data set at a blanket peatland catchment anda process-based rainfall runoff model to explore thehydrological response if the peatland were to be drainedand afforested Specifically the aims were (1) to calibrateand validate the hydrologic rainfall runoff model GEO-top for a small scale blanket peatland catchment insouthwest Ireland by using 2 years of observations (2)to investigate the catchment hydrological response forthe scenario of a drained pre-afforested conditionwith a 50-cm WT lowering and (3) two afforestation
Hydrol Process (2012)DOI 101002hyp
C LEWIS ET AL
scenarios A a 10-year-old Sitka spruce afforestationsimulation and B a 15-year-old Sitka spruce afforestationsimulation
MATERIALS AND METHODS
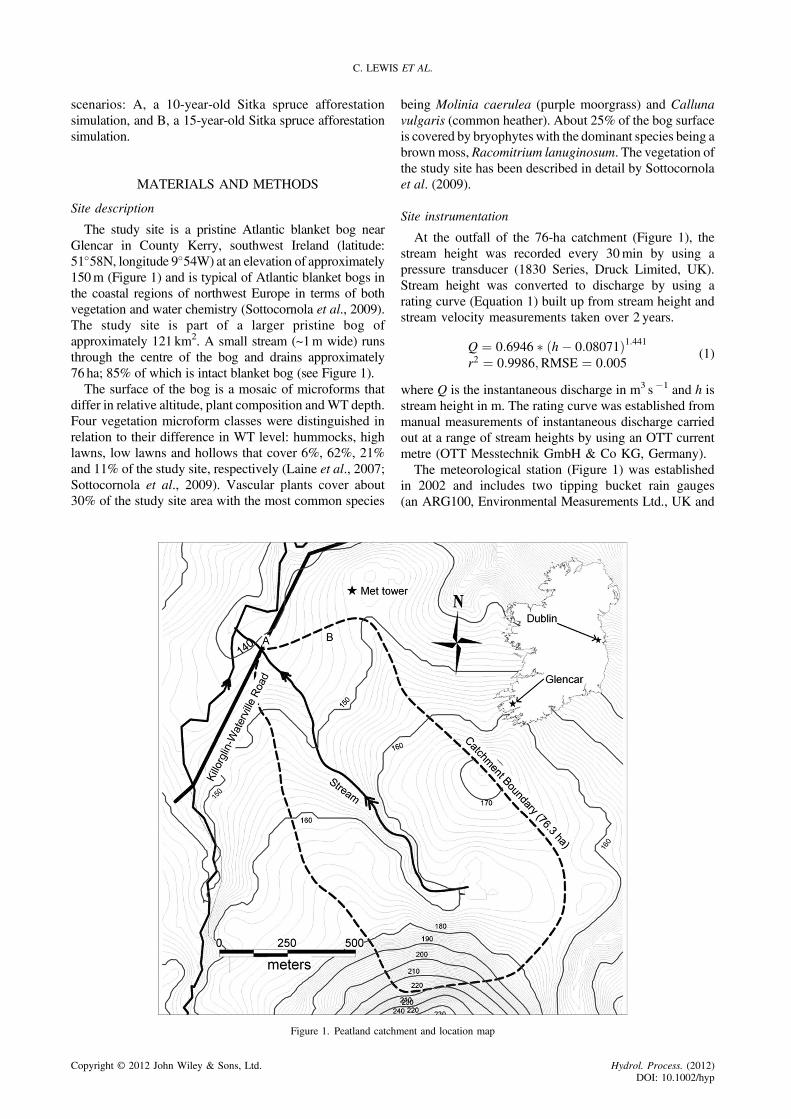
Site description
The study site is a pristine Atlantic blanket bog nearGlencar in County Kerry southwest Ireland (latitude5158N longitude 954W) at an elevation of approximately150m (Figure 1) and is typical of Atlantic blanket bogs inthe coastal regions of northwest Europe in terms of bothvegetation and water chemistry (Sottocornola et al 2009)The study site is part of a larger pristine bog ofapproximately 121 km2 A small stream (~1m wide) runsthrough the centre of the bog and drains approximately76 ha 85 of which is intact blanket bog (see Figure 1)The surface of the bog is a mosaic of microforms that
differ in relative altitude plant composition andWT depthFour vegetation microform classes were distinguished inrelation to their difference in WT level hummocks highlawns low lawns and hollows that cover 6 62 21and 11 of the study site respectively (Laine et al 2007Sottocornola et al 2009) Vascular plants cover about30 of the study site area with the most common species
Figure 1 Peatland catchm
Copyright copy 2012 John Wiley amp Sons Ltd
being Molinia caerulea (purple moorgrass) and Callunavulgaris (common heather) About 25 of the bog surfaceis covered by bryophytes with the dominant species being abrownmoss Racomitrium lanuginosum The vegetation ofthe study site has been described in detail by Sottocornolaet al (2009)
Site instrumentation
At the outfall of the 76-ha catchment (Figure 1) thestream height was recorded every 30min by using apressure transducer (1830 Series Druck Limited UK)Stream height was converted to discharge by using arating curve (Equation 1) built up from stream height andstream velocity measurements taken over 2 years
Q frac14 06946 h 008071eth THORN1441r2 frac14 09986RMSE frac14 0005
(1)
where Q is the instantaneous discharge in m3 s1 and h isstream height in m The rating curve was established frommanual measurements of instantaneous discharge carriedout at a range of stream heights by using an OTT currentmetre (OTT Messtechnik GmbH amp Co KG Germany)The meteorological station (Figure 1) was established
in 2002 and includes two tipping bucket rain gauges(an ARG100 Environmental Measurements Ltd UK and
ent and location map
Hydrol Process (2012)DOI 101002hyp
HYDROLOGICAL RESPONSE OF AFFORESTED PEAT CATCHMENT
an Obsermet OMC-200 Observator BV The Netherlands)and a WT level recorder that consists of a pressuretransducer (PCDR1830 Campbell Scientific UK) placedinside a metal well pierced all along its height Wind speedwas recorded with a 2D sonic anemometer (WindSonicGill UK) Air temperature and relative humidity weremeasured at 2-m height with a shielded probe (HMP45CVaisala Finland) whereas atmospheric pressure wasrecorded with a barometer (PTB101B Vaisala Finland)An eddy covariance system for CO2 fluxes was alsolocated on the same tower It consisted of a 3D sonicanemometer (Model 81000 RM Young Company USA)and an open-path infrared gas analyzer for H2O and CO2
concentrations (LI-7500 LI-COR USA) mounted 3mabove the vegetation
Climate
Sottocornola and Kiely (2010) at the same site foundthat the range of annual rainfall (2002ndash2009) was2236ndash3365mm with an annual average of 2597mm Theannual ET (estimated using eddy covariance methods)ranged from 369 to 424mm with an annual average of394mm From2002 to 2009 therewas an annual average of208 wet days (gt1mmday1) (Koehler et al 2009) Theaverage annual air temperature was 105 CThe recorded flow at the stream outfall (see Figure 1)
ranged between 0015 and 100 l s1 ha1 (Koehler et al2009) with the 95 percentile flow exceeding 0037 l s1
ha1 The flow was observed to be flashy with over 90
of the streamflow sourced from surface runoff (Lewiset al 2011) This is due to a perennially high WT thatwas observed continuously over the 7 years 2002ndash2009to be within 17 cm of the land surface (with the 7-yearmean WT at ~4 cm below the surface) at the eddycovariancemeteorological station Although additionalWT observation stations would be beneficial the site iswell known to the authorsrsquo through frequent site visitsand it is considered that the WT measurements arerepresentative of the peatland A manual WT observationstation was established in 2009 near the stream and theWT was found to vary between 0 and 10 cm below thesurface Observations were taken approximately sixndasheighttimes a year particularly during dry periods Lewis et al(2011) investigated the spatial variation of bulk densityand saturated hydraulic conductivity at the same site andfound that at the surface (top 10 cm) saturated horizontalhydraulic conductivity was lowest at the bog margin nearthe stream (~107m s1) and increased at the bog interior(~105m s1) The converse was found for bulk densitywhich ranged from ~011 g cm3 at the bog marginto ~ 0055 g cm3 near the bog interior
Process-based hydrological model ndash GEOtop
The process-based hydrological model GEOtop (Rigonet al 2006) was used in this study It is a distributedhydrological model (operating on a 8m 8m grid) andsimulates the complete hydrological balance in acontinuous way during a whole year (at a temporal
Copyright copy 2012 John Wiley amp Sons Ltd
increment of 60min) It uses geospatial data (eg topographysoil type vertical and horizontal hydraulic conductivitydepth and the Van Genuchten parameters a and n(van Genuchten 1980)) vegetation cover (including cropheight Leaf Area Index (LAI) and root depth) and landcover It provides spatially distributed output fields aswell as routing water and sediment flows through streamand river networksGEOtop includes a rigorous treatment of the core
hydrological processes (eg unsaturated and saturated flowand transport surface energy balances and streamflowgenerationrouting) Unsaturated dynamics are treated witha 3D integration of Richardsrsquo equation whereas surfacerunoff is routed via a kinematic wave The spacendashtimefields of radiation that drive the evaporative processesaccount for terrain effects such as aspect slope andshading The energy processes in GEOtop have beenextensively tested and validated (Bertoldi et al 2006)Using GEOtop in an alpine catchment Bertoldi et al(2010) showed that the major factors controlling the landsurface temperature in a humid climate were incomingsolar radiation and land cover variability Others have alsotaken the GEOtop model and added further modules to itincluding a snow module by Zanotti et al (2004) and alandside probability function by Simoni et al (2008)The hourly meteorological data required (precipitation
atmospheric pressure temperature global shortwave radi-ation relative humidity and wind speed and direction) byGEOtop were available from the on site meteorologicaltower A field measurement study by Lewis et al (2011) atthe same site found that the saturated horizontal hydraulicconductivity in the riparian zone within 10m of the streamwas ~107 m s1 which was one to two orders ofmagnitude less conductive than the bog interior Thesaturated horizontal conductivity was found to beapproximately twice vertical hydraulic conductivity Toreflect this pattern in the soil matrix in GEOtop the peatwithin 10m of the stream was assigned the hydraulicparameters found by Lewis et al (2011) in the riparianzone A second zone was created between 10 and 20mfrom the stream and the peat in this zone was assigned ahigher hydraulic conductivity value An incrementalprocess of increasing the hydraulic conductivity wasutilized until at the bog interior the saturated hydraulicconductivity assigned was ~105 m s1 Vegetationdetails (LAI height and root depth) were adopted fromSottocornola et al (2009) and Laine et al (2007)
Modelling scenarios
To reflect the practice of draining peatland prior toafforestation an artificial drainage network was simulatedfor this GEOtop application This consisted of a series ofditches placed 8m apart and 350mm deep The ditchesran orthogonal to the contours and drained into the streamrunning through the centre of the bog Initial trials of thisnew drainage network found however that there waslittle change in the WT Peatland drains have been found tolower the WT adjacent to the drains specifically downslope
Hydrol Process (2012)DOI 101002hyp
C LEWIS ET AL
of drains as the drains intercept the surface runoff fromupslope areas (Holden et al 2006) Because of modelconstraints it was not possible to increase the drainagenetwork density to achieve a realistic WT drawdown Itwas therefore decided to increase the horizontalconductivity of the peatland to represent the changedtravel time for water from the peat matrix to the drainagenetwork that a peatland with a higher density of drainswould have However it must also be noted that thisincrease in horizontal conductivity is also likely toreflect the increase in hydraulic conductivity caused bychanges in soil structure associated with WT drawdown(Ramchunder et al 2007)Two possible land use change scenarios were simulated
in this study changing the land use from natural peatlandto a 10-year-old (Scenatio A) and a 15-year-old (ScenarioB ) Sitka spruce forest The LAI was adopted from Tobinet al (2006) in a study on LAI in different ages ofSitka spruce forests in Ireland Sitka spruce forests atapproximately 15 years of age have the highest LAI and
0 50 100 150 200 250 300 3500
05
1
15
2
Julian Day 2007
Flo
w (
m s
minus1 )
Observed FlowSimulated Flow
Figure 2 Observed and simulated flows for 2007 at hourly intervals
0 100 200 3000
500
1000
1500
2000
2500
Julian Days
Flo
w (
mm
)
RainfallObserved FlowSimulated Flow
(a)
Figure 3 For 2007 (a) cumulative rainfall observed flow and simulatesimulated
Copyright copy 2012 John Wiley amp Sons Ltd
therefore deemed to have the largest impact on the rainfallrunoff response mainly from increased interception andtranspiration The changes to the model for Scenario Awere made by increasing the LAI to 45 root depth to40 cm and canopy height to 250 cm For Scenario B theLAI root depth and canopy height were increased to 7555 and 800 cm respectively Along with the change inland use both of these scenarios also included a newdrainage network to reflect the practice of drainingpeatlands prior to afforestation
RESULTS
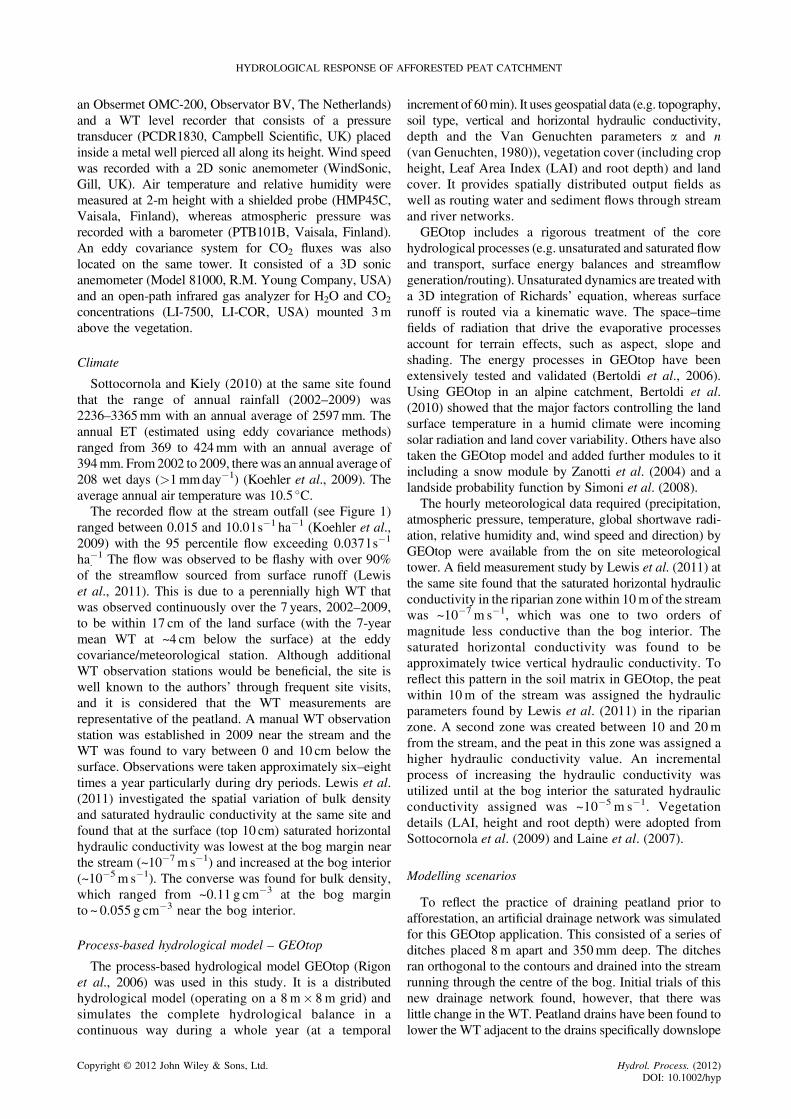
The model was calibrated using observed data for 2007Figure 2 shows the time series of observed and GEOtopmodelled flows with in a NashndashSutcliffe (Nash andSutcliffe 1970) efficiency of 087 The difference betweenobserved and simulated flows is greatest in times of highflows where the simulated flow is larger than the observedHowever at times of high flow the observed flows may beunderestimated as flow spills overbank and no streamflowmeasurements were recorded for overbank flow (becauseof safety reasons) The cumulative rainfall (2229mm)observed streamflow (1925mm) and simulated streamflow(2018 mm) are shown in Figure 3(a) The modelled ET of~211mm for 2007 is lower than both the observed value of304mm and the nearby eddy covariance estimate of ETof 388mm for the hydrological year 20062007 reportedby Sottocornola and Kiely (2010) Monthly totals ofsimulated flow compare well with observed values(Figure 3(b)) as do the instantaneous values of simulatedand observed flows (Figure 3(c)) with the exception ofthe very highest flows We believe this is due to theoverbank flow for which our high observed flows arelikely to be underestimated
JanFebMarArpMayJun Jul AugSepOctNovDec0
1
2
3
4x 10
5
Flo
w (
m3 )
0 05 1 150
05
1
15
Observed flows (m3 sminus1)
Sim
ulat
ed fl
ows
(m3
sminus1 )
Observed FlowSimulated Flow
R2= 091
(b)
(c)
d flow (b) monthly observed and simulated flows (c) observed andflows
Hydrol Process (2012)DOI 101002hyp
HYDROLOGICAL RESPONSE OF AFFORESTED PEAT CATCHMENT
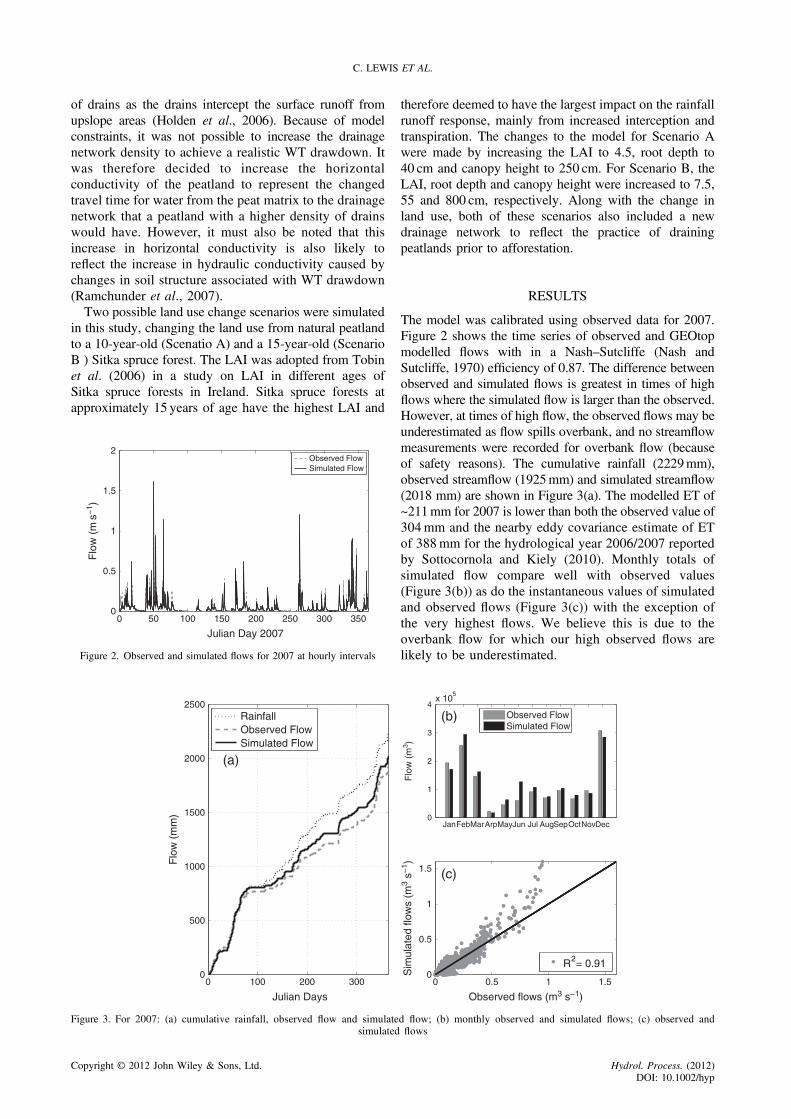
The observed and simulated WT depths are shown inFigure 4 The model simulates WT over the full extent ofthe bog and will be somewhat different to the observedWT which was from one WT sensor point Examining
0 50 100 150 200 250 300 350
0
Dep
th o
f wat
er ta
ble
belo
w s
urfa
ce (
cm)
minus30
minus25
minus20
minus15
minus10
minus5
minus100
minus50
0
Julian Day 2007D
aily
Rai
nfal
l (m
m)
Observed WTSimulated WTDaily Rainfall
Figure 4 For 2007 daily rainfall (top) observed and simulated water table
0 100 200 3000
500
1000
1500
2000
2500
3000
Julian Days
Flo
w (
mm
)
RainfallObserved FlowSimulated Flow
(a)
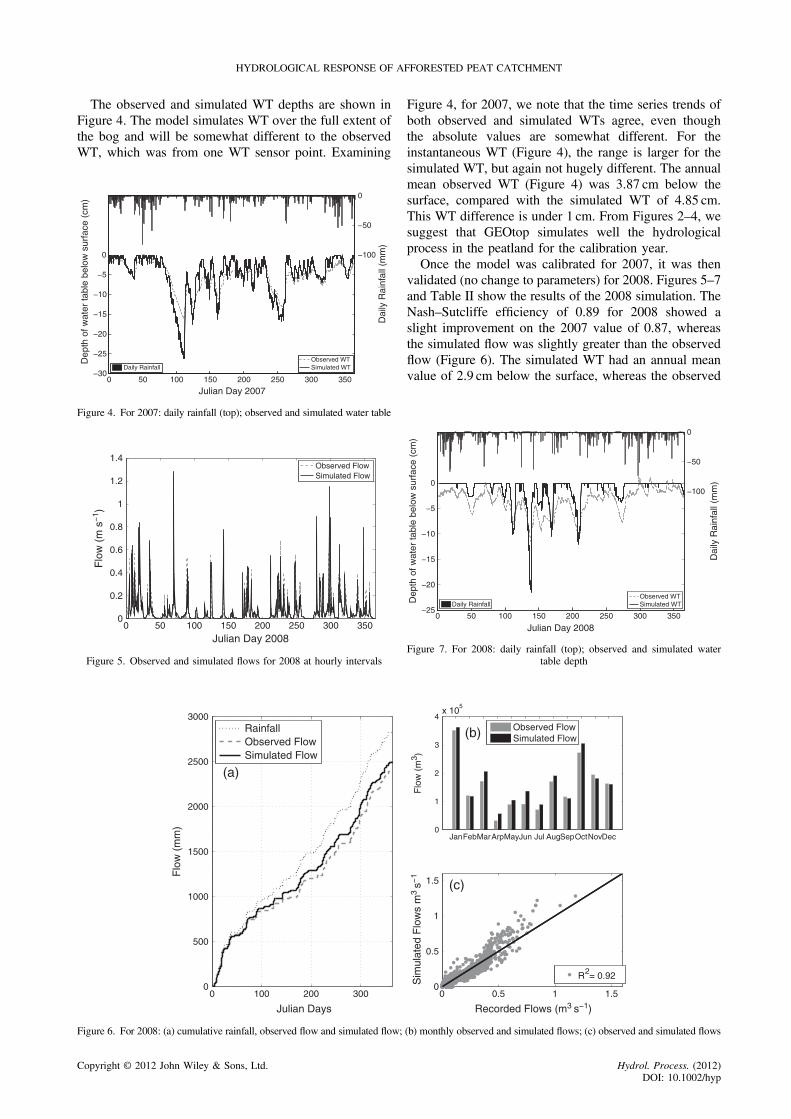
Figure 6 For 2008 (a) cumulative rainfall observed flow and simulated flow
0 50 100 150 200 250 300 3500
02
04
06
08
1
12
14
Julian Day 2008
Flo
w (
m s
minus1 )
Observed FlowSimulated Flow
Figure 5 Observed and simulated flows for 2008 at hourly intervals
Copyright copy 2012 John Wiley amp Sons Ltd
Figure 4 for 2007 we note that the time series trends ofboth observed and simulated WTs agree even thoughthe absolute values are somewhat different For theinstantaneous WT (Figure 4) the range is larger for thesimulated WT but again not hugely different The annualmean observed WT (Figure 4) was 387 cm below thesurface compared with the simulated WT of 485 cmThis WT difference is under 1 cm From Figures 2ndash4 wesuggest that GEOtop simulates well the hydrologicalprocess in the peatland for the calibration yearOnce the model was calibrated for 2007 it was then
validated (no change to parameters) for 2008 Figures 5ndash7and Table II show the results of the 2008 simulation TheNashndashSutcliffe efficiency of 089 for 2008 showed aslight improvement on the 2007 value of 087 whereasthe simulated flow was slightly greater than the observedflow (Figure 6) The simulated WT had an annual meanvalue of 29 cm below the surface whereas the observed
JanFebMarArpMayJun Jul AugSepOctNovDec0
1
2
3
4x 10
5
Flo
w (
m3 )
Observed FlowSimulated Flow
0 05 1 150
05
1
15
Recorded Flows (m3 sminus1)
Sim
ulat
ed F
low
s m
3 sminus
1
R2= 092
(c)
(b)
(b) monthly observed and simulated flows (c) observed and simulated flows
Dep
th o
f wat
er ta
ble
belo
w s
urfa
ce (
cm)
minus25
minus20
minus15
minus10
minus5
0
0 50 100 150 200 250 300 350
minus100
minus50
0
Julian Day 2008
Dai
ly R
ainf
all (
mm
)
Observed WTSimulated WTDaily Rainfall
Figure 7 For 2008 daily rainfall (top) observed and simulated watertable depth
Hydrol Process (2012)DOI 101002hyp
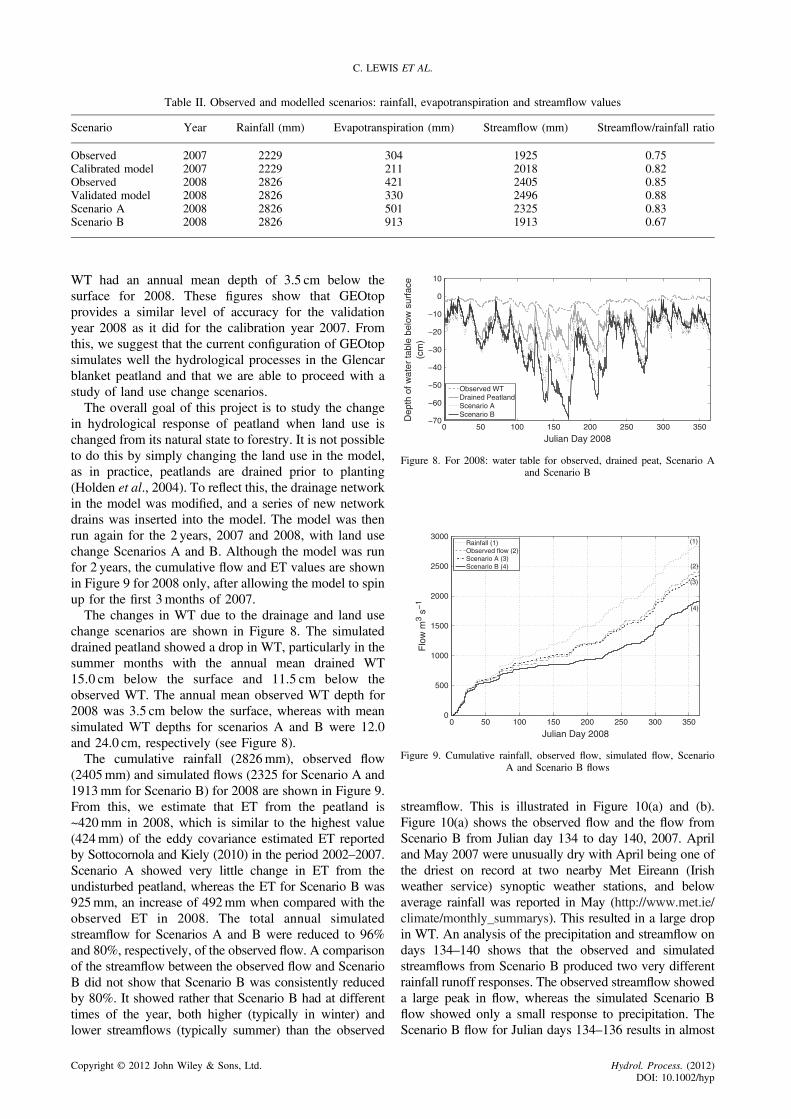
Table II Observed and modelled scenarios rainfall evapotranspiration and streamflow values
Scenario Year Rainfall (mm) Evapotranspiration (mm) Streamflow (mm) Streamflowrainfall ratio
Observed 2007 2229 304 1925 075Calibrated model 2007 2229 211 2018 082Observed 2008 2826 421 2405 085Validated model 2008 2826 330 2496 088Scenario A 2008 2826 501 2325 083Scenario B 2008 2826 913 1913 067
0 50 100 150 200 250 300 350minus70
minus60
minus50
minus40
minus30
minus20
minus10
0
10
Julian Day 2008
Dep
th o
f wat
er ta
ble
belo
w s
urfa
ce(c
m)
Observed WTDrained PeatlandScenario AScenario B
Figure 8 For 2008 water table for observed drained peat Scenario Aand Scenario B
0 50 100 150 200 250 300 3500
500
1000
1500
2000
2500
3000
Julian Day 2008
Flo
w m
3 sminus
1
Rainfall (1)Observed flow (2)Scenario A (3)Scenario B (4)
(3)
(4)
(1)
(2)
Figure 9 Cumulative rainfall observed flow simulated flow ScenarioA and Scenario B flows
C LEWIS ET AL
WT had an annual mean depth of 35 cm below thesurface for 2008 These figures show that GEOtopprovides a similar level of accuracy for the validationyear 2008 as it did for the calibration year 2007 Fromthis we suggest that the current configuration of GEOtopsimulates well the hydrological processes in the Glencarblanket peatland and that we are able to proceed with astudy of land use change scenariosThe overall goal of this project is to study the change
in hydrological response of peatland when land use ischanged from its natural state to forestry It is not possibleto do this by simply changing the land use in the modelas in practice peatlands are drained prior to planting(Holden et al 2004) To reflect this the drainage networkin the model was modified and a series of new networkdrains was inserted into the model The model was thenrun again for the 2 years 2007 and 2008 with land usechange Scenarios A and B Although the model was runfor 2 years the cumulative flow and ET values are shownin Figure 9 for 2008 only after allowing the model to spinup for the first 3months of 2007The changes in WT due to the drainage and land use
change scenarios are shown in Figure 8 The simulateddrained peatland showed a drop in WT particularly in thesummer months with the annual mean drained WT150 cm below the surface and 115 cm below theobserved WT The annual mean observed WT depth for2008 was 35 cm below the surface whereas with meansimulated WT depths for scenarios A and B were 120and 240 cm respectively (see Figure 8)The cumulative rainfall (2826mm) observed flow
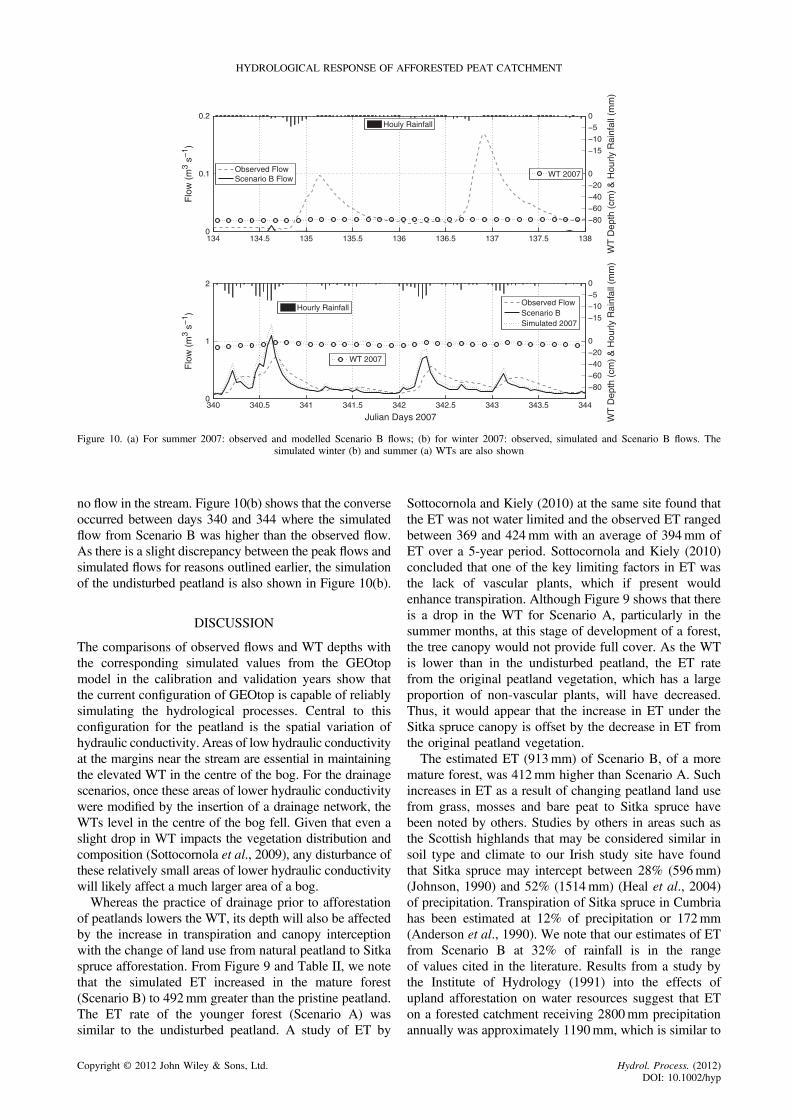
(2405mm) and simulated flows (2325 for Scenario A and1913mm for Scenario B) for 2008 are shown in Figure 9From this we estimate that ET from the peatland is~420mm in 2008 which is similar to the highest value(424mm) of the eddy covariance estimated ET reportedby Sottocornola and Kiely (2010) in the period 2002ndash2007Scenario A showed very little change in ET from theundisturbed peatland whereas the ET for Scenario B was925mm an increase of 492mm when compared with theobserved ET in 2008 The total annual simulatedstreamflow for Scenarios A and B were reduced to 96and 80 respectively of the observed flow A comparisonof the streamflow between the observed flow and ScenarioB did not show that Scenario B was consistently reducedby 80 It showed rather that Scenario B had at differenttimes of the year both higher (typically in winter) andlower streamflows (typically summer) than the observed
Copyright copy 2012 John Wiley amp Sons Ltd
streamflow This is illustrated in Figure 10(a) and (b)Figure 10(a) shows the observed flow and the flow fromScenario B from Julian day 134 to day 140 2007 Apriland May 2007 were unusually dry with April being one ofthe driest on record at two nearby Met Eireann (Irishweather service) synoptic weather stations and belowaverage rainfall was reported in May (httpwwwmetieclimatemonthly_summarys) This resulted in a large dropin WT An analysis of the precipitation and streamflow ondays 134ndash140 shows that the observed and simulatedstreamflows from Scenario B produced two very differentrainfall runoff responses The observed streamflow showeda large peak in flow whereas the simulated Scenario Bflow showed only a small response to precipitation TheScenario B flow for Julian days 134ndash136 results in almost
Hydrol Process (2012)DOI 101002hyp
0
01
02
minus15
minus10
minus5
0
WT
Dep
th (
cm)
amp H
ourly
Rai
nfal
l (m
m)
0
1
2
Julian Days 2007
Flo
w (
m3 s
minus1 )
Flo
w (
m3 s
minus1 )
minus15
minus10
minus5
0
WT
Dep
th (
cm)
amp H
ourly
Rai
nfal
l (m
m)
340 3405 341 3415 342 3433425 3435 344
minus80
minus60
minus40
minus20
0
134 1345 135 1355 136 1365 137 1375 138
minus80
minus60
minus40
minus20
0Observed FlowScenario B Flow
Houly Rainfall
Observed FlowScenario BSimulated 2007
Hourly Rainfall
WT 2007
WT 2007
Figure 10 (a) For summer 2007 observed and modelled Scenario B flows (b) for winter 2007 observed simulated and Scenario B flows Thesimulated winter (b) and summer (a) WTs are also shown
HYDROLOGICAL RESPONSE OF AFFORESTED PEAT CATCHMENT
no flow in the stream Figure 10(b) shows that the converseoccurred between days 340 and 344 where the simulatedflow from Scenario B was higher than the observed flowAs there is a slight discrepancy between the peak flows andsimulated flows for reasons outlined earlier the simulationof the undisturbed peatland is also shown in Figure 10(b)
DISCUSSION
The comparisons of observed flows and WT depths withthe corresponding simulated values from the GEOtopmodel in the calibration and validation years show thatthe current configuration of GEOtop is capable of reliablysimulating the hydrological processes Central to thisconfiguration for the peatland is the spatial variation ofhydraulic conductivity Areas of low hydraulic conductivityat the margins near the stream are essential in maintainingthe elevated WT in the centre of the bog For the drainagescenarios once these areas of lower hydraulic conductivitywere modified by the insertion of a drainage network theWTs level in the centre of the bog fell Given that even aslight drop in WT impacts the vegetation distribution andcomposition (Sottocornola et al 2009) any disturbance ofthese relatively small areas of lower hydraulic conductivitywill likely affect a much larger area of a bogWhereas the practice of drainage prior to afforestation
of peatlands lowers the WT its depth will also be affectedby the increase in transpiration and canopy interceptionwith the change of land use from natural peatland to Sitkaspruce afforestation From Figure 9 and Table II we notethat the simulated ET increased in the mature forest(Scenario B) to 492mm greater than the pristine peatlandThe ET rate of the younger forest (Scenario A) wassimilar to the undisturbed peatland A study of ET by
Copyright copy 2012 John Wiley amp Sons Ltd
Sottocornola and Kiely (2010) at the same site found thatthe ET was not water limited and the observed ET rangedbetween 369 and 424mm with an average of 394mm ofET over a 5-year period Sottocornola and Kiely (2010)concluded that one of the key limiting factors in ET wasthe lack of vascular plants which if present wouldenhance transpiration Although Figure 9 shows that thereis a drop in the WT for Scenario A particularly in thesummer months at this stage of development of a forestthe tree canopy would not provide full cover As the WTis lower than in the undisturbed peatland the ET ratefrom the original peatland vegetation which has a largeproportion of non-vascular plants will have decreasedThus it would appear that the increase in ET under theSitka spruce canopy is offset by the decrease in ET fromthe original peatland vegetationThe estimated ET (913mm) of Scenario B of a more
mature forest was 412mm higher than Scenario A Suchincreases in ET as a result of changing peatland land usefrom grass mosses and bare peat to Sitka spruce havebeen noted by others Studies by others in areas such asthe Scottish highlands that may be considered similar insoil type and climate to our Irish study site have foundthat Sitka spruce may intercept between 28 (596mm)(Johnson 1990) and 52 (1514mm) (Heal et al 2004)of precipitation Transpiration of Sitka spruce in Cumbriahas been estimated at 12 of precipitation or 172mm(Anderson et al 1990) We note that our estimates of ETfrom Scenario B at 32 of rainfall is in the rangeof values cited in the literature Results from a study bythe Institute of Hydrology (1991) into the effects ofupland afforestation on water resources suggest that ETon a forested catchment receiving 2800mm precipitationannually was approximately 1190mm which is similar to
Hydrol Process (2012)DOI 101002hyp
C LEWIS ET AL
the ET value of 925mm in our Scenario B Other studieson afforested peatlands such as the Marcell experimentalforest in Minnesota and the Huhtisuo catchment inFinland found that ET represented a larger percentageof precipitation than values noted in this study A studyby Verry and Timmons (1982) found that ET from amature Black Spruce forest represented up to 66 of theannual precipitation with Iritz et al (1994) reporting ETvalues of 61 of precipitation in the Huhtisuo catchmentin Finland However precipitation was much lower inboth locations with the Huhtisuo catchment and Marcellforest annually receiving approximately 700 and 800mmprecipitation respectively The climate at both locationsis described as continental with streamflow tending tocease for 2ndash4months of each winter because of lowertemperatures in Marcell (Kolka et al 2001) Thedifference in climate is likely to have resulted in thedifference in simulated and observed ET values in ourstudy and that of those reported from the Huhtisuocatchment and Marcell forest In our site the averageprecipitation over a 5-year period was 2597mm with anaverage ET of 394mm representing approximately 15of precipitation The increased ET associated withafforestation in conjunction with the drainage networkresulted in a WT draw down in dry periods (Figure 9)The WT in Scenarios A and B was on average 165 and205 cm below the observed WT for the calendar year2008 This is similar to the draw down noted by Bragg(2002) where the WT in a forested peatland wasfound to be 100ndash150 cm below that in the adjacentunforested peatlandAs the runoff from peatlands in their natural state
(in Western Europe) is known to be flashy because ofsaturation excess overland flow a lowering of the WT isexpected to reduce the volume of runoff produced fromsaturation excess This is noted in the hydrograph for asummer period in Figure 10(a) which shows the observedand the simulated flows from Scenario B for Julian days134ndash140 The rain event on day 135 was preceded by adry period in April and May 2007 the end of which theWT was observed to be at its lowest level since recordsbegan in 2003 At the start of the precipitation event ofday 135 the WT of Scenario B was 698 cm lower thanthe observed WT of the pristine peatland and 592 cmbelow the drained simulation With this lower WT andreduced precipitation reaching the ground because ofcanopy interception the streamflow from the simulatedforest catchment is greatly reduced However theconverse applies for the streamflow in winter as shownin Figure 10(b) Prior to day 340 there had been frequentrain events which had resulted in a much higher WT bothin the simulated and observed cases A total of 53mm fellon day 340 resulting in a higher simulated than observedflow As the observed WT was 19 cm below the surfaceand Scenario B was just 25 cm below the surface weconsider that both simulations produced saturation excessoverland flow However the forested simulation had amore extensive drainage network that was able to conveyany surface runoff to the catchment outfall more rapidly
Copyright copy 2012 John Wiley amp Sons Ltd
resulting in a higher peak flows Such a phenomenon hasalso been noted by others with Ahti (1980) finding thatincreasing density of drainage ditches increased peakflows in a Finish peatland and model simulations by Iritzet al (1994) noting that peak flows may be increased byforest drainage when the WT is close to the surface Thestudies of Anderson et al (2000) and (Ballard et al 2011b)also drew similar conclusionsThis phenomenon of increasing the streamflow following
afforestation of peatlands may have implications inlarger catchments where afforestation may be falselyconsidered as a flood mitigation measure Likewise thereduction of flows from peatlands throughout thesummer and in particular after dry periods may be ofconcern for water resource managers
CONCLUSION
With regard to applying the hydrological GEOtop modelto an Atlantic blanket peatland we found that GEOtopwas suitable for the purposes of modelling the hydro-logical processes Central to this was the input of thespatial variation of the saturated hydraulic conductivityPeat with a lower hydraulic conductivity at the marginsresults in elevating the WT depth in the centre of the bogwhich in turn results in saturation excess overland flowduring precipitation events It is also clear from thescenario modelling that afforestation and its associateddrainage can change the hydrological response of thispristine peatland catchment Whereas the ET rates from ayoung Sitka spruce catchment were similar to the existingpristine peatland catchment a semi-mature Sitka Spruceforest resulted in an increase in ET of 492mm throughincreased transpiration from the canopy and interceptionThis increase in ET was particularly noticeable in summerand resulted in an increase in depth of the WT andreduction in streamflow However in winter followingperiods of heavy rainfall the WT depth approached thatof an unforested drained peatland This shallow WT depthin combination with a drainage network results in anincrease in peak flow in times of heavy rainfall Thissuggests that there is limited or no benefit to floodattenuation from peatland afforestation during winterperiods when the WT is high whereas the converseapplies to summer flows where the rainfall runoff wasreduced in dry periods
ACKNOWLEDGEMENTS
This study was funded by the Irish EnvironmentalProtection Agency under the Science Technology Researchand Innovation for the Environment Programme 2007ndash2013of Ireland (Soil H Interactions of soil hydrology land useand climate change and their impact on soil quality 2007-S-SL-1-S1) We would like to thank Dr Alice Wemaere of theEnvironmental Protection Agency for her continuoussupport We would also like to thank the SoilH steeringcommittee for their support advise and encouragement
Hydrol Process (2012)DOI 101002hyp
HYDROLOGICAL RESPONSE OF AFFORESTED PEAT CATCHMENT
throughout this project Prof Mark Kibblewhite Dr ArwynJones and Dr Otto Spaargaren We particularly wish tothank our present and past colleagues in the HYDROMETgroup Dr Paul Leahy Mr Nelius Foley Dr Rashid Rafiqueand Dr Michael Wellock We thank Caitriona Douglas ofNPWS and Coillte Teoranta for the permission to use thestudy site We also very much appreciate the support of thedevelopers of GEOtop in particular Prof Riccardo Rigonand Dr Matteo Dallrsquo Amico We acknowledge in particularthe earlier work of Dr Anna Laine Dr Matteo SottocornolaandDrAnn-KristinKoehler and their work and publicationsfrom the same site
REFERENCES
Abbott MB Bathurst JC Cunge JA Oconnell PE Rasmussen J 1986An introduction to the European hydrological systemmdashsystemehydrologique Europeen she 2 Structure of a physically-baseddistributed modeling system Journal of Hydrology 87(1ndash2) 61ndash77
Ahti E 1980 Ditch spacing experiments in estimating the effects ofpeatland drainage on summer runoff Proceedings of the HelsinkiSymposium Helsinki
Anderson AR Pyatt DG 1986 Interception of precipitation by Pole-StageSitka Spruce and Lodgepole Pine and Mature Sitka Spruce at KielderForest Northumberland Forestry 59(1) 29ndash38
Anderson AR Pyatt DG Stannard JP 1990 The effects of clearfelling aSitka Spruce Stand on the water-balance of a peaty gley soil atKershope Forest Cumbria Forestry 63(1) 51ndash71
Anderson AR Day R Pyatt DG 2000 Physical and hydrological impactsof blanket bog afforestation at Bad arsquo Cheo Caithness the first 5 yearsForestry 73(5) 467ndash478
Arnold JG Srinivasan R Muttiah RS Williams JR 1998 Large areahydrologic modeling and assessment Part I model developmentAmerican water resources Association 34(1) 73ndash89
Baird AJ Eades PA Surridge BWJ 2008 The hydraulic structure of araised bog and its implications for ecohydrological modelling of bogdevelopment Ecohydrology 1(4) 289ndash298 DOI 101002Eco33
Ballard CE McIntyre HS Wheater HS Holden J Wallage ZE 2011aHydrological modelling of drained blanket peatland Journal ofHydrology 407 81ndash83 http dxdoiorg101016jjhydrol201107005
Ballard CE Mclntyre N Wheater HS 2011b Effects of peatland drainagemanagement on peak flows Hydrology and Earth System Sciences 86533ndash6563 DOI 105194hessd-8-6533-2011
Bay R 1969 Runoff from small peatland watersheds Journal ofHydrology 9 90ndash102
Bertoldi G Rigon R Over TM 2006 Impact of watershed geomorphiccharacteristics on the energy and water budgets Journal of Hydro-meteorology 7(3) 389ndash403
Bertoldi G Notarnicola C Leitinger G Endrizzi S Zebisch M DellaChiesa S Tappeiner U 2010 Topographical and ecohydrologicalcontrols on land surface temperature in an alpine catchmentEcohydrology 3(2) 189ndash204 DOI 101002Eco129
Beven K Kirkby MJ 1979 A physically based variable contributing areamodel of basin hydrology Hydrological Sciences Bulletin 23 419ndash437
Black K Gallagher G Orsquo Brien P Redmond J Barrett F Twomey M2008 Dispelling myths the ture extent of recent peatland afforestationin Ireland Coford Dublin
Bragg OM 2002 Hydrology of peat-forming wetlands in ScotlandScience of the Total Environment 294(1ndash3) 111ndash129 Pii S0048-9697(02)00059-1
Burke B 1975 Effect of drainage on the hydrology of blanket-bog Irishjournal of agricultural research 14 145ndash62
Byrne KA Farrell EP 2005 The effect of afforestation on soil carbondioxide emissions in blanket peatland in Ireland Forestry 78(3)217ndash227 DOI 101093forestrycpi020
Conway VM Millar A 1969 The hydrology of some small peat-coveredcatchments in the northern Pennines Journal of the Institute of WaterEngineers 14 415ndash24
Dept of Agriculture 1996 Growing for the futuremdasha strategic plan forthe Development of the Forestry Sector in Ireland Dublin
Dunn SM Mackay R 1996 Modelling the hydrological impacts of openditch drainage Journal of Hydrology 179(1ndash4) 37ndash66
Copyright copy 2012 John Wiley amp Sons Ltd
Eaton J McGoff N Byrne K Leahy P Kiely G 2008 Land cover changeand soil organic carbon stocks in the Republic of Ireland 1851ndash2000Climatic Change 91(3ndash4) 317ndash334 DOI 101007s10584-008-9412-2
Frolking S Roulet NT 2007 Holocene radiative forcing impact ofnorthern peatland carbon accumulation and methane emissions GlobalChange Biology 13(5) 1079ndash1088 DOI 101111j1365-2486200701339x
van Genuchten MT 1980 A closed-form equation for predicting thehydraulic conductivity of unsaturated soils Soil Science Society ofAmerica Journal 44(5) 892ndash898
Hargreaves KJ Milne R Cannell MGR 2003 Carbon balance ofafforested peatland in Scotland Forestry 76(3) 299ndash317
Heal KV Stidson RT Dickey CA Cape JN Heal MR 2004 New data forwater losses from mature Sitka spruce plantations in temperate uplandcatchments Hydrological Sciences Journal 49(3) 477ndash493
Hoag RS Price JS 1995 A field-scale natural gradient solute transportexperiment in peat at a Newfoundland blanket bog Journal ofHydrology 172(1ndash4) 171ndash184
Hogan JM van der Kamp G Barbour SL Schmidt R 2006 Fieldmethods for measuring hydraulic properties of peat deposits Hydro-logical Processes 20(17) 3635ndash3649 DOI 101002Hyp6379
Holden J 2005 Peatland hydrology and carbon release why small-scaleprocess matters Philosophical Transactions of the Royal Societya-Mathematical Physical and Engineering Sciences 363(1837)2891ndash2913 DOI 101098rsta20051671
Holden J Burt TP 2002 Infiltration runoff and sediment production inblanket peat catchments implications of field rainfall simulationexperiments Hydrological Processes 16(13) 2537ndash2557 DOI101002Hyp1014
Holden J Burt TP 2003 Hydraulic conductivity in upland blanketpeat measurement and variability Hydrological Processes 17(6)1227ndash1237 DOI 101002Hyp1182
Holden J Chapman PJ Labadz JC 2004 Artificial drainage of peatlandshydrological and hydrochemical process and wetland restorationProgress in Physical Geography 28(1) 95ndash123
Holden J Evans MG Burt TP Horton M 2006 Impact of land drainageon peatland hydrology Journal of Environmental Quality 35(5)1764ndash1778
Holden J Wallage ZE Lane SN McDonald AT 2011 Water tabledynamics in undisturbed drained and restored blanket peat Journal ofHydrology 402(1ndash2) 103ndash114 DOI 101016jjhydrol201103010
Horgan T Keane M McCarthy R Lally M Thompson D 2004 A Guide toForest Tree Species Selection and Silviculture in Ireland Coford Dublin
Hudson JA Gilman K Calder IR 1997 Land use and water issues in theuplands with reference to the Plynlimon study Hydrology and EarthSystem Sciences 1(3) 239ndash397
Institute of Hydrology 1991 Effects of upland afforestation on waterresources the Balquhidder experiment 1981ndash1991 Report no 116Institute of Hydrology Wallingford UK
Iritz L Johansson B Lundin L 1994 Impacts of forest drainage on floodsHydrological Sciences Journal 39(6) 637ndash661
Johnson RC 1990 The interception throughfall and stemflow in a forestin Highland Scotland and the comparison with other upland forests inthe UK Journal of Hydrology 118(1ndash4) 281ndash287
Koehler AK Murphy K Kiely G Sottocornola M 2009 Seasonalvariation of DOC concentration and annual loss of DOC from anAtlantic blanket bog in South Western Ireland Biogeochemistry 95231ndash242 DOI 101007s10533-009-9333-9
Koehler AK Sottocornola M Kiely G 2011 How strong is the currentcarbon sequestration of an Atlantic blanket bog Global ChangeBiology 17(1) 309ndash319 DOI 101111j1365-2486201002180x
Kolka RK Griagal DF Nater EA Verry ES 2001 Hydrologic cycling ofmercury and organic carbon in a forested upland-bog watershed SoilScience Society 65 897ndash905
Lafleur PM Hember RA Admiral SW Roulet NT 2005 Annual andseasonal variability in evapotranspiration and water table at a shrub-covered bog in southern Ontario Canada Hydrological Processes19(18) 3533ndash3550
Laine A Byrne KA Kiely G Tuittila ES 2007 Patterns in vegetationand CO2 dynamics along a water level gradient in a lowland blanketbog Ecosystems 10(6) 890ndash905 DOI 101007s10021-007-9067-2
Lane SN Brookes CJ Kirkby AJ Holden J 2004 A network-indexbasedversion of TOPMODEL for use with high-resolution digital topographicdata Hydrological Processes 18(1) 191ndash201
Lapen DR Price JS Gilbert R 2005 Modelling two-dimensional steady-state groundwater flow and flow sensitivity to boundary conditions inblanket peat complexes Hydrological Processes 19(2) 371ndash386 DOI101002Hyp1507
Hydrol Process (2012)DOI 101002hyp
C LEWIS ET AL
Lees JC 1972 Soil aeration and Sitka Spruce seedling growth in peatJournal of Ecology 60(2) 343ndash349
Letts MG Roulet N Comer NT 2000 Parameterization of peatlandhydraulic properties for the Canadian land surface scheme CanadianMeterological and Oceanographic Society 38 141ndash160
Lewis C Albertson J Xu X Kiely G 2011 Spatial variability of hydraulicconductivity and bulk density along a blanket peatland hillslopeHydrological Processes 26 1527ndash1537 DOI 101002hyp8252
Limpens J Berendse F Blodau C Canadell JG Freeman C Holden JRoulet N Rydin H Schaepman-Strub G 2008 Peatlands and thecarbon cycle from local processes to global implicationsmdasha synthesisBiogeosciences 5(5) 1475ndash1491
Nash JE Sutcliffe JV 1970 River flow forecasting through conceptualmodels part Imdasha discussion of principles Journal of Hydrology 10(3)282ndash290
NFI 2007 National Forest InventorymdashRepublic of IrelandmdashResultsJohnstown Castle Estate Co Wexford Ireland
Nilsson M Sagerfors J Buffam I Laudon H Eriksson T Grelle AKlemedtsson L Weslien P Lindroth A 2008 Contemporary carbonaccumulation in a boreal oligotrophic minerogenic miremdasha significantsink after accounting for all C-fluxes Global Change Biology 14(10)2317ndash2332 DOI 101111j1365-2486200801654x
Oechel WC Vourlitis GL Hastings SJ Zulueta RC Hinzman L Kane D2000 Acclimation of ecosystem CO2 exchange in the Alaskan Arctic inresponse to decadal climate warming Nature 406(6799) 978ndash981
Pilcher JR Mac an tSaoir S 1995 Wood Trees Forests in Ireland RoyalIrish Academy Dublin
Prevost M Belleau P Plamondon AP 1997 Substrate conditions in atreed peatland responses to drainage Ecoscience 4(4) 543ndash554
Price JS Branfireun BA Waddington JM Devito KJ 2005 Advancesin Canadian wetland hydrology 1999ndash2003 Hydrological Processes19(1) 201ndash214 DOI 101002Hyp5774
Ramchunder SJ Brown LE Holden J 2007 Environmental effects ofdrainage drain-blocking and prescribed vegetation burning in UKupland peatlands Progress in Physical Geography 2009(33) 49 DOI1011770309133309105245
Copyright copy 2012 John Wiley amp Sons Ltd
Reggiani P Sivapalan M Hassanizadeh SM 2000 Conservationequations governing hillslope responses exploring the physical basisof water balance Water Resources Research 36(7) 1845ndash1863
Rigon R Bertoldi G Over TM 2006 GEOtop a distributed hydrologicalmodel with coupled water and energy budgets Journal of Hydro-meteorology 7(3) 371ndash388
Robinson M 1986 Changes in catchment runoff following drainage andafforestation Journal of Hydrology 86(1ndash2) 71ndash84
Simoni S Zanotti F Bertoldi G Rigon R 2008 Modelling the probabilityof occurrence of shallow landslides and channelized debris flows usingGEOtop-FS Hydrological Processes 22(4) 532ndash545 DOI 101002Hyp6886
Sottocornola M Kiely G 2010 Energy fluxes and evaporationmechanisms in an Atlantic blanket bog in southwestern Ireland WaterResources Research 46 DOI 1010292010WR009078
Sottocornola M Laine A Kiely G Byrne KA Tuittila ES 2009Vegetation and environmental variation in an Atlantic blanket bog insouthwestern Ireland Plant Ecology 203(1) 69ndash81 DOI 101007s11258-008-9510-2
Strack M Waddington JM Rochefort L Tuittila ES 2006 Response ofvegetation and net ecosystem carbon dioxide exchange at different peatlandmicroforms following water table drawdown Journal of GeophysicalResearch-Biogeosciences 111(G2) DOI 1010292005jg000145
Tobin B Black K Osborne B Reidy B Bolger T Nieuwenhuis M 2006Assessment of allometric algorithms for estimating leaf biomass leafarea index and litter fall in different-aged Sitka spruce forests Forestry79(4) 453ndash465 DOI 101093forestrycpl030
Verry ES Timmons DR 1982 Waterborne nutrient flow through anupland-peatland watershed in Minnesota Ecology 65(5) 1456ndash1467
Waldron S Flowers H Arlaud C Bryant C McFarlane S 2009 Thesignificance of organic carbon and nutrient export from peatland-dominated landscapes subject to disturbance a stoichiometric perspectiveBiogeosciences 6(3) 363ndash374
Zanotti F Endrizzi S Bertoldi G Rigon R 2004 The GEOTOP snowmodule Hydrological Processes 18(18) 3667ndash3679 DOI 101002Hyp5794
Hydrol Process (2012)DOI 101002hyp
C LEWIS ET AL
Irish weather conditions (Horgan et al 2004) its rootdevelopment when planted on peat soils is limited to theaerated top section of the peat profile (Lees 1972)Peatlands and particularly blanket peats in Ireland areenvironments with the water table (WT) at or close tothe surface for long periods of the year (Iritz et al 1994Bragg 2002 Holden and Burt 2002 Hogan et al 2006Laine et al 2007) Sottocornola and Kiely (2010) foundthat in a pristine blanket peatland in southwest Ireland thedaily averaged WT never fell further than 16 cm belowthe bog surface for the period 2002ndash2010 This is incontrast to blanket peatlands in places such as Canadawhere the WT falls as much as 60 cm below the surfaceThis makes Irish peatlands unsuitable for afforestation intheir natural undrained (high WT) condition which canresult in stunted root development and vulnerability towind throwFor afforestation purposes peatlands are typically
drained prior to planting with drainage normally beingcarried out using a combination of closely spaced ploughfurrows and deep (05ndash20m) but more widely spacedditches (Holden et al 2004) Frequently this results in achange in streamflow both in the short term while thedrains are active and in the long term when the forestbecomes established (Holden et al 2004) These drainsalthough beneficial for the development of the foresthave also been linked with higher peak streamflows(Robinson 1986) In an early study by Burke (1975) thestreamflow rainfall ratio from an undrained peatlandin Glenamoy Ireland was 234 compared with 792from a drained catchment Conway and Millar (1969)found that artificially drained peats produced rapidstreamflow in the north Pennines (UK) Ahti (1980)found that the flood peak increased after drainage inScandinavian peatlands However investigations byHolden et al (2006) in the same peatlands as the Conwayand Millar (1969) study found that overland flow wasgreatly reduced following drainage whereas subsurfaceflow was greatly increased within the Moor Houseblanket peatlands Investigations by Iritz et al (1994)on a selection of forested Scandinavian peatland catch-ments found that peak flows decreased followingdrainage Prevost et al (1997) reported an increase instream base flow following drainage in a Canadianpeatland Although there have been conflicting conclu-sions drawn from different international studies this islikely due to limited data and the diversity of groundconditions (eg natural variation of WT depth) which isseen as critical to the amount of storage available andsurface runoff production in peatlands (Holden et al2006) Furthermore the type of drainage will impact thedegree of change in hydrology Deep closely spaceddrains cause a peat catchment to respond differently toshallow widely spaced drains Holden et al (2011)observed that in an intact blanket bog in OughtershawMoss in northern England whereas the seasonal range ofWT depth was 0ndash20 cm the spatially weighted mean WTdepth was only 58 cm In the same bog they found for adrained section that whereas the depth of the seasonal WT
Copyright copy 2012 John Wiley amp Sons Ltd
ranged from 0 to 40 cm the spatially weighted mean WTdepth was 115 cm The natural WT depth varies fromlows of ~10 cm in Irish blanket peatlands to highs of~60 cm in Canadian and Scandinavian blanket peatlands(Koehler et al 2011) Whereas drainage always precedesblanket peat afforestation in Ireland this is not necessarilyso in Canada and ScandinaviaThe rainfall runoff response of a peatland catchment
changes once it becomes afforested (Hudson et al 1997Anderson et al 2000 Heal et al 2004) Drainage (WTlowering) peat shrinkage and compression tree canopyinterception and evapotranspiration (ET) all contribute toa changed hydrological (and hydrochemical) regime of apeatland when afforested (Institute of Hydrology 1991Iritz et al 1994 Holden et al 2004 Ballard et al2011b) Anderson et al (2000) in a study investigatingthe effects of blanket bog afforestation on the physicalproperties of the peat soil and on the quantity and timingof runoff found a reduction of 7 in streamflow afterafforestation in a Scottish peatland relative to an unforesteddrained control They noted that the reduction in streamflowwas predominantly in the spring and summer possiblelinked with higher ET from the forest canopy Comparedwith the drained control peak flows were increased byafforestation whereas the baseflow component of the totalflow was reducedOne of the major contributing factors in changing the
rainfall runoff response of an afforested peatland is thechange in interception losses ET from a pristine blanketpeatland in southwest Ireland was observed over 5 yearsto be 155 of the total precipitation representing anannual average of 394mm (Sottocornola and Kiely 2010)However many studies reported far greater interceptionlosses in afforested peatlands Studies in areas that may beconsidered to have similar climates to south west Irelandsuch as the Heal et al (2004) study in Scotland found thethat interception losses in a Sitka spruce forestedpeatland were reported to be greater than 50 of theannual precipitation An investigation by the Institute ofHydrology (1991) into the water resources of two uplandcatchments also in Scotland found significant interceptionlosses amounting to 38 of the precipitation Andersonet al (1990) in UK afforested peatland reported 38canopy interception and 12 transpiration loss in UKafforested peatland Johnson (1990) found that in a50-year-old Sitka spruce forest in the Scottish highlandson peat and peaty gley soils the average interceptionover a 3-year period was 28 with the greatestinterception occurring in the summer months and theleast in winter A 25-year-old Sitka spruce forest ona peaty gley soil in Northumberland UK was observedto have an average interception loss of 48 of theprecipitation (Anderson and Pyatt 1986) These studiesdemonstrate that ET increases and stream runoffdecreases after afforestation of peatlands (Table I) Areview by Hudson et al (1997) of the studies carried outon a number of catchments including the Plynlimon andLanbrynmair catchments in Wales concluded thatafforested upland catchments (on a mixture of Peaty
Hydrol Process (2012)DOI 101002hyp
Table
IA
numberof
water
table(W
T)depthsstream
flow
sandevapotranspiratio
nvalues
from
literature
Ecosystem
Location
Notes
Average
annual
precipitatio
n(m
m)
Annualevapotranspiratio
n(m
m)
Average
WT
depth(cm)
Average
stream
flow
(mm)
Reference
Borealraised
bog
Canada
5yearsdata
910
351
gt025
(variesconsiderably)
560
(Lafleuret
al2005)
Mire
Sweden
2yearsdata
683
238
10445
(Nilssonet
al2008)
Blanket
peatland
Ireland
pristin
e2003ndash2
007
2597
394
4~2
000
(SottocornolaandKiely2010)
Blanket
peatland
Scotland
Drained
peatland
943
362
12581
(Andersonet
al2000)
Afforestedpeatland
Scotland
Sitk
aspruce
5yearsold
943
401
19541
(Andersonet
al2000)
Afforestedpeatland
Scotland
Sitk
aspruce
50yearsold
2130
597
ndash1533
(Johnson1990)
Afforestedpeatland
Scotland
Sitk
aspruce
37yearsold
2912
1375
ndash1726
(Healet
al2004)
HYDROLOGICAL RESPONSE OF AFFORESTED PEAT CATCHMENT
Copyright copy 2012 John Wiley amp Sons Ltd
Gleys Brown Earths and Podzols soils) had higher ETthan similar grassland covered catchments It was furthernoted by Hudson et al (1997) that in the wet windyclimate of the British uplands 15ndash20 of rainfall islost by transpiration from grasslands whereas 30ndash40is lost from forested areasPeatlands can serve as important regulators of river
flow and hydrochemistry (Koehler et al 2011) becauseof their location and high precipitation Many rivers(at least in Ireland Scotland and Wales) rise in areas ofupland blanket peat with high precipitation (because ofelevation) In upland blanket peatlands where the WT isperennially close to the surface (as occurs in north westEurope) flash floods occur because there is very littlestorage potential in the peat (Bay 1969 Bragg 2002Holden and Burt 2002 Holden and Burt 2003 Bairdet al 2008 Lewis et al 2011) A recent concept (Lapenet al 2005) suggests that a layer of lower hydraulicconductivity at the margins of peatlands is responsible formaintaining higher WTs in the centre of the bog Recentfield tests by (Baird et al 2008) on a raised bog andLewis et al (2011) on a blanket bog support this ideaHowever to the authorsrsquo knowledge this spatial variationof hydraulic conductivity has yet to be incorporated intohydrological modelsAlthough there are several hydrological models capable
of simulations on mineral soils (Beven and Kirkby 1979Abbott et al 1986 Arnold et al 1998 Reggiani et al2000) the same cannot be said for peat soils as manyhydrological models are not well suited to wetlands (Priceet al 2005) A model parameterization for Canadianpeatlands was developed by Letts et al (2000) for a soilvegetation atmosphere transfer scheme SHETRAN wasemployed by Dunn and Mackay (1996) to investigatehow peatlands are affected by ditches Lane et al (2004)modified TOPMODEL (Beven and Kirkby 1979) for usewith Digital Elevation Models of high resolution as thesehigh resolution models can lead to many saturated areasthat are unconnected to the drainage network Lane et al(2004) also noted that TOPMODEL may not accuratelyrepresent the lateral movement of water in soils oflow hydraulic conductivity into open drains Morerecently Ballard et al (2011a) developed a simplifiedphysics-based model to investigate flow andWT responsesto different drainage scenarios The model was foundto perform well under wet conditions capturing thepeak flows well with a poorer performance under drierconditionsThe general objective of this study was to use a 2-year
hydrological data set at a blanket peatland catchment anda process-based rainfall runoff model to explore thehydrological response if the peatland were to be drainedand afforested Specifically the aims were (1) to calibrateand validate the hydrologic rainfall runoff model GEO-top for a small scale blanket peatland catchment insouthwest Ireland by using 2 years of observations (2)to investigate the catchment hydrological response forthe scenario of a drained pre-afforested conditionwith a 50-cm WT lowering and (3) two afforestation
Hydrol Process (2012)DOI 101002hyp
C LEWIS ET AL
scenarios A a 10-year-old Sitka spruce afforestationsimulation and B a 15-year-old Sitka spruce afforestationsimulation
MATERIALS AND METHODS
Site description
The study site is a pristine Atlantic blanket bog nearGlencar in County Kerry southwest Ireland (latitude5158N longitude 954W) at an elevation of approximately150m (Figure 1) and is typical of Atlantic blanket bogs inthe coastal regions of northwest Europe in terms of bothvegetation and water chemistry (Sottocornola et al 2009)The study site is part of a larger pristine bog ofapproximately 121 km2 A small stream (~1m wide) runsthrough the centre of the bog and drains approximately76 ha 85 of which is intact blanket bog (see Figure 1)The surface of the bog is a mosaic of microforms that
differ in relative altitude plant composition andWT depthFour vegetation microform classes were distinguished inrelation to their difference in WT level hummocks highlawns low lawns and hollows that cover 6 62 21and 11 of the study site respectively (Laine et al 2007Sottocornola et al 2009) Vascular plants cover about30 of the study site area with the most common species
Figure 1 Peatland catchm
Copyright copy 2012 John Wiley amp Sons Ltd
being Molinia caerulea (purple moorgrass) and Callunavulgaris (common heather) About 25 of the bog surfaceis covered by bryophytes with the dominant species being abrownmoss Racomitrium lanuginosum The vegetation ofthe study site has been described in detail by Sottocornolaet al (2009)
Site instrumentation
At the outfall of the 76-ha catchment (Figure 1) thestream height was recorded every 30min by using apressure transducer (1830 Series Druck Limited UK)Stream height was converted to discharge by using arating curve (Equation 1) built up from stream height andstream velocity measurements taken over 2 years
Q frac14 06946 h 008071eth THORN1441r2 frac14 09986RMSE frac14 0005
(1)
where Q is the instantaneous discharge in m3 s1 and h isstream height in m The rating curve was established frommanual measurements of instantaneous discharge carriedout at a range of stream heights by using an OTT currentmetre (OTT Messtechnik GmbH amp Co KG Germany)The meteorological station (Figure 1) was established
in 2002 and includes two tipping bucket rain gauges(an ARG100 Environmental Measurements Ltd UK and
ent and location map
Hydrol Process (2012)DOI 101002hyp
HYDROLOGICAL RESPONSE OF AFFORESTED PEAT CATCHMENT
an Obsermet OMC-200 Observator BV The Netherlands)and a WT level recorder that consists of a pressuretransducer (PCDR1830 Campbell Scientific UK) placedinside a metal well pierced all along its height Wind speedwas recorded with a 2D sonic anemometer (WindSonicGill UK) Air temperature and relative humidity weremeasured at 2-m height with a shielded probe (HMP45CVaisala Finland) whereas atmospheric pressure wasrecorded with a barometer (PTB101B Vaisala Finland)An eddy covariance system for CO2 fluxes was alsolocated on the same tower It consisted of a 3D sonicanemometer (Model 81000 RM Young Company USA)and an open-path infrared gas analyzer for H2O and CO2
concentrations (LI-7500 LI-COR USA) mounted 3mabove the vegetation
Climate
Sottocornola and Kiely (2010) at the same site foundthat the range of annual rainfall (2002ndash2009) was2236ndash3365mm with an annual average of 2597mm Theannual ET (estimated using eddy covariance methods)ranged from 369 to 424mm with an annual average of394mm From2002 to 2009 therewas an annual average of208 wet days (gt1mmday1) (Koehler et al 2009) Theaverage annual air temperature was 105 CThe recorded flow at the stream outfall (see Figure 1)
ranged between 0015 and 100 l s1 ha1 (Koehler et al2009) with the 95 percentile flow exceeding 0037 l s1
ha1 The flow was observed to be flashy with over 90
of the streamflow sourced from surface runoff (Lewiset al 2011) This is due to a perennially high WT thatwas observed continuously over the 7 years 2002ndash2009to be within 17 cm of the land surface (with the 7-yearmean WT at ~4 cm below the surface) at the eddycovariancemeteorological station Although additionalWT observation stations would be beneficial the site iswell known to the authorsrsquo through frequent site visitsand it is considered that the WT measurements arerepresentative of the peatland A manual WT observationstation was established in 2009 near the stream and theWT was found to vary between 0 and 10 cm below thesurface Observations were taken approximately sixndasheighttimes a year particularly during dry periods Lewis et al(2011) investigated the spatial variation of bulk densityand saturated hydraulic conductivity at the same site andfound that at the surface (top 10 cm) saturated horizontalhydraulic conductivity was lowest at the bog margin nearthe stream (~107m s1) and increased at the bog interior(~105m s1) The converse was found for bulk densitywhich ranged from ~011 g cm3 at the bog marginto ~ 0055 g cm3 near the bog interior
Process-based hydrological model ndash GEOtop
The process-based hydrological model GEOtop (Rigonet al 2006) was used in this study It is a distributedhydrological model (operating on a 8m 8m grid) andsimulates the complete hydrological balance in acontinuous way during a whole year (at a temporal
Copyright copy 2012 John Wiley amp Sons Ltd
increment of 60min) It uses geospatial data (eg topographysoil type vertical and horizontal hydraulic conductivitydepth and the Van Genuchten parameters a and n(van Genuchten 1980)) vegetation cover (including cropheight Leaf Area Index (LAI) and root depth) and landcover It provides spatially distributed output fields aswell as routing water and sediment flows through streamand river networksGEOtop includes a rigorous treatment of the core
hydrological processes (eg unsaturated and saturated flowand transport surface energy balances and streamflowgenerationrouting) Unsaturated dynamics are treated witha 3D integration of Richardsrsquo equation whereas surfacerunoff is routed via a kinematic wave The spacendashtimefields of radiation that drive the evaporative processesaccount for terrain effects such as aspect slope andshading The energy processes in GEOtop have beenextensively tested and validated (Bertoldi et al 2006)Using GEOtop in an alpine catchment Bertoldi et al(2010) showed that the major factors controlling the landsurface temperature in a humid climate were incomingsolar radiation and land cover variability Others have alsotaken the GEOtop model and added further modules to itincluding a snow module by Zanotti et al (2004) and alandside probability function by Simoni et al (2008)The hourly meteorological data required (precipitation
atmospheric pressure temperature global shortwave radi-ation relative humidity and wind speed and direction) byGEOtop were available from the on site meteorologicaltower A field measurement study by Lewis et al (2011) atthe same site found that the saturated horizontal hydraulicconductivity in the riparian zone within 10m of the streamwas ~107 m s1 which was one to two orders ofmagnitude less conductive than the bog interior Thesaturated horizontal conductivity was found to beapproximately twice vertical hydraulic conductivity Toreflect this pattern in the soil matrix in GEOtop the peatwithin 10m of the stream was assigned the hydraulicparameters found by Lewis et al (2011) in the riparianzone A second zone was created between 10 and 20mfrom the stream and the peat in this zone was assigned ahigher hydraulic conductivity value An incrementalprocess of increasing the hydraulic conductivity wasutilized until at the bog interior the saturated hydraulicconductivity assigned was ~105 m s1 Vegetationdetails (LAI height and root depth) were adopted fromSottocornola et al (2009) and Laine et al (2007)
Modelling scenarios
To reflect the practice of draining peatland prior toafforestation an artificial drainage network was simulatedfor this GEOtop application This consisted of a series ofditches placed 8m apart and 350mm deep The ditchesran orthogonal to the contours and drained into the streamrunning through the centre of the bog Initial trials of thisnew drainage network found however that there waslittle change in the WT Peatland drains have been found tolower the WT adjacent to the drains specifically downslope
Hydrol Process (2012)DOI 101002hyp
C LEWIS ET AL
of drains as the drains intercept the surface runoff fromupslope areas (Holden et al 2006) Because of modelconstraints it was not possible to increase the drainagenetwork density to achieve a realistic WT drawdown Itwas therefore decided to increase the horizontalconductivity of the peatland to represent the changedtravel time for water from the peat matrix to the drainagenetwork that a peatland with a higher density of drainswould have However it must also be noted that thisincrease in horizontal conductivity is also likely toreflect the increase in hydraulic conductivity caused bychanges in soil structure associated with WT drawdown(Ramchunder et al 2007)Two possible land use change scenarios were simulated
in this study changing the land use from natural peatlandto a 10-year-old (Scenatio A) and a 15-year-old (ScenarioB ) Sitka spruce forest The LAI was adopted from Tobinet al (2006) in a study on LAI in different ages ofSitka spruce forests in Ireland Sitka spruce forests atapproximately 15 years of age have the highest LAI and
0 50 100 150 200 250 300 3500
05
1
15
2
Julian Day 2007
Flo
w (
m s
minus1 )
Observed FlowSimulated Flow
Figure 2 Observed and simulated flows for 2007 at hourly intervals
0 100 200 3000
500
1000
1500
2000
2500
Julian Days
Flo
w (
mm
)
RainfallObserved FlowSimulated Flow
(a)
Figure 3 For 2007 (a) cumulative rainfall observed flow and simulatesimulated
Copyright copy 2012 John Wiley amp Sons Ltd
therefore deemed to have the largest impact on the rainfallrunoff response mainly from increased interception andtranspiration The changes to the model for Scenario Awere made by increasing the LAI to 45 root depth to40 cm and canopy height to 250 cm For Scenario B theLAI root depth and canopy height were increased to 7555 and 800 cm respectively Along with the change inland use both of these scenarios also included a newdrainage network to reflect the practice of drainingpeatlands prior to afforestation
RESULTS
The model was calibrated using observed data for 2007Figure 2 shows the time series of observed and GEOtopmodelled flows with in a NashndashSutcliffe (Nash andSutcliffe 1970) efficiency of 087 The difference betweenobserved and simulated flows is greatest in times of highflows where the simulated flow is larger than the observedHowever at times of high flow the observed flows may beunderestimated as flow spills overbank and no streamflowmeasurements were recorded for overbank flow (becauseof safety reasons) The cumulative rainfall (2229mm)observed streamflow (1925mm) and simulated streamflow(2018 mm) are shown in Figure 3(a) The modelled ET of~211mm for 2007 is lower than both the observed value of304mm and the nearby eddy covariance estimate of ETof 388mm for the hydrological year 20062007 reportedby Sottocornola and Kiely (2010) Monthly totals ofsimulated flow compare well with observed values(Figure 3(b)) as do the instantaneous values of simulatedand observed flows (Figure 3(c)) with the exception ofthe very highest flows We believe this is due to theoverbank flow for which our high observed flows arelikely to be underestimated
JanFebMarArpMayJun Jul AugSepOctNovDec0
1
2
3
4x 10
5
Flo
w (
m3 )
0 05 1 150
05
1
15
Observed flows (m3 sminus1)
Sim
ulat
ed fl
ows
(m3
sminus1 )
Observed FlowSimulated Flow
R2= 091
(b)
(c)
d flow (b) monthly observed and simulated flows (c) observed andflows
Hydrol Process (2012)DOI 101002hyp
HYDROLOGICAL RESPONSE OF AFFORESTED PEAT CATCHMENT
The observed and simulated WT depths are shown inFigure 4 The model simulates WT over the full extent ofthe bog and will be somewhat different to the observedWT which was from one WT sensor point Examining
0 50 100 150 200 250 300 350
0
Dep
th o
f wat
er ta
ble
belo
w s
urfa
ce (
cm)
minus30
minus25
minus20
minus15
minus10
minus5
minus100
minus50
0
Julian Day 2007D
aily
Rai
nfal
l (m
m)
Observed WTSimulated WTDaily Rainfall
Figure 4 For 2007 daily rainfall (top) observed and simulated water table
0 100 200 3000
500
1000
1500
2000
2500
3000
Julian Days
Flo
w (
mm
)
RainfallObserved FlowSimulated Flow
(a)
Figure 6 For 2008 (a) cumulative rainfall observed flow and simulated flow
0 50 100 150 200 250 300 3500
02
04
06
08
1
12
14
Julian Day 2008
Flo
w (
m s
minus1 )
Observed FlowSimulated Flow
Figure 5 Observed and simulated flows for 2008 at hourly intervals
Copyright copy 2012 John Wiley amp Sons Ltd
Figure 4 for 2007 we note that the time series trends ofboth observed and simulated WTs agree even thoughthe absolute values are somewhat different For theinstantaneous WT (Figure 4) the range is larger for thesimulated WT but again not hugely different The annualmean observed WT (Figure 4) was 387 cm below thesurface compared with the simulated WT of 485 cmThis WT difference is under 1 cm From Figures 2ndash4 wesuggest that GEOtop simulates well the hydrologicalprocess in the peatland for the calibration yearOnce the model was calibrated for 2007 it was then
validated (no change to parameters) for 2008 Figures 5ndash7and Table II show the results of the 2008 simulation TheNashndashSutcliffe efficiency of 089 for 2008 showed aslight improvement on the 2007 value of 087 whereasthe simulated flow was slightly greater than the observedflow (Figure 6) The simulated WT had an annual meanvalue of 29 cm below the surface whereas the observed
JanFebMarArpMayJun Jul AugSepOctNovDec0
1
2
3
4x 10
5
Flo
w (
m3 )
Observed FlowSimulated Flow
0 05 1 150
05
1
15
Recorded Flows (m3 sminus1)
Sim
ulat
ed F
low
s m
3 sminus
1
R2= 092
(c)
(b)
(b) monthly observed and simulated flows (c) observed and simulated flows
Dep
th o
f wat
er ta
ble
belo
w s
urfa
ce (
cm)
minus25
minus20
minus15
minus10
minus5
0
0 50 100 150 200 250 300 350
minus100
minus50
0
Julian Day 2008
Dai
ly R
ainf
all (
mm
)
Observed WTSimulated WTDaily Rainfall
Figure 7 For 2008 daily rainfall (top) observed and simulated watertable depth
Hydrol Process (2012)DOI 101002hyp
Table II Observed and modelled scenarios rainfall evapotranspiration and streamflow values
Scenario Year Rainfall (mm) Evapotranspiration (mm) Streamflow (mm) Streamflowrainfall ratio
Observed 2007 2229 304 1925 075Calibrated model 2007 2229 211 2018 082Observed 2008 2826 421 2405 085Validated model 2008 2826 330 2496 088Scenario A 2008 2826 501 2325 083Scenario B 2008 2826 913 1913 067
0 50 100 150 200 250 300 350minus70
minus60
minus50
minus40
minus30
minus20
minus10
0
10
Julian Day 2008
Dep
th o
f wat
er ta
ble
belo
w s
urfa
ce(c
m)
Observed WTDrained PeatlandScenario AScenario B
Figure 8 For 2008 water table for observed drained peat Scenario Aand Scenario B
0 50 100 150 200 250 300 3500
500
1000
1500
2000
2500
3000
Julian Day 2008
Flo
w m
3 sminus
1
Rainfall (1)Observed flow (2)Scenario A (3)Scenario B (4)
(3)
(4)
(1)
(2)
Figure 9 Cumulative rainfall observed flow simulated flow ScenarioA and Scenario B flows
C LEWIS ET AL
WT had an annual mean depth of 35 cm below thesurface for 2008 These figures show that GEOtopprovides a similar level of accuracy for the validationyear 2008 as it did for the calibration year 2007 Fromthis we suggest that the current configuration of GEOtopsimulates well the hydrological processes in the Glencarblanket peatland and that we are able to proceed with astudy of land use change scenariosThe overall goal of this project is to study the change
in hydrological response of peatland when land use ischanged from its natural state to forestry It is not possibleto do this by simply changing the land use in the modelas in practice peatlands are drained prior to planting(Holden et al 2004) To reflect this the drainage networkin the model was modified and a series of new networkdrains was inserted into the model The model was thenrun again for the 2 years 2007 and 2008 with land usechange Scenarios A and B Although the model was runfor 2 years the cumulative flow and ET values are shownin Figure 9 for 2008 only after allowing the model to spinup for the first 3months of 2007The changes in WT due to the drainage and land use
change scenarios are shown in Figure 8 The simulateddrained peatland showed a drop in WT particularly in thesummer months with the annual mean drained WT150 cm below the surface and 115 cm below theobserved WT The annual mean observed WT depth for2008 was 35 cm below the surface whereas with meansimulated WT depths for scenarios A and B were 120and 240 cm respectively (see Figure 8)The cumulative rainfall (2826mm) observed flow
(2405mm) and simulated flows (2325 for Scenario A and1913mm for Scenario B) for 2008 are shown in Figure 9From this we estimate that ET from the peatland is~420mm in 2008 which is similar to the highest value(424mm) of the eddy covariance estimated ET reportedby Sottocornola and Kiely (2010) in the period 2002ndash2007Scenario A showed very little change in ET from theundisturbed peatland whereas the ET for Scenario B was925mm an increase of 492mm when compared with theobserved ET in 2008 The total annual simulatedstreamflow for Scenarios A and B were reduced to 96and 80 respectively of the observed flow A comparisonof the streamflow between the observed flow and ScenarioB did not show that Scenario B was consistently reducedby 80 It showed rather that Scenario B had at differenttimes of the year both higher (typically in winter) andlower streamflows (typically summer) than the observed
Copyright copy 2012 John Wiley amp Sons Ltd
streamflow This is illustrated in Figure 10(a) and (b)Figure 10(a) shows the observed flow and the flow fromScenario B from Julian day 134 to day 140 2007 Apriland May 2007 were unusually dry with April being one ofthe driest on record at two nearby Met Eireann (Irishweather service) synoptic weather stations and belowaverage rainfall was reported in May (httpwwwmetieclimatemonthly_summarys) This resulted in a large dropin WT An analysis of the precipitation and streamflow ondays 134ndash140 shows that the observed and simulatedstreamflows from Scenario B produced two very differentrainfall runoff responses The observed streamflow showeda large peak in flow whereas the simulated Scenario Bflow showed only a small response to precipitation TheScenario B flow for Julian days 134ndash136 results in almost
Hydrol Process (2012)DOI 101002hyp
0
01
02
minus15
minus10
minus5
0
WT
Dep
th (
cm)
amp H
ourly
Rai
nfal
l (m
m)
0
1
2
Julian Days 2007
Flo
w (
m3 s
minus1 )
Flo
w (
m3 s
minus1 )
minus15
minus10
minus5
0
WT
Dep
th (
cm)
amp H
ourly
Rai
nfal
l (m
m)
340 3405 341 3415 342 3433425 3435 344
minus80
minus60
minus40
minus20
0
134 1345 135 1355 136 1365 137 1375 138
minus80
minus60
minus40
minus20
0Observed FlowScenario B Flow
Houly Rainfall
Observed FlowScenario BSimulated 2007
Hourly Rainfall
WT 2007
WT 2007
Figure 10 (a) For summer 2007 observed and modelled Scenario B flows (b) for winter 2007 observed simulated and Scenario B flows Thesimulated winter (b) and summer (a) WTs are also shown
HYDROLOGICAL RESPONSE OF AFFORESTED PEAT CATCHMENT
no flow in the stream Figure 10(b) shows that the converseoccurred between days 340 and 344 where the simulatedflow from Scenario B was higher than the observed flowAs there is a slight discrepancy between the peak flows andsimulated flows for reasons outlined earlier the simulationof the undisturbed peatland is also shown in Figure 10(b)
DISCUSSION
The comparisons of observed flows and WT depths withthe corresponding simulated values from the GEOtopmodel in the calibration and validation years show thatthe current configuration of GEOtop is capable of reliablysimulating the hydrological processes Central to thisconfiguration for the peatland is the spatial variation ofhydraulic conductivity Areas of low hydraulic conductivityat the margins near the stream are essential in maintainingthe elevated WT in the centre of the bog For the drainagescenarios once these areas of lower hydraulic conductivitywere modified by the insertion of a drainage network theWTs level in the centre of the bog fell Given that even aslight drop in WT impacts the vegetation distribution andcomposition (Sottocornola et al 2009) any disturbance ofthese relatively small areas of lower hydraulic conductivitywill likely affect a much larger area of a bogWhereas the practice of drainage prior to afforestation
of peatlands lowers the WT its depth will also be affectedby the increase in transpiration and canopy interceptionwith the change of land use from natural peatland to Sitkaspruce afforestation From Figure 9 and Table II we notethat the simulated ET increased in the mature forest(Scenario B) to 492mm greater than the pristine peatlandThe ET rate of the younger forest (Scenario A) wassimilar to the undisturbed peatland A study of ET by
Copyright copy 2012 John Wiley amp Sons Ltd
Sottocornola and Kiely (2010) at the same site found thatthe ET was not water limited and the observed ET rangedbetween 369 and 424mm with an average of 394mm ofET over a 5-year period Sottocornola and Kiely (2010)concluded that one of the key limiting factors in ET wasthe lack of vascular plants which if present wouldenhance transpiration Although Figure 9 shows that thereis a drop in the WT for Scenario A particularly in thesummer months at this stage of development of a forestthe tree canopy would not provide full cover As the WTis lower than in the undisturbed peatland the ET ratefrom the original peatland vegetation which has a largeproportion of non-vascular plants will have decreasedThus it would appear that the increase in ET under theSitka spruce canopy is offset by the decrease in ET fromthe original peatland vegetationThe estimated ET (913mm) of Scenario B of a more
mature forest was 412mm higher than Scenario A Suchincreases in ET as a result of changing peatland land usefrom grass mosses and bare peat to Sitka spruce havebeen noted by others Studies by others in areas such asthe Scottish highlands that may be considered similar insoil type and climate to our Irish study site have foundthat Sitka spruce may intercept between 28 (596mm)(Johnson 1990) and 52 (1514mm) (Heal et al 2004)of precipitation Transpiration of Sitka spruce in Cumbriahas been estimated at 12 of precipitation or 172mm(Anderson et al 1990) We note that our estimates of ETfrom Scenario B at 32 of rainfall is in the rangeof values cited in the literature Results from a study bythe Institute of Hydrology (1991) into the effects ofupland afforestation on water resources suggest that ETon a forested catchment receiving 2800mm precipitationannually was approximately 1190mm which is similar to
Hydrol Process (2012)DOI 101002hyp
C LEWIS ET AL
the ET value of 925mm in our Scenario B Other studieson afforested peatlands such as the Marcell experimentalforest in Minnesota and the Huhtisuo catchment inFinland found that ET represented a larger percentageof precipitation than values noted in this study A studyby Verry and Timmons (1982) found that ET from amature Black Spruce forest represented up to 66 of theannual precipitation with Iritz et al (1994) reporting ETvalues of 61 of precipitation in the Huhtisuo catchmentin Finland However precipitation was much lower inboth locations with the Huhtisuo catchment and Marcellforest annually receiving approximately 700 and 800mmprecipitation respectively The climate at both locationsis described as continental with streamflow tending tocease for 2ndash4months of each winter because of lowertemperatures in Marcell (Kolka et al 2001) Thedifference in climate is likely to have resulted in thedifference in simulated and observed ET values in ourstudy and that of those reported from the Huhtisuocatchment and Marcell forest In our site the averageprecipitation over a 5-year period was 2597mm with anaverage ET of 394mm representing approximately 15of precipitation The increased ET associated withafforestation in conjunction with the drainage networkresulted in a WT draw down in dry periods (Figure 9)The WT in Scenarios A and B was on average 165 and205 cm below the observed WT for the calendar year2008 This is similar to the draw down noted by Bragg(2002) where the WT in a forested peatland wasfound to be 100ndash150 cm below that in the adjacentunforested peatlandAs the runoff from peatlands in their natural state
(in Western Europe) is known to be flashy because ofsaturation excess overland flow a lowering of the WT isexpected to reduce the volume of runoff produced fromsaturation excess This is noted in the hydrograph for asummer period in Figure 10(a) which shows the observedand the simulated flows from Scenario B for Julian days134ndash140 The rain event on day 135 was preceded by adry period in April and May 2007 the end of which theWT was observed to be at its lowest level since recordsbegan in 2003 At the start of the precipitation event ofday 135 the WT of Scenario B was 698 cm lower thanthe observed WT of the pristine peatland and 592 cmbelow the drained simulation With this lower WT andreduced precipitation reaching the ground because ofcanopy interception the streamflow from the simulatedforest catchment is greatly reduced However theconverse applies for the streamflow in winter as shownin Figure 10(b) Prior to day 340 there had been frequentrain events which had resulted in a much higher WT bothin the simulated and observed cases A total of 53mm fellon day 340 resulting in a higher simulated than observedflow As the observed WT was 19 cm below the surfaceand Scenario B was just 25 cm below the surface weconsider that both simulations produced saturation excessoverland flow However the forested simulation had amore extensive drainage network that was able to conveyany surface runoff to the catchment outfall more rapidly
Copyright copy 2012 John Wiley amp Sons Ltd
resulting in a higher peak flows Such a phenomenon hasalso been noted by others with Ahti (1980) finding thatincreasing density of drainage ditches increased peakflows in a Finish peatland and model simulations by Iritzet al (1994) noting that peak flows may be increased byforest drainage when the WT is close to the surface Thestudies of Anderson et al (2000) and (Ballard et al 2011b)also drew similar conclusionsThis phenomenon of increasing the streamflow following
afforestation of peatlands may have implications inlarger catchments where afforestation may be falselyconsidered as a flood mitigation measure Likewise thereduction of flows from peatlands throughout thesummer and in particular after dry periods may be ofconcern for water resource managers
CONCLUSION
With regard to applying the hydrological GEOtop modelto an Atlantic blanket peatland we found that GEOtopwas suitable for the purposes of modelling the hydro-logical processes Central to this was the input of thespatial variation of the saturated hydraulic conductivityPeat with a lower hydraulic conductivity at the marginsresults in elevating the WT depth in the centre of the bogwhich in turn results in saturation excess overland flowduring precipitation events It is also clear from thescenario modelling that afforestation and its associateddrainage can change the hydrological response of thispristine peatland catchment Whereas the ET rates from ayoung Sitka spruce catchment were similar to the existingpristine peatland catchment a semi-mature Sitka Spruceforest resulted in an increase in ET of 492mm throughincreased transpiration from the canopy and interceptionThis increase in ET was particularly noticeable in summerand resulted in an increase in depth of the WT andreduction in streamflow However in winter followingperiods of heavy rainfall the WT depth approached thatof an unforested drained peatland This shallow WT depthin combination with a drainage network results in anincrease in peak flow in times of heavy rainfall Thissuggests that there is limited or no benefit to floodattenuation from peatland afforestation during winterperiods when the WT is high whereas the converseapplies to summer flows where the rainfall runoff wasreduced in dry periods
ACKNOWLEDGEMENTS
This study was funded by the Irish EnvironmentalProtection Agency under the Science Technology Researchand Innovation for the Environment Programme 2007ndash2013of Ireland (Soil H Interactions of soil hydrology land useand climate change and their impact on soil quality 2007-S-SL-1-S1) We would like to thank Dr Alice Wemaere of theEnvironmental Protection Agency for her continuoussupport We would also like to thank the SoilH steeringcommittee for their support advise and encouragement
Hydrol Process (2012)DOI 101002hyp
HYDROLOGICAL RESPONSE OF AFFORESTED PEAT CATCHMENT
throughout this project Prof Mark Kibblewhite Dr ArwynJones and Dr Otto Spaargaren We particularly wish tothank our present and past colleagues in the HYDROMETgroup Dr Paul Leahy Mr Nelius Foley Dr Rashid Rafiqueand Dr Michael Wellock We thank Caitriona Douglas ofNPWS and Coillte Teoranta for the permission to use thestudy site We also very much appreciate the support of thedevelopers of GEOtop in particular Prof Riccardo Rigonand Dr Matteo Dallrsquo Amico We acknowledge in particularthe earlier work of Dr Anna Laine Dr Matteo SottocornolaandDrAnn-KristinKoehler and their work and publicationsfrom the same site
REFERENCES
Abbott MB Bathurst JC Cunge JA Oconnell PE Rasmussen J 1986An introduction to the European hydrological systemmdashsystemehydrologique Europeen she 2 Structure of a physically-baseddistributed modeling system Journal of Hydrology 87(1ndash2) 61ndash77
Ahti E 1980 Ditch spacing experiments in estimating the effects ofpeatland drainage on summer runoff Proceedings of the HelsinkiSymposium Helsinki
Anderson AR Pyatt DG 1986 Interception of precipitation by Pole-StageSitka Spruce and Lodgepole Pine and Mature Sitka Spruce at KielderForest Northumberland Forestry 59(1) 29ndash38
Anderson AR Pyatt DG Stannard JP 1990 The effects of clearfelling aSitka Spruce Stand on the water-balance of a peaty gley soil atKershope Forest Cumbria Forestry 63(1) 51ndash71
Anderson AR Day R Pyatt DG 2000 Physical and hydrological impactsof blanket bog afforestation at Bad arsquo Cheo Caithness the first 5 yearsForestry 73(5) 467ndash478
Arnold JG Srinivasan R Muttiah RS Williams JR 1998 Large areahydrologic modeling and assessment Part I model developmentAmerican water resources Association 34(1) 73ndash89
Baird AJ Eades PA Surridge BWJ 2008 The hydraulic structure of araised bog and its implications for ecohydrological modelling of bogdevelopment Ecohydrology 1(4) 289ndash298 DOI 101002Eco33
Ballard CE McIntyre HS Wheater HS Holden J Wallage ZE 2011aHydrological modelling of drained blanket peatland Journal ofHydrology 407 81ndash83 http dxdoiorg101016jjhydrol201107005
Ballard CE Mclntyre N Wheater HS 2011b Effects of peatland drainagemanagement on peak flows Hydrology and Earth System Sciences 86533ndash6563 DOI 105194hessd-8-6533-2011
Bay R 1969 Runoff from small peatland watersheds Journal ofHydrology 9 90ndash102
Bertoldi G Rigon R Over TM 2006 Impact of watershed geomorphiccharacteristics on the energy and water budgets Journal of Hydro-meteorology 7(3) 389ndash403
Bertoldi G Notarnicola C Leitinger G Endrizzi S Zebisch M DellaChiesa S Tappeiner U 2010 Topographical and ecohydrologicalcontrols on land surface temperature in an alpine catchmentEcohydrology 3(2) 189ndash204 DOI 101002Eco129
Beven K Kirkby MJ 1979 A physically based variable contributing areamodel of basin hydrology Hydrological Sciences Bulletin 23 419ndash437
Black K Gallagher G Orsquo Brien P Redmond J Barrett F Twomey M2008 Dispelling myths the ture extent of recent peatland afforestationin Ireland Coford Dublin
Bragg OM 2002 Hydrology of peat-forming wetlands in ScotlandScience of the Total Environment 294(1ndash3) 111ndash129 Pii S0048-9697(02)00059-1
Burke B 1975 Effect of drainage on the hydrology of blanket-bog Irishjournal of agricultural research 14 145ndash62
Byrne KA Farrell EP 2005 The effect of afforestation on soil carbondioxide emissions in blanket peatland in Ireland Forestry 78(3)217ndash227 DOI 101093forestrycpi020
Conway VM Millar A 1969 The hydrology of some small peat-coveredcatchments in the northern Pennines Journal of the Institute of WaterEngineers 14 415ndash24
Dept of Agriculture 1996 Growing for the futuremdasha strategic plan forthe Development of the Forestry Sector in Ireland Dublin
Dunn SM Mackay R 1996 Modelling the hydrological impacts of openditch drainage Journal of Hydrology 179(1ndash4) 37ndash66
Copyright copy 2012 John Wiley amp Sons Ltd
Eaton J McGoff N Byrne K Leahy P Kiely G 2008 Land cover changeand soil organic carbon stocks in the Republic of Ireland 1851ndash2000Climatic Change 91(3ndash4) 317ndash334 DOI 101007s10584-008-9412-2
Frolking S Roulet NT 2007 Holocene radiative forcing impact ofnorthern peatland carbon accumulation and methane emissions GlobalChange Biology 13(5) 1079ndash1088 DOI 101111j1365-2486200701339x
van Genuchten MT 1980 A closed-form equation for predicting thehydraulic conductivity of unsaturated soils Soil Science Society ofAmerica Journal 44(5) 892ndash898
Hargreaves KJ Milne R Cannell MGR 2003 Carbon balance ofafforested peatland in Scotland Forestry 76(3) 299ndash317
Heal KV Stidson RT Dickey CA Cape JN Heal MR 2004 New data forwater losses from mature Sitka spruce plantations in temperate uplandcatchments Hydrological Sciences Journal 49(3) 477ndash493
Hoag RS Price JS 1995 A field-scale natural gradient solute transportexperiment in peat at a Newfoundland blanket bog Journal ofHydrology 172(1ndash4) 171ndash184
Hogan JM van der Kamp G Barbour SL Schmidt R 2006 Fieldmethods for measuring hydraulic properties of peat deposits Hydro-logical Processes 20(17) 3635ndash3649 DOI 101002Hyp6379
Holden J 2005 Peatland hydrology and carbon release why small-scaleprocess matters Philosophical Transactions of the Royal Societya-Mathematical Physical and Engineering Sciences 363(1837)2891ndash2913 DOI 101098rsta20051671
Holden J Burt TP 2002 Infiltration runoff and sediment production inblanket peat catchments implications of field rainfall simulationexperiments Hydrological Processes 16(13) 2537ndash2557 DOI101002Hyp1014
Holden J Burt TP 2003 Hydraulic conductivity in upland blanketpeat measurement and variability Hydrological Processes 17(6)1227ndash1237 DOI 101002Hyp1182
Holden J Chapman PJ Labadz JC 2004 Artificial drainage of peatlandshydrological and hydrochemical process and wetland restorationProgress in Physical Geography 28(1) 95ndash123
Holden J Evans MG Burt TP Horton M 2006 Impact of land drainageon peatland hydrology Journal of Environmental Quality 35(5)1764ndash1778
Holden J Wallage ZE Lane SN McDonald AT 2011 Water tabledynamics in undisturbed drained and restored blanket peat Journal ofHydrology 402(1ndash2) 103ndash114 DOI 101016jjhydrol201103010
Horgan T Keane M McCarthy R Lally M Thompson D 2004 A Guide toForest Tree Species Selection and Silviculture in Ireland Coford Dublin
Hudson JA Gilman K Calder IR 1997 Land use and water issues in theuplands with reference to the Plynlimon study Hydrology and EarthSystem Sciences 1(3) 239ndash397
Institute of Hydrology 1991 Effects of upland afforestation on waterresources the Balquhidder experiment 1981ndash1991 Report no 116Institute of Hydrology Wallingford UK
Iritz L Johansson B Lundin L 1994 Impacts of forest drainage on floodsHydrological Sciences Journal 39(6) 637ndash661
Johnson RC 1990 The interception throughfall and stemflow in a forestin Highland Scotland and the comparison with other upland forests inthe UK Journal of Hydrology 118(1ndash4) 281ndash287
Koehler AK Murphy K Kiely G Sottocornola M 2009 Seasonalvariation of DOC concentration and annual loss of DOC from anAtlantic blanket bog in South Western Ireland Biogeochemistry 95231ndash242 DOI 101007s10533-009-9333-9
Koehler AK Sottocornola M Kiely G 2011 How strong is the currentcarbon sequestration of an Atlantic blanket bog Global ChangeBiology 17(1) 309ndash319 DOI 101111j1365-2486201002180x
Kolka RK Griagal DF Nater EA Verry ES 2001 Hydrologic cycling ofmercury and organic carbon in a forested upland-bog watershed SoilScience Society 65 897ndash905
Lafleur PM Hember RA Admiral SW Roulet NT 2005 Annual andseasonal variability in evapotranspiration and water table at a shrub-covered bog in southern Ontario Canada Hydrological Processes19(18) 3533ndash3550
Laine A Byrne KA Kiely G Tuittila ES 2007 Patterns in vegetationand CO2 dynamics along a water level gradient in a lowland blanketbog Ecosystems 10(6) 890ndash905 DOI 101007s10021-007-9067-2
Lane SN Brookes CJ Kirkby AJ Holden J 2004 A network-indexbasedversion of TOPMODEL for use with high-resolution digital topographicdata Hydrological Processes 18(1) 191ndash201
Lapen DR Price JS Gilbert R 2005 Modelling two-dimensional steady-state groundwater flow and flow sensitivity to boundary conditions inblanket peat complexes Hydrological Processes 19(2) 371ndash386 DOI101002Hyp1507
Hydrol Process (2012)DOI 101002hyp
C LEWIS ET AL
Lees JC 1972 Soil aeration and Sitka Spruce seedling growth in peatJournal of Ecology 60(2) 343ndash349
Letts MG Roulet N Comer NT 2000 Parameterization of peatlandhydraulic properties for the Canadian land surface scheme CanadianMeterological and Oceanographic Society 38 141ndash160
Lewis C Albertson J Xu X Kiely G 2011 Spatial variability of hydraulicconductivity and bulk density along a blanket peatland hillslopeHydrological Processes 26 1527ndash1537 DOI 101002hyp8252
Limpens J Berendse F Blodau C Canadell JG Freeman C Holden JRoulet N Rydin H Schaepman-Strub G 2008 Peatlands and thecarbon cycle from local processes to global implicationsmdasha synthesisBiogeosciences 5(5) 1475ndash1491
Nash JE Sutcliffe JV 1970 River flow forecasting through conceptualmodels part Imdasha discussion of principles Journal of Hydrology 10(3)282ndash290
NFI 2007 National Forest InventorymdashRepublic of IrelandmdashResultsJohnstown Castle Estate Co Wexford Ireland
Nilsson M Sagerfors J Buffam I Laudon H Eriksson T Grelle AKlemedtsson L Weslien P Lindroth A 2008 Contemporary carbonaccumulation in a boreal oligotrophic minerogenic miremdasha significantsink after accounting for all C-fluxes Global Change Biology 14(10)2317ndash2332 DOI 101111j1365-2486200801654x
Oechel WC Vourlitis GL Hastings SJ Zulueta RC Hinzman L Kane D2000 Acclimation of ecosystem CO2 exchange in the Alaskan Arctic inresponse to decadal climate warming Nature 406(6799) 978ndash981
Pilcher JR Mac an tSaoir S 1995 Wood Trees Forests in Ireland RoyalIrish Academy Dublin
Prevost M Belleau P Plamondon AP 1997 Substrate conditions in atreed peatland responses to drainage Ecoscience 4(4) 543ndash554
Price JS Branfireun BA Waddington JM Devito KJ 2005 Advancesin Canadian wetland hydrology 1999ndash2003 Hydrological Processes19(1) 201ndash214 DOI 101002Hyp5774
Ramchunder SJ Brown LE Holden J 2007 Environmental effects ofdrainage drain-blocking and prescribed vegetation burning in UKupland peatlands Progress in Physical Geography 2009(33) 49 DOI1011770309133309105245
Copyright copy 2012 John Wiley amp Sons Ltd
Reggiani P Sivapalan M Hassanizadeh SM 2000 Conservationequations governing hillslope responses exploring the physical basisof water balance Water Resources Research 36(7) 1845ndash1863
Rigon R Bertoldi G Over TM 2006 GEOtop a distributed hydrologicalmodel with coupled water and energy budgets Journal of Hydro-meteorology 7(3) 371ndash388
Robinson M 1986 Changes in catchment runoff following drainage andafforestation Journal of Hydrology 86(1ndash2) 71ndash84
Simoni S Zanotti F Bertoldi G Rigon R 2008 Modelling the probabilityof occurrence of shallow landslides and channelized debris flows usingGEOtop-FS Hydrological Processes 22(4) 532ndash545 DOI 101002Hyp6886
Sottocornola M Kiely G 2010 Energy fluxes and evaporationmechanisms in an Atlantic blanket bog in southwestern Ireland WaterResources Research 46 DOI 1010292010WR009078
Sottocornola M Laine A Kiely G Byrne KA Tuittila ES 2009Vegetation and environmental variation in an Atlantic blanket bog insouthwestern Ireland Plant Ecology 203(1) 69ndash81 DOI 101007s11258-008-9510-2
Strack M Waddington JM Rochefort L Tuittila ES 2006 Response ofvegetation and net ecosystem carbon dioxide exchange at different peatlandmicroforms following water table drawdown Journal of GeophysicalResearch-Biogeosciences 111(G2) DOI 1010292005jg000145
Tobin B Black K Osborne B Reidy B Bolger T Nieuwenhuis M 2006Assessment of allometric algorithms for estimating leaf biomass leafarea index and litter fall in different-aged Sitka spruce forests Forestry79(4) 453ndash465 DOI 101093forestrycpl030
Verry ES Timmons DR 1982 Waterborne nutrient flow through anupland-peatland watershed in Minnesota Ecology 65(5) 1456ndash1467
Waldron S Flowers H Arlaud C Bryant C McFarlane S 2009 Thesignificance of organic carbon and nutrient export from peatland-dominated landscapes subject to disturbance a stoichiometric perspectiveBiogeosciences 6(3) 363ndash374
Zanotti F Endrizzi S Bertoldi G Rigon R 2004 The GEOTOP snowmodule Hydrological Processes 18(18) 3667ndash3679 DOI 101002Hyp5794
Hydrol Process (2012)DOI 101002hyp
C LEWIS ET AL
scenarios A a 10-year-old Sitka spruce afforestationsimulation and B a 15-year-old Sitka spruce afforestationsimulation
MATERIALS AND METHODS
Site description
The study site is a pristine Atlantic blanket bog nearGlencar in County Kerry southwest Ireland (latitude5158N longitude 954W) at an elevation of approximately150m (Figure 1) and is typical of Atlantic blanket bogs inthe coastal regions of northwest Europe in terms of bothvegetation and water chemistry (Sottocornola et al 2009)The study site is part of a larger pristine bog ofapproximately 121 km2 A small stream (~1m wide) runsthrough the centre of the bog and drains approximately76 ha 85 of which is intact blanket bog (see Figure 1)The surface of the bog is a mosaic of microforms that
differ in relative altitude plant composition andWT depthFour vegetation microform classes were distinguished inrelation to their difference in WT level hummocks highlawns low lawns and hollows that cover 6 62 21and 11 of the study site respectively (Laine et al 2007Sottocornola et al 2009) Vascular plants cover about30 of the study site area with the most common species
Figure 1 Peatland catchm
Copyright copy 2012 John Wiley amp Sons Ltd
being Molinia caerulea (purple moorgrass) and Callunavulgaris (common heather) About 25 of the bog surfaceis covered by bryophytes with the dominant species being abrownmoss Racomitrium lanuginosum The vegetation ofthe study site has been described in detail by Sottocornolaet al (2009)
Site instrumentation
At the outfall of the 76-ha catchment (Figure 1) thestream height was recorded every 30min by using apressure transducer (1830 Series Druck Limited UK)Stream height was converted to discharge by using arating curve (Equation 1) built up from stream height andstream velocity measurements taken over 2 years
Q frac14 06946 h 008071eth THORN1441r2 frac14 09986RMSE frac14 0005
(1)
where Q is the instantaneous discharge in m3 s1 and h isstream height in m The rating curve was established frommanual measurements of instantaneous discharge carriedout at a range of stream heights by using an OTT currentmetre (OTT Messtechnik GmbH amp Co KG Germany)The meteorological station (Figure 1) was established
in 2002 and includes two tipping bucket rain gauges(an ARG100 Environmental Measurements Ltd UK and
ent and location map
Hydrol Process (2012)DOI 101002hyp
HYDROLOGICAL RESPONSE OF AFFORESTED PEAT CATCHMENT
an Obsermet OMC-200 Observator BV The Netherlands)and a WT level recorder that consists of a pressuretransducer (PCDR1830 Campbell Scientific UK) placedinside a metal well pierced all along its height Wind speedwas recorded with a 2D sonic anemometer (WindSonicGill UK) Air temperature and relative humidity weremeasured at 2-m height with a shielded probe (HMP45CVaisala Finland) whereas atmospheric pressure wasrecorded with a barometer (PTB101B Vaisala Finland)An eddy covariance system for CO2 fluxes was alsolocated on the same tower It consisted of a 3D sonicanemometer (Model 81000 RM Young Company USA)and an open-path infrared gas analyzer for H2O and CO2
concentrations (LI-7500 LI-COR USA) mounted 3mabove the vegetation
Climate
Sottocornola and Kiely (2010) at the same site foundthat the range of annual rainfall (2002ndash2009) was2236ndash3365mm with an annual average of 2597mm Theannual ET (estimated using eddy covariance methods)ranged from 369 to 424mm with an annual average of394mm From2002 to 2009 therewas an annual average of208 wet days (gt1mmday1) (Koehler et al 2009) Theaverage annual air temperature was 105 CThe recorded flow at the stream outfall (see Figure 1)
ranged between 0015 and 100 l s1 ha1 (Koehler et al2009) with the 95 percentile flow exceeding 0037 l s1
ha1 The flow was observed to be flashy with over 90
of the streamflow sourced from surface runoff (Lewiset al 2011) This is due to a perennially high WT thatwas observed continuously over the 7 years 2002ndash2009to be within 17 cm of the land surface (with the 7-yearmean WT at ~4 cm below the surface) at the eddycovariancemeteorological station Although additionalWT observation stations would be beneficial the site iswell known to the authorsrsquo through frequent site visitsand it is considered that the WT measurements arerepresentative of the peatland A manual WT observationstation was established in 2009 near the stream and theWT was found to vary between 0 and 10 cm below thesurface Observations were taken approximately sixndasheighttimes a year particularly during dry periods Lewis et al(2011) investigated the spatial variation of bulk densityand saturated hydraulic conductivity at the same site andfound that at the surface (top 10 cm) saturated horizontalhydraulic conductivity was lowest at the bog margin nearthe stream (~107m s1) and increased at the bog interior(~105m s1) The converse was found for bulk densitywhich ranged from ~011 g cm3 at the bog marginto ~ 0055 g cm3 near the bog interior
Process-based hydrological model ndash GEOtop
The process-based hydrological model GEOtop (Rigonet al 2006) was used in this study It is a distributedhydrological model (operating on a 8m 8m grid) andsimulates the complete hydrological balance in acontinuous way during a whole year (at a temporal
Copyright copy 2012 John Wiley amp Sons Ltd
increment of 60min) It uses geospatial data (eg topographysoil type vertical and horizontal hydraulic conductivitydepth and the Van Genuchten parameters a and n(van Genuchten 1980)) vegetation cover (including cropheight Leaf Area Index (LAI) and root depth) and landcover It provides spatially distributed output fields aswell as routing water and sediment flows through streamand river networksGEOtop includes a rigorous treatment of the core
hydrological processes (eg unsaturated and saturated flowand transport surface energy balances and streamflowgenerationrouting) Unsaturated dynamics are treated witha 3D integration of Richardsrsquo equation whereas surfacerunoff is routed via a kinematic wave The spacendashtimefields of radiation that drive the evaporative processesaccount for terrain effects such as aspect slope andshading The energy processes in GEOtop have beenextensively tested and validated (Bertoldi et al 2006)Using GEOtop in an alpine catchment Bertoldi et al(2010) showed that the major factors controlling the landsurface temperature in a humid climate were incomingsolar radiation and land cover variability Others have alsotaken the GEOtop model and added further modules to itincluding a snow module by Zanotti et al (2004) and alandside probability function by Simoni et al (2008)The hourly meteorological data required (precipitation
atmospheric pressure temperature global shortwave radi-ation relative humidity and wind speed and direction) byGEOtop were available from the on site meteorologicaltower A field measurement study by Lewis et al (2011) atthe same site found that the saturated horizontal hydraulicconductivity in the riparian zone within 10m of the streamwas ~107 m s1 which was one to two orders ofmagnitude less conductive than the bog interior Thesaturated horizontal conductivity was found to beapproximately twice vertical hydraulic conductivity Toreflect this pattern in the soil matrix in GEOtop the peatwithin 10m of the stream was assigned the hydraulicparameters found by Lewis et al (2011) in the riparianzone A second zone was created between 10 and 20mfrom the stream and the peat in this zone was assigned ahigher hydraulic conductivity value An incrementalprocess of increasing the hydraulic conductivity wasutilized until at the bog interior the saturated hydraulicconductivity assigned was ~105 m s1 Vegetationdetails (LAI height and root depth) were adopted fromSottocornola et al (2009) and Laine et al (2007)
Modelling scenarios
To reflect the practice of draining peatland prior toafforestation an artificial drainage network was simulatedfor this GEOtop application This consisted of a series ofditches placed 8m apart and 350mm deep The ditchesran orthogonal to the contours and drained into the streamrunning through the centre of the bog Initial trials of thisnew drainage network found however that there waslittle change in the WT Peatland drains have been found tolower the WT adjacent to the drains specifically downslope
Hydrol Process (2012)DOI 101002hyp
C LEWIS ET AL
of drains as the drains intercept the surface runoff fromupslope areas (Holden et al 2006) Because of modelconstraints it was not possible to increase the drainagenetwork density to achieve a realistic WT drawdown Itwas therefore decided to increase the horizontalconductivity of the peatland to represent the changedtravel time for water from the peat matrix to the drainagenetwork that a peatland with a higher density of drainswould have However it must also be noted that thisincrease in horizontal conductivity is also likely toreflect the increase in hydraulic conductivity caused bychanges in soil structure associated with WT drawdown(Ramchunder et al 2007)Two possible land use change scenarios were simulated
in this study changing the land use from natural peatlandto a 10-year-old (Scenatio A) and a 15-year-old (ScenarioB ) Sitka spruce forest The LAI was adopted from Tobinet al (2006) in a study on LAI in different ages ofSitka spruce forests in Ireland Sitka spruce forests atapproximately 15 years of age have the highest LAI and
0 50 100 150 200 250 300 3500
05
1
15
2
Julian Day 2007
Flo
w (
m s
minus1 )
Observed FlowSimulated Flow
Figure 2 Observed and simulated flows for 2007 at hourly intervals
0 100 200 3000
500
1000
1500
2000
2500
Julian Days
Flo
w (
mm
)
RainfallObserved FlowSimulated Flow
(a)
Figure 3 For 2007 (a) cumulative rainfall observed flow and simulatesimulated
Copyright copy 2012 John Wiley amp Sons Ltd
therefore deemed to have the largest impact on the rainfallrunoff response mainly from increased interception andtranspiration The changes to the model for Scenario Awere made by increasing the LAI to 45 root depth to40 cm and canopy height to 250 cm For Scenario B theLAI root depth and canopy height were increased to 7555 and 800 cm respectively Along with the change inland use both of these scenarios also included a newdrainage network to reflect the practice of drainingpeatlands prior to afforestation
RESULTS
The model was calibrated using observed data for 2007Figure 2 shows the time series of observed and GEOtopmodelled flows with in a NashndashSutcliffe (Nash andSutcliffe 1970) efficiency of 087 The difference betweenobserved and simulated flows is greatest in times of highflows where the simulated flow is larger than the observedHowever at times of high flow the observed flows may beunderestimated as flow spills overbank and no streamflowmeasurements were recorded for overbank flow (becauseof safety reasons) The cumulative rainfall (2229mm)observed streamflow (1925mm) and simulated streamflow(2018 mm) are shown in Figure 3(a) The modelled ET of~211mm for 2007 is lower than both the observed value of304mm and the nearby eddy covariance estimate of ETof 388mm for the hydrological year 20062007 reportedby Sottocornola and Kiely (2010) Monthly totals ofsimulated flow compare well with observed values(Figure 3(b)) as do the instantaneous values of simulatedand observed flows (Figure 3(c)) with the exception ofthe very highest flows We believe this is due to theoverbank flow for which our high observed flows arelikely to be underestimated
JanFebMarArpMayJun Jul AugSepOctNovDec0
1
2
3
4x 10
5
Flo
w (
m3 )
0 05 1 150
05
1
15
Observed flows (m3 sminus1)
Sim
ulat
ed fl
ows
(m3
sminus1 )
Observed FlowSimulated Flow
R2= 091
(b)
(c)
d flow (b) monthly observed and simulated flows (c) observed andflows
Hydrol Process (2012)DOI 101002hyp
HYDROLOGICAL RESPONSE OF AFFORESTED PEAT CATCHMENT
The observed and simulated WT depths are shown inFigure 4 The model simulates WT over the full extent ofthe bog and will be somewhat different to the observedWT which was from one WT sensor point Examining
0 50 100 150 200 250 300 350
0
Dep
th o
f wat
er ta
ble
belo
w s
urfa
ce (
cm)
minus30
minus25
minus20
minus15
minus10
minus5
minus100
minus50
0
Julian Day 2007D
aily
Rai
nfal
l (m
m)
Observed WTSimulated WTDaily Rainfall
Figure 4 For 2007 daily rainfall (top) observed and simulated water table
0 100 200 3000
500
1000
1500
2000
2500
3000
Julian Days
Flo
w (
mm
)
RainfallObserved FlowSimulated Flow
(a)
Figure 6 For 2008 (a) cumulative rainfall observed flow and simulated flow
0 50 100 150 200 250 300 3500
02
04
06
08
1
12
14
Julian Day 2008
Flo
w (
m s
minus1 )
Observed FlowSimulated Flow
Figure 5 Observed and simulated flows for 2008 at hourly intervals
Copyright copy 2012 John Wiley amp Sons Ltd
Figure 4 for 2007 we note that the time series trends ofboth observed and simulated WTs agree even thoughthe absolute values are somewhat different For theinstantaneous WT (Figure 4) the range is larger for thesimulated WT but again not hugely different The annualmean observed WT (Figure 4) was 387 cm below thesurface compared with the simulated WT of 485 cmThis WT difference is under 1 cm From Figures 2ndash4 wesuggest that GEOtop simulates well the hydrologicalprocess in the peatland for the calibration yearOnce the model was calibrated for 2007 it was then
validated (no change to parameters) for 2008 Figures 5ndash7and Table II show the results of the 2008 simulation TheNashndashSutcliffe efficiency of 089 for 2008 showed aslight improvement on the 2007 value of 087 whereasthe simulated flow was slightly greater than the observedflow (Figure 6) The simulated WT had an annual meanvalue of 29 cm below the surface whereas the observed
JanFebMarArpMayJun Jul AugSepOctNovDec0
1
2
3
4x 10
5
Flo
w (
m3 )
Observed FlowSimulated Flow
0 05 1 150
05
1
15
Recorded Flows (m3 sminus1)
Sim
ulat
ed F
low
s m
3 sminus
1
R2= 092
(c)
(b)
(b) monthly observed and simulated flows (c) observed and simulated flows
Dep
th o
f wat
er ta
ble
belo
w s
urfa
ce (
cm)
minus25
minus20
minus15
minus10
minus5
0
0 50 100 150 200 250 300 350
minus100
minus50
0
Julian Day 2008
Dai
ly R
ainf
all (
mm
)
Observed WTSimulated WTDaily Rainfall
Figure 7 For 2008 daily rainfall (top) observed and simulated watertable depth
Hydrol Process (2012)DOI 101002hyp
Table II Observed and modelled scenarios rainfall evapotranspiration and streamflow values
Scenario Year Rainfall (mm) Evapotranspiration (mm) Streamflow (mm) Streamflowrainfall ratio
Observed 2007 2229 304 1925 075Calibrated model 2007 2229 211 2018 082Observed 2008 2826 421 2405 085Validated model 2008 2826 330 2496 088Scenario A 2008 2826 501 2325 083Scenario B 2008 2826 913 1913 067
0 50 100 150 200 250 300 350minus70
minus60
minus50
minus40
minus30
minus20
minus10
0
10
Julian Day 2008
Dep
th o
f wat
er ta
ble
belo
w s
urfa
ce(c
m)
Observed WTDrained PeatlandScenario AScenario B
Figure 8 For 2008 water table for observed drained peat Scenario Aand Scenario B
0 50 100 150 200 250 300 3500
500
1000
1500
2000
2500
3000
Julian Day 2008
Flo
w m
3 sminus
1
Rainfall (1)Observed flow (2)Scenario A (3)Scenario B (4)
(3)
(4)
(1)
(2)
Figure 9 Cumulative rainfall observed flow simulated flow ScenarioA and Scenario B flows
C LEWIS ET AL
WT had an annual mean depth of 35 cm below thesurface for 2008 These figures show that GEOtopprovides a similar level of accuracy for the validationyear 2008 as it did for the calibration year 2007 Fromthis we suggest that the current configuration of GEOtopsimulates well the hydrological processes in the Glencarblanket peatland and that we are able to proceed with astudy of land use change scenariosThe overall goal of this project is to study the change
in hydrological response of peatland when land use ischanged from its natural state to forestry It is not possibleto do this by simply changing the land use in the modelas in practice peatlands are drained prior to planting(Holden et al 2004) To reflect this the drainage networkin the model was modified and a series of new networkdrains was inserted into the model The model was thenrun again for the 2 years 2007 and 2008 with land usechange Scenarios A and B Although the model was runfor 2 years the cumulative flow and ET values are shownin Figure 9 for 2008 only after allowing the model to spinup for the first 3months of 2007The changes in WT due to the drainage and land use
change scenarios are shown in Figure 8 The simulateddrained peatland showed a drop in WT particularly in thesummer months with the annual mean drained WT150 cm below the surface and 115 cm below theobserved WT The annual mean observed WT depth for2008 was 35 cm below the surface whereas with meansimulated WT depths for scenarios A and B were 120and 240 cm respectively (see Figure 8)The cumulative rainfall (2826mm) observed flow
(2405mm) and simulated flows (2325 for Scenario A and1913mm for Scenario B) for 2008 are shown in Figure 9From this we estimate that ET from the peatland is~420mm in 2008 which is similar to the highest value(424mm) of the eddy covariance estimated ET reportedby Sottocornola and Kiely (2010) in the period 2002ndash2007Scenario A showed very little change in ET from theundisturbed peatland whereas the ET for Scenario B was925mm an increase of 492mm when compared with theobserved ET in 2008 The total annual simulatedstreamflow for Scenarios A and B were reduced to 96and 80 respectively of the observed flow A comparisonof the streamflow between the observed flow and ScenarioB did not show that Scenario B was consistently reducedby 80 It showed rather that Scenario B had at differenttimes of the year both higher (typically in winter) andlower streamflows (typically summer) than the observed
Copyright copy 2012 John Wiley amp Sons Ltd
streamflow This is illustrated in Figure 10(a) and (b)Figure 10(a) shows the observed flow and the flow fromScenario B from Julian day 134 to day 140 2007 Apriland May 2007 were unusually dry with April being one ofthe driest on record at two nearby Met Eireann (Irishweather service) synoptic weather stations and belowaverage rainfall was reported in May (httpwwwmetieclimatemonthly_summarys) This resulted in a large dropin WT An analysis of the precipitation and streamflow ondays 134ndash140 shows that the observed and simulatedstreamflows from Scenario B produced two very differentrainfall runoff responses The observed streamflow showeda large peak in flow whereas the simulated Scenario Bflow showed only a small response to precipitation TheScenario B flow for Julian days 134ndash136 results in almost
Hydrol Process (2012)DOI 101002hyp
0
01
02
minus15
minus10
minus5
0
WT
Dep
th (
cm)
amp H
ourly
Rai
nfal
l (m
m)
0
1
2
Julian Days 2007
Flo
w (
m3 s
minus1 )
Flo
w (
m3 s
minus1 )
minus15
minus10
minus5
0
WT
Dep
th (
cm)
amp H
ourly
Rai
nfal
l (m
m)
340 3405 341 3415 342 3433425 3435 344
minus80
minus60
minus40
minus20
0
134 1345 135 1355 136 1365 137 1375 138
minus80
minus60
minus40
minus20
0Observed FlowScenario B Flow
Houly Rainfall
Observed FlowScenario BSimulated 2007
Hourly Rainfall
WT 2007
WT 2007
Figure 10 (a) For summer 2007 observed and modelled Scenario B flows (b) for winter 2007 observed simulated and Scenario B flows Thesimulated winter (b) and summer (a) WTs are also shown
HYDROLOGICAL RESPONSE OF AFFORESTED PEAT CATCHMENT
no flow in the stream Figure 10(b) shows that the converseoccurred between days 340 and 344 where the simulatedflow from Scenario B was higher than the observed flowAs there is a slight discrepancy between the peak flows andsimulated flows for reasons outlined earlier the simulationof the undisturbed peatland is also shown in Figure 10(b)
DISCUSSION
The comparisons of observed flows and WT depths withthe corresponding simulated values from the GEOtopmodel in the calibration and validation years show thatthe current configuration of GEOtop is capable of reliablysimulating the hydrological processes Central to thisconfiguration for the peatland is the spatial variation ofhydraulic conductivity Areas of low hydraulic conductivityat the margins near the stream are essential in maintainingthe elevated WT in the centre of the bog For the drainagescenarios once these areas of lower hydraulic conductivitywere modified by the insertion of a drainage network theWTs level in the centre of the bog fell Given that even aslight drop in WT impacts the vegetation distribution andcomposition (Sottocornola et al 2009) any disturbance ofthese relatively small areas of lower hydraulic conductivitywill likely affect a much larger area of a bogWhereas the practice of drainage prior to afforestation
of peatlands lowers the WT its depth will also be affectedby the increase in transpiration and canopy interceptionwith the change of land use from natural peatland to Sitkaspruce afforestation From Figure 9 and Table II we notethat the simulated ET increased in the mature forest(Scenario B) to 492mm greater than the pristine peatlandThe ET rate of the younger forest (Scenario A) wassimilar to the undisturbed peatland A study of ET by
Copyright copy 2012 John Wiley amp Sons Ltd
Sottocornola and Kiely (2010) at the same site found thatthe ET was not water limited and the observed ET rangedbetween 369 and 424mm with an average of 394mm ofET over a 5-year period Sottocornola and Kiely (2010)concluded that one of the key limiting factors in ET wasthe lack of vascular plants which if present wouldenhance transpiration Although Figure 9 shows that thereis a drop in the WT for Scenario A particularly in thesummer months at this stage of development of a forestthe tree canopy would not provide full cover As the WTis lower than in the undisturbed peatland the ET ratefrom the original peatland vegetation which has a largeproportion of non-vascular plants will have decreasedThus it would appear that the increase in ET under theSitka spruce canopy is offset by the decrease in ET fromthe original peatland vegetationThe estimated ET (913mm) of Scenario B of a more
mature forest was 412mm higher than Scenario A Suchincreases in ET as a result of changing peatland land usefrom grass mosses and bare peat to Sitka spruce havebeen noted by others Studies by others in areas such asthe Scottish highlands that may be considered similar insoil type and climate to our Irish study site have foundthat Sitka spruce may intercept between 28 (596mm)(Johnson 1990) and 52 (1514mm) (Heal et al 2004)of precipitation Transpiration of Sitka spruce in Cumbriahas been estimated at 12 of precipitation or 172mm(Anderson et al 1990) We note that our estimates of ETfrom Scenario B at 32 of rainfall is in the rangeof values cited in the literature Results from a study bythe Institute of Hydrology (1991) into the effects ofupland afforestation on water resources suggest that ETon a forested catchment receiving 2800mm precipitationannually was approximately 1190mm which is similar to
Hydrol Process (2012)DOI 101002hyp
C LEWIS ET AL
the ET value of 925mm in our Scenario B Other studieson afforested peatlands such as the Marcell experimentalforest in Minnesota and the Huhtisuo catchment inFinland found that ET represented a larger percentageof precipitation than values noted in this study A studyby Verry and Timmons (1982) found that ET from amature Black Spruce forest represented up to 66 of theannual precipitation with Iritz et al (1994) reporting ETvalues of 61 of precipitation in the Huhtisuo catchmentin Finland However precipitation was much lower inboth locations with the Huhtisuo catchment and Marcellforest annually receiving approximately 700 and 800mmprecipitation respectively The climate at both locationsis described as continental with streamflow tending tocease for 2ndash4months of each winter because of lowertemperatures in Marcell (Kolka et al 2001) Thedifference in climate is likely to have resulted in thedifference in simulated and observed ET values in ourstudy and that of those reported from the Huhtisuocatchment and Marcell forest In our site the averageprecipitation over a 5-year period was 2597mm with anaverage ET of 394mm representing approximately 15of precipitation The increased ET associated withafforestation in conjunction with the drainage networkresulted in a WT draw down in dry periods (Figure 9)The WT in Scenarios A and B was on average 165 and205 cm below the observed WT for the calendar year2008 This is similar to the draw down noted by Bragg(2002) where the WT in a forested peatland wasfound to be 100ndash150 cm below that in the adjacentunforested peatlandAs the runoff from peatlands in their natural state
(in Western Europe) is known to be flashy because ofsaturation excess overland flow a lowering of the WT isexpected to reduce the volume of runoff produced fromsaturation excess This is noted in the hydrograph for asummer period in Figure 10(a) which shows the observedand the simulated flows from Scenario B for Julian days134ndash140 The rain event on day 135 was preceded by adry period in April and May 2007 the end of which theWT was observed to be at its lowest level since recordsbegan in 2003 At the start of the precipitation event ofday 135 the WT of Scenario B was 698 cm lower thanthe observed WT of the pristine peatland and 592 cmbelow the drained simulation With this lower WT andreduced precipitation reaching the ground because ofcanopy interception the streamflow from the simulatedforest catchment is greatly reduced However theconverse applies for the streamflow in winter as shownin Figure 10(b) Prior to day 340 there had been frequentrain events which had resulted in a much higher WT bothin the simulated and observed cases A total of 53mm fellon day 340 resulting in a higher simulated than observedflow As the observed WT was 19 cm below the surfaceand Scenario B was just 25 cm below the surface weconsider that both simulations produced saturation excessoverland flow However the forested simulation had amore extensive drainage network that was able to conveyany surface runoff to the catchment outfall more rapidly
Copyright copy 2012 John Wiley amp Sons Ltd
resulting in a higher peak flows Such a phenomenon hasalso been noted by others with Ahti (1980) finding thatincreasing density of drainage ditches increased peakflows in a Finish peatland and model simulations by Iritzet al (1994) noting that peak flows may be increased byforest drainage when the WT is close to the surface Thestudies of Anderson et al (2000) and (Ballard et al 2011b)also drew similar conclusionsThis phenomenon of increasing the streamflow following
afforestation of peatlands may have implications inlarger catchments where afforestation may be falselyconsidered as a flood mitigation measure Likewise thereduction of flows from peatlands throughout thesummer and in particular after dry periods may be ofconcern for water resource managers
CONCLUSION
With regard to applying the hydrological GEOtop modelto an Atlantic blanket peatland we found that GEOtopwas suitable for the purposes of modelling the hydro-logical processes Central to this was the input of thespatial variation of the saturated hydraulic conductivityPeat with a lower hydraulic conductivity at the marginsresults in elevating the WT depth in the centre of the bogwhich in turn results in saturation excess overland flowduring precipitation events It is also clear from thescenario modelling that afforestation and its associateddrainage can change the hydrological response of thispristine peatland catchment Whereas the ET rates from ayoung Sitka spruce catchment were similar to the existingpristine peatland catchment a semi-mature Sitka Spruceforest resulted in an increase in ET of 492mm throughincreased transpiration from the canopy and interceptionThis increase in ET was particularly noticeable in summerand resulted in an increase in depth of the WT andreduction in streamflow However in winter followingperiods of heavy rainfall the WT depth approached thatof an unforested drained peatland This shallow WT depthin combination with a drainage network results in anincrease in peak flow in times of heavy rainfall Thissuggests that there is limited or no benefit to floodattenuation from peatland afforestation during winterperiods when the WT is high whereas the converseapplies to summer flows where the rainfall runoff wasreduced in dry periods
ACKNOWLEDGEMENTS
This study was funded by the Irish EnvironmentalProtection Agency under the Science Technology Researchand Innovation for the Environment Programme 2007ndash2013of Ireland (Soil H Interactions of soil hydrology land useand climate change and their impact on soil quality 2007-S-SL-1-S1) We would like to thank Dr Alice Wemaere of theEnvironmental Protection Agency for her continuoussupport We would also like to thank the SoilH steeringcommittee for their support advise and encouragement
Hydrol Process (2012)DOI 101002hyp
HYDROLOGICAL RESPONSE OF AFFORESTED PEAT CATCHMENT
throughout this project Prof Mark Kibblewhite Dr ArwynJones and Dr Otto Spaargaren We particularly wish tothank our present and past colleagues in the HYDROMETgroup Dr Paul Leahy Mr Nelius Foley Dr Rashid Rafiqueand Dr Michael Wellock We thank Caitriona Douglas ofNPWS and Coillte Teoranta for the permission to use thestudy site We also very much appreciate the support of thedevelopers of GEOtop in particular Prof Riccardo Rigonand Dr Matteo Dallrsquo Amico We acknowledge in particularthe earlier work of Dr Anna Laine Dr Matteo SottocornolaandDrAnn-KristinKoehler and their work and publicationsfrom the same site
REFERENCES
Abbott MB Bathurst JC Cunge JA Oconnell PE Rasmussen J 1986An introduction to the European hydrological systemmdashsystemehydrologique Europeen she 2 Structure of a physically-baseddistributed modeling system Journal of Hydrology 87(1ndash2) 61ndash77
Ahti E 1980 Ditch spacing experiments in estimating the effects ofpeatland drainage on summer runoff Proceedings of the HelsinkiSymposium Helsinki
Anderson AR Pyatt DG 1986 Interception of precipitation by Pole-StageSitka Spruce and Lodgepole Pine and Mature Sitka Spruce at KielderForest Northumberland Forestry 59(1) 29ndash38
Anderson AR Pyatt DG Stannard JP 1990 The effects of clearfelling aSitka Spruce Stand on the water-balance of a peaty gley soil atKershope Forest Cumbria Forestry 63(1) 51ndash71
Anderson AR Day R Pyatt DG 2000 Physical and hydrological impactsof blanket bog afforestation at Bad arsquo Cheo Caithness the first 5 yearsForestry 73(5) 467ndash478
Arnold JG Srinivasan R Muttiah RS Williams JR 1998 Large areahydrologic modeling and assessment Part I model developmentAmerican water resources Association 34(1) 73ndash89
Baird AJ Eades PA Surridge BWJ 2008 The hydraulic structure of araised bog and its implications for ecohydrological modelling of bogdevelopment Ecohydrology 1(4) 289ndash298 DOI 101002Eco33
Ballard CE McIntyre HS Wheater HS Holden J Wallage ZE 2011aHydrological modelling of drained blanket peatland Journal ofHydrology 407 81ndash83 http dxdoiorg101016jjhydrol201107005
Ballard CE Mclntyre N Wheater HS 2011b Effects of peatland drainagemanagement on peak flows Hydrology and Earth System Sciences 86533ndash6563 DOI 105194hessd-8-6533-2011
Bay R 1969 Runoff from small peatland watersheds Journal ofHydrology 9 90ndash102
Bertoldi G Rigon R Over TM 2006 Impact of watershed geomorphiccharacteristics on the energy and water budgets Journal of Hydro-meteorology 7(3) 389ndash403
Bertoldi G Notarnicola C Leitinger G Endrizzi S Zebisch M DellaChiesa S Tappeiner U 2010 Topographical and ecohydrologicalcontrols on land surface temperature in an alpine catchmentEcohydrology 3(2) 189ndash204 DOI 101002Eco129
Beven K Kirkby MJ 1979 A physically based variable contributing areamodel of basin hydrology Hydrological Sciences Bulletin 23 419ndash437
Black K Gallagher G Orsquo Brien P Redmond J Barrett F Twomey M2008 Dispelling myths the ture extent of recent peatland afforestationin Ireland Coford Dublin
Bragg OM 2002 Hydrology of peat-forming wetlands in ScotlandScience of the Total Environment 294(1ndash3) 111ndash129 Pii S0048-9697(02)00059-1
Burke B 1975 Effect of drainage on the hydrology of blanket-bog Irishjournal of agricultural research 14 145ndash62
Byrne KA Farrell EP 2005 The effect of afforestation on soil carbondioxide emissions in blanket peatland in Ireland Forestry 78(3)217ndash227 DOI 101093forestrycpi020
Conway VM Millar A 1969 The hydrology of some small peat-coveredcatchments in the northern Pennines Journal of the Institute of WaterEngineers 14 415ndash24
Dept of Agriculture 1996 Growing for the futuremdasha strategic plan forthe Development of the Forestry Sector in Ireland Dublin
Dunn SM Mackay R 1996 Modelling the hydrological impacts of openditch drainage Journal of Hydrology 179(1ndash4) 37ndash66
Copyright copy 2012 John Wiley amp Sons Ltd
Eaton J McGoff N Byrne K Leahy P Kiely G 2008 Land cover changeand soil organic carbon stocks in the Republic of Ireland 1851ndash2000Climatic Change 91(3ndash4) 317ndash334 DOI 101007s10584-008-9412-2
Frolking S Roulet NT 2007 Holocene radiative forcing impact ofnorthern peatland carbon accumulation and methane emissions GlobalChange Biology 13(5) 1079ndash1088 DOI 101111j1365-2486200701339x
van Genuchten MT 1980 A closed-form equation for predicting thehydraulic conductivity of unsaturated soils Soil Science Society ofAmerica Journal 44(5) 892ndash898
Hargreaves KJ Milne R Cannell MGR 2003 Carbon balance ofafforested peatland in Scotland Forestry 76(3) 299ndash317
Heal KV Stidson RT Dickey CA Cape JN Heal MR 2004 New data forwater losses from mature Sitka spruce plantations in temperate uplandcatchments Hydrological Sciences Journal 49(3) 477ndash493
Hoag RS Price JS 1995 A field-scale natural gradient solute transportexperiment in peat at a Newfoundland blanket bog Journal ofHydrology 172(1ndash4) 171ndash184
Hogan JM van der Kamp G Barbour SL Schmidt R 2006 Fieldmethods for measuring hydraulic properties of peat deposits Hydro-logical Processes 20(17) 3635ndash3649 DOI 101002Hyp6379
Holden J 2005 Peatland hydrology and carbon release why small-scaleprocess matters Philosophical Transactions of the Royal Societya-Mathematical Physical and Engineering Sciences 363(1837)2891ndash2913 DOI 101098rsta20051671
Holden J Burt TP 2002 Infiltration runoff and sediment production inblanket peat catchments implications of field rainfall simulationexperiments Hydrological Processes 16(13) 2537ndash2557 DOI101002Hyp1014
Holden J Burt TP 2003 Hydraulic conductivity in upland blanketpeat measurement and variability Hydrological Processes 17(6)1227ndash1237 DOI 101002Hyp1182
Holden J Chapman PJ Labadz JC 2004 Artificial drainage of peatlandshydrological and hydrochemical process and wetland restorationProgress in Physical Geography 28(1) 95ndash123
Holden J Evans MG Burt TP Horton M 2006 Impact of land drainageon peatland hydrology Journal of Environmental Quality 35(5)1764ndash1778
Holden J Wallage ZE Lane SN McDonald AT 2011 Water tabledynamics in undisturbed drained and restored blanket peat Journal ofHydrology 402(1ndash2) 103ndash114 DOI 101016jjhydrol201103010
Horgan T Keane M McCarthy R Lally M Thompson D 2004 A Guide toForest Tree Species Selection and Silviculture in Ireland Coford Dublin
Hudson JA Gilman K Calder IR 1997 Land use and water issues in theuplands with reference to the Plynlimon study Hydrology and EarthSystem Sciences 1(3) 239ndash397
Institute of Hydrology 1991 Effects of upland afforestation on waterresources the Balquhidder experiment 1981ndash1991 Report no 116Institute of Hydrology Wallingford UK
Iritz L Johansson B Lundin L 1994 Impacts of forest drainage on floodsHydrological Sciences Journal 39(6) 637ndash661
Johnson RC 1990 The interception throughfall and stemflow in a forestin Highland Scotland and the comparison with other upland forests inthe UK Journal of Hydrology 118(1ndash4) 281ndash287
Koehler AK Murphy K Kiely G Sottocornola M 2009 Seasonalvariation of DOC concentration and annual loss of DOC from anAtlantic blanket bog in South Western Ireland Biogeochemistry 95231ndash242 DOI 101007s10533-009-9333-9
Koehler AK Sottocornola M Kiely G 2011 How strong is the currentcarbon sequestration of an Atlantic blanket bog Global ChangeBiology 17(1) 309ndash319 DOI 101111j1365-2486201002180x
Kolka RK Griagal DF Nater EA Verry ES 2001 Hydrologic cycling ofmercury and organic carbon in a forested upland-bog watershed SoilScience Society 65 897ndash905
Lafleur PM Hember RA Admiral SW Roulet NT 2005 Annual andseasonal variability in evapotranspiration and water table at a shrub-covered bog in southern Ontario Canada Hydrological Processes19(18) 3533ndash3550
Laine A Byrne KA Kiely G Tuittila ES 2007 Patterns in vegetationand CO2 dynamics along a water level gradient in a lowland blanketbog Ecosystems 10(6) 890ndash905 DOI 101007s10021-007-9067-2
Lane SN Brookes CJ Kirkby AJ Holden J 2004 A network-indexbasedversion of TOPMODEL for use with high-resolution digital topographicdata Hydrological Processes 18(1) 191ndash201
Lapen DR Price JS Gilbert R 2005 Modelling two-dimensional steady-state groundwater flow and flow sensitivity to boundary conditions inblanket peat complexes Hydrological Processes 19(2) 371ndash386 DOI101002Hyp1507
Hydrol Process (2012)DOI 101002hyp
C LEWIS ET AL
Lees JC 1972 Soil aeration and Sitka Spruce seedling growth in peatJournal of Ecology 60(2) 343ndash349
Letts MG Roulet N Comer NT 2000 Parameterization of peatlandhydraulic properties for the Canadian land surface scheme CanadianMeterological and Oceanographic Society 38 141ndash160
Lewis C Albertson J Xu X Kiely G 2011 Spatial variability of hydraulicconductivity and bulk density along a blanket peatland hillslopeHydrological Processes 26 1527ndash1537 DOI 101002hyp8252
Limpens J Berendse F Blodau C Canadell JG Freeman C Holden JRoulet N Rydin H Schaepman-Strub G 2008 Peatlands and thecarbon cycle from local processes to global implicationsmdasha synthesisBiogeosciences 5(5) 1475ndash1491
Nash JE Sutcliffe JV 1970 River flow forecasting through conceptualmodels part Imdasha discussion of principles Journal of Hydrology 10(3)282ndash290
NFI 2007 National Forest InventorymdashRepublic of IrelandmdashResultsJohnstown Castle Estate Co Wexford Ireland
Nilsson M Sagerfors J Buffam I Laudon H Eriksson T Grelle AKlemedtsson L Weslien P Lindroth A 2008 Contemporary carbonaccumulation in a boreal oligotrophic minerogenic miremdasha significantsink after accounting for all C-fluxes Global Change Biology 14(10)2317ndash2332 DOI 101111j1365-2486200801654x
Oechel WC Vourlitis GL Hastings SJ Zulueta RC Hinzman L Kane D2000 Acclimation of ecosystem CO2 exchange in the Alaskan Arctic inresponse to decadal climate warming Nature 406(6799) 978ndash981
Pilcher JR Mac an tSaoir S 1995 Wood Trees Forests in Ireland RoyalIrish Academy Dublin
Prevost M Belleau P Plamondon AP 1997 Substrate conditions in atreed peatland responses to drainage Ecoscience 4(4) 543ndash554
Price JS Branfireun BA Waddington JM Devito KJ 2005 Advancesin Canadian wetland hydrology 1999ndash2003 Hydrological Processes19(1) 201ndash214 DOI 101002Hyp5774
Ramchunder SJ Brown LE Holden J 2007 Environmental effects ofdrainage drain-blocking and prescribed vegetation burning in UKupland peatlands Progress in Physical Geography 2009(33) 49 DOI1011770309133309105245
Copyright copy 2012 John Wiley amp Sons Ltd
Reggiani P Sivapalan M Hassanizadeh SM 2000 Conservationequations governing hillslope responses exploring the physical basisof water balance Water Resources Research 36(7) 1845ndash1863
Rigon R Bertoldi G Over TM 2006 GEOtop a distributed hydrologicalmodel with coupled water and energy budgets Journal of Hydro-meteorology 7(3) 371ndash388
Robinson M 1986 Changes in catchment runoff following drainage andafforestation Journal of Hydrology 86(1ndash2) 71ndash84
Simoni S Zanotti F Bertoldi G Rigon R 2008 Modelling the probabilityof occurrence of shallow landslides and channelized debris flows usingGEOtop-FS Hydrological Processes 22(4) 532ndash545 DOI 101002Hyp6886
Sottocornola M Kiely G 2010 Energy fluxes and evaporationmechanisms in an Atlantic blanket bog in southwestern Ireland WaterResources Research 46 DOI 1010292010WR009078
Sottocornola M Laine A Kiely G Byrne KA Tuittila ES 2009Vegetation and environmental variation in an Atlantic blanket bog insouthwestern Ireland Plant Ecology 203(1) 69ndash81 DOI 101007s11258-008-9510-2
Strack M Waddington JM Rochefort L Tuittila ES 2006 Response ofvegetation and net ecosystem carbon dioxide exchange at different peatlandmicroforms following water table drawdown Journal of GeophysicalResearch-Biogeosciences 111(G2) DOI 1010292005jg000145
Tobin B Black K Osborne B Reidy B Bolger T Nieuwenhuis M 2006Assessment of allometric algorithms for estimating leaf biomass leafarea index and litter fall in different-aged Sitka spruce forests Forestry79(4) 453ndash465 DOI 101093forestrycpl030
Verry ES Timmons DR 1982 Waterborne nutrient flow through anupland-peatland watershed in Minnesota Ecology 65(5) 1456ndash1467
Waldron S Flowers H Arlaud C Bryant C McFarlane S 2009 Thesignificance of organic carbon and nutrient export from peatland-dominated landscapes subject to disturbance a stoichiometric perspectiveBiogeosciences 6(3) 363ndash374
Zanotti F Endrizzi S Bertoldi G Rigon R 2004 The GEOTOP snowmodule Hydrological Processes 18(18) 3667ndash3679 DOI 101002Hyp5794
Hydrol Process (2012)DOI 101002hyp
HYDROLOGICAL RESPONSE OF AFFORESTED PEAT CATCHMENT
an Obsermet OMC-200 Observator BV The Netherlands)and a WT level recorder that consists of a pressuretransducer (PCDR1830 Campbell Scientific UK) placedinside a metal well pierced all along its height Wind speedwas recorded with a 2D sonic anemometer (WindSonicGill UK) Air temperature and relative humidity weremeasured at 2-m height with a shielded probe (HMP45CVaisala Finland) whereas atmospheric pressure wasrecorded with a barometer (PTB101B Vaisala Finland)An eddy covariance system for CO2 fluxes was alsolocated on the same tower It consisted of a 3D sonicanemometer (Model 81000 RM Young Company USA)and an open-path infrared gas analyzer for H2O and CO2
concentrations (LI-7500 LI-COR USA) mounted 3mabove the vegetation
Climate
Sottocornola and Kiely (2010) at the same site foundthat the range of annual rainfall (2002ndash2009) was2236ndash3365mm with an annual average of 2597mm Theannual ET (estimated using eddy covariance methods)ranged from 369 to 424mm with an annual average of394mm From2002 to 2009 therewas an annual average of208 wet days (gt1mmday1) (Koehler et al 2009) Theaverage annual air temperature was 105 CThe recorded flow at the stream outfall (see Figure 1)
ranged between 0015 and 100 l s1 ha1 (Koehler et al2009) with the 95 percentile flow exceeding 0037 l s1
ha1 The flow was observed to be flashy with over 90
of the streamflow sourced from surface runoff (Lewiset al 2011) This is due to a perennially high WT thatwas observed continuously over the 7 years 2002ndash2009to be within 17 cm of the land surface (with the 7-yearmean WT at ~4 cm below the surface) at the eddycovariancemeteorological station Although additionalWT observation stations would be beneficial the site iswell known to the authorsrsquo through frequent site visitsand it is considered that the WT measurements arerepresentative of the peatland A manual WT observationstation was established in 2009 near the stream and theWT was found to vary between 0 and 10 cm below thesurface Observations were taken approximately sixndasheighttimes a year particularly during dry periods Lewis et al(2011) investigated the spatial variation of bulk densityand saturated hydraulic conductivity at the same site andfound that at the surface (top 10 cm) saturated horizontalhydraulic conductivity was lowest at the bog margin nearthe stream (~107m s1) and increased at the bog interior(~105m s1) The converse was found for bulk densitywhich ranged from ~011 g cm3 at the bog marginto ~ 0055 g cm3 near the bog interior
Process-based hydrological model ndash GEOtop
The process-based hydrological model GEOtop (Rigonet al 2006) was used in this study It is a distributedhydrological model (operating on a 8m 8m grid) andsimulates the complete hydrological balance in acontinuous way during a whole year (at a temporal
Copyright copy 2012 John Wiley amp Sons Ltd
increment of 60min) It uses geospatial data (eg topographysoil type vertical and horizontal hydraulic conductivitydepth and the Van Genuchten parameters a and n(van Genuchten 1980)) vegetation cover (including cropheight Leaf Area Index (LAI) and root depth) and landcover It provides spatially distributed output fields aswell as routing water and sediment flows through streamand river networksGEOtop includes a rigorous treatment of the core
hydrological processes (eg unsaturated and saturated flowand transport surface energy balances and streamflowgenerationrouting) Unsaturated dynamics are treated witha 3D integration of Richardsrsquo equation whereas surfacerunoff is routed via a kinematic wave The spacendashtimefields of radiation that drive the evaporative processesaccount for terrain effects such as aspect slope andshading The energy processes in GEOtop have beenextensively tested and validated (Bertoldi et al 2006)Using GEOtop in an alpine catchment Bertoldi et al(2010) showed that the major factors controlling the landsurface temperature in a humid climate were incomingsolar radiation and land cover variability Others have alsotaken the GEOtop model and added further modules to itincluding a snow module by Zanotti et al (2004) and alandside probability function by Simoni et al (2008)The hourly meteorological data required (precipitation
atmospheric pressure temperature global shortwave radi-ation relative humidity and wind speed and direction) byGEOtop were available from the on site meteorologicaltower A field measurement study by Lewis et al (2011) atthe same site found that the saturated horizontal hydraulicconductivity in the riparian zone within 10m of the streamwas ~107 m s1 which was one to two orders ofmagnitude less conductive than the bog interior Thesaturated horizontal conductivity was found to beapproximately twice vertical hydraulic conductivity Toreflect this pattern in the soil matrix in GEOtop the peatwithin 10m of the stream was assigned the hydraulicparameters found by Lewis et al (2011) in the riparianzone A second zone was created between 10 and 20mfrom the stream and the peat in this zone was assigned ahigher hydraulic conductivity value An incrementalprocess of increasing the hydraulic conductivity wasutilized until at the bog interior the saturated hydraulicconductivity assigned was ~105 m s1 Vegetationdetails (LAI height and root depth) were adopted fromSottocornola et al (2009) and Laine et al (2007)
Modelling scenarios
To reflect the practice of draining peatland prior toafforestation an artificial drainage network was simulatedfor this GEOtop application This consisted of a series ofditches placed 8m apart and 350mm deep The ditchesran orthogonal to the contours and drained into the streamrunning through the centre of the bog Initial trials of thisnew drainage network found however that there waslittle change in the WT Peatland drains have been found tolower the WT adjacent to the drains specifically downslope
Hydrol Process (2012)DOI 101002hyp
C LEWIS ET AL
of drains as the drains intercept the surface runoff fromupslope areas (Holden et al 2006) Because of modelconstraints it was not possible to increase the drainagenetwork density to achieve a realistic WT drawdown Itwas therefore decided to increase the horizontalconductivity of the peatland to represent the changedtravel time for water from the peat matrix to the drainagenetwork that a peatland with a higher density of drainswould have However it must also be noted that thisincrease in horizontal conductivity is also likely toreflect the increase in hydraulic conductivity caused bychanges in soil structure associated with WT drawdown(Ramchunder et al 2007)Two possible land use change scenarios were simulated
in this study changing the land use from natural peatlandto a 10-year-old (Scenatio A) and a 15-year-old (ScenarioB ) Sitka spruce forest The LAI was adopted from Tobinet al (2006) in a study on LAI in different ages ofSitka spruce forests in Ireland Sitka spruce forests atapproximately 15 years of age have the highest LAI and
0 50 100 150 200 250 300 3500
05
1
15
2
Julian Day 2007
Flo
w (
m s
minus1 )
Observed FlowSimulated Flow
Figure 2 Observed and simulated flows for 2007 at hourly intervals
0 100 200 3000
500
1000
1500
2000
2500
Julian Days
Flo
w (
mm
)
RainfallObserved FlowSimulated Flow
(a)
Figure 3 For 2007 (a) cumulative rainfall observed flow and simulatesimulated
Copyright copy 2012 John Wiley amp Sons Ltd
therefore deemed to have the largest impact on the rainfallrunoff response mainly from increased interception andtranspiration The changes to the model for Scenario Awere made by increasing the LAI to 45 root depth to40 cm and canopy height to 250 cm For Scenario B theLAI root depth and canopy height were increased to 7555 and 800 cm respectively Along with the change inland use both of these scenarios also included a newdrainage network to reflect the practice of drainingpeatlands prior to afforestation
RESULTS
The model was calibrated using observed data for 2007Figure 2 shows the time series of observed and GEOtopmodelled flows with in a NashndashSutcliffe (Nash andSutcliffe 1970) efficiency of 087 The difference betweenobserved and simulated flows is greatest in times of highflows where the simulated flow is larger than the observedHowever at times of high flow the observed flows may beunderestimated as flow spills overbank and no streamflowmeasurements were recorded for overbank flow (becauseof safety reasons) The cumulative rainfall (2229mm)observed streamflow (1925mm) and simulated streamflow(2018 mm) are shown in Figure 3(a) The modelled ET of~211mm for 2007 is lower than both the observed value of304mm and the nearby eddy covariance estimate of ETof 388mm for the hydrological year 20062007 reportedby Sottocornola and Kiely (2010) Monthly totals ofsimulated flow compare well with observed values(Figure 3(b)) as do the instantaneous values of simulatedand observed flows (Figure 3(c)) with the exception ofthe very highest flows We believe this is due to theoverbank flow for which our high observed flows arelikely to be underestimated
JanFebMarArpMayJun Jul AugSepOctNovDec0
1
2
3
4x 10
5
Flo
w (
m3 )
0 05 1 150
05
1
15
Observed flows (m3 sminus1)
Sim
ulat
ed fl
ows
(m3
sminus1 )
Observed FlowSimulated Flow
R2= 091
(b)
(c)
d flow (b) monthly observed and simulated flows (c) observed andflows
Hydrol Process (2012)DOI 101002hyp
HYDROLOGICAL RESPONSE OF AFFORESTED PEAT CATCHMENT
The observed and simulated WT depths are shown inFigure 4 The model simulates WT over the full extent ofthe bog and will be somewhat different to the observedWT which was from one WT sensor point Examining
0 50 100 150 200 250 300 350
0
Dep
th o
f wat
er ta
ble
belo
w s
urfa
ce (
cm)
minus30
minus25
minus20
minus15
minus10
minus5
minus100
minus50
0
Julian Day 2007D
aily
Rai
nfal
l (m
m)
Observed WTSimulated WTDaily Rainfall
Figure 4 For 2007 daily rainfall (top) observed and simulated water table
0 100 200 3000
500
1000
1500
2000
2500
3000
Julian Days
Flo
w (
mm
)
RainfallObserved FlowSimulated Flow
(a)
Figure 6 For 2008 (a) cumulative rainfall observed flow and simulated flow
0 50 100 150 200 250 300 3500
02
04
06
08
1
12
14
Julian Day 2008
Flo
w (
m s
minus1 )
Observed FlowSimulated Flow
Figure 5 Observed and simulated flows for 2008 at hourly intervals
Copyright copy 2012 John Wiley amp Sons Ltd
Figure 4 for 2007 we note that the time series trends ofboth observed and simulated WTs agree even thoughthe absolute values are somewhat different For theinstantaneous WT (Figure 4) the range is larger for thesimulated WT but again not hugely different The annualmean observed WT (Figure 4) was 387 cm below thesurface compared with the simulated WT of 485 cmThis WT difference is under 1 cm From Figures 2ndash4 wesuggest that GEOtop simulates well the hydrologicalprocess in the peatland for the calibration yearOnce the model was calibrated for 2007 it was then
validated (no change to parameters) for 2008 Figures 5ndash7and Table II show the results of the 2008 simulation TheNashndashSutcliffe efficiency of 089 for 2008 showed aslight improvement on the 2007 value of 087 whereasthe simulated flow was slightly greater than the observedflow (Figure 6) The simulated WT had an annual meanvalue of 29 cm below the surface whereas the observed
JanFebMarArpMayJun Jul AugSepOctNovDec0
1
2
3
4x 10
5
Flo
w (
m3 )
Observed FlowSimulated Flow
0 05 1 150
05
1
15
Recorded Flows (m3 sminus1)
Sim
ulat
ed F
low
s m
3 sminus
1
R2= 092
(c)
(b)
(b) monthly observed and simulated flows (c) observed and simulated flows
Dep
th o
f wat
er ta
ble
belo
w s
urfa
ce (
cm)
minus25
minus20
minus15
minus10
minus5
0
0 50 100 150 200 250 300 350
minus100
minus50
0
Julian Day 2008
Dai
ly R
ainf
all (
mm
)
Observed WTSimulated WTDaily Rainfall
Figure 7 For 2008 daily rainfall (top) observed and simulated watertable depth
Hydrol Process (2012)DOI 101002hyp
Table II Observed and modelled scenarios rainfall evapotranspiration and streamflow values
Scenario Year Rainfall (mm) Evapotranspiration (mm) Streamflow (mm) Streamflowrainfall ratio
Observed 2007 2229 304 1925 075Calibrated model 2007 2229 211 2018 082Observed 2008 2826 421 2405 085Validated model 2008 2826 330 2496 088Scenario A 2008 2826 501 2325 083Scenario B 2008 2826 913 1913 067
0 50 100 150 200 250 300 350minus70
minus60
minus50
minus40
minus30
minus20
minus10
0
10
Julian Day 2008
Dep
th o
f wat
er ta
ble
belo
w s
urfa
ce(c
m)
Observed WTDrained PeatlandScenario AScenario B
Figure 8 For 2008 water table for observed drained peat Scenario Aand Scenario B
0 50 100 150 200 250 300 3500
500
1000
1500
2000
2500
3000
Julian Day 2008
Flo
w m
3 sminus
1
Rainfall (1)Observed flow (2)Scenario A (3)Scenario B (4)
(3)
(4)
(1)
(2)
Figure 9 Cumulative rainfall observed flow simulated flow ScenarioA and Scenario B flows
C LEWIS ET AL
WT had an annual mean depth of 35 cm below thesurface for 2008 These figures show that GEOtopprovides a similar level of accuracy for the validationyear 2008 as it did for the calibration year 2007 Fromthis we suggest that the current configuration of GEOtopsimulates well the hydrological processes in the Glencarblanket peatland and that we are able to proceed with astudy of land use change scenariosThe overall goal of this project is to study the change
in hydrological response of peatland when land use ischanged from its natural state to forestry It is not possibleto do this by simply changing the land use in the modelas in practice peatlands are drained prior to planting(Holden et al 2004) To reflect this the drainage networkin the model was modified and a series of new networkdrains was inserted into the model The model was thenrun again for the 2 years 2007 and 2008 with land usechange Scenarios A and B Although the model was runfor 2 years the cumulative flow and ET values are shownin Figure 9 for 2008 only after allowing the model to spinup for the first 3months of 2007The changes in WT due to the drainage and land use
change scenarios are shown in Figure 8 The simulateddrained peatland showed a drop in WT particularly in thesummer months with the annual mean drained WT150 cm below the surface and 115 cm below theobserved WT The annual mean observed WT depth for2008 was 35 cm below the surface whereas with meansimulated WT depths for scenarios A and B were 120and 240 cm respectively (see Figure 8)The cumulative rainfall (2826mm) observed flow
(2405mm) and simulated flows (2325 for Scenario A and1913mm for Scenario B) for 2008 are shown in Figure 9From this we estimate that ET from the peatland is~420mm in 2008 which is similar to the highest value(424mm) of the eddy covariance estimated ET reportedby Sottocornola and Kiely (2010) in the period 2002ndash2007Scenario A showed very little change in ET from theundisturbed peatland whereas the ET for Scenario B was925mm an increase of 492mm when compared with theobserved ET in 2008 The total annual simulatedstreamflow for Scenarios A and B were reduced to 96and 80 respectively of the observed flow A comparisonof the streamflow between the observed flow and ScenarioB did not show that Scenario B was consistently reducedby 80 It showed rather that Scenario B had at differenttimes of the year both higher (typically in winter) andlower streamflows (typically summer) than the observed
Copyright copy 2012 John Wiley amp Sons Ltd
streamflow This is illustrated in Figure 10(a) and (b)Figure 10(a) shows the observed flow and the flow fromScenario B from Julian day 134 to day 140 2007 Apriland May 2007 were unusually dry with April being one ofthe driest on record at two nearby Met Eireann (Irishweather service) synoptic weather stations and belowaverage rainfall was reported in May (httpwwwmetieclimatemonthly_summarys) This resulted in a large dropin WT An analysis of the precipitation and streamflow ondays 134ndash140 shows that the observed and simulatedstreamflows from Scenario B produced two very differentrainfall runoff responses The observed streamflow showeda large peak in flow whereas the simulated Scenario Bflow showed only a small response to precipitation TheScenario B flow for Julian days 134ndash136 results in almost
Hydrol Process (2012)DOI 101002hyp
0
01
02
minus15
minus10
minus5
0
WT
Dep
th (
cm)
amp H
ourly
Rai
nfal
l (m
m)
0
1
2
Julian Days 2007
Flo
w (
m3 s
minus1 )
Flo
w (
m3 s
minus1 )
minus15
minus10
minus5
0
WT
Dep
th (
cm)
amp H
ourly
Rai
nfal
l (m
m)
340 3405 341 3415 342 3433425 3435 344
minus80
minus60
minus40
minus20
0
134 1345 135 1355 136 1365 137 1375 138
minus80
minus60
minus40
minus20
0Observed FlowScenario B Flow
Houly Rainfall
Observed FlowScenario BSimulated 2007
Hourly Rainfall
WT 2007
WT 2007
Figure 10 (a) For summer 2007 observed and modelled Scenario B flows (b) for winter 2007 observed simulated and Scenario B flows Thesimulated winter (b) and summer (a) WTs are also shown
HYDROLOGICAL RESPONSE OF AFFORESTED PEAT CATCHMENT
no flow in the stream Figure 10(b) shows that the converseoccurred between days 340 and 344 where the simulatedflow from Scenario B was higher than the observed flowAs there is a slight discrepancy between the peak flows andsimulated flows for reasons outlined earlier the simulationof the undisturbed peatland is also shown in Figure 10(b)
DISCUSSION
The comparisons of observed flows and WT depths withthe corresponding simulated values from the GEOtopmodel in the calibration and validation years show thatthe current configuration of GEOtop is capable of reliablysimulating the hydrological processes Central to thisconfiguration for the peatland is the spatial variation ofhydraulic conductivity Areas of low hydraulic conductivityat the margins near the stream are essential in maintainingthe elevated WT in the centre of the bog For the drainagescenarios once these areas of lower hydraulic conductivitywere modified by the insertion of a drainage network theWTs level in the centre of the bog fell Given that even aslight drop in WT impacts the vegetation distribution andcomposition (Sottocornola et al 2009) any disturbance ofthese relatively small areas of lower hydraulic conductivitywill likely affect a much larger area of a bogWhereas the practice of drainage prior to afforestation
of peatlands lowers the WT its depth will also be affectedby the increase in transpiration and canopy interceptionwith the change of land use from natural peatland to Sitkaspruce afforestation From Figure 9 and Table II we notethat the simulated ET increased in the mature forest(Scenario B) to 492mm greater than the pristine peatlandThe ET rate of the younger forest (Scenario A) wassimilar to the undisturbed peatland A study of ET by
Copyright copy 2012 John Wiley amp Sons Ltd
Sottocornola and Kiely (2010) at the same site found thatthe ET was not water limited and the observed ET rangedbetween 369 and 424mm with an average of 394mm ofET over a 5-year period Sottocornola and Kiely (2010)concluded that one of the key limiting factors in ET wasthe lack of vascular plants which if present wouldenhance transpiration Although Figure 9 shows that thereis a drop in the WT for Scenario A particularly in thesummer months at this stage of development of a forestthe tree canopy would not provide full cover As the WTis lower than in the undisturbed peatland the ET ratefrom the original peatland vegetation which has a largeproportion of non-vascular plants will have decreasedThus it would appear that the increase in ET under theSitka spruce canopy is offset by the decrease in ET fromthe original peatland vegetationThe estimated ET (913mm) of Scenario B of a more
mature forest was 412mm higher than Scenario A Suchincreases in ET as a result of changing peatland land usefrom grass mosses and bare peat to Sitka spruce havebeen noted by others Studies by others in areas such asthe Scottish highlands that may be considered similar insoil type and climate to our Irish study site have foundthat Sitka spruce may intercept between 28 (596mm)(Johnson 1990) and 52 (1514mm) (Heal et al 2004)of precipitation Transpiration of Sitka spruce in Cumbriahas been estimated at 12 of precipitation or 172mm(Anderson et al 1990) We note that our estimates of ETfrom Scenario B at 32 of rainfall is in the rangeof values cited in the literature Results from a study bythe Institute of Hydrology (1991) into the effects ofupland afforestation on water resources suggest that ETon a forested catchment receiving 2800mm precipitationannually was approximately 1190mm which is similar to
Hydrol Process (2012)DOI 101002hyp
C LEWIS ET AL
the ET value of 925mm in our Scenario B Other studieson afforested peatlands such as the Marcell experimentalforest in Minnesota and the Huhtisuo catchment inFinland found that ET represented a larger percentageof precipitation than values noted in this study A studyby Verry and Timmons (1982) found that ET from amature Black Spruce forest represented up to 66 of theannual precipitation with Iritz et al (1994) reporting ETvalues of 61 of precipitation in the Huhtisuo catchmentin Finland However precipitation was much lower inboth locations with the Huhtisuo catchment and Marcellforest annually receiving approximately 700 and 800mmprecipitation respectively The climate at both locationsis described as continental with streamflow tending tocease for 2ndash4months of each winter because of lowertemperatures in Marcell (Kolka et al 2001) Thedifference in climate is likely to have resulted in thedifference in simulated and observed ET values in ourstudy and that of those reported from the Huhtisuocatchment and Marcell forest In our site the averageprecipitation over a 5-year period was 2597mm with anaverage ET of 394mm representing approximately 15of precipitation The increased ET associated withafforestation in conjunction with the drainage networkresulted in a WT draw down in dry periods (Figure 9)The WT in Scenarios A and B was on average 165 and205 cm below the observed WT for the calendar year2008 This is similar to the draw down noted by Bragg(2002) where the WT in a forested peatland wasfound to be 100ndash150 cm below that in the adjacentunforested peatlandAs the runoff from peatlands in their natural state
(in Western Europe) is known to be flashy because ofsaturation excess overland flow a lowering of the WT isexpected to reduce the volume of runoff produced fromsaturation excess This is noted in the hydrograph for asummer period in Figure 10(a) which shows the observedand the simulated flows from Scenario B for Julian days134ndash140 The rain event on day 135 was preceded by adry period in April and May 2007 the end of which theWT was observed to be at its lowest level since recordsbegan in 2003 At the start of the precipitation event ofday 135 the WT of Scenario B was 698 cm lower thanthe observed WT of the pristine peatland and 592 cmbelow the drained simulation With this lower WT andreduced precipitation reaching the ground because ofcanopy interception the streamflow from the simulatedforest catchment is greatly reduced However theconverse applies for the streamflow in winter as shownin Figure 10(b) Prior to day 340 there had been frequentrain events which had resulted in a much higher WT bothin the simulated and observed cases A total of 53mm fellon day 340 resulting in a higher simulated than observedflow As the observed WT was 19 cm below the surfaceand Scenario B was just 25 cm below the surface weconsider that both simulations produced saturation excessoverland flow However the forested simulation had amore extensive drainage network that was able to conveyany surface runoff to the catchment outfall more rapidly
Copyright copy 2012 John Wiley amp Sons Ltd
resulting in a higher peak flows Such a phenomenon hasalso been noted by others with Ahti (1980) finding thatincreasing density of drainage ditches increased peakflows in a Finish peatland and model simulations by Iritzet al (1994) noting that peak flows may be increased byforest drainage when the WT is close to the surface Thestudies of Anderson et al (2000) and (Ballard et al 2011b)also drew similar conclusionsThis phenomenon of increasing the streamflow following
afforestation of peatlands may have implications inlarger catchments where afforestation may be falselyconsidered as a flood mitigation measure Likewise thereduction of flows from peatlands throughout thesummer and in particular after dry periods may be ofconcern for water resource managers
CONCLUSION
With regard to applying the hydrological GEOtop modelto an Atlantic blanket peatland we found that GEOtopwas suitable for the purposes of modelling the hydro-logical processes Central to this was the input of thespatial variation of the saturated hydraulic conductivityPeat with a lower hydraulic conductivity at the marginsresults in elevating the WT depth in the centre of the bogwhich in turn results in saturation excess overland flowduring precipitation events It is also clear from thescenario modelling that afforestation and its associateddrainage can change the hydrological response of thispristine peatland catchment Whereas the ET rates from ayoung Sitka spruce catchment were similar to the existingpristine peatland catchment a semi-mature Sitka Spruceforest resulted in an increase in ET of 492mm throughincreased transpiration from the canopy and interceptionThis increase in ET was particularly noticeable in summerand resulted in an increase in depth of the WT andreduction in streamflow However in winter followingperiods of heavy rainfall the WT depth approached thatof an unforested drained peatland This shallow WT depthin combination with a drainage network results in anincrease in peak flow in times of heavy rainfall Thissuggests that there is limited or no benefit to floodattenuation from peatland afforestation during winterperiods when the WT is high whereas the converseapplies to summer flows where the rainfall runoff wasreduced in dry periods
ACKNOWLEDGEMENTS
This study was funded by the Irish EnvironmentalProtection Agency under the Science Technology Researchand Innovation for the Environment Programme 2007ndash2013of Ireland (Soil H Interactions of soil hydrology land useand climate change and their impact on soil quality 2007-S-SL-1-S1) We would like to thank Dr Alice Wemaere of theEnvironmental Protection Agency for her continuoussupport We would also like to thank the SoilH steeringcommittee for their support advise and encouragement
Hydrol Process (2012)DOI 101002hyp
HYDROLOGICAL RESPONSE OF AFFORESTED PEAT CATCHMENT
throughout this project Prof Mark Kibblewhite Dr ArwynJones and Dr Otto Spaargaren We particularly wish tothank our present and past colleagues in the HYDROMETgroup Dr Paul Leahy Mr Nelius Foley Dr Rashid Rafiqueand Dr Michael Wellock We thank Caitriona Douglas ofNPWS and Coillte Teoranta for the permission to use thestudy site We also very much appreciate the support of thedevelopers of GEOtop in particular Prof Riccardo Rigonand Dr Matteo Dallrsquo Amico We acknowledge in particularthe earlier work of Dr Anna Laine Dr Matteo SottocornolaandDrAnn-KristinKoehler and their work and publicationsfrom the same site
REFERENCES
Abbott MB Bathurst JC Cunge JA Oconnell PE Rasmussen J 1986An introduction to the European hydrological systemmdashsystemehydrologique Europeen she 2 Structure of a physically-baseddistributed modeling system Journal of Hydrology 87(1ndash2) 61ndash77
Ahti E 1980 Ditch spacing experiments in estimating the effects ofpeatland drainage on summer runoff Proceedings of the HelsinkiSymposium Helsinki
Anderson AR Pyatt DG 1986 Interception of precipitation by Pole-StageSitka Spruce and Lodgepole Pine and Mature Sitka Spruce at KielderForest Northumberland Forestry 59(1) 29ndash38
Anderson AR Pyatt DG Stannard JP 1990 The effects of clearfelling aSitka Spruce Stand on the water-balance of a peaty gley soil atKershope Forest Cumbria Forestry 63(1) 51ndash71
Anderson AR Day R Pyatt DG 2000 Physical and hydrological impactsof blanket bog afforestation at Bad arsquo Cheo Caithness the first 5 yearsForestry 73(5) 467ndash478
Arnold JG Srinivasan R Muttiah RS Williams JR 1998 Large areahydrologic modeling and assessment Part I model developmentAmerican water resources Association 34(1) 73ndash89
Baird AJ Eades PA Surridge BWJ 2008 The hydraulic structure of araised bog and its implications for ecohydrological modelling of bogdevelopment Ecohydrology 1(4) 289ndash298 DOI 101002Eco33
Ballard CE McIntyre HS Wheater HS Holden J Wallage ZE 2011aHydrological modelling of drained blanket peatland Journal ofHydrology 407 81ndash83 http dxdoiorg101016jjhydrol201107005
Ballard CE Mclntyre N Wheater HS 2011b Effects of peatland drainagemanagement on peak flows Hydrology and Earth System Sciences 86533ndash6563 DOI 105194hessd-8-6533-2011
Bay R 1969 Runoff from small peatland watersheds Journal ofHydrology 9 90ndash102
Bertoldi G Rigon R Over TM 2006 Impact of watershed geomorphiccharacteristics on the energy and water budgets Journal of Hydro-meteorology 7(3) 389ndash403
Bertoldi G Notarnicola C Leitinger G Endrizzi S Zebisch M DellaChiesa S Tappeiner U 2010 Topographical and ecohydrologicalcontrols on land surface temperature in an alpine catchmentEcohydrology 3(2) 189ndash204 DOI 101002Eco129
Beven K Kirkby MJ 1979 A physically based variable contributing areamodel of basin hydrology Hydrological Sciences Bulletin 23 419ndash437
Black K Gallagher G Orsquo Brien P Redmond J Barrett F Twomey M2008 Dispelling myths the ture extent of recent peatland afforestationin Ireland Coford Dublin
Bragg OM 2002 Hydrology of peat-forming wetlands in ScotlandScience of the Total Environment 294(1ndash3) 111ndash129 Pii S0048-9697(02)00059-1
Burke B 1975 Effect of drainage on the hydrology of blanket-bog Irishjournal of agricultural research 14 145ndash62
Byrne KA Farrell EP 2005 The effect of afforestation on soil carbondioxide emissions in blanket peatland in Ireland Forestry 78(3)217ndash227 DOI 101093forestrycpi020
Conway VM Millar A 1969 The hydrology of some small peat-coveredcatchments in the northern Pennines Journal of the Institute of WaterEngineers 14 415ndash24
Dept of Agriculture 1996 Growing for the futuremdasha strategic plan forthe Development of the Forestry Sector in Ireland Dublin
Dunn SM Mackay R 1996 Modelling the hydrological impacts of openditch drainage Journal of Hydrology 179(1ndash4) 37ndash66
Copyright copy 2012 John Wiley amp Sons Ltd
Eaton J McGoff N Byrne K Leahy P Kiely G 2008 Land cover changeand soil organic carbon stocks in the Republic of Ireland 1851ndash2000Climatic Change 91(3ndash4) 317ndash334 DOI 101007s10584-008-9412-2
Frolking S Roulet NT 2007 Holocene radiative forcing impact ofnorthern peatland carbon accumulation and methane emissions GlobalChange Biology 13(5) 1079ndash1088 DOI 101111j1365-2486200701339x
van Genuchten MT 1980 A closed-form equation for predicting thehydraulic conductivity of unsaturated soils Soil Science Society ofAmerica Journal 44(5) 892ndash898
Hargreaves KJ Milne R Cannell MGR 2003 Carbon balance ofafforested peatland in Scotland Forestry 76(3) 299ndash317
Heal KV Stidson RT Dickey CA Cape JN Heal MR 2004 New data forwater losses from mature Sitka spruce plantations in temperate uplandcatchments Hydrological Sciences Journal 49(3) 477ndash493
Hoag RS Price JS 1995 A field-scale natural gradient solute transportexperiment in peat at a Newfoundland blanket bog Journal ofHydrology 172(1ndash4) 171ndash184
Hogan JM van der Kamp G Barbour SL Schmidt R 2006 Fieldmethods for measuring hydraulic properties of peat deposits Hydro-logical Processes 20(17) 3635ndash3649 DOI 101002Hyp6379
Holden J 2005 Peatland hydrology and carbon release why small-scaleprocess matters Philosophical Transactions of the Royal Societya-Mathematical Physical and Engineering Sciences 363(1837)2891ndash2913 DOI 101098rsta20051671
Holden J Burt TP 2002 Infiltration runoff and sediment production inblanket peat catchments implications of field rainfall simulationexperiments Hydrological Processes 16(13) 2537ndash2557 DOI101002Hyp1014
Holden J Burt TP 2003 Hydraulic conductivity in upland blanketpeat measurement and variability Hydrological Processes 17(6)1227ndash1237 DOI 101002Hyp1182
Holden J Chapman PJ Labadz JC 2004 Artificial drainage of peatlandshydrological and hydrochemical process and wetland restorationProgress in Physical Geography 28(1) 95ndash123
Holden J Evans MG Burt TP Horton M 2006 Impact of land drainageon peatland hydrology Journal of Environmental Quality 35(5)1764ndash1778
Holden J Wallage ZE Lane SN McDonald AT 2011 Water tabledynamics in undisturbed drained and restored blanket peat Journal ofHydrology 402(1ndash2) 103ndash114 DOI 101016jjhydrol201103010
Horgan T Keane M McCarthy R Lally M Thompson D 2004 A Guide toForest Tree Species Selection and Silviculture in Ireland Coford Dublin
Hudson JA Gilman K Calder IR 1997 Land use and water issues in theuplands with reference to the Plynlimon study Hydrology and EarthSystem Sciences 1(3) 239ndash397
Institute of Hydrology 1991 Effects of upland afforestation on waterresources the Balquhidder experiment 1981ndash1991 Report no 116Institute of Hydrology Wallingford UK
Iritz L Johansson B Lundin L 1994 Impacts of forest drainage on floodsHydrological Sciences Journal 39(6) 637ndash661
Johnson RC 1990 The interception throughfall and stemflow in a forestin Highland Scotland and the comparison with other upland forests inthe UK Journal of Hydrology 118(1ndash4) 281ndash287
Koehler AK Murphy K Kiely G Sottocornola M 2009 Seasonalvariation of DOC concentration and annual loss of DOC from anAtlantic blanket bog in South Western Ireland Biogeochemistry 95231ndash242 DOI 101007s10533-009-9333-9
Koehler AK Sottocornola M Kiely G 2011 How strong is the currentcarbon sequestration of an Atlantic blanket bog Global ChangeBiology 17(1) 309ndash319 DOI 101111j1365-2486201002180x
Kolka RK Griagal DF Nater EA Verry ES 2001 Hydrologic cycling ofmercury and organic carbon in a forested upland-bog watershed SoilScience Society 65 897ndash905
Lafleur PM Hember RA Admiral SW Roulet NT 2005 Annual andseasonal variability in evapotranspiration and water table at a shrub-covered bog in southern Ontario Canada Hydrological Processes19(18) 3533ndash3550
Laine A Byrne KA Kiely G Tuittila ES 2007 Patterns in vegetationand CO2 dynamics along a water level gradient in a lowland blanketbog Ecosystems 10(6) 890ndash905 DOI 101007s10021-007-9067-2
Lane SN Brookes CJ Kirkby AJ Holden J 2004 A network-indexbasedversion of TOPMODEL for use with high-resolution digital topographicdata Hydrological Processes 18(1) 191ndash201
Lapen DR Price JS Gilbert R 2005 Modelling two-dimensional steady-state groundwater flow and flow sensitivity to boundary conditions inblanket peat complexes Hydrological Processes 19(2) 371ndash386 DOI101002Hyp1507
Hydrol Process (2012)DOI 101002hyp
C LEWIS ET AL
Lees JC 1972 Soil aeration and Sitka Spruce seedling growth in peatJournal of Ecology 60(2) 343ndash349
Letts MG Roulet N Comer NT 2000 Parameterization of peatlandhydraulic properties for the Canadian land surface scheme CanadianMeterological and Oceanographic Society 38 141ndash160
Lewis C Albertson J Xu X Kiely G 2011 Spatial variability of hydraulicconductivity and bulk density along a blanket peatland hillslopeHydrological Processes 26 1527ndash1537 DOI 101002hyp8252
Limpens J Berendse F Blodau C Canadell JG Freeman C Holden JRoulet N Rydin H Schaepman-Strub G 2008 Peatlands and thecarbon cycle from local processes to global implicationsmdasha synthesisBiogeosciences 5(5) 1475ndash1491
Nash JE Sutcliffe JV 1970 River flow forecasting through conceptualmodels part Imdasha discussion of principles Journal of Hydrology 10(3)282ndash290
NFI 2007 National Forest InventorymdashRepublic of IrelandmdashResultsJohnstown Castle Estate Co Wexford Ireland
Nilsson M Sagerfors J Buffam I Laudon H Eriksson T Grelle AKlemedtsson L Weslien P Lindroth A 2008 Contemporary carbonaccumulation in a boreal oligotrophic minerogenic miremdasha significantsink after accounting for all C-fluxes Global Change Biology 14(10)2317ndash2332 DOI 101111j1365-2486200801654x
Oechel WC Vourlitis GL Hastings SJ Zulueta RC Hinzman L Kane D2000 Acclimation of ecosystem CO2 exchange in the Alaskan Arctic inresponse to decadal climate warming Nature 406(6799) 978ndash981
Pilcher JR Mac an tSaoir S 1995 Wood Trees Forests in Ireland RoyalIrish Academy Dublin
Prevost M Belleau P Plamondon AP 1997 Substrate conditions in atreed peatland responses to drainage Ecoscience 4(4) 543ndash554
Price JS Branfireun BA Waddington JM Devito KJ 2005 Advancesin Canadian wetland hydrology 1999ndash2003 Hydrological Processes19(1) 201ndash214 DOI 101002Hyp5774
Ramchunder SJ Brown LE Holden J 2007 Environmental effects ofdrainage drain-blocking and prescribed vegetation burning in UKupland peatlands Progress in Physical Geography 2009(33) 49 DOI1011770309133309105245
Copyright copy 2012 John Wiley amp Sons Ltd
Reggiani P Sivapalan M Hassanizadeh SM 2000 Conservationequations governing hillslope responses exploring the physical basisof water balance Water Resources Research 36(7) 1845ndash1863
Rigon R Bertoldi G Over TM 2006 GEOtop a distributed hydrologicalmodel with coupled water and energy budgets Journal of Hydro-meteorology 7(3) 371ndash388
Robinson M 1986 Changes in catchment runoff following drainage andafforestation Journal of Hydrology 86(1ndash2) 71ndash84
Simoni S Zanotti F Bertoldi G Rigon R 2008 Modelling the probabilityof occurrence of shallow landslides and channelized debris flows usingGEOtop-FS Hydrological Processes 22(4) 532ndash545 DOI 101002Hyp6886
Sottocornola M Kiely G 2010 Energy fluxes and evaporationmechanisms in an Atlantic blanket bog in southwestern Ireland WaterResources Research 46 DOI 1010292010WR009078
Sottocornola M Laine A Kiely G Byrne KA Tuittila ES 2009Vegetation and environmental variation in an Atlantic blanket bog insouthwestern Ireland Plant Ecology 203(1) 69ndash81 DOI 101007s11258-008-9510-2
Strack M Waddington JM Rochefort L Tuittila ES 2006 Response ofvegetation and net ecosystem carbon dioxide exchange at different peatlandmicroforms following water table drawdown Journal of GeophysicalResearch-Biogeosciences 111(G2) DOI 1010292005jg000145
Tobin B Black K Osborne B Reidy B Bolger T Nieuwenhuis M 2006Assessment of allometric algorithms for estimating leaf biomass leafarea index and litter fall in different-aged Sitka spruce forests Forestry79(4) 453ndash465 DOI 101093forestrycpl030
Verry ES Timmons DR 1982 Waterborne nutrient flow through anupland-peatland watershed in Minnesota Ecology 65(5) 1456ndash1467
Waldron S Flowers H Arlaud C Bryant C McFarlane S 2009 Thesignificance of organic carbon and nutrient export from peatland-dominated landscapes subject to disturbance a stoichiometric perspectiveBiogeosciences 6(3) 363ndash374
Zanotti F Endrizzi S Bertoldi G Rigon R 2004 The GEOTOP snowmodule Hydrological Processes 18(18) 3667ndash3679 DOI 101002Hyp5794
Hydrol Process (2012)DOI 101002hyp
C LEWIS ET AL
of drains as the drains intercept the surface runoff fromupslope areas (Holden et al 2006) Because of modelconstraints it was not possible to increase the drainagenetwork density to achieve a realistic WT drawdown Itwas therefore decided to increase the horizontalconductivity of the peatland to represent the changedtravel time for water from the peat matrix to the drainagenetwork that a peatland with a higher density of drainswould have However it must also be noted that thisincrease in horizontal conductivity is also likely toreflect the increase in hydraulic conductivity caused bychanges in soil structure associated with WT drawdown(Ramchunder et al 2007)Two possible land use change scenarios were simulated
in this study changing the land use from natural peatlandto a 10-year-old (Scenatio A) and a 15-year-old (ScenarioB ) Sitka spruce forest The LAI was adopted from Tobinet al (2006) in a study on LAI in different ages ofSitka spruce forests in Ireland Sitka spruce forests atapproximately 15 years of age have the highest LAI and
0 50 100 150 200 250 300 3500
05
1
15
2
Julian Day 2007
Flo
w (
m s
minus1 )
Observed FlowSimulated Flow
Figure 2 Observed and simulated flows for 2007 at hourly intervals
0 100 200 3000
500
1000
1500
2000
2500
Julian Days
Flo
w (
mm
)
RainfallObserved FlowSimulated Flow
(a)
Figure 3 For 2007 (a) cumulative rainfall observed flow and simulatesimulated
Copyright copy 2012 John Wiley amp Sons Ltd
therefore deemed to have the largest impact on the rainfallrunoff response mainly from increased interception andtranspiration The changes to the model for Scenario Awere made by increasing the LAI to 45 root depth to40 cm and canopy height to 250 cm For Scenario B theLAI root depth and canopy height were increased to 7555 and 800 cm respectively Along with the change inland use both of these scenarios also included a newdrainage network to reflect the practice of drainingpeatlands prior to afforestation
RESULTS
The model was calibrated using observed data for 2007Figure 2 shows the time series of observed and GEOtopmodelled flows with in a NashndashSutcliffe (Nash andSutcliffe 1970) efficiency of 087 The difference betweenobserved and simulated flows is greatest in times of highflows where the simulated flow is larger than the observedHowever at times of high flow the observed flows may beunderestimated as flow spills overbank and no streamflowmeasurements were recorded for overbank flow (becauseof safety reasons) The cumulative rainfall (2229mm)observed streamflow (1925mm) and simulated streamflow(2018 mm) are shown in Figure 3(a) The modelled ET of~211mm for 2007 is lower than both the observed value of304mm and the nearby eddy covariance estimate of ETof 388mm for the hydrological year 20062007 reportedby Sottocornola and Kiely (2010) Monthly totals ofsimulated flow compare well with observed values(Figure 3(b)) as do the instantaneous values of simulatedand observed flows (Figure 3(c)) with the exception ofthe very highest flows We believe this is due to theoverbank flow for which our high observed flows arelikely to be underestimated
JanFebMarArpMayJun Jul AugSepOctNovDec0
1
2
3
4x 10
5
Flo
w (
m3 )
0 05 1 150
05
1
15
Observed flows (m3 sminus1)
Sim
ulat
ed fl
ows
(m3
sminus1 )
Observed FlowSimulated Flow
R2= 091
(b)
(c)
d flow (b) monthly observed and simulated flows (c) observed andflows
Hydrol Process (2012)DOI 101002hyp
HYDROLOGICAL RESPONSE OF AFFORESTED PEAT CATCHMENT
The observed and simulated WT depths are shown inFigure 4 The model simulates WT over the full extent ofthe bog and will be somewhat different to the observedWT which was from one WT sensor point Examining
0 50 100 150 200 250 300 350
0
Dep
th o
f wat
er ta
ble
belo
w s
urfa
ce (
cm)
minus30
minus25
minus20
minus15
minus10
minus5
minus100
minus50
0
Julian Day 2007D
aily
Rai
nfal
l (m
m)
Observed WTSimulated WTDaily Rainfall
Figure 4 For 2007 daily rainfall (top) observed and simulated water table
0 100 200 3000
500
1000
1500
2000
2500
3000
Julian Days
Flo
w (
mm
)
RainfallObserved FlowSimulated Flow
(a)
Figure 6 For 2008 (a) cumulative rainfall observed flow and simulated flow
0 50 100 150 200 250 300 3500
02
04
06
08
1
12
14
Julian Day 2008
Flo
w (
m s
minus1 )
Observed FlowSimulated Flow
Figure 5 Observed and simulated flows for 2008 at hourly intervals
Copyright copy 2012 John Wiley amp Sons Ltd
Figure 4 for 2007 we note that the time series trends ofboth observed and simulated WTs agree even thoughthe absolute values are somewhat different For theinstantaneous WT (Figure 4) the range is larger for thesimulated WT but again not hugely different The annualmean observed WT (Figure 4) was 387 cm below thesurface compared with the simulated WT of 485 cmThis WT difference is under 1 cm From Figures 2ndash4 wesuggest that GEOtop simulates well the hydrologicalprocess in the peatland for the calibration yearOnce the model was calibrated for 2007 it was then
validated (no change to parameters) for 2008 Figures 5ndash7and Table II show the results of the 2008 simulation TheNashndashSutcliffe efficiency of 089 for 2008 showed aslight improvement on the 2007 value of 087 whereasthe simulated flow was slightly greater than the observedflow (Figure 6) The simulated WT had an annual meanvalue of 29 cm below the surface whereas the observed
JanFebMarArpMayJun Jul AugSepOctNovDec0
1
2
3
4x 10
5
Flo
w (
m3 )
Observed FlowSimulated Flow
0 05 1 150
05
1
15
Recorded Flows (m3 sminus1)
Sim
ulat
ed F
low
s m
3 sminus
1
R2= 092
(c)
(b)
(b) monthly observed and simulated flows (c) observed and simulated flows
Dep
th o
f wat
er ta
ble
belo
w s
urfa
ce (
cm)
minus25
minus20
minus15
minus10
minus5
0
0 50 100 150 200 250 300 350
minus100
minus50
0
Julian Day 2008
Dai
ly R
ainf
all (
mm
)
Observed WTSimulated WTDaily Rainfall
Figure 7 For 2008 daily rainfall (top) observed and simulated watertable depth
Hydrol Process (2012)DOI 101002hyp
Table II Observed and modelled scenarios rainfall evapotranspiration and streamflow values
Scenario Year Rainfall (mm) Evapotranspiration (mm) Streamflow (mm) Streamflowrainfall ratio
Observed 2007 2229 304 1925 075Calibrated model 2007 2229 211 2018 082Observed 2008 2826 421 2405 085Validated model 2008 2826 330 2496 088Scenario A 2008 2826 501 2325 083Scenario B 2008 2826 913 1913 067
0 50 100 150 200 250 300 350minus70
minus60
minus50
minus40
minus30
minus20
minus10
0
10
Julian Day 2008
Dep
th o
f wat
er ta
ble
belo
w s
urfa
ce(c
m)
Observed WTDrained PeatlandScenario AScenario B
Figure 8 For 2008 water table for observed drained peat Scenario Aand Scenario B
0 50 100 150 200 250 300 3500
500
1000
1500
2000
2500
3000
Julian Day 2008
Flo
w m
3 sminus
1
Rainfall (1)Observed flow (2)Scenario A (3)Scenario B (4)
(3)
(4)
(1)
(2)
Figure 9 Cumulative rainfall observed flow simulated flow ScenarioA and Scenario B flows
C LEWIS ET AL
WT had an annual mean depth of 35 cm below thesurface for 2008 These figures show that GEOtopprovides a similar level of accuracy for the validationyear 2008 as it did for the calibration year 2007 Fromthis we suggest that the current configuration of GEOtopsimulates well the hydrological processes in the Glencarblanket peatland and that we are able to proceed with astudy of land use change scenariosThe overall goal of this project is to study the change
in hydrological response of peatland when land use ischanged from its natural state to forestry It is not possibleto do this by simply changing the land use in the modelas in practice peatlands are drained prior to planting(Holden et al 2004) To reflect this the drainage networkin the model was modified and a series of new networkdrains was inserted into the model The model was thenrun again for the 2 years 2007 and 2008 with land usechange Scenarios A and B Although the model was runfor 2 years the cumulative flow and ET values are shownin Figure 9 for 2008 only after allowing the model to spinup for the first 3months of 2007The changes in WT due to the drainage and land use
change scenarios are shown in Figure 8 The simulateddrained peatland showed a drop in WT particularly in thesummer months with the annual mean drained WT150 cm below the surface and 115 cm below theobserved WT The annual mean observed WT depth for2008 was 35 cm below the surface whereas with meansimulated WT depths for scenarios A and B were 120and 240 cm respectively (see Figure 8)The cumulative rainfall (2826mm) observed flow
(2405mm) and simulated flows (2325 for Scenario A and1913mm for Scenario B) for 2008 are shown in Figure 9From this we estimate that ET from the peatland is~420mm in 2008 which is similar to the highest value(424mm) of the eddy covariance estimated ET reportedby Sottocornola and Kiely (2010) in the period 2002ndash2007Scenario A showed very little change in ET from theundisturbed peatland whereas the ET for Scenario B was925mm an increase of 492mm when compared with theobserved ET in 2008 The total annual simulatedstreamflow for Scenarios A and B were reduced to 96and 80 respectively of the observed flow A comparisonof the streamflow between the observed flow and ScenarioB did not show that Scenario B was consistently reducedby 80 It showed rather that Scenario B had at differenttimes of the year both higher (typically in winter) andlower streamflows (typically summer) than the observed
Copyright copy 2012 John Wiley amp Sons Ltd
streamflow This is illustrated in Figure 10(a) and (b)Figure 10(a) shows the observed flow and the flow fromScenario B from Julian day 134 to day 140 2007 Apriland May 2007 were unusually dry with April being one ofthe driest on record at two nearby Met Eireann (Irishweather service) synoptic weather stations and belowaverage rainfall was reported in May (httpwwwmetieclimatemonthly_summarys) This resulted in a large dropin WT An analysis of the precipitation and streamflow ondays 134ndash140 shows that the observed and simulatedstreamflows from Scenario B produced two very differentrainfall runoff responses The observed streamflow showeda large peak in flow whereas the simulated Scenario Bflow showed only a small response to precipitation TheScenario B flow for Julian days 134ndash136 results in almost
Hydrol Process (2012)DOI 101002hyp
0
01
02
minus15
minus10
minus5
0
WT
Dep
th (
cm)
amp H
ourly
Rai
nfal
l (m
m)
0
1
2
Julian Days 2007
Flo
w (
m3 s
minus1 )
Flo
w (
m3 s
minus1 )
minus15
minus10
minus5
0
WT
Dep
th (
cm)
amp H
ourly
Rai
nfal
l (m
m)
340 3405 341 3415 342 3433425 3435 344
minus80
minus60
minus40
minus20
0
134 1345 135 1355 136 1365 137 1375 138
minus80
minus60
minus40
minus20
0Observed FlowScenario B Flow
Houly Rainfall
Observed FlowScenario BSimulated 2007
Hourly Rainfall
WT 2007
WT 2007
Figure 10 (a) For summer 2007 observed and modelled Scenario B flows (b) for winter 2007 observed simulated and Scenario B flows Thesimulated winter (b) and summer (a) WTs are also shown
HYDROLOGICAL RESPONSE OF AFFORESTED PEAT CATCHMENT
no flow in the stream Figure 10(b) shows that the converseoccurred between days 340 and 344 where the simulatedflow from Scenario B was higher than the observed flowAs there is a slight discrepancy between the peak flows andsimulated flows for reasons outlined earlier the simulationof the undisturbed peatland is also shown in Figure 10(b)
DISCUSSION
The comparisons of observed flows and WT depths withthe corresponding simulated values from the GEOtopmodel in the calibration and validation years show thatthe current configuration of GEOtop is capable of reliablysimulating the hydrological processes Central to thisconfiguration for the peatland is the spatial variation ofhydraulic conductivity Areas of low hydraulic conductivityat the margins near the stream are essential in maintainingthe elevated WT in the centre of the bog For the drainagescenarios once these areas of lower hydraulic conductivitywere modified by the insertion of a drainage network theWTs level in the centre of the bog fell Given that even aslight drop in WT impacts the vegetation distribution andcomposition (Sottocornola et al 2009) any disturbance ofthese relatively small areas of lower hydraulic conductivitywill likely affect a much larger area of a bogWhereas the practice of drainage prior to afforestation
of peatlands lowers the WT its depth will also be affectedby the increase in transpiration and canopy interceptionwith the change of land use from natural peatland to Sitkaspruce afforestation From Figure 9 and Table II we notethat the simulated ET increased in the mature forest(Scenario B) to 492mm greater than the pristine peatlandThe ET rate of the younger forest (Scenario A) wassimilar to the undisturbed peatland A study of ET by
Copyright copy 2012 John Wiley amp Sons Ltd
Sottocornola and Kiely (2010) at the same site found thatthe ET was not water limited and the observed ET rangedbetween 369 and 424mm with an average of 394mm ofET over a 5-year period Sottocornola and Kiely (2010)concluded that one of the key limiting factors in ET wasthe lack of vascular plants which if present wouldenhance transpiration Although Figure 9 shows that thereis a drop in the WT for Scenario A particularly in thesummer months at this stage of development of a forestthe tree canopy would not provide full cover As the WTis lower than in the undisturbed peatland the ET ratefrom the original peatland vegetation which has a largeproportion of non-vascular plants will have decreasedThus it would appear that the increase in ET under theSitka spruce canopy is offset by the decrease in ET fromthe original peatland vegetationThe estimated ET (913mm) of Scenario B of a more
mature forest was 412mm higher than Scenario A Suchincreases in ET as a result of changing peatland land usefrom grass mosses and bare peat to Sitka spruce havebeen noted by others Studies by others in areas such asthe Scottish highlands that may be considered similar insoil type and climate to our Irish study site have foundthat Sitka spruce may intercept between 28 (596mm)(Johnson 1990) and 52 (1514mm) (Heal et al 2004)of precipitation Transpiration of Sitka spruce in Cumbriahas been estimated at 12 of precipitation or 172mm(Anderson et al 1990) We note that our estimates of ETfrom Scenario B at 32 of rainfall is in the rangeof values cited in the literature Results from a study bythe Institute of Hydrology (1991) into the effects ofupland afforestation on water resources suggest that ETon a forested catchment receiving 2800mm precipitationannually was approximately 1190mm which is similar to
Hydrol Process (2012)DOI 101002hyp
C LEWIS ET AL
the ET value of 925mm in our Scenario B Other studieson afforested peatlands such as the Marcell experimentalforest in Minnesota and the Huhtisuo catchment inFinland found that ET represented a larger percentageof precipitation than values noted in this study A studyby Verry and Timmons (1982) found that ET from amature Black Spruce forest represented up to 66 of theannual precipitation with Iritz et al (1994) reporting ETvalues of 61 of precipitation in the Huhtisuo catchmentin Finland However precipitation was much lower inboth locations with the Huhtisuo catchment and Marcellforest annually receiving approximately 700 and 800mmprecipitation respectively The climate at both locationsis described as continental with streamflow tending tocease for 2ndash4months of each winter because of lowertemperatures in Marcell (Kolka et al 2001) Thedifference in climate is likely to have resulted in thedifference in simulated and observed ET values in ourstudy and that of those reported from the Huhtisuocatchment and Marcell forest In our site the averageprecipitation over a 5-year period was 2597mm with anaverage ET of 394mm representing approximately 15of precipitation The increased ET associated withafforestation in conjunction with the drainage networkresulted in a WT draw down in dry periods (Figure 9)The WT in Scenarios A and B was on average 165 and205 cm below the observed WT for the calendar year2008 This is similar to the draw down noted by Bragg(2002) where the WT in a forested peatland wasfound to be 100ndash150 cm below that in the adjacentunforested peatlandAs the runoff from peatlands in their natural state
(in Western Europe) is known to be flashy because ofsaturation excess overland flow a lowering of the WT isexpected to reduce the volume of runoff produced fromsaturation excess This is noted in the hydrograph for asummer period in Figure 10(a) which shows the observedand the simulated flows from Scenario B for Julian days134ndash140 The rain event on day 135 was preceded by adry period in April and May 2007 the end of which theWT was observed to be at its lowest level since recordsbegan in 2003 At the start of the precipitation event ofday 135 the WT of Scenario B was 698 cm lower thanthe observed WT of the pristine peatland and 592 cmbelow the drained simulation With this lower WT andreduced precipitation reaching the ground because ofcanopy interception the streamflow from the simulatedforest catchment is greatly reduced However theconverse applies for the streamflow in winter as shownin Figure 10(b) Prior to day 340 there had been frequentrain events which had resulted in a much higher WT bothin the simulated and observed cases A total of 53mm fellon day 340 resulting in a higher simulated than observedflow As the observed WT was 19 cm below the surfaceand Scenario B was just 25 cm below the surface weconsider that both simulations produced saturation excessoverland flow However the forested simulation had amore extensive drainage network that was able to conveyany surface runoff to the catchment outfall more rapidly
Copyright copy 2012 John Wiley amp Sons Ltd
resulting in a higher peak flows Such a phenomenon hasalso been noted by others with Ahti (1980) finding thatincreasing density of drainage ditches increased peakflows in a Finish peatland and model simulations by Iritzet al (1994) noting that peak flows may be increased byforest drainage when the WT is close to the surface Thestudies of Anderson et al (2000) and (Ballard et al 2011b)also drew similar conclusionsThis phenomenon of increasing the streamflow following
afforestation of peatlands may have implications inlarger catchments where afforestation may be falselyconsidered as a flood mitigation measure Likewise thereduction of flows from peatlands throughout thesummer and in particular after dry periods may be ofconcern for water resource managers
CONCLUSION
With regard to applying the hydrological GEOtop modelto an Atlantic blanket peatland we found that GEOtopwas suitable for the purposes of modelling the hydro-logical processes Central to this was the input of thespatial variation of the saturated hydraulic conductivityPeat with a lower hydraulic conductivity at the marginsresults in elevating the WT depth in the centre of the bogwhich in turn results in saturation excess overland flowduring precipitation events It is also clear from thescenario modelling that afforestation and its associateddrainage can change the hydrological response of thispristine peatland catchment Whereas the ET rates from ayoung Sitka spruce catchment were similar to the existingpristine peatland catchment a semi-mature Sitka Spruceforest resulted in an increase in ET of 492mm throughincreased transpiration from the canopy and interceptionThis increase in ET was particularly noticeable in summerand resulted in an increase in depth of the WT andreduction in streamflow However in winter followingperiods of heavy rainfall the WT depth approached thatof an unforested drained peatland This shallow WT depthin combination with a drainage network results in anincrease in peak flow in times of heavy rainfall Thissuggests that there is limited or no benefit to floodattenuation from peatland afforestation during winterperiods when the WT is high whereas the converseapplies to summer flows where the rainfall runoff wasreduced in dry periods
ACKNOWLEDGEMENTS
This study was funded by the Irish EnvironmentalProtection Agency under the Science Technology Researchand Innovation for the Environment Programme 2007ndash2013of Ireland (Soil H Interactions of soil hydrology land useand climate change and their impact on soil quality 2007-S-SL-1-S1) We would like to thank Dr Alice Wemaere of theEnvironmental Protection Agency for her continuoussupport We would also like to thank the SoilH steeringcommittee for their support advise and encouragement
Hydrol Process (2012)DOI 101002hyp
HYDROLOGICAL RESPONSE OF AFFORESTED PEAT CATCHMENT
throughout this project Prof Mark Kibblewhite Dr ArwynJones and Dr Otto Spaargaren We particularly wish tothank our present and past colleagues in the HYDROMETgroup Dr Paul Leahy Mr Nelius Foley Dr Rashid Rafiqueand Dr Michael Wellock We thank Caitriona Douglas ofNPWS and Coillte Teoranta for the permission to use thestudy site We also very much appreciate the support of thedevelopers of GEOtop in particular Prof Riccardo Rigonand Dr Matteo Dallrsquo Amico We acknowledge in particularthe earlier work of Dr Anna Laine Dr Matteo SottocornolaandDrAnn-KristinKoehler and their work and publicationsfrom the same site
REFERENCES
Abbott MB Bathurst JC Cunge JA Oconnell PE Rasmussen J 1986An introduction to the European hydrological systemmdashsystemehydrologique Europeen she 2 Structure of a physically-baseddistributed modeling system Journal of Hydrology 87(1ndash2) 61ndash77
Ahti E 1980 Ditch spacing experiments in estimating the effects ofpeatland drainage on summer runoff Proceedings of the HelsinkiSymposium Helsinki
Anderson AR Pyatt DG 1986 Interception of precipitation by Pole-StageSitka Spruce and Lodgepole Pine and Mature Sitka Spruce at KielderForest Northumberland Forestry 59(1) 29ndash38
Anderson AR Pyatt DG Stannard JP 1990 The effects of clearfelling aSitka Spruce Stand on the water-balance of a peaty gley soil atKershope Forest Cumbria Forestry 63(1) 51ndash71
Anderson AR Day R Pyatt DG 2000 Physical and hydrological impactsof blanket bog afforestation at Bad arsquo Cheo Caithness the first 5 yearsForestry 73(5) 467ndash478
Arnold JG Srinivasan R Muttiah RS Williams JR 1998 Large areahydrologic modeling and assessment Part I model developmentAmerican water resources Association 34(1) 73ndash89
Baird AJ Eades PA Surridge BWJ 2008 The hydraulic structure of araised bog and its implications for ecohydrological modelling of bogdevelopment Ecohydrology 1(4) 289ndash298 DOI 101002Eco33
Ballard CE McIntyre HS Wheater HS Holden J Wallage ZE 2011aHydrological modelling of drained blanket peatland Journal ofHydrology 407 81ndash83 http dxdoiorg101016jjhydrol201107005
Ballard CE Mclntyre N Wheater HS 2011b Effects of peatland drainagemanagement on peak flows Hydrology and Earth System Sciences 86533ndash6563 DOI 105194hessd-8-6533-2011
Bay R 1969 Runoff from small peatland watersheds Journal ofHydrology 9 90ndash102
Bertoldi G Rigon R Over TM 2006 Impact of watershed geomorphiccharacteristics on the energy and water budgets Journal of Hydro-meteorology 7(3) 389ndash403
Bertoldi G Notarnicola C Leitinger G Endrizzi S Zebisch M DellaChiesa S Tappeiner U 2010 Topographical and ecohydrologicalcontrols on land surface temperature in an alpine catchmentEcohydrology 3(2) 189ndash204 DOI 101002Eco129
Beven K Kirkby MJ 1979 A physically based variable contributing areamodel of basin hydrology Hydrological Sciences Bulletin 23 419ndash437
Black K Gallagher G Orsquo Brien P Redmond J Barrett F Twomey M2008 Dispelling myths the ture extent of recent peatland afforestationin Ireland Coford Dublin
Bragg OM 2002 Hydrology of peat-forming wetlands in ScotlandScience of the Total Environment 294(1ndash3) 111ndash129 Pii S0048-9697(02)00059-1
Burke B 1975 Effect of drainage on the hydrology of blanket-bog Irishjournal of agricultural research 14 145ndash62
Byrne KA Farrell EP 2005 The effect of afforestation on soil carbondioxide emissions in blanket peatland in Ireland Forestry 78(3)217ndash227 DOI 101093forestrycpi020
Conway VM Millar A 1969 The hydrology of some small peat-coveredcatchments in the northern Pennines Journal of the Institute of WaterEngineers 14 415ndash24
Dept of Agriculture 1996 Growing for the futuremdasha strategic plan forthe Development of the Forestry Sector in Ireland Dublin
Dunn SM Mackay R 1996 Modelling the hydrological impacts of openditch drainage Journal of Hydrology 179(1ndash4) 37ndash66
Copyright copy 2012 John Wiley amp Sons Ltd
Eaton J McGoff N Byrne K Leahy P Kiely G 2008 Land cover changeand soil organic carbon stocks in the Republic of Ireland 1851ndash2000Climatic Change 91(3ndash4) 317ndash334 DOI 101007s10584-008-9412-2
Frolking S Roulet NT 2007 Holocene radiative forcing impact ofnorthern peatland carbon accumulation and methane emissions GlobalChange Biology 13(5) 1079ndash1088 DOI 101111j1365-2486200701339x
van Genuchten MT 1980 A closed-form equation for predicting thehydraulic conductivity of unsaturated soils Soil Science Society ofAmerica Journal 44(5) 892ndash898
Hargreaves KJ Milne R Cannell MGR 2003 Carbon balance ofafforested peatland in Scotland Forestry 76(3) 299ndash317
Heal KV Stidson RT Dickey CA Cape JN Heal MR 2004 New data forwater losses from mature Sitka spruce plantations in temperate uplandcatchments Hydrological Sciences Journal 49(3) 477ndash493
Hoag RS Price JS 1995 A field-scale natural gradient solute transportexperiment in peat at a Newfoundland blanket bog Journal ofHydrology 172(1ndash4) 171ndash184
Hogan JM van der Kamp G Barbour SL Schmidt R 2006 Fieldmethods for measuring hydraulic properties of peat deposits Hydro-logical Processes 20(17) 3635ndash3649 DOI 101002Hyp6379
Holden J 2005 Peatland hydrology and carbon release why small-scaleprocess matters Philosophical Transactions of the Royal Societya-Mathematical Physical and Engineering Sciences 363(1837)2891ndash2913 DOI 101098rsta20051671
Holden J Burt TP 2002 Infiltration runoff and sediment production inblanket peat catchments implications of field rainfall simulationexperiments Hydrological Processes 16(13) 2537ndash2557 DOI101002Hyp1014
Holden J Burt TP 2003 Hydraulic conductivity in upland blanketpeat measurement and variability Hydrological Processes 17(6)1227ndash1237 DOI 101002Hyp1182
Holden J Chapman PJ Labadz JC 2004 Artificial drainage of peatlandshydrological and hydrochemical process and wetland restorationProgress in Physical Geography 28(1) 95ndash123
Holden J Evans MG Burt TP Horton M 2006 Impact of land drainageon peatland hydrology Journal of Environmental Quality 35(5)1764ndash1778
Holden J Wallage ZE Lane SN McDonald AT 2011 Water tabledynamics in undisturbed drained and restored blanket peat Journal ofHydrology 402(1ndash2) 103ndash114 DOI 101016jjhydrol201103010
Horgan T Keane M McCarthy R Lally M Thompson D 2004 A Guide toForest Tree Species Selection and Silviculture in Ireland Coford Dublin
Hudson JA Gilman K Calder IR 1997 Land use and water issues in theuplands with reference to the Plynlimon study Hydrology and EarthSystem Sciences 1(3) 239ndash397
Institute of Hydrology 1991 Effects of upland afforestation on waterresources the Balquhidder experiment 1981ndash1991 Report no 116Institute of Hydrology Wallingford UK
Iritz L Johansson B Lundin L 1994 Impacts of forest drainage on floodsHydrological Sciences Journal 39(6) 637ndash661
Johnson RC 1990 The interception throughfall and stemflow in a forestin Highland Scotland and the comparison with other upland forests inthe UK Journal of Hydrology 118(1ndash4) 281ndash287
Koehler AK Murphy K Kiely G Sottocornola M 2009 Seasonalvariation of DOC concentration and annual loss of DOC from anAtlantic blanket bog in South Western Ireland Biogeochemistry 95231ndash242 DOI 101007s10533-009-9333-9
Koehler AK Sottocornola M Kiely G 2011 How strong is the currentcarbon sequestration of an Atlantic blanket bog Global ChangeBiology 17(1) 309ndash319 DOI 101111j1365-2486201002180x
Kolka RK Griagal DF Nater EA Verry ES 2001 Hydrologic cycling ofmercury and organic carbon in a forested upland-bog watershed SoilScience Society 65 897ndash905
Lafleur PM Hember RA Admiral SW Roulet NT 2005 Annual andseasonal variability in evapotranspiration and water table at a shrub-covered bog in southern Ontario Canada Hydrological Processes19(18) 3533ndash3550
Laine A Byrne KA Kiely G Tuittila ES 2007 Patterns in vegetationand CO2 dynamics along a water level gradient in a lowland blanketbog Ecosystems 10(6) 890ndash905 DOI 101007s10021-007-9067-2
Lane SN Brookes CJ Kirkby AJ Holden J 2004 A network-indexbasedversion of TOPMODEL for use with high-resolution digital topographicdata Hydrological Processes 18(1) 191ndash201
Lapen DR Price JS Gilbert R 2005 Modelling two-dimensional steady-state groundwater flow and flow sensitivity to boundary conditions inblanket peat complexes Hydrological Processes 19(2) 371ndash386 DOI101002Hyp1507
Hydrol Process (2012)DOI 101002hyp
C LEWIS ET AL
Lees JC 1972 Soil aeration and Sitka Spruce seedling growth in peatJournal of Ecology 60(2) 343ndash349
Letts MG Roulet N Comer NT 2000 Parameterization of peatlandhydraulic properties for the Canadian land surface scheme CanadianMeterological and Oceanographic Society 38 141ndash160
Lewis C Albertson J Xu X Kiely G 2011 Spatial variability of hydraulicconductivity and bulk density along a blanket peatland hillslopeHydrological Processes 26 1527ndash1537 DOI 101002hyp8252
Limpens J Berendse F Blodau C Canadell JG Freeman C Holden JRoulet N Rydin H Schaepman-Strub G 2008 Peatlands and thecarbon cycle from local processes to global implicationsmdasha synthesisBiogeosciences 5(5) 1475ndash1491
Nash JE Sutcliffe JV 1970 River flow forecasting through conceptualmodels part Imdasha discussion of principles Journal of Hydrology 10(3)282ndash290
NFI 2007 National Forest InventorymdashRepublic of IrelandmdashResultsJohnstown Castle Estate Co Wexford Ireland
Nilsson M Sagerfors J Buffam I Laudon H Eriksson T Grelle AKlemedtsson L Weslien P Lindroth A 2008 Contemporary carbonaccumulation in a boreal oligotrophic minerogenic miremdasha significantsink after accounting for all C-fluxes Global Change Biology 14(10)2317ndash2332 DOI 101111j1365-2486200801654x
Oechel WC Vourlitis GL Hastings SJ Zulueta RC Hinzman L Kane D2000 Acclimation of ecosystem CO2 exchange in the Alaskan Arctic inresponse to decadal climate warming Nature 406(6799) 978ndash981
Pilcher JR Mac an tSaoir S 1995 Wood Trees Forests in Ireland RoyalIrish Academy Dublin
Prevost M Belleau P Plamondon AP 1997 Substrate conditions in atreed peatland responses to drainage Ecoscience 4(4) 543ndash554
Price JS Branfireun BA Waddington JM Devito KJ 2005 Advancesin Canadian wetland hydrology 1999ndash2003 Hydrological Processes19(1) 201ndash214 DOI 101002Hyp5774
Ramchunder SJ Brown LE Holden J 2007 Environmental effects ofdrainage drain-blocking and prescribed vegetation burning in UKupland peatlands Progress in Physical Geography 2009(33) 49 DOI1011770309133309105245
Copyright copy 2012 John Wiley amp Sons Ltd
Reggiani P Sivapalan M Hassanizadeh SM 2000 Conservationequations governing hillslope responses exploring the physical basisof water balance Water Resources Research 36(7) 1845ndash1863
Rigon R Bertoldi G Over TM 2006 GEOtop a distributed hydrologicalmodel with coupled water and energy budgets Journal of Hydro-meteorology 7(3) 371ndash388
Robinson M 1986 Changes in catchment runoff following drainage andafforestation Journal of Hydrology 86(1ndash2) 71ndash84
Simoni S Zanotti F Bertoldi G Rigon R 2008 Modelling the probabilityof occurrence of shallow landslides and channelized debris flows usingGEOtop-FS Hydrological Processes 22(4) 532ndash545 DOI 101002Hyp6886
Sottocornola M Kiely G 2010 Energy fluxes and evaporationmechanisms in an Atlantic blanket bog in southwestern Ireland WaterResources Research 46 DOI 1010292010WR009078
Sottocornola M Laine A Kiely G Byrne KA Tuittila ES 2009Vegetation and environmental variation in an Atlantic blanket bog insouthwestern Ireland Plant Ecology 203(1) 69ndash81 DOI 101007s11258-008-9510-2
Strack M Waddington JM Rochefort L Tuittila ES 2006 Response ofvegetation and net ecosystem carbon dioxide exchange at different peatlandmicroforms following water table drawdown Journal of GeophysicalResearch-Biogeosciences 111(G2) DOI 1010292005jg000145
Tobin B Black K Osborne B Reidy B Bolger T Nieuwenhuis M 2006Assessment of allometric algorithms for estimating leaf biomass leafarea index and litter fall in different-aged Sitka spruce forests Forestry79(4) 453ndash465 DOI 101093forestrycpl030
Verry ES Timmons DR 1982 Waterborne nutrient flow through anupland-peatland watershed in Minnesota Ecology 65(5) 1456ndash1467
Waldron S Flowers H Arlaud C Bryant C McFarlane S 2009 Thesignificance of organic carbon and nutrient export from peatland-dominated landscapes subject to disturbance a stoichiometric perspectiveBiogeosciences 6(3) 363ndash374
Zanotti F Endrizzi S Bertoldi G Rigon R 2004 The GEOTOP snowmodule Hydrological Processes 18(18) 3667ndash3679 DOI 101002Hyp5794
Hydrol Process (2012)DOI 101002hyp
HYDROLOGICAL RESPONSE OF AFFORESTED PEAT CATCHMENT
The observed and simulated WT depths are shown inFigure 4 The model simulates WT over the full extent ofthe bog and will be somewhat different to the observedWT which was from one WT sensor point Examining
0 50 100 150 200 250 300 350
0
Dep
th o
f wat
er ta
ble
belo
w s
urfa
ce (
cm)
minus30
minus25
minus20
minus15
minus10
minus5
minus100
minus50
0
Julian Day 2007D
aily
Rai
nfal
l (m
m)
Observed WTSimulated WTDaily Rainfall
Figure 4 For 2007 daily rainfall (top) observed and simulated water table
0 100 200 3000
500
1000
1500
2000
2500
3000
Julian Days
Flo
w (
mm
)
RainfallObserved FlowSimulated Flow
(a)
Figure 6 For 2008 (a) cumulative rainfall observed flow and simulated flow
0 50 100 150 200 250 300 3500
02
04
06
08
1
12
14
Julian Day 2008
Flo
w (
m s
minus1 )
Observed FlowSimulated Flow
Figure 5 Observed and simulated flows for 2008 at hourly intervals
Copyright copy 2012 John Wiley amp Sons Ltd
Figure 4 for 2007 we note that the time series trends ofboth observed and simulated WTs agree even thoughthe absolute values are somewhat different For theinstantaneous WT (Figure 4) the range is larger for thesimulated WT but again not hugely different The annualmean observed WT (Figure 4) was 387 cm below thesurface compared with the simulated WT of 485 cmThis WT difference is under 1 cm From Figures 2ndash4 wesuggest that GEOtop simulates well the hydrologicalprocess in the peatland for the calibration yearOnce the model was calibrated for 2007 it was then
validated (no change to parameters) for 2008 Figures 5ndash7and Table II show the results of the 2008 simulation TheNashndashSutcliffe efficiency of 089 for 2008 showed aslight improvement on the 2007 value of 087 whereasthe simulated flow was slightly greater than the observedflow (Figure 6) The simulated WT had an annual meanvalue of 29 cm below the surface whereas the observed
JanFebMarArpMayJun Jul AugSepOctNovDec0
1
2
3
4x 10
5
Flo
w (
m3 )
Observed FlowSimulated Flow
0 05 1 150
05
1
15
Recorded Flows (m3 sminus1)
Sim
ulat
ed F
low
s m
3 sminus
1
R2= 092
(c)
(b)
(b) monthly observed and simulated flows (c) observed and simulated flows
Dep
th o
f wat
er ta
ble
belo
w s
urfa
ce (
cm)
minus25
minus20
minus15
minus10
minus5
0
0 50 100 150 200 250 300 350
minus100
minus50
0
Julian Day 2008
Dai
ly R
ainf
all (
mm
)
Observed WTSimulated WTDaily Rainfall
Figure 7 For 2008 daily rainfall (top) observed and simulated watertable depth
Hydrol Process (2012)DOI 101002hyp
Table II Observed and modelled scenarios rainfall evapotranspiration and streamflow values
Scenario Year Rainfall (mm) Evapotranspiration (mm) Streamflow (mm) Streamflowrainfall ratio
Observed 2007 2229 304 1925 075Calibrated model 2007 2229 211 2018 082Observed 2008 2826 421 2405 085Validated model 2008 2826 330 2496 088Scenario A 2008 2826 501 2325 083Scenario B 2008 2826 913 1913 067
0 50 100 150 200 250 300 350minus70
minus60
minus50
minus40
minus30
minus20
minus10
0
10
Julian Day 2008
Dep
th o
f wat
er ta
ble
belo
w s
urfa
ce(c
m)
Observed WTDrained PeatlandScenario AScenario B
Figure 8 For 2008 water table for observed drained peat Scenario Aand Scenario B
0 50 100 150 200 250 300 3500
500
1000
1500
2000
2500
3000
Julian Day 2008
Flo
w m
3 sminus
1
Rainfall (1)Observed flow (2)Scenario A (3)Scenario B (4)
(3)
(4)
(1)
(2)
Figure 9 Cumulative rainfall observed flow simulated flow ScenarioA and Scenario B flows
C LEWIS ET AL
WT had an annual mean depth of 35 cm below thesurface for 2008 These figures show that GEOtopprovides a similar level of accuracy for the validationyear 2008 as it did for the calibration year 2007 Fromthis we suggest that the current configuration of GEOtopsimulates well the hydrological processes in the Glencarblanket peatland and that we are able to proceed with astudy of land use change scenariosThe overall goal of this project is to study the change
in hydrological response of peatland when land use ischanged from its natural state to forestry It is not possibleto do this by simply changing the land use in the modelas in practice peatlands are drained prior to planting(Holden et al 2004) To reflect this the drainage networkin the model was modified and a series of new networkdrains was inserted into the model The model was thenrun again for the 2 years 2007 and 2008 with land usechange Scenarios A and B Although the model was runfor 2 years the cumulative flow and ET values are shownin Figure 9 for 2008 only after allowing the model to spinup for the first 3months of 2007The changes in WT due to the drainage and land use
change scenarios are shown in Figure 8 The simulateddrained peatland showed a drop in WT particularly in thesummer months with the annual mean drained WT150 cm below the surface and 115 cm below theobserved WT The annual mean observed WT depth for2008 was 35 cm below the surface whereas with meansimulated WT depths for scenarios A and B were 120and 240 cm respectively (see Figure 8)The cumulative rainfall (2826mm) observed flow
(2405mm) and simulated flows (2325 for Scenario A and1913mm for Scenario B) for 2008 are shown in Figure 9From this we estimate that ET from the peatland is~420mm in 2008 which is similar to the highest value(424mm) of the eddy covariance estimated ET reportedby Sottocornola and Kiely (2010) in the period 2002ndash2007Scenario A showed very little change in ET from theundisturbed peatland whereas the ET for Scenario B was925mm an increase of 492mm when compared with theobserved ET in 2008 The total annual simulatedstreamflow for Scenarios A and B were reduced to 96and 80 respectively of the observed flow A comparisonof the streamflow between the observed flow and ScenarioB did not show that Scenario B was consistently reducedby 80 It showed rather that Scenario B had at differenttimes of the year both higher (typically in winter) andlower streamflows (typically summer) than the observed
Copyright copy 2012 John Wiley amp Sons Ltd
streamflow This is illustrated in Figure 10(a) and (b)Figure 10(a) shows the observed flow and the flow fromScenario B from Julian day 134 to day 140 2007 Apriland May 2007 were unusually dry with April being one ofthe driest on record at two nearby Met Eireann (Irishweather service) synoptic weather stations and belowaverage rainfall was reported in May (httpwwwmetieclimatemonthly_summarys) This resulted in a large dropin WT An analysis of the precipitation and streamflow ondays 134ndash140 shows that the observed and simulatedstreamflows from Scenario B produced two very differentrainfall runoff responses The observed streamflow showeda large peak in flow whereas the simulated Scenario Bflow showed only a small response to precipitation TheScenario B flow for Julian days 134ndash136 results in almost
Hydrol Process (2012)DOI 101002hyp
0
01
02
minus15
minus10
minus5
0
WT
Dep
th (
cm)
amp H
ourly
Rai
nfal
l (m
m)
0
1
2
Julian Days 2007
Flo
w (
m3 s
minus1 )
Flo
w (
m3 s
minus1 )
minus15
minus10
minus5
0
WT
Dep
th (
cm)
amp H
ourly
Rai
nfal
l (m
m)
340 3405 341 3415 342 3433425 3435 344
minus80
minus60
minus40
minus20
0
134 1345 135 1355 136 1365 137 1375 138
minus80
minus60
minus40
minus20
0Observed FlowScenario B Flow
Houly Rainfall
Observed FlowScenario BSimulated 2007
Hourly Rainfall
WT 2007
WT 2007
Figure 10 (a) For summer 2007 observed and modelled Scenario B flows (b) for winter 2007 observed simulated and Scenario B flows Thesimulated winter (b) and summer (a) WTs are also shown
HYDROLOGICAL RESPONSE OF AFFORESTED PEAT CATCHMENT
no flow in the stream Figure 10(b) shows that the converseoccurred between days 340 and 344 where the simulatedflow from Scenario B was higher than the observed flowAs there is a slight discrepancy between the peak flows andsimulated flows for reasons outlined earlier the simulationof the undisturbed peatland is also shown in Figure 10(b)
DISCUSSION
The comparisons of observed flows and WT depths withthe corresponding simulated values from the GEOtopmodel in the calibration and validation years show thatthe current configuration of GEOtop is capable of reliablysimulating the hydrological processes Central to thisconfiguration for the peatland is the spatial variation ofhydraulic conductivity Areas of low hydraulic conductivityat the margins near the stream are essential in maintainingthe elevated WT in the centre of the bog For the drainagescenarios once these areas of lower hydraulic conductivitywere modified by the insertion of a drainage network theWTs level in the centre of the bog fell Given that even aslight drop in WT impacts the vegetation distribution andcomposition (Sottocornola et al 2009) any disturbance ofthese relatively small areas of lower hydraulic conductivitywill likely affect a much larger area of a bogWhereas the practice of drainage prior to afforestation
of peatlands lowers the WT its depth will also be affectedby the increase in transpiration and canopy interceptionwith the change of land use from natural peatland to Sitkaspruce afforestation From Figure 9 and Table II we notethat the simulated ET increased in the mature forest(Scenario B) to 492mm greater than the pristine peatlandThe ET rate of the younger forest (Scenario A) wassimilar to the undisturbed peatland A study of ET by
Copyright copy 2012 John Wiley amp Sons Ltd
Sottocornola and Kiely (2010) at the same site found thatthe ET was not water limited and the observed ET rangedbetween 369 and 424mm with an average of 394mm ofET over a 5-year period Sottocornola and Kiely (2010)concluded that one of the key limiting factors in ET wasthe lack of vascular plants which if present wouldenhance transpiration Although Figure 9 shows that thereis a drop in the WT for Scenario A particularly in thesummer months at this stage of development of a forestthe tree canopy would not provide full cover As the WTis lower than in the undisturbed peatland the ET ratefrom the original peatland vegetation which has a largeproportion of non-vascular plants will have decreasedThus it would appear that the increase in ET under theSitka spruce canopy is offset by the decrease in ET fromthe original peatland vegetationThe estimated ET (913mm) of Scenario B of a more
mature forest was 412mm higher than Scenario A Suchincreases in ET as a result of changing peatland land usefrom grass mosses and bare peat to Sitka spruce havebeen noted by others Studies by others in areas such asthe Scottish highlands that may be considered similar insoil type and climate to our Irish study site have foundthat Sitka spruce may intercept between 28 (596mm)(Johnson 1990) and 52 (1514mm) (Heal et al 2004)of precipitation Transpiration of Sitka spruce in Cumbriahas been estimated at 12 of precipitation or 172mm(Anderson et al 1990) We note that our estimates of ETfrom Scenario B at 32 of rainfall is in the rangeof values cited in the literature Results from a study bythe Institute of Hydrology (1991) into the effects ofupland afforestation on water resources suggest that ETon a forested catchment receiving 2800mm precipitationannually was approximately 1190mm which is similar to
Hydrol Process (2012)DOI 101002hyp
C LEWIS ET AL
the ET value of 925mm in our Scenario B Other studieson afforested peatlands such as the Marcell experimentalforest in Minnesota and the Huhtisuo catchment inFinland found that ET represented a larger percentageof precipitation than values noted in this study A studyby Verry and Timmons (1982) found that ET from amature Black Spruce forest represented up to 66 of theannual precipitation with Iritz et al (1994) reporting ETvalues of 61 of precipitation in the Huhtisuo catchmentin Finland However precipitation was much lower inboth locations with the Huhtisuo catchment and Marcellforest annually receiving approximately 700 and 800mmprecipitation respectively The climate at both locationsis described as continental with streamflow tending tocease for 2ndash4months of each winter because of lowertemperatures in Marcell (Kolka et al 2001) Thedifference in climate is likely to have resulted in thedifference in simulated and observed ET values in ourstudy and that of those reported from the Huhtisuocatchment and Marcell forest In our site the averageprecipitation over a 5-year period was 2597mm with anaverage ET of 394mm representing approximately 15of precipitation The increased ET associated withafforestation in conjunction with the drainage networkresulted in a WT draw down in dry periods (Figure 9)The WT in Scenarios A and B was on average 165 and205 cm below the observed WT for the calendar year2008 This is similar to the draw down noted by Bragg(2002) where the WT in a forested peatland wasfound to be 100ndash150 cm below that in the adjacentunforested peatlandAs the runoff from peatlands in their natural state
(in Western Europe) is known to be flashy because ofsaturation excess overland flow a lowering of the WT isexpected to reduce the volume of runoff produced fromsaturation excess This is noted in the hydrograph for asummer period in Figure 10(a) which shows the observedand the simulated flows from Scenario B for Julian days134ndash140 The rain event on day 135 was preceded by adry period in April and May 2007 the end of which theWT was observed to be at its lowest level since recordsbegan in 2003 At the start of the precipitation event ofday 135 the WT of Scenario B was 698 cm lower thanthe observed WT of the pristine peatland and 592 cmbelow the drained simulation With this lower WT andreduced precipitation reaching the ground because ofcanopy interception the streamflow from the simulatedforest catchment is greatly reduced However theconverse applies for the streamflow in winter as shownin Figure 10(b) Prior to day 340 there had been frequentrain events which had resulted in a much higher WT bothin the simulated and observed cases A total of 53mm fellon day 340 resulting in a higher simulated than observedflow As the observed WT was 19 cm below the surfaceand Scenario B was just 25 cm below the surface weconsider that both simulations produced saturation excessoverland flow However the forested simulation had amore extensive drainage network that was able to conveyany surface runoff to the catchment outfall more rapidly
Copyright copy 2012 John Wiley amp Sons Ltd
resulting in a higher peak flows Such a phenomenon hasalso been noted by others with Ahti (1980) finding thatincreasing density of drainage ditches increased peakflows in a Finish peatland and model simulations by Iritzet al (1994) noting that peak flows may be increased byforest drainage when the WT is close to the surface Thestudies of Anderson et al (2000) and (Ballard et al 2011b)also drew similar conclusionsThis phenomenon of increasing the streamflow following
afforestation of peatlands may have implications inlarger catchments where afforestation may be falselyconsidered as a flood mitigation measure Likewise thereduction of flows from peatlands throughout thesummer and in particular after dry periods may be ofconcern for water resource managers
CONCLUSION
With regard to applying the hydrological GEOtop modelto an Atlantic blanket peatland we found that GEOtopwas suitable for the purposes of modelling the hydro-logical processes Central to this was the input of thespatial variation of the saturated hydraulic conductivityPeat with a lower hydraulic conductivity at the marginsresults in elevating the WT depth in the centre of the bogwhich in turn results in saturation excess overland flowduring precipitation events It is also clear from thescenario modelling that afforestation and its associateddrainage can change the hydrological response of thispristine peatland catchment Whereas the ET rates from ayoung Sitka spruce catchment were similar to the existingpristine peatland catchment a semi-mature Sitka Spruceforest resulted in an increase in ET of 492mm throughincreased transpiration from the canopy and interceptionThis increase in ET was particularly noticeable in summerand resulted in an increase in depth of the WT andreduction in streamflow However in winter followingperiods of heavy rainfall the WT depth approached thatof an unforested drained peatland This shallow WT depthin combination with a drainage network results in anincrease in peak flow in times of heavy rainfall Thissuggests that there is limited or no benefit to floodattenuation from peatland afforestation during winterperiods when the WT is high whereas the converseapplies to summer flows where the rainfall runoff wasreduced in dry periods
ACKNOWLEDGEMENTS
This study was funded by the Irish EnvironmentalProtection Agency under the Science Technology Researchand Innovation for the Environment Programme 2007ndash2013of Ireland (Soil H Interactions of soil hydrology land useand climate change and their impact on soil quality 2007-S-SL-1-S1) We would like to thank Dr Alice Wemaere of theEnvironmental Protection Agency for her continuoussupport We would also like to thank the SoilH steeringcommittee for their support advise and encouragement
Hydrol Process (2012)DOI 101002hyp
HYDROLOGICAL RESPONSE OF AFFORESTED PEAT CATCHMENT
throughout this project Prof Mark Kibblewhite Dr ArwynJones and Dr Otto Spaargaren We particularly wish tothank our present and past colleagues in the HYDROMETgroup Dr Paul Leahy Mr Nelius Foley Dr Rashid Rafiqueand Dr Michael Wellock We thank Caitriona Douglas ofNPWS and Coillte Teoranta for the permission to use thestudy site We also very much appreciate the support of thedevelopers of GEOtop in particular Prof Riccardo Rigonand Dr Matteo Dallrsquo Amico We acknowledge in particularthe earlier work of Dr Anna Laine Dr Matteo SottocornolaandDrAnn-KristinKoehler and their work and publicationsfrom the same site
REFERENCES
Abbott MB Bathurst JC Cunge JA Oconnell PE Rasmussen J 1986An introduction to the European hydrological systemmdashsystemehydrologique Europeen she 2 Structure of a physically-baseddistributed modeling system Journal of Hydrology 87(1ndash2) 61ndash77
Ahti E 1980 Ditch spacing experiments in estimating the effects ofpeatland drainage on summer runoff Proceedings of the HelsinkiSymposium Helsinki
Anderson AR Pyatt DG 1986 Interception of precipitation by Pole-StageSitka Spruce and Lodgepole Pine and Mature Sitka Spruce at KielderForest Northumberland Forestry 59(1) 29ndash38
Anderson AR Pyatt DG Stannard JP 1990 The effects of clearfelling aSitka Spruce Stand on the water-balance of a peaty gley soil atKershope Forest Cumbria Forestry 63(1) 51ndash71
Anderson AR Day R Pyatt DG 2000 Physical and hydrological impactsof blanket bog afforestation at Bad arsquo Cheo Caithness the first 5 yearsForestry 73(5) 467ndash478
Arnold JG Srinivasan R Muttiah RS Williams JR 1998 Large areahydrologic modeling and assessment Part I model developmentAmerican water resources Association 34(1) 73ndash89
Baird AJ Eades PA Surridge BWJ 2008 The hydraulic structure of araised bog and its implications for ecohydrological modelling of bogdevelopment Ecohydrology 1(4) 289ndash298 DOI 101002Eco33
Ballard CE McIntyre HS Wheater HS Holden J Wallage ZE 2011aHydrological modelling of drained blanket peatland Journal ofHydrology 407 81ndash83 http dxdoiorg101016jjhydrol201107005
Ballard CE Mclntyre N Wheater HS 2011b Effects of peatland drainagemanagement on peak flows Hydrology and Earth System Sciences 86533ndash6563 DOI 105194hessd-8-6533-2011
Bay R 1969 Runoff from small peatland watersheds Journal ofHydrology 9 90ndash102
Bertoldi G Rigon R Over TM 2006 Impact of watershed geomorphiccharacteristics on the energy and water budgets Journal of Hydro-meteorology 7(3) 389ndash403
Bertoldi G Notarnicola C Leitinger G Endrizzi S Zebisch M DellaChiesa S Tappeiner U 2010 Topographical and ecohydrologicalcontrols on land surface temperature in an alpine catchmentEcohydrology 3(2) 189ndash204 DOI 101002Eco129
Beven K Kirkby MJ 1979 A physically based variable contributing areamodel of basin hydrology Hydrological Sciences Bulletin 23 419ndash437
Black K Gallagher G Orsquo Brien P Redmond J Barrett F Twomey M2008 Dispelling myths the ture extent of recent peatland afforestationin Ireland Coford Dublin
Bragg OM 2002 Hydrology of peat-forming wetlands in ScotlandScience of the Total Environment 294(1ndash3) 111ndash129 Pii S0048-9697(02)00059-1
Burke B 1975 Effect of drainage on the hydrology of blanket-bog Irishjournal of agricultural research 14 145ndash62
Byrne KA Farrell EP 2005 The effect of afforestation on soil carbondioxide emissions in blanket peatland in Ireland Forestry 78(3)217ndash227 DOI 101093forestrycpi020
Conway VM Millar A 1969 The hydrology of some small peat-coveredcatchments in the northern Pennines Journal of the Institute of WaterEngineers 14 415ndash24
Dept of Agriculture 1996 Growing for the futuremdasha strategic plan forthe Development of the Forestry Sector in Ireland Dublin
Dunn SM Mackay R 1996 Modelling the hydrological impacts of openditch drainage Journal of Hydrology 179(1ndash4) 37ndash66
Copyright copy 2012 John Wiley amp Sons Ltd
Eaton J McGoff N Byrne K Leahy P Kiely G 2008 Land cover changeand soil organic carbon stocks in the Republic of Ireland 1851ndash2000Climatic Change 91(3ndash4) 317ndash334 DOI 101007s10584-008-9412-2
Frolking S Roulet NT 2007 Holocene radiative forcing impact ofnorthern peatland carbon accumulation and methane emissions GlobalChange Biology 13(5) 1079ndash1088 DOI 101111j1365-2486200701339x
van Genuchten MT 1980 A closed-form equation for predicting thehydraulic conductivity of unsaturated soils Soil Science Society ofAmerica Journal 44(5) 892ndash898
Hargreaves KJ Milne R Cannell MGR 2003 Carbon balance ofafforested peatland in Scotland Forestry 76(3) 299ndash317
Heal KV Stidson RT Dickey CA Cape JN Heal MR 2004 New data forwater losses from mature Sitka spruce plantations in temperate uplandcatchments Hydrological Sciences Journal 49(3) 477ndash493
Hoag RS Price JS 1995 A field-scale natural gradient solute transportexperiment in peat at a Newfoundland blanket bog Journal ofHydrology 172(1ndash4) 171ndash184
Hogan JM van der Kamp G Barbour SL Schmidt R 2006 Fieldmethods for measuring hydraulic properties of peat deposits Hydro-logical Processes 20(17) 3635ndash3649 DOI 101002Hyp6379
Holden J 2005 Peatland hydrology and carbon release why small-scaleprocess matters Philosophical Transactions of the Royal Societya-Mathematical Physical and Engineering Sciences 363(1837)2891ndash2913 DOI 101098rsta20051671
Holden J Burt TP 2002 Infiltration runoff and sediment production inblanket peat catchments implications of field rainfall simulationexperiments Hydrological Processes 16(13) 2537ndash2557 DOI101002Hyp1014
Holden J Burt TP 2003 Hydraulic conductivity in upland blanketpeat measurement and variability Hydrological Processes 17(6)1227ndash1237 DOI 101002Hyp1182
Holden J Chapman PJ Labadz JC 2004 Artificial drainage of peatlandshydrological and hydrochemical process and wetland restorationProgress in Physical Geography 28(1) 95ndash123
Holden J Evans MG Burt TP Horton M 2006 Impact of land drainageon peatland hydrology Journal of Environmental Quality 35(5)1764ndash1778
Holden J Wallage ZE Lane SN McDonald AT 2011 Water tabledynamics in undisturbed drained and restored blanket peat Journal ofHydrology 402(1ndash2) 103ndash114 DOI 101016jjhydrol201103010
Horgan T Keane M McCarthy R Lally M Thompson D 2004 A Guide toForest Tree Species Selection and Silviculture in Ireland Coford Dublin
Hudson JA Gilman K Calder IR 1997 Land use and water issues in theuplands with reference to the Plynlimon study Hydrology and EarthSystem Sciences 1(3) 239ndash397
Institute of Hydrology 1991 Effects of upland afforestation on waterresources the Balquhidder experiment 1981ndash1991 Report no 116Institute of Hydrology Wallingford UK
Iritz L Johansson B Lundin L 1994 Impacts of forest drainage on floodsHydrological Sciences Journal 39(6) 637ndash661
Johnson RC 1990 The interception throughfall and stemflow in a forestin Highland Scotland and the comparison with other upland forests inthe UK Journal of Hydrology 118(1ndash4) 281ndash287
Koehler AK Murphy K Kiely G Sottocornola M 2009 Seasonalvariation of DOC concentration and annual loss of DOC from anAtlantic blanket bog in South Western Ireland Biogeochemistry 95231ndash242 DOI 101007s10533-009-9333-9
Koehler AK Sottocornola M Kiely G 2011 How strong is the currentcarbon sequestration of an Atlantic blanket bog Global ChangeBiology 17(1) 309ndash319 DOI 101111j1365-2486201002180x
Kolka RK Griagal DF Nater EA Verry ES 2001 Hydrologic cycling ofmercury and organic carbon in a forested upland-bog watershed SoilScience Society 65 897ndash905
Lafleur PM Hember RA Admiral SW Roulet NT 2005 Annual andseasonal variability in evapotranspiration and water table at a shrub-covered bog in southern Ontario Canada Hydrological Processes19(18) 3533ndash3550
Laine A Byrne KA Kiely G Tuittila ES 2007 Patterns in vegetationand CO2 dynamics along a water level gradient in a lowland blanketbog Ecosystems 10(6) 890ndash905 DOI 101007s10021-007-9067-2
Lane SN Brookes CJ Kirkby AJ Holden J 2004 A network-indexbasedversion of TOPMODEL for use with high-resolution digital topographicdata Hydrological Processes 18(1) 191ndash201
Lapen DR Price JS Gilbert R 2005 Modelling two-dimensional steady-state groundwater flow and flow sensitivity to boundary conditions inblanket peat complexes Hydrological Processes 19(2) 371ndash386 DOI101002Hyp1507
Hydrol Process (2012)DOI 101002hyp
C LEWIS ET AL
Lees JC 1972 Soil aeration and Sitka Spruce seedling growth in peatJournal of Ecology 60(2) 343ndash349
Letts MG Roulet N Comer NT 2000 Parameterization of peatlandhydraulic properties for the Canadian land surface scheme CanadianMeterological and Oceanographic Society 38 141ndash160
Lewis C Albertson J Xu X Kiely G 2011 Spatial variability of hydraulicconductivity and bulk density along a blanket peatland hillslopeHydrological Processes 26 1527ndash1537 DOI 101002hyp8252
Limpens J Berendse F Blodau C Canadell JG Freeman C Holden JRoulet N Rydin H Schaepman-Strub G 2008 Peatlands and thecarbon cycle from local processes to global implicationsmdasha synthesisBiogeosciences 5(5) 1475ndash1491
Nash JE Sutcliffe JV 1970 River flow forecasting through conceptualmodels part Imdasha discussion of principles Journal of Hydrology 10(3)282ndash290
NFI 2007 National Forest InventorymdashRepublic of IrelandmdashResultsJohnstown Castle Estate Co Wexford Ireland
Nilsson M Sagerfors J Buffam I Laudon H Eriksson T Grelle AKlemedtsson L Weslien P Lindroth A 2008 Contemporary carbonaccumulation in a boreal oligotrophic minerogenic miremdasha significantsink after accounting for all C-fluxes Global Change Biology 14(10)2317ndash2332 DOI 101111j1365-2486200801654x
Oechel WC Vourlitis GL Hastings SJ Zulueta RC Hinzman L Kane D2000 Acclimation of ecosystem CO2 exchange in the Alaskan Arctic inresponse to decadal climate warming Nature 406(6799) 978ndash981
Pilcher JR Mac an tSaoir S 1995 Wood Trees Forests in Ireland RoyalIrish Academy Dublin
Prevost M Belleau P Plamondon AP 1997 Substrate conditions in atreed peatland responses to drainage Ecoscience 4(4) 543ndash554
Price JS Branfireun BA Waddington JM Devito KJ 2005 Advancesin Canadian wetland hydrology 1999ndash2003 Hydrological Processes19(1) 201ndash214 DOI 101002Hyp5774
Ramchunder SJ Brown LE Holden J 2007 Environmental effects ofdrainage drain-blocking and prescribed vegetation burning in UKupland peatlands Progress in Physical Geography 2009(33) 49 DOI1011770309133309105245
Copyright copy 2012 John Wiley amp Sons Ltd
Reggiani P Sivapalan M Hassanizadeh SM 2000 Conservationequations governing hillslope responses exploring the physical basisof water balance Water Resources Research 36(7) 1845ndash1863
Rigon R Bertoldi G Over TM 2006 GEOtop a distributed hydrologicalmodel with coupled water and energy budgets Journal of Hydro-meteorology 7(3) 371ndash388
Robinson M 1986 Changes in catchment runoff following drainage andafforestation Journal of Hydrology 86(1ndash2) 71ndash84
Simoni S Zanotti F Bertoldi G Rigon R 2008 Modelling the probabilityof occurrence of shallow landslides and channelized debris flows usingGEOtop-FS Hydrological Processes 22(4) 532ndash545 DOI 101002Hyp6886
Sottocornola M Kiely G 2010 Energy fluxes and evaporationmechanisms in an Atlantic blanket bog in southwestern Ireland WaterResources Research 46 DOI 1010292010WR009078
Sottocornola M Laine A Kiely G Byrne KA Tuittila ES 2009Vegetation and environmental variation in an Atlantic blanket bog insouthwestern Ireland Plant Ecology 203(1) 69ndash81 DOI 101007s11258-008-9510-2
Strack M Waddington JM Rochefort L Tuittila ES 2006 Response ofvegetation and net ecosystem carbon dioxide exchange at different peatlandmicroforms following water table drawdown Journal of GeophysicalResearch-Biogeosciences 111(G2) DOI 1010292005jg000145
Tobin B Black K Osborne B Reidy B Bolger T Nieuwenhuis M 2006Assessment of allometric algorithms for estimating leaf biomass leafarea index and litter fall in different-aged Sitka spruce forests Forestry79(4) 453ndash465 DOI 101093forestrycpl030
Verry ES Timmons DR 1982 Waterborne nutrient flow through anupland-peatland watershed in Minnesota Ecology 65(5) 1456ndash1467
Waldron S Flowers H Arlaud C Bryant C McFarlane S 2009 Thesignificance of organic carbon and nutrient export from peatland-dominated landscapes subject to disturbance a stoichiometric perspectiveBiogeosciences 6(3) 363ndash374
Zanotti F Endrizzi S Bertoldi G Rigon R 2004 The GEOTOP snowmodule Hydrological Processes 18(18) 3667ndash3679 DOI 101002Hyp5794
Hydrol Process (2012)DOI 101002hyp
0
01
02
minus15
minus10
minus5
0
WT
Dep
th (
cm)
amp H
ourly
Rai
nfal
l (m
m)
0
1
2
Julian Days 2007
Flo
w (
m3 s
minus1 )
Flo
w (
m3 s
minus1 )
minus15
minus10
minus5
0
WT
Dep
th (
cm)
amp H
ourly
Rai
nfal
l (m
m)
340 3405 341 3415 342 3433425 3435 344
minus80
minus60
minus40
minus20
0
134 1345 135 1355 136 1365 137 1375 138
minus80
minus60
minus40
minus20
0Observed FlowScenario B Flow
Houly Rainfall
Observed FlowScenario BSimulated 2007
Hourly Rainfall
WT 2007
WT 2007
Figure 10 (a) For summer 2007 observed and modelled Scenario B flows (b) for winter 2007 observed simulated and Scenario B flows Thesimulated winter (b) and summer (a) WTs are also shown
HYDROLOGICAL RESPONSE OF AFFORESTED PEAT CATCHMENT
no flow in the stream Figure 10(b) shows that the converseoccurred between days 340 and 344 where the simulatedflow from Scenario B was higher than the observed flowAs there is a slight discrepancy between the peak flows andsimulated flows for reasons outlined earlier the simulationof the undisturbed peatland is also shown in Figure 10(b)
DISCUSSION
The comparisons of observed flows and WT depths withthe corresponding simulated values from the GEOtopmodel in the calibration and validation years show thatthe current configuration of GEOtop is capable of reliablysimulating the hydrological processes Central to thisconfiguration for the peatland is the spatial variation ofhydraulic conductivity Areas of low hydraulic conductivityat the margins near the stream are essential in maintainingthe elevated WT in the centre of the bog For the drainagescenarios once these areas of lower hydraulic conductivitywere modified by the insertion of a drainage network theWTs level in the centre of the bog fell Given that even aslight drop in WT impacts the vegetation distribution andcomposition (Sottocornola et al 2009) any disturbance ofthese relatively small areas of lower hydraulic conductivitywill likely affect a much larger area of a bogWhereas the practice of drainage prior to afforestation
of peatlands lowers the WT its depth will also be affectedby the increase in transpiration and canopy interceptionwith the change of land use from natural peatland to Sitkaspruce afforestation From Figure 9 and Table II we notethat the simulated ET increased in the mature forest(Scenario B) to 492mm greater than the pristine peatlandThe ET rate of the younger forest (Scenario A) wassimilar to the undisturbed peatland A study of ET by
Copyright copy 2012 John Wiley amp Sons Ltd
Sottocornola and Kiely (2010) at the same site found thatthe ET was not water limited and the observed ET rangedbetween 369 and 424mm with an average of 394mm ofET over a 5-year period Sottocornola and Kiely (2010)concluded that one of the key limiting factors in ET wasthe lack of vascular plants which if present wouldenhance transpiration Although Figure 9 shows that thereis a drop in the WT for Scenario A particularly in thesummer months at this stage of development of a forestthe tree canopy would not provide full cover As the WTis lower than in the undisturbed peatland the ET ratefrom the original peatland vegetation which has a largeproportion of non-vascular plants will have decreasedThus it would appear that the increase in ET under theSitka spruce canopy is offset by the decrease in ET fromthe original peatland vegetationThe estimated ET (913mm) of Scenario B of a more
mature forest was 412mm higher than Scenario A Suchincreases in ET as a result of changing peatland land usefrom grass mosses and bare peat to Sitka spruce havebeen noted by others Studies by others in areas such asthe Scottish highlands that may be considered similar insoil type and climate to our Irish study site have foundthat Sitka spruce may intercept between 28 (596mm)(Johnson 1990) and 52 (1514mm) (Heal et al 2004)of precipitation Transpiration of Sitka spruce in Cumbriahas been estimated at 12 of precipitation or 172mm(Anderson et al 1990) We note that our estimates of ETfrom Scenario B at 32 of rainfall is in the rangeof values cited in the literature Results from a study bythe Institute of Hydrology (1991) into the effects ofupland afforestation on water resources suggest that ETon a forested catchment receiving 2800mm precipitationannually was approximately 1190mm which is similar to
Hydrol Process (2012)DOI 101002hyp
C LEWIS ET AL
the ET value of 925mm in our Scenario B Other studieson afforested peatlands such as the Marcell experimentalforest in Minnesota and the Huhtisuo catchment inFinland found that ET represented a larger percentageof precipitation than values noted in this study A studyby Verry and Timmons (1982) found that ET from amature Black Spruce forest represented up to 66 of theannual precipitation with Iritz et al (1994) reporting ETvalues of 61 of precipitation in the Huhtisuo catchmentin Finland However precipitation was much lower inboth locations with the Huhtisuo catchment and Marcellforest annually receiving approximately 700 and 800mmprecipitation respectively The climate at both locationsis described as continental with streamflow tending tocease for 2ndash4months of each winter because of lowertemperatures in Marcell (Kolka et al 2001) Thedifference in climate is likely to have resulted in thedifference in simulated and observed ET values in ourstudy and that of those reported from the Huhtisuocatchment and Marcell forest In our site the averageprecipitation over a 5-year period was 2597mm with anaverage ET of 394mm representing approximately 15of precipitation The increased ET associated withafforestation in conjunction with the drainage networkresulted in a WT draw down in dry periods (Figure 9)The WT in Scenarios A and B was on average 165 and205 cm below the observed WT for the calendar year2008 This is similar to the draw down noted by Bragg(2002) where the WT in a forested peatland wasfound to be 100ndash150 cm below that in the adjacentunforested peatlandAs the runoff from peatlands in their natural state
(in Western Europe) is known to be flashy because ofsaturation excess overland flow a lowering of the WT isexpected to reduce the volume of runoff produced fromsaturation excess This is noted in the hydrograph for asummer period in Figure 10(a) which shows the observedand the simulated flows from Scenario B for Julian days134ndash140 The rain event on day 135 was preceded by adry period in April and May 2007 the end of which theWT was observed to be at its lowest level since recordsbegan in 2003 At the start of the precipitation event ofday 135 the WT of Scenario B was 698 cm lower thanthe observed WT of the pristine peatland and 592 cmbelow the drained simulation With this lower WT andreduced precipitation reaching the ground because ofcanopy interception the streamflow from the simulatedforest catchment is greatly reduced However theconverse applies for the streamflow in winter as shownin Figure 10(b) Prior to day 340 there had been frequentrain events which had resulted in a much higher WT bothin the simulated and observed cases A total of 53mm fellon day 340 resulting in a higher simulated than observedflow As the observed WT was 19 cm below the surfaceand Scenario B was just 25 cm below the surface weconsider that both simulations produced saturation excessoverland flow However the forested simulation had amore extensive drainage network that was able to conveyany surface runoff to the catchment outfall more rapidly
Copyright copy 2012 John Wiley amp Sons Ltd
resulting in a higher peak flows Such a phenomenon hasalso been noted by others with Ahti (1980) finding thatincreasing density of drainage ditches increased peakflows in a Finish peatland and model simulations by Iritzet al (1994) noting that peak flows may be increased byforest drainage when the WT is close to the surface Thestudies of Anderson et al (2000) and (Ballard et al 2011b)also drew similar conclusionsThis phenomenon of increasing the streamflow following
afforestation of peatlands may have implications inlarger catchments where afforestation may be falselyconsidered as a flood mitigation measure Likewise thereduction of flows from peatlands throughout thesummer and in particular after dry periods may be ofconcern for water resource managers
CONCLUSION
With regard to applying the hydrological GEOtop modelto an Atlantic blanket peatland we found that GEOtopwas suitable for the purposes of modelling the hydro-logical processes Central to this was the input of thespatial variation of the saturated hydraulic conductivityPeat with a lower hydraulic conductivity at the marginsresults in elevating the WT depth in the centre of the bogwhich in turn results in saturation excess overland flowduring precipitation events It is also clear from thescenario modelling that afforestation and its associateddrainage can change the hydrological response of thispristine peatland catchment Whereas the ET rates from ayoung Sitka spruce catchment were similar to the existingpristine peatland catchment a semi-mature Sitka Spruceforest resulted in an increase in ET of 492mm throughincreased transpiration from the canopy and interceptionThis increase in ET was particularly noticeable in summerand resulted in an increase in depth of the WT andreduction in streamflow However in winter followingperiods of heavy rainfall the WT depth approached thatof an unforested drained peatland This shallow WT depthin combination with a drainage network results in anincrease in peak flow in times of heavy rainfall Thissuggests that there is limited or no benefit to floodattenuation from peatland afforestation during winterperiods when the WT is high whereas the converseapplies to summer flows where the rainfall runoff wasreduced in dry periods
ACKNOWLEDGEMENTS
This study was funded by the Irish EnvironmentalProtection Agency under the Science Technology Researchand Innovation for the Environment Programme 2007ndash2013of Ireland (Soil H Interactions of soil hydrology land useand climate change and their impact on soil quality 2007-S-SL-1-S1) We would like to thank Dr Alice Wemaere of theEnvironmental Protection Agency for her continuoussupport We would also like to thank the SoilH steeringcommittee for their support advise and encouragement
Hydrol Process (2012)DOI 101002hyp
HYDROLOGICAL RESPONSE OF AFFORESTED PEAT CATCHMENT
throughout this project Prof Mark Kibblewhite Dr ArwynJones and Dr Otto Spaargaren We particularly wish tothank our present and past colleagues in the HYDROMETgroup Dr Paul Leahy Mr Nelius Foley Dr Rashid Rafiqueand Dr Michael Wellock We thank Caitriona Douglas ofNPWS and Coillte Teoranta for the permission to use thestudy site We also very much appreciate the support of thedevelopers of GEOtop in particular Prof Riccardo Rigonand Dr Matteo Dallrsquo Amico We acknowledge in particularthe earlier work of Dr Anna Laine Dr Matteo SottocornolaandDrAnn-KristinKoehler and their work and publicationsfrom the same site
REFERENCES
Abbott MB Bathurst JC Cunge JA Oconnell PE Rasmussen J 1986An introduction to the European hydrological systemmdashsystemehydrologique Europeen she 2 Structure of a physically-baseddistributed modeling system Journal of Hydrology 87(1ndash2) 61ndash77
Ahti E 1980 Ditch spacing experiments in estimating the effects ofpeatland drainage on summer runoff Proceedings of the HelsinkiSymposium Helsinki
Anderson AR Pyatt DG 1986 Interception of precipitation by Pole-StageSitka Spruce and Lodgepole Pine and Mature Sitka Spruce at KielderForest Northumberland Forestry 59(1) 29ndash38
Anderson AR Pyatt DG Stannard JP 1990 The effects of clearfelling aSitka Spruce Stand on the water-balance of a peaty gley soil atKershope Forest Cumbria Forestry 63(1) 51ndash71
Anderson AR Day R Pyatt DG 2000 Physical and hydrological impactsof blanket bog afforestation at Bad arsquo Cheo Caithness the first 5 yearsForestry 73(5) 467ndash478
Arnold JG Srinivasan R Muttiah RS Williams JR 1998 Large areahydrologic modeling and assessment Part I model developmentAmerican water resources Association 34(1) 73ndash89
Baird AJ Eades PA Surridge BWJ 2008 The hydraulic structure of araised bog and its implications for ecohydrological modelling of bogdevelopment Ecohydrology 1(4) 289ndash298 DOI 101002Eco33
Ballard CE McIntyre HS Wheater HS Holden J Wallage ZE 2011aHydrological modelling of drained blanket peatland Journal ofHydrology 407 81ndash83 http dxdoiorg101016jjhydrol201107005
Ballard CE Mclntyre N Wheater HS 2011b Effects of peatland drainagemanagement on peak flows Hydrology and Earth System Sciences 86533ndash6563 DOI 105194hessd-8-6533-2011
Bay R 1969 Runoff from small peatland watersheds Journal ofHydrology 9 90ndash102
Bertoldi G Rigon R Over TM 2006 Impact of watershed geomorphiccharacteristics on the energy and water budgets Journal of Hydro-meteorology 7(3) 389ndash403
Bertoldi G Notarnicola C Leitinger G Endrizzi S Zebisch M DellaChiesa S Tappeiner U 2010 Topographical and ecohydrologicalcontrols on land surface temperature in an alpine catchmentEcohydrology 3(2) 189ndash204 DOI 101002Eco129
Beven K Kirkby MJ 1979 A physically based variable contributing areamodel of basin hydrology Hydrological Sciences Bulletin 23 419ndash437
Black K Gallagher G Orsquo Brien P Redmond J Barrett F Twomey M2008 Dispelling myths the ture extent of recent peatland afforestationin Ireland Coford Dublin
Bragg OM 2002 Hydrology of peat-forming wetlands in ScotlandScience of the Total Environment 294(1ndash3) 111ndash129 Pii S0048-9697(02)00059-1
Burke B 1975 Effect of drainage on the hydrology of blanket-bog Irishjournal of agricultural research 14 145ndash62
Byrne KA Farrell EP 2005 The effect of afforestation on soil carbondioxide emissions in blanket peatland in Ireland Forestry 78(3)217ndash227 DOI 101093forestrycpi020
Conway VM Millar A 1969 The hydrology of some small peat-coveredcatchments in the northern Pennines Journal of the Institute of WaterEngineers 14 415ndash24
Dept of Agriculture 1996 Growing for the futuremdasha strategic plan forthe Development of the Forestry Sector in Ireland Dublin
Dunn SM Mackay R 1996 Modelling the hydrological impacts of openditch drainage Journal of Hydrology 179(1ndash4) 37ndash66
Copyright copy 2012 John Wiley amp Sons Ltd
Eaton J McGoff N Byrne K Leahy P Kiely G 2008 Land cover changeand soil organic carbon stocks in the Republic of Ireland 1851ndash2000Climatic Change 91(3ndash4) 317ndash334 DOI 101007s10584-008-9412-2
Frolking S Roulet NT 2007 Holocene radiative forcing impact ofnorthern peatland carbon accumulation and methane emissions GlobalChange Biology 13(5) 1079ndash1088 DOI 101111j1365-2486200701339x
van Genuchten MT 1980 A closed-form equation for predicting thehydraulic conductivity of unsaturated soils Soil Science Society ofAmerica Journal 44(5) 892ndash898
Hargreaves KJ Milne R Cannell MGR 2003 Carbon balance ofafforested peatland in Scotland Forestry 76(3) 299ndash317
Heal KV Stidson RT Dickey CA Cape JN Heal MR 2004 New data forwater losses from mature Sitka spruce plantations in temperate uplandcatchments Hydrological Sciences Journal 49(3) 477ndash493
Hoag RS Price JS 1995 A field-scale natural gradient solute transportexperiment in peat at a Newfoundland blanket bog Journal ofHydrology 172(1ndash4) 171ndash184
Hogan JM van der Kamp G Barbour SL Schmidt R 2006 Fieldmethods for measuring hydraulic properties of peat deposits Hydro-logical Processes 20(17) 3635ndash3649 DOI 101002Hyp6379
Holden J 2005 Peatland hydrology and carbon release why small-scaleprocess matters Philosophical Transactions of the Royal Societya-Mathematical Physical and Engineering Sciences 363(1837)2891ndash2913 DOI 101098rsta20051671
Holden J Burt TP 2002 Infiltration runoff and sediment production inblanket peat catchments implications of field rainfall simulationexperiments Hydrological Processes 16(13) 2537ndash2557 DOI101002Hyp1014
Holden J Burt TP 2003 Hydraulic conductivity in upland blanketpeat measurement and variability Hydrological Processes 17(6)1227ndash1237 DOI 101002Hyp1182
Holden J Chapman PJ Labadz JC 2004 Artificial drainage of peatlandshydrological and hydrochemical process and wetland restorationProgress in Physical Geography 28(1) 95ndash123
Holden J Evans MG Burt TP Horton M 2006 Impact of land drainageon peatland hydrology Journal of Environmental Quality 35(5)1764ndash1778
Holden J Wallage ZE Lane SN McDonald AT 2011 Water tabledynamics in undisturbed drained and restored blanket peat Journal ofHydrology 402(1ndash2) 103ndash114 DOI 101016jjhydrol201103010
Horgan T Keane M McCarthy R Lally M Thompson D 2004 A Guide toForest Tree Species Selection and Silviculture in Ireland Coford Dublin
Hudson JA Gilman K Calder IR 1997 Land use and water issues in theuplands with reference to the Plynlimon study Hydrology and EarthSystem Sciences 1(3) 239ndash397
Institute of Hydrology 1991 Effects of upland afforestation on waterresources the Balquhidder experiment 1981ndash1991 Report no 116Institute of Hydrology Wallingford UK
Iritz L Johansson B Lundin L 1994 Impacts of forest drainage on floodsHydrological Sciences Journal 39(6) 637ndash661
Johnson RC 1990 The interception throughfall and stemflow in a forestin Highland Scotland and the comparison with other upland forests inthe UK Journal of Hydrology 118(1ndash4) 281ndash287
Koehler AK Murphy K Kiely G Sottocornola M 2009 Seasonalvariation of DOC concentration and annual loss of DOC from anAtlantic blanket bog in South Western Ireland Biogeochemistry 95231ndash242 DOI 101007s10533-009-9333-9
Koehler AK Sottocornola M Kiely G 2011 How strong is the currentcarbon sequestration of an Atlantic blanket bog Global ChangeBiology 17(1) 309ndash319 DOI 101111j1365-2486201002180x
Kolka RK Griagal DF Nater EA Verry ES 2001 Hydrologic cycling ofmercury and organic carbon in a forested upland-bog watershed SoilScience Society 65 897ndash905
Lafleur PM Hember RA Admiral SW Roulet NT 2005 Annual andseasonal variability in evapotranspiration and water table at a shrub-covered bog in southern Ontario Canada Hydrological Processes19(18) 3533ndash3550
Laine A Byrne KA Kiely G Tuittila ES 2007 Patterns in vegetationand CO2 dynamics along a water level gradient in a lowland blanketbog Ecosystems 10(6) 890ndash905 DOI 101007s10021-007-9067-2
Lane SN Brookes CJ Kirkby AJ Holden J 2004 A network-indexbasedversion of TOPMODEL for use with high-resolution digital topographicdata Hydrological Processes 18(1) 191ndash201
Lapen DR Price JS Gilbert R 2005 Modelling two-dimensional steady-state groundwater flow and flow sensitivity to boundary conditions inblanket peat complexes Hydrological Processes 19(2) 371ndash386 DOI101002Hyp1507
Hydrol Process (2012)DOI 101002hyp
C LEWIS ET AL
Lees JC 1972 Soil aeration and Sitka Spruce seedling growth in peatJournal of Ecology 60(2) 343ndash349
Letts MG Roulet N Comer NT 2000 Parameterization of peatlandhydraulic properties for the Canadian land surface scheme CanadianMeterological and Oceanographic Society 38 141ndash160
Lewis C Albertson J Xu X Kiely G 2011 Spatial variability of hydraulicconductivity and bulk density along a blanket peatland hillslopeHydrological Processes 26 1527ndash1537 DOI 101002hyp8252
Limpens J Berendse F Blodau C Canadell JG Freeman C Holden JRoulet N Rydin H Schaepman-Strub G 2008 Peatlands and thecarbon cycle from local processes to global implicationsmdasha synthesisBiogeosciences 5(5) 1475ndash1491
Nash JE Sutcliffe JV 1970 River flow forecasting through conceptualmodels part Imdasha discussion of principles Journal of Hydrology 10(3)282ndash290
NFI 2007 National Forest InventorymdashRepublic of IrelandmdashResultsJohnstown Castle Estate Co Wexford Ireland
Nilsson M Sagerfors J Buffam I Laudon H Eriksson T Grelle AKlemedtsson L Weslien P Lindroth A 2008 Contemporary carbonaccumulation in a boreal oligotrophic minerogenic miremdasha significantsink after accounting for all C-fluxes Global Change Biology 14(10)2317ndash2332 DOI 101111j1365-2486200801654x
Oechel WC Vourlitis GL Hastings SJ Zulueta RC Hinzman L Kane D2000 Acclimation of ecosystem CO2 exchange in the Alaskan Arctic inresponse to decadal climate warming Nature 406(6799) 978ndash981
Pilcher JR Mac an tSaoir S 1995 Wood Trees Forests in Ireland RoyalIrish Academy Dublin
Prevost M Belleau P Plamondon AP 1997 Substrate conditions in atreed peatland responses to drainage Ecoscience 4(4) 543ndash554
Price JS Branfireun BA Waddington JM Devito KJ 2005 Advancesin Canadian wetland hydrology 1999ndash2003 Hydrological Processes19(1) 201ndash214 DOI 101002Hyp5774
Ramchunder SJ Brown LE Holden J 2007 Environmental effects ofdrainage drain-blocking and prescribed vegetation burning in UKupland peatlands Progress in Physical Geography 2009(33) 49 DOI1011770309133309105245
Copyright copy 2012 John Wiley amp Sons Ltd
Reggiani P Sivapalan M Hassanizadeh SM 2000 Conservationequations governing hillslope responses exploring the physical basisof water balance Water Resources Research 36(7) 1845ndash1863
Rigon R Bertoldi G Over TM 2006 GEOtop a distributed hydrologicalmodel with coupled water and energy budgets Journal of Hydro-meteorology 7(3) 371ndash388
Robinson M 1986 Changes in catchment runoff following drainage andafforestation Journal of Hydrology 86(1ndash2) 71ndash84
Simoni S Zanotti F Bertoldi G Rigon R 2008 Modelling the probabilityof occurrence of shallow landslides and channelized debris flows usingGEOtop-FS Hydrological Processes 22(4) 532ndash545 DOI 101002Hyp6886
Sottocornola M Kiely G 2010 Energy fluxes and evaporationmechanisms in an Atlantic blanket bog in southwestern Ireland WaterResources Research 46 DOI 1010292010WR009078
Sottocornola M Laine A Kiely G Byrne KA Tuittila ES 2009Vegetation and environmental variation in an Atlantic blanket bog insouthwestern Ireland Plant Ecology 203(1) 69ndash81 DOI 101007s11258-008-9510-2
Strack M Waddington JM Rochefort L Tuittila ES 2006 Response ofvegetation and net ecosystem carbon dioxide exchange at different peatlandmicroforms following water table drawdown Journal of GeophysicalResearch-Biogeosciences 111(G2) DOI 1010292005jg000145
Tobin B Black K Osborne B Reidy B Bolger T Nieuwenhuis M 2006Assessment of allometric algorithms for estimating leaf biomass leafarea index and litter fall in different-aged Sitka spruce forests Forestry79(4) 453ndash465 DOI 101093forestrycpl030
Verry ES Timmons DR 1982 Waterborne nutrient flow through anupland-peatland watershed in Minnesota Ecology 65(5) 1456ndash1467
Waldron S Flowers H Arlaud C Bryant C McFarlane S 2009 Thesignificance of organic carbon and nutrient export from peatland-dominated landscapes subject to disturbance a stoichiometric perspectiveBiogeosciences 6(3) 363ndash374
Zanotti F Endrizzi S Bertoldi G Rigon R 2004 The GEOTOP snowmodule Hydrological Processes 18(18) 3667ndash3679 DOI 101002Hyp5794
Hydrol Process (2012)DOI 101002hyp
C LEWIS ET AL
the ET value of 925mm in our Scenario B Other studieson afforested peatlands such as the Marcell experimentalforest in Minnesota and the Huhtisuo catchment inFinland found that ET represented a larger percentageof precipitation than values noted in this study A studyby Verry and Timmons (1982) found that ET from amature Black Spruce forest represented up to 66 of theannual precipitation with Iritz et al (1994) reporting ETvalues of 61 of precipitation in the Huhtisuo catchmentin Finland However precipitation was much lower inboth locations with the Huhtisuo catchment and Marcellforest annually receiving approximately 700 and 800mmprecipitation respectively The climate at both locationsis described as continental with streamflow tending tocease for 2ndash4months of each winter because of lowertemperatures in Marcell (Kolka et al 2001) Thedifference in climate is likely to have resulted in thedifference in simulated and observed ET values in ourstudy and that of those reported from the Huhtisuocatchment and Marcell forest In our site the averageprecipitation over a 5-year period was 2597mm with anaverage ET of 394mm representing approximately 15of precipitation The increased ET associated withafforestation in conjunction with the drainage networkresulted in a WT draw down in dry periods (Figure 9)The WT in Scenarios A and B was on average 165 and205 cm below the observed WT for the calendar year2008 This is similar to the draw down noted by Bragg(2002) where the WT in a forested peatland wasfound to be 100ndash150 cm below that in the adjacentunforested peatlandAs the runoff from peatlands in their natural state
(in Western Europe) is known to be flashy because ofsaturation excess overland flow a lowering of the WT isexpected to reduce the volume of runoff produced fromsaturation excess This is noted in the hydrograph for asummer period in Figure 10(a) which shows the observedand the simulated flows from Scenario B for Julian days134ndash140 The rain event on day 135 was preceded by adry period in April and May 2007 the end of which theWT was observed to be at its lowest level since recordsbegan in 2003 At the start of the precipitation event ofday 135 the WT of Scenario B was 698 cm lower thanthe observed WT of the pristine peatland and 592 cmbelow the drained simulation With this lower WT andreduced precipitation reaching the ground because ofcanopy interception the streamflow from the simulatedforest catchment is greatly reduced However theconverse applies for the streamflow in winter as shownin Figure 10(b) Prior to day 340 there had been frequentrain events which had resulted in a much higher WT bothin the simulated and observed cases A total of 53mm fellon day 340 resulting in a higher simulated than observedflow As the observed WT was 19 cm below the surfaceand Scenario B was just 25 cm below the surface weconsider that both simulations produced saturation excessoverland flow However the forested simulation had amore extensive drainage network that was able to conveyany surface runoff to the catchment outfall more rapidly
Copyright copy 2012 John Wiley amp Sons Ltd
resulting in a higher peak flows Such a phenomenon hasalso been noted by others with Ahti (1980) finding thatincreasing density of drainage ditches increased peakflows in a Finish peatland and model simulations by Iritzet al (1994) noting that peak flows may be increased byforest drainage when the WT is close to the surface Thestudies of Anderson et al (2000) and (Ballard et al 2011b)also drew similar conclusionsThis phenomenon of increasing the streamflow following
afforestation of peatlands may have implications inlarger catchments where afforestation may be falselyconsidered as a flood mitigation measure Likewise thereduction of flows from peatlands throughout thesummer and in particular after dry periods may be ofconcern for water resource managers
CONCLUSION
With regard to applying the hydrological GEOtop modelto an Atlantic blanket peatland we found that GEOtopwas suitable for the purposes of modelling the hydro-logical processes Central to this was the input of thespatial variation of the saturated hydraulic conductivityPeat with a lower hydraulic conductivity at the marginsresults in elevating the WT depth in the centre of the bogwhich in turn results in saturation excess overland flowduring precipitation events It is also clear from thescenario modelling that afforestation and its associateddrainage can change the hydrological response of thispristine peatland catchment Whereas the ET rates from ayoung Sitka spruce catchment were similar to the existingpristine peatland catchment a semi-mature Sitka Spruceforest resulted in an increase in ET of 492mm throughincreased transpiration from the canopy and interceptionThis increase in ET was particularly noticeable in summerand resulted in an increase in depth of the WT andreduction in streamflow However in winter followingperiods of heavy rainfall the WT depth approached thatof an unforested drained peatland This shallow WT depthin combination with a drainage network results in anincrease in peak flow in times of heavy rainfall Thissuggests that there is limited or no benefit to floodattenuation from peatland afforestation during winterperiods when the WT is high whereas the converseapplies to summer flows where the rainfall runoff wasreduced in dry periods
ACKNOWLEDGEMENTS
This study was funded by the Irish EnvironmentalProtection Agency under the Science Technology Researchand Innovation for the Environment Programme 2007ndash2013of Ireland (Soil H Interactions of soil hydrology land useand climate change and their impact on soil quality 2007-S-SL-1-S1) We would like to thank Dr Alice Wemaere of theEnvironmental Protection Agency for her continuoussupport We would also like to thank the SoilH steeringcommittee for their support advise and encouragement
Hydrol Process (2012)DOI 101002hyp
HYDROLOGICAL RESPONSE OF AFFORESTED PEAT CATCHMENT
throughout this project Prof Mark Kibblewhite Dr ArwynJones and Dr Otto Spaargaren We particularly wish tothank our present and past colleagues in the HYDROMETgroup Dr Paul Leahy Mr Nelius Foley Dr Rashid Rafiqueand Dr Michael Wellock We thank Caitriona Douglas ofNPWS and Coillte Teoranta for the permission to use thestudy site We also very much appreciate the support of thedevelopers of GEOtop in particular Prof Riccardo Rigonand Dr Matteo Dallrsquo Amico We acknowledge in particularthe earlier work of Dr Anna Laine Dr Matteo SottocornolaandDrAnn-KristinKoehler and their work and publicationsfrom the same site
REFERENCES
Abbott MB Bathurst JC Cunge JA Oconnell PE Rasmussen J 1986An introduction to the European hydrological systemmdashsystemehydrologique Europeen she 2 Structure of a physically-baseddistributed modeling system Journal of Hydrology 87(1ndash2) 61ndash77
Ahti E 1980 Ditch spacing experiments in estimating the effects ofpeatland drainage on summer runoff Proceedings of the HelsinkiSymposium Helsinki
Anderson AR Pyatt DG 1986 Interception of precipitation by Pole-StageSitka Spruce and Lodgepole Pine and Mature Sitka Spruce at KielderForest Northumberland Forestry 59(1) 29ndash38
Anderson AR Pyatt DG Stannard JP 1990 The effects of clearfelling aSitka Spruce Stand on the water-balance of a peaty gley soil atKershope Forest Cumbria Forestry 63(1) 51ndash71
Anderson AR Day R Pyatt DG 2000 Physical and hydrological impactsof blanket bog afforestation at Bad arsquo Cheo Caithness the first 5 yearsForestry 73(5) 467ndash478
Arnold JG Srinivasan R Muttiah RS Williams JR 1998 Large areahydrologic modeling and assessment Part I model developmentAmerican water resources Association 34(1) 73ndash89
Baird AJ Eades PA Surridge BWJ 2008 The hydraulic structure of araised bog and its implications for ecohydrological modelling of bogdevelopment Ecohydrology 1(4) 289ndash298 DOI 101002Eco33
Ballard CE McIntyre HS Wheater HS Holden J Wallage ZE 2011aHydrological modelling of drained blanket peatland Journal ofHydrology 407 81ndash83 http dxdoiorg101016jjhydrol201107005
Ballard CE Mclntyre N Wheater HS 2011b Effects of peatland drainagemanagement on peak flows Hydrology and Earth System Sciences 86533ndash6563 DOI 105194hessd-8-6533-2011
Bay R 1969 Runoff from small peatland watersheds Journal ofHydrology 9 90ndash102
Bertoldi G Rigon R Over TM 2006 Impact of watershed geomorphiccharacteristics on the energy and water budgets Journal of Hydro-meteorology 7(3) 389ndash403
Bertoldi G Notarnicola C Leitinger G Endrizzi S Zebisch M DellaChiesa S Tappeiner U 2010 Topographical and ecohydrologicalcontrols on land surface temperature in an alpine catchmentEcohydrology 3(2) 189ndash204 DOI 101002Eco129
Beven K Kirkby MJ 1979 A physically based variable contributing areamodel of basin hydrology Hydrological Sciences Bulletin 23 419ndash437
Black K Gallagher G Orsquo Brien P Redmond J Barrett F Twomey M2008 Dispelling myths the ture extent of recent peatland afforestationin Ireland Coford Dublin
Bragg OM 2002 Hydrology of peat-forming wetlands in ScotlandScience of the Total Environment 294(1ndash3) 111ndash129 Pii S0048-9697(02)00059-1
Burke B 1975 Effect of drainage on the hydrology of blanket-bog Irishjournal of agricultural research 14 145ndash62
Byrne KA Farrell EP 2005 The effect of afforestation on soil carbondioxide emissions in blanket peatland in Ireland Forestry 78(3)217ndash227 DOI 101093forestrycpi020
Conway VM Millar A 1969 The hydrology of some small peat-coveredcatchments in the northern Pennines Journal of the Institute of WaterEngineers 14 415ndash24
Dept of Agriculture 1996 Growing for the futuremdasha strategic plan forthe Development of the Forestry Sector in Ireland Dublin
Dunn SM Mackay R 1996 Modelling the hydrological impacts of openditch drainage Journal of Hydrology 179(1ndash4) 37ndash66
Copyright copy 2012 John Wiley amp Sons Ltd
Eaton J McGoff N Byrne K Leahy P Kiely G 2008 Land cover changeand soil organic carbon stocks in the Republic of Ireland 1851ndash2000Climatic Change 91(3ndash4) 317ndash334 DOI 101007s10584-008-9412-2
Frolking S Roulet NT 2007 Holocene radiative forcing impact ofnorthern peatland carbon accumulation and methane emissions GlobalChange Biology 13(5) 1079ndash1088 DOI 101111j1365-2486200701339x
van Genuchten MT 1980 A closed-form equation for predicting thehydraulic conductivity of unsaturated soils Soil Science Society ofAmerica Journal 44(5) 892ndash898
Hargreaves KJ Milne R Cannell MGR 2003 Carbon balance ofafforested peatland in Scotland Forestry 76(3) 299ndash317
Heal KV Stidson RT Dickey CA Cape JN Heal MR 2004 New data forwater losses from mature Sitka spruce plantations in temperate uplandcatchments Hydrological Sciences Journal 49(3) 477ndash493
Hoag RS Price JS 1995 A field-scale natural gradient solute transportexperiment in peat at a Newfoundland blanket bog Journal ofHydrology 172(1ndash4) 171ndash184
Hogan JM van der Kamp G Barbour SL Schmidt R 2006 Fieldmethods for measuring hydraulic properties of peat deposits Hydro-logical Processes 20(17) 3635ndash3649 DOI 101002Hyp6379
Holden J 2005 Peatland hydrology and carbon release why small-scaleprocess matters Philosophical Transactions of the Royal Societya-Mathematical Physical and Engineering Sciences 363(1837)2891ndash2913 DOI 101098rsta20051671
Holden J Burt TP 2002 Infiltration runoff and sediment production inblanket peat catchments implications of field rainfall simulationexperiments Hydrological Processes 16(13) 2537ndash2557 DOI101002Hyp1014
Holden J Burt TP 2003 Hydraulic conductivity in upland blanketpeat measurement and variability Hydrological Processes 17(6)1227ndash1237 DOI 101002Hyp1182
Holden J Chapman PJ Labadz JC 2004 Artificial drainage of peatlandshydrological and hydrochemical process and wetland restorationProgress in Physical Geography 28(1) 95ndash123
Holden J Evans MG Burt TP Horton M 2006 Impact of land drainageon peatland hydrology Journal of Environmental Quality 35(5)1764ndash1778
Holden J Wallage ZE Lane SN McDonald AT 2011 Water tabledynamics in undisturbed drained and restored blanket peat Journal ofHydrology 402(1ndash2) 103ndash114 DOI 101016jjhydrol201103010
Horgan T Keane M McCarthy R Lally M Thompson D 2004 A Guide toForest Tree Species Selection and Silviculture in Ireland Coford Dublin
Hudson JA Gilman K Calder IR 1997 Land use and water issues in theuplands with reference to the Plynlimon study Hydrology and EarthSystem Sciences 1(3) 239ndash397
Institute of Hydrology 1991 Effects of upland afforestation on waterresources the Balquhidder experiment 1981ndash1991 Report no 116Institute of Hydrology Wallingford UK
Iritz L Johansson B Lundin L 1994 Impacts of forest drainage on floodsHydrological Sciences Journal 39(6) 637ndash661
Johnson RC 1990 The interception throughfall and stemflow in a forestin Highland Scotland and the comparison with other upland forests inthe UK Journal of Hydrology 118(1ndash4) 281ndash287
Koehler AK Murphy K Kiely G Sottocornola M 2009 Seasonalvariation of DOC concentration and annual loss of DOC from anAtlantic blanket bog in South Western Ireland Biogeochemistry 95231ndash242 DOI 101007s10533-009-9333-9
Koehler AK Sottocornola M Kiely G 2011 How strong is the currentcarbon sequestration of an Atlantic blanket bog Global ChangeBiology 17(1) 309ndash319 DOI 101111j1365-2486201002180x
Kolka RK Griagal DF Nater EA Verry ES 2001 Hydrologic cycling ofmercury and organic carbon in a forested upland-bog watershed SoilScience Society 65 897ndash905
Lafleur PM Hember RA Admiral SW Roulet NT 2005 Annual andseasonal variability in evapotranspiration and water table at a shrub-covered bog in southern Ontario Canada Hydrological Processes19(18) 3533ndash3550
Laine A Byrne KA Kiely G Tuittila ES 2007 Patterns in vegetationand CO2 dynamics along a water level gradient in a lowland blanketbog Ecosystems 10(6) 890ndash905 DOI 101007s10021-007-9067-2
Lane SN Brookes CJ Kirkby AJ Holden J 2004 A network-indexbasedversion of TOPMODEL for use with high-resolution digital topographicdata Hydrological Processes 18(1) 191ndash201
Lapen DR Price JS Gilbert R 2005 Modelling two-dimensional steady-state groundwater flow and flow sensitivity to boundary conditions inblanket peat complexes Hydrological Processes 19(2) 371ndash386 DOI101002Hyp1507
Hydrol Process (2012)DOI 101002hyp
C LEWIS ET AL
Lees JC 1972 Soil aeration and Sitka Spruce seedling growth in peatJournal of Ecology 60(2) 343ndash349
Letts MG Roulet N Comer NT 2000 Parameterization of peatlandhydraulic properties for the Canadian land surface scheme CanadianMeterological and Oceanographic Society 38 141ndash160
Lewis C Albertson J Xu X Kiely G 2011 Spatial variability of hydraulicconductivity and bulk density along a blanket peatland hillslopeHydrological Processes 26 1527ndash1537 DOI 101002hyp8252
Limpens J Berendse F Blodau C Canadell JG Freeman C Holden JRoulet N Rydin H Schaepman-Strub G 2008 Peatlands and thecarbon cycle from local processes to global implicationsmdasha synthesisBiogeosciences 5(5) 1475ndash1491
Nash JE Sutcliffe JV 1970 River flow forecasting through conceptualmodels part Imdasha discussion of principles Journal of Hydrology 10(3)282ndash290
NFI 2007 National Forest InventorymdashRepublic of IrelandmdashResultsJohnstown Castle Estate Co Wexford Ireland
Nilsson M Sagerfors J Buffam I Laudon H Eriksson T Grelle AKlemedtsson L Weslien P Lindroth A 2008 Contemporary carbonaccumulation in a boreal oligotrophic minerogenic miremdasha significantsink after accounting for all C-fluxes Global Change Biology 14(10)2317ndash2332 DOI 101111j1365-2486200801654x
Oechel WC Vourlitis GL Hastings SJ Zulueta RC Hinzman L Kane D2000 Acclimation of ecosystem CO2 exchange in the Alaskan Arctic inresponse to decadal climate warming Nature 406(6799) 978ndash981
Pilcher JR Mac an tSaoir S 1995 Wood Trees Forests in Ireland RoyalIrish Academy Dublin
Prevost M Belleau P Plamondon AP 1997 Substrate conditions in atreed peatland responses to drainage Ecoscience 4(4) 543ndash554
Price JS Branfireun BA Waddington JM Devito KJ 2005 Advancesin Canadian wetland hydrology 1999ndash2003 Hydrological Processes19(1) 201ndash214 DOI 101002Hyp5774
Ramchunder SJ Brown LE Holden J 2007 Environmental effects ofdrainage drain-blocking and prescribed vegetation burning in UKupland peatlands Progress in Physical Geography 2009(33) 49 DOI1011770309133309105245
Copyright copy 2012 John Wiley amp Sons Ltd
Reggiani P Sivapalan M Hassanizadeh SM 2000 Conservationequations governing hillslope responses exploring the physical basisof water balance Water Resources Research 36(7) 1845ndash1863
Rigon R Bertoldi G Over TM 2006 GEOtop a distributed hydrologicalmodel with coupled water and energy budgets Journal of Hydro-meteorology 7(3) 371ndash388
Robinson M 1986 Changes in catchment runoff following drainage andafforestation Journal of Hydrology 86(1ndash2) 71ndash84
Simoni S Zanotti F Bertoldi G Rigon R 2008 Modelling the probabilityof occurrence of shallow landslides and channelized debris flows usingGEOtop-FS Hydrological Processes 22(4) 532ndash545 DOI 101002Hyp6886
Sottocornola M Kiely G 2010 Energy fluxes and evaporationmechanisms in an Atlantic blanket bog in southwestern Ireland WaterResources Research 46 DOI 1010292010WR009078
Sottocornola M Laine A Kiely G Byrne KA Tuittila ES 2009Vegetation and environmental variation in an Atlantic blanket bog insouthwestern Ireland Plant Ecology 203(1) 69ndash81 DOI 101007s11258-008-9510-2
Strack M Waddington JM Rochefort L Tuittila ES 2006 Response ofvegetation and net ecosystem carbon dioxide exchange at different peatlandmicroforms following water table drawdown Journal of GeophysicalResearch-Biogeosciences 111(G2) DOI 1010292005jg000145
Tobin B Black K Osborne B Reidy B Bolger T Nieuwenhuis M 2006Assessment of allometric algorithms for estimating leaf biomass leafarea index and litter fall in different-aged Sitka spruce forests Forestry79(4) 453ndash465 DOI 101093forestrycpl030
Verry ES Timmons DR 1982 Waterborne nutrient flow through anupland-peatland watershed in Minnesota Ecology 65(5) 1456ndash1467
Waldron S Flowers H Arlaud C Bryant C McFarlane S 2009 Thesignificance of organic carbon and nutrient export from peatland-dominated landscapes subject to disturbance a stoichiometric perspectiveBiogeosciences 6(3) 363ndash374
Zanotti F Endrizzi S Bertoldi G Rigon R 2004 The GEOTOP snowmodule Hydrological Processes 18(18) 3667ndash3679 DOI 101002Hyp5794
Hydrol Process (2012)DOI 101002hyp
C LEWIS ET AL
Lees JC 1972 Soil aeration and Sitka Spruce seedling growth in peatJournal of Ecology 60(2) 343ndash349
Letts MG Roulet N Comer NT 2000 Parameterization of peatlandhydraulic properties for the Canadian land surface scheme CanadianMeterological and Oceanographic Society 38 141ndash160
Lewis C Albertson J Xu X Kiely G 2011 Spatial variability of hydraulicconductivity and bulk density along a blanket peatland hillslopeHydrological Processes 26 1527ndash1537 DOI 101002hyp8252
Limpens J Berendse F Blodau C Canadell JG Freeman C Holden JRoulet N Rydin H Schaepman-Strub G 2008 Peatlands and thecarbon cycle from local processes to global implicationsmdasha synthesisBiogeosciences 5(5) 1475ndash1491
Nash JE Sutcliffe JV 1970 River flow forecasting through conceptualmodels part Imdasha discussion of principles Journal of Hydrology 10(3)282ndash290
NFI 2007 National Forest InventorymdashRepublic of IrelandmdashResultsJohnstown Castle Estate Co Wexford Ireland
Nilsson M Sagerfors J Buffam I Laudon H Eriksson T Grelle AKlemedtsson L Weslien P Lindroth A 2008 Contemporary carbonaccumulation in a boreal oligotrophic minerogenic miremdasha significantsink after accounting for all C-fluxes Global Change Biology 14(10)2317ndash2332 DOI 101111j1365-2486200801654x
Oechel WC Vourlitis GL Hastings SJ Zulueta RC Hinzman L Kane D2000 Acclimation of ecosystem CO2 exchange in the Alaskan Arctic inresponse to decadal climate warming Nature 406(6799) 978ndash981
Pilcher JR Mac an tSaoir S 1995 Wood Trees Forests in Ireland RoyalIrish Academy Dublin
Prevost M Belleau P Plamondon AP 1997 Substrate conditions in atreed peatland responses to drainage Ecoscience 4(4) 543ndash554
Price JS Branfireun BA Waddington JM Devito KJ 2005 Advancesin Canadian wetland hydrology 1999ndash2003 Hydrological Processes19(1) 201ndash214 DOI 101002Hyp5774
Ramchunder SJ Brown LE Holden J 2007 Environmental effects ofdrainage drain-blocking and prescribed vegetation burning in UKupland peatlands Progress in Physical Geography 2009(33) 49 DOI1011770309133309105245
Copyright copy 2012 John Wiley amp Sons Ltd
Reggiani P Sivapalan M Hassanizadeh SM 2000 Conservationequations governing hillslope responses exploring the physical basisof water balance Water Resources Research 36(7) 1845ndash1863
Rigon R Bertoldi G Over TM 2006 GEOtop a distributed hydrologicalmodel with coupled water and energy budgets Journal of Hydro-meteorology 7(3) 371ndash388
Robinson M 1986 Changes in catchment runoff following drainage andafforestation Journal of Hydrology 86(1ndash2) 71ndash84
Simoni S Zanotti F Bertoldi G Rigon R 2008 Modelling the probabilityof occurrence of shallow landslides and channelized debris flows usingGEOtop-FS Hydrological Processes 22(4) 532ndash545 DOI 101002Hyp6886
Sottocornola M Kiely G 2010 Energy fluxes and evaporationmechanisms in an Atlantic blanket bog in southwestern Ireland WaterResources Research 46 DOI 1010292010WR009078
Sottocornola M Laine A Kiely G Byrne KA Tuittila ES 2009Vegetation and environmental variation in an Atlantic blanket bog insouthwestern Ireland Plant Ecology 203(1) 69ndash81 DOI 101007s11258-008-9510-2
Strack M Waddington JM Rochefort L Tuittila ES 2006 Response ofvegetation and net ecosystem carbon dioxide exchange at different peatlandmicroforms following water table drawdown Journal of GeophysicalResearch-Biogeosciences 111(G2) DOI 1010292005jg000145
Tobin B Black K Osborne B Reidy B Bolger T Nieuwenhuis M 2006Assessment of allometric algorithms for estimating leaf biomass leafarea index and litter fall in different-aged Sitka spruce forests Forestry79(4) 453ndash465 DOI 101093forestrycpl030
Verry ES Timmons DR 1982 Waterborne nutrient flow through anupland-peatland watershed in Minnesota Ecology 65(5) 1456ndash1467
Waldron S Flowers H Arlaud C Bryant C McFarlane S 2009 Thesignificance of organic carbon and nutrient export from peatland-dominated landscapes subject to disturbance a stoichiometric perspectiveBiogeosciences 6(3) 363ndash374
Zanotti F Endrizzi S Bertoldi G Rigon R 2004 The GEOTOP snowmodule Hydrological Processes 18(18) 3667ndash3679 DOI 101002Hyp5794