+ All Categories
Home > Documents > HOW DOES FISCAL POLICY AFFECT GDP AND INFLATION IN …

HOW DOES FISCAL POLICY AFFECT GDP AND INFLATION IN …

Date post: 04-Dec-2021
Category:
Upload: others
View: 3 times
Download: 0 times
Share this document with a friend
19
25 Visnyk of the National Bank of Ukraine, No. 244, 2018, pp. 25–43 HOW DOES FISCAL POLICY AFFECT GDP AND INFLATION IN UKRAINE? ARTEM VDOVYCHENKO a * a National Bank of Ukraine Email: [email protected] Abstract In this study, we apply the Blanchard-Perotti approach to estimating the impact of fiscal policy on GDP and inflation in Ukraine. By disaggregating fiscal data, we were able to determine which items of the budget have the most influence on real GDP and inflation. Our results show that fiscal multipliers in Ukraine in absolute values are higher for budget expenditures than for taxes. In addition, both budget expenditures and taxes have a positive impact on inflation. JEL Codes E62, H3, H61, C22 Keywords fiscal multiplier, fiscal policy, fiscal shocks, VAR 1. INTRODUCTION The assessment of fiscal policy effects becomes an ur- gent problem, particularly in periods of economic crises, when monetary instruments have exhausted their poten- tial to influence an economy (Bonam et al., 2017). The con- ventional indicator of the strength and persistence of fiscal policy effects on economic dynamics is the fiscal multiplier, which reflects the transitive effect of discretionary fiscal poli- cy on the level of output of the economy (Batini, Eyraud, and Weber, 2014). The threats of the growth of public debt and the loss of fiscal sustainability restrict the use of fiscal stimuli, so the choice between increasing the budget deficit and the rate of economic growth is often conditioned by the values of fiscal multipliers. A proper assessment of the values of fiscal multipliers is thus necessary in order to take valid fiscal decisions that will contribute to the achievement of economic goals and that will not cause significant growth in public debt. The results of such assessments can also be used when carrying out a tax (fiscal) reform that involves making decisions about changes in particular taxes and budget expenditures. Understanding of the quantitative impact of fiscal decisions on the economy also provides an opportunity to improve the quality of mac- roeconomic forecasts, including predictions for inflation. Giv- en that inflation is one of the primary areas of interest for a central bank, estimating fiscal multipliers is of practical value when the National Bank of Ukraine (NBU) is taking monetary policy decisions. In this study, based on Ukrainian data, we estimate sev- eral fiscal multipliers for the most important categories of budget expenditures and revenues, applying the standard SVAR methodology. We also extend the standard model for estimating fiscal multipliers (Blanchard and Perotti, 2002) by including in our analysis inflation, and assess the response of prices to fiscal policy shocks. This work differs from simi- lar studies on emerging market economies (Rukelj, 2009; Ilzetzki et al., 2011) in that the impact of fiscal policy on real GDP and inflation is estimated for a wide range of categories of budget revenues and expenditures. Little attention is paid in the scientific literature to estimating fiscal multipliers for emerging markets, and this article is a contribution to such research in the literature. The paper is organized as follows. The second section provides an analysis of views on the values of fiscal multipli- ers, and a review of empirical results on the estimation of the multipliers. In the third section, we describe the method used to analyse the impact of budget items on GDP and in- flation. The data are described in the fourth section. In the fifth section, we present empirical results. The sixth section presents conclusions and a discussion of the results. 2. LITERATURE REVIEW The fundamental issue is the ability of fiscal policy to stimulate economic growth, and this discussion boils down to the estimation of fiscal multipliers. According to Fatás and Mihov (2009), adherents of the idea of fiscal stimulation have a set of arguments that can be briefly grouped in the following way: empirical studies indicate that, on average, fiscal multi- pliers have a value higher than one. That means that stimu- lating economic growth via increasing budget expenditures or decreasing taxes is effective only if one additional dollar of fiscal stimuli causes the growth of real GDP of more than one dollar; periods of recession free up factors of production, and under such conditions fiscal multipliers can have heightened values; * The views expressed in this paper are those of the author and do not necessarily represent the position of the National Bank of Ukraine. © National Bank of Ukraine, 2018. All rights reserved https://doi.org/10.26531/vnbu2018.244.02
Transcript

25

Visnyk of the National Bank of Ukraine, No. 244, 2018, pp. 25–43

HOW DOES FISCAL POLICY AFFECT GDP AND INFLATION IN UKRAINE? ARTEM VDOVYCHENKOa *

a National Bank of Ukraine Email: [email protected]

Abstract In this study, we apply the Blanchard-Perotti approach to estimating the impact of fiscal policy on GDP and inflation in Ukraine. By disaggregating fiscal data, we were able to determine which items of the budget have the most influence on real GDP and inflation. Our results show that fiscal multipliers in Ukraine in absolute values are higher for budget expenditures than for taxes. In addition, both budget expenditures and taxes have a positive impact on inflation.

JEL Codes E62, H3, H61, C22

Keywords fiscal multiplier, fiscal policy, fiscal shocks, VAR

1. INTRODUCTIONThe assessment of fiscal policy effects becomes an ur-

gent problem, particularly in periods of economic crises, when monetary instruments have exhausted their poten-tial to influence an economy (Bonam et al., 2017). The con-ventional indicator of the strength and persistence of fiscal policy effects on economic dynamics is the fiscal multiplier, which reflects the transitive effect of discretionary fiscal poli-cy on the level of output of the economy (Batini, Eyraud, and Weber, 2014). The threats of the growth of public debt and the loss of fiscal sustainability restrict the use of fiscal stimuli, so the choice between increasing the budget deficit and the rate of economic growth is often conditioned by the values of fiscal multipliers.

A proper assessment of the values of fiscal multipliers is thus necessary in order to take valid fiscal decisions that will contribute to the achievement of economic goals and that will not cause significant growth in public debt. The results of such assessments can also be used when carrying out a tax (fiscal) reform that involves making decisions about changes in particular taxes and budget expenditures. Understanding of the quantitative impact of fiscal decisions on the economy also provides an opportunity to improve the quality of mac-roeconomic forecasts, including predictions for inflation. Giv-en that inflation is one of the primary areas of interest for a central bank, estimating fiscal multipliers is of practical value when the National Bank of Ukraine (NBU) is taking monetary policy decisions.

In this study, based on Ukrainian data, we estimate sev-eral fiscal multipliers for the most important categories of budget expenditures and revenues, applying the standard SVAR methodology. We also extend the standard model for estimating fiscal multipliers (Blanchard and Perotti, 2002) by including in our analysis inflation, and assess the response

of prices to fiscal policy shocks. This work differs from simi-lar studies on emerging market economies (Rukelj, 2009; Ilzetzki et al., 2011) in that the impact of fiscal policy on real GDP and inflation is estimated for a wide range of categories of budget revenues and expenditures. Little attention is paid in the scientific literature to estimating fiscal multipliers for emerging markets, and this article is a contribution to such research in the literature.

The paper is organized as follows. The second section provides an analysis of views on the values of fiscal multipli-ers, and a review of empirical results on the estimation of the multipliers. In the third section, we describe the method used to analyse the impact of budget items on GDP and in-flation. The data are described in the fourth section. In the fifth section, we present empirical results. The sixth section presents conclusions and a discussion of the results.

2. LITERATURE REVIEWThe fundamental issue is the ability of fiscal policy to

stimulate economic growth, and this discussion boils down to the estimation of fiscal multipliers. According to Fatás and Mihov (2009), adherents of the idea of fiscal stimulation have a set of arguments that can be briefly grouped in the following way:

• empirical studies indicate that, on average, fiscal multi-pliers have a value higher than one. That means that stimu-lating economic growth via increasing budget expenditures or decreasing taxes is effective only if one additional dollar of fiscal stimuli causes the growth of real GDP of more than one dollar;

• periods of recession free up factors of production, and under such conditions fiscal multipliers can have heightened values;

* The views expressed in this paper are those of the author and do not necessarily represent the position of the National Bank of Ukraine.

© National Bank of Ukraine, 2018. All rights reservedhttps://doi.org/10.26531/vnbu2018.244.02

26

A. Vdovychenko / Visnyk of the National Bank of Ukraine, No. 244, 2018, pp. 25–43

• with respect to the standard Keynesian model, the fiscal multiplier is an increasing function for the marginal propen-sity to consume (MPC), and thus in low-income economies it is higher in comparison to advanced economies, because MPC is relatively high;

• under conditions in which monetary policy is restricted by the zero lower boundary on the key interest rate, fiscal policy can be used to conduct a counter-cyclical economic policy.

An opposing view on the problem of the effectiveness of fiscal stimulation is based on the following arguments (Has-set, 2009):

• there are neoclassical effects in an economy, in the form of Ricardian equivalence, which means that fiscal stim-uli in the current period are taken by economic agents as a signal that there will be an increase in the fiscal pressure on the economy in future, and, resultantly, consumption and in-vestments do not increase due to this negative expectation;

• fiscal stimuli cause crowding-out effects – an increase in interest rates and/or an appreciating exchange rate decel-erates the growth rates of an economy;

• a line of research initiated by Giavazzi and Pagano (1990) indicates that there is a positive economic effect from fiscal consolidation;

• the short-run effects of fiscal stimulation are debatable, while there is consensus that they have a negative impact on output in the long-run (Alesina et al., 2002; Barro, 1991);

• fiscal policy is only part of the mechanism for bringing an economy out recession: economic recovery is unlikely to start without a restructuring of the financial sector and changes in monetary policy;

• fiscal incentive programs are hard to remove over the long run because of political considerations. Thus, with time, fiscal stimuli jeopardize fiscal sustainability and act to am-plify economic dynamics;

• fiscal policy can be considered ineffective for stimulat-ing economic growth if a fiscal multiplier is less than 1 (1 addi-tional monetary unit of fiscal incentives causes GDP growth of less than 1 monetary unit). However, fiscal multiplier esti-mates in empirical studies produce such values very often;

• fiscal stimuli are introduced with a significant lag, and as a result cannot react properly to economic parameters;

• markets know better how to restore economic growth;

• fiscal stimulation programs often serve the narrow po-litical and economic interests of certain persons, and are not oriented to macroeconomic requirements.

The values of fiscal multipliers are usually determined by the structural characteristics of an economy, which include the following:

• trade openness. For economies that are less opened to imports, multipliers are higher, because demand is oriented to domestic output;

• labor market rigidity. Economies with more rigid labor markets have higher fiscal multipliers, as increases in de-mand are not neutralized by wage growth;

• the power of automatic stabilizers. Powerful automatic stabilizers decrease the values of fiscal multipliers because their reaction to exogenous fiscal stimuli leads to the partial neutralization of the effects of an initial fiscal shock on GDP;

• exchange rate regime. States with flexible exchange rates usually have lower fiscal multiplier values, as the reac-tion of the exchange rate partially diminishes the impact of fiscal shocks;

• the level of public debt. States with a high debt ratio have lower fiscal multiplier values, as in such an environment Ricardian effects are more pronounced. When there is a high public debt, fiscal consolidation (not stimulation) is more like-ly to have a positive impact on the economy, through rebuild-ing government credibility and reducing the risk premium;

• the efficiency of the management of budget expendi-ture and the administration of taxes. Fiscal multiplier values are lower when complicated tax administration procedures and inefficient budget spending restrict the impact of fiscal policy on an economy;

• the phase of the business cycle. In periods of reces-sion, fiscal multipliers are higher than in growth periods. Fis-cal stimuli are less effective when there is a positive GDP gap, because the factors of production are at full capacity. This leads to the crowding-out of private demand by the public sector, leaving the level of output unchanged and stimulating inflation. At the same time, fiscal consolidation during downturns causes higher losses for the economy than in other periods, because economic agents under fund-ing constraints are unable to smooth their consumption.

• the reaction of monetary policy to fiscal shocks. Loose monetary policy can mitigate the effect of fiscal consolida-tion, and vice versa. Fiscal multipliers can also be high at times when monetary instruments cannot be applied – for example in the case of a zero lower bound of interest rates.

An overview of the values of fiscal multipliers in econo-mies of different types is given in Batini, Eyraud, and Weber (2014). For advanced economies in “normal times,” the val-ues of multipliers range from 0 to 1 in the first year after a fis-cal shock. In periods of recession, multipliers have increased values. The literature suggests that multipliers of budget ex-penditure are on average higher than tax multipliers.

There is a lack of studies of fiscal multipliers in emerging market economies (EMEs) and low-income countries (LICs). It is also difficult to determine with precision in which direction the fiscal multipliers in such countries will deviate, compared to in advanced economies. The values of fiscal multipliers are increased by a set of factors: higher propensity to con-sume due to an underdeveloped financial market and un-certainty about the future; the response of monetary policy is less effective; the effect of automatic fiscal stabilizers is weak; and there is a low public debt ratio. On the other hand, some of the following factors reduce the potential value of fiscal multipliers in EMEs and LICs: savings (unorganized) can be higher in an environment with high uncertainty; the inefficient management of budget expenditures and admin-istration of taxes; and the fact that such economies are usu-ally small and open.

27

A. Vdovychenko / Visnyk of the National Bank of Ukraine, No. 244, 2018, pp. 25–43

An analysis of the empirical literature indicates that there can be an impact of fiscal policy on GDP and inflation through both the demand and the supply sides of an economy. In Pe-rotti (2002), the author, expanding the technique proposed in Blanchard and Perotti (2002), investigates the effect of fiscal policy not only on GDP but also on inflation and real short-term interest rates. According to the results, the au-thor concludes that after the 1980s fiscal multipliers in OECD member states significantly decreased. A positive impact of government spending on inflation was detected, although it was not always statistically significant. Taxes have a weak impact on price levels, which is usually negative.

Parkyn and Vehbi (2014) use a technique similar to Perot-ti (2002) with New Zealand data, but include the dynamics of public debt as a separate equation in their model. Their anal-ysis of the effects of fiscal policy indicates a comparatively low but statistically significant fiscal multiplier for budget ex-penditures, and a low and statistically insignificant multiplier for taxes. At the same time, no significant influence of fiscal policy on price levels was found.

Unal (2015) used an SVAR model to study the effects of various categories of taxes on prices, interest rates and various components of GDP for the United States, Canada, France and the United Kingdom. According to the results, social contribution shocks had a mixed effect on GDP and inflation in different countries, indicating the dominance of a particular macroeconomic effect in a particular country. The shock of indirect taxes in the study leads to a decrease in GDP and inflation, reflecting a decline in demand from households. The shock of the personal income tax (PIT) in the majority of cases leads to a drop in GDP, while the ef-fect on inflation is rather mixed. A corporate income tax (CIT) shock in all countries, apart from in the United Kingdom, leads to a positive response for GDP and inflation. The posi-tive impact on GDP mainly comes through investments. The authors put this reaction down to the predominance of the wealth effect on the supply side. However, such an impact on GDP can also be explained by the fact that investments are usually subtracted from the taxable profits of enterpris-es, meaning that an increase in investment is a method of optimizing tax payments in response to an increase in tax rates. Similar effects of CIT were found in Arin and Koray (2006) and Guntram et al. (2006).

A study by Nguyen et al. (2016) investigates the macro-economic effects of income and consumption taxes in the UK. For their analysis, the authors apply a relatively new proxy-SVAR methodology (Mertens and Ravn, 2013). The au-thors include tax payments that are accrued on individual and corporate income (PIT, CIT, and social contributions) in the group of income taxes. Taxes on consumption include VAT, various duties, and excise taxes. According to the re-sults, an increase in income taxes has a significant negative effect on GDP, while an increase in consumption taxes has a neutral effect. The impact on the price level is positive for both taxes, but is more pronounced for taxes on consump-tion. The authors state that raising price levels in response to a shock in income taxes is evidence of supply-side effects, since taxes are taken into account when the cost of produc-tion is set. At the same time, the positive effect of consump-tion taxes on prices is an accounting phenomenon, since such taxes are directly included in the price structure.

1 Taxes on capital and labor.

In Arin et. al. (2016) the authors use a standard SVAR ap-proach to assess multipliers for various taxes in the United States. The results demonstrate that the shocks of distorting taxes (CIT, PIT, social contributions) have long-term nega-tive effects on GDP, and a moderate, positive influence on inflation (mainly through PIT). Shocks in consumption taxes, instead, have a weaker, short-term negative effect on GDP, and a more pronounced positive effect on inflation.

Mertens and Ravn (2013) estimate the impact of indi-vidual income taxes (PIT and social contributions) and CIT on a number of macroeconomic variables. They develop a method of estimation (proxy SVAR), which combines the best properties of the Blanchard-Perotti approach and the narrative approach proposed by Romer and Romer (2010). The results indicate that taxes on individual income are more effective in stimulating employment and private consump-tion than CIT. With regard to GDP, the multiplier of taxes on individual income is also much higher. A shock in CIT has a significant positive effect on price levels, testifying, accord-ing to the authors' conclusions, to the dominance of supply-side effects. The impact of individual income taxes on prices is also positive, although not statistically significant.

Researchers from the European Central Bank assessed the impact of fiscal shocks on the Spanish economy in de Castro and de Cos (2006). They applied a standard SVAR approach not only to different categories of taxes, but large-ly disaggregated budget expenditures as well. According to their results, the impact of aggregate budget expenditures on GDP is positive and fairly persistent. At the same time, the shock of budget expenditures leads to a significant in-crease in price levels. The impact of tax shocks on GDP is negative in the long run, but the magnitude of the tax mul-tiplier is lower than for budget expenditures. In the study, budget expenditures were disaggregated into consumption, public sector wages, and public investments. According to the study, the effect of the first two categories of expendi-tures on GDP is positive in the short-run, and negative in the medium-term. The authors conclude that this result was due to the crowding-out effect, and upward pressure of public sector wages on wages in the private sector. The impact of public investments on GDP is positive and more persistent. Shocks to all budget expenditure categories stimulated in-flation in the medium-term. Taxes were separated into direct taxes, indirect taxes, and social security contributions. The results indicate that shocks in indirect taxes do not have any pronounced effect on GDP. Shocks in direct taxes and social security contributions have a negative impact on GDP in the mid-term. The impact on prices varies considerably depend-ing on the tax – indirect taxes have a positive effect on infla-tion, direct taxes are neutral, and social security contribu-tions depress inflation due to their negative impact on GDP.

The general conclusion from the literature is that shocks to budget expenditure stimulate GDP growth through both the supply and demand sides. Expenditures also stimulate the growth of prices, which is consistent with increasing de-mand in an economy. Shocks in distortive taxes1 have a sig-nificant negative impact on GDP: this testifies to the predomi-nance of demand-side effects. The exception is basically the corporate income tax, which often demonstrates a positive impact on GDP, indicating the wealth effect on the economy. The impact of taxes on prices is quite mixed. Shocks in con-sumption taxes usually lead to an increase in prices, which

28

A. Vdovychenko / Visnyk of the National Bank of Ukraine, No. 244, 2018, pp. 25–43

is the supply-side effect. In some studies, shocks of taxes on income also cause price hikes, indicating the importance of the supply side in the price determination process.

The final study, and, to our knowledge, the only research done on fiscal multipliers for Ukraine, is a study by Mitra and Poghosyan (2015), in which the authors use an SVAR model and identification scheme similar to that of Blanchard and Perotti (2002). The estimates were made using quarterly data for the period 2001-2013, which does not include the crisis of 2014-2016 for Ukraine. According to the results, in the first quarter after a shock, the fiscal multiplier of budget expenditures is 0.4, and (-0.3) for taxes. Tax and expenditure multipliers, which are low and have similar values on impact, are quite different in terms of dynamics. The tax multiplier loses its statistical significance after the first quarter, while the expenditure multiplier is more persistent, and loses its statistical significance only after six quarters, reaching a cu-mulative value of 2.86 over eight quarters (for the tax multi-plier this indicator is insignificant, and equals (-0.96)). Given that the 2014-2016 period was one of crisis for the Ukrainian economy, the values of fiscal multipliers, if estimated using an updated dataset, could be very different. As shown in Auerbach and Gorodnichenko (2012), fiscal multipliers are significantly higher in periods of recession.

While SVAR models are the most popular toolkit for esti-mating the impact of fiscal policy on real GDP and inflation, the results of these estimations vary widely and can be used in support of completely different economic theories. The variability of the estimates suggests that there are numerous factors in an economy that can both exacerbate and weaken the impact of fiscal policy on the economy. There is some consensus in economic theory that the values of fiscal mul-tipliers are nonlinear, the multipliers of budget expenditures are higher than tax multipliers, and developed economies are more sensitive to fiscal policy shocks than emerging markets. However, little is known about the impact of certain categories of budget expenditures and taxes on real GDP and inflation. Using the example of Ukraine, we are conduct-ing research aimed at filling this gap in knowledge.

3. METHODOLOGYWe have divided the description of our methodology into

two parts. First, we discuss the estimation of fiscal policy ef-fects on GDP within the framework of an SVAR model with three endogenous variables. After that, we construct a sec-ond model, into which we add inflation as a fourth endoge-nous variable, impose additional identifying restrictions, and assess the impact of fiscal policy on price dynamics. The two models differ in terms of how the variables are converted into real terms. In the first model, budget expenditures, taxes and GDP are converted into 2010 prices via a GDP deflator. In the second case, the fiscal indicators were converted into 2010 prices through the application of the consumer price index. This use of different data transformations greatly sim-plifies the identification of the system of structural equations for the second model, and makes these restrictions more intuitive.

2 In other words, the variance-covariance matrix is the identity matrix.3 To precisely identify the system of equations, we need a number of constraints equal to K² + K(K - 1) × 0.5, where K is the number of endogenous variables. That is, to identify the system (2) it is necessary to impose 12 restrictions..4 The essence of approach is to run a regression: 𝑇𝑇𝑡𝑡𝑟𝑟 = 𝛽𝛽1𝑟𝑟𝑋𝑋𝑡𝑡𝑟𝑟 + ∑ 𝛾𝛾𝑛𝑛𝑟𝑟𝑁𝑁

𝑛𝑛=1 𝐷𝐷𝑛𝑛,𝑡𝑡𝑟𝑟 + ∑ 𝛾𝛾𝑖𝑖𝑟𝑟𝐼𝐼𝑖𝑖=1 𝑆𝑆𝑖𝑖,𝑡𝑡𝑟𝑟 + ∑ ∑ 𝛼𝛼𝑛𝑛,𝑗𝑗∆𝑋𝑋𝑛𝑛,𝑡𝑡−𝑗𝑗𝑟𝑟𝑞𝑞

𝑗𝑗=−𝑝𝑝𝑁𝑁𝑛𝑛=1 + 𝜀𝜀𝑡𝑡𝑟𝑟, where 𝑇𝑇𝑡𝑡𝑟𝑟 = 𝛽𝛽1𝑟𝑟𝑋𝑋𝑡𝑡𝑟𝑟 + ∑ 𝛾𝛾𝑛𝑛𝑟𝑟𝑁𝑁

𝑛𝑛=1 𝐷𝐷𝑛𝑛,𝑡𝑡𝑟𝑟 + ∑ 𝛾𝛾𝑖𝑖𝑟𝑟𝐼𝐼𝑖𝑖=1 𝑆𝑆𝑖𝑖,𝑡𝑡𝑟𝑟 + ∑ ∑ 𝛼𝛼𝑛𝑛,𝑗𝑗∆𝑋𝑋𝑛𝑛,𝑡𝑡−𝑗𝑗𝑟𝑟𝑞𝑞

𝑗𝑗=−𝑝𝑝𝑁𝑁𝑛𝑛=1 + 𝜀𝜀𝑡𝑡𝑟𝑟, – tax receipts r, 𝑇𝑇𝑡𝑡𝑟𝑟 = 𝛽𝛽1𝑟𝑟𝑋𝑋𝑡𝑡𝑟𝑟 + ∑ 𝛾𝛾𝑛𝑛𝑟𝑟𝑁𝑁

𝑛𝑛=1 𝐷𝐷𝑛𝑛,𝑡𝑡𝑟𝑟 + ∑ 𝛾𝛾𝑖𝑖𝑟𝑟𝐼𝐼𝑖𝑖=1 𝑆𝑆𝑖𝑖,𝑡𝑡𝑟𝑟 + ∑ ∑ 𝛼𝛼𝑛𝑛,𝑗𝑗∆𝑋𝑋𝑛𝑛,𝑡𝑡−𝑗𝑗𝑟𝑟𝑞𝑞

𝑗𝑗=−𝑝𝑝𝑁𝑁𝑛𝑛=1 + 𝜀𝜀𝑡𝑡𝑟𝑟, – tax

base of r, 𝑇𝑇𝑡𝑡𝑟𝑟 = 𝛽𝛽1𝑟𝑟𝑋𝑋𝑡𝑡𝑟𝑟 + ∑ 𝛾𝛾𝑛𝑛𝑟𝑟𝑁𝑁𝑛𝑛=1 𝐷𝐷𝑛𝑛,𝑡𝑡𝑟𝑟 + ∑ 𝛾𝛾𝑖𝑖𝑟𝑟𝐼𝐼

𝑖𝑖=1 𝑆𝑆𝑖𝑖,𝑡𝑡𝑟𝑟 + ∑ ∑ 𝛼𝛼𝑛𝑛,𝑗𝑗∆𝑋𝑋𝑛𝑛,𝑡𝑡−𝑗𝑗𝑟𝑟𝑞𝑞𝑗𝑗=−𝑝𝑝

𝑁𝑁𝑛𝑛=1 + 𝜀𝜀𝑡𝑡𝑟𝑟, – potential deterministics n (constants, linear or quadratic trends), 𝑇𝑇𝑡𝑡𝑟𝑟 = 𝛽𝛽1𝑟𝑟𝑋𝑋𝑡𝑡𝑟𝑟 + ∑ 𝛾𝛾𝑛𝑛𝑟𝑟𝑁𝑁

𝑛𝑛=1 𝐷𝐷𝑛𝑛,𝑡𝑡𝑟𝑟 + ∑ 𝛾𝛾𝑖𝑖𝑟𝑟𝐼𝐼𝑖𝑖=1 𝑆𝑆𝑖𝑖,𝑡𝑡𝑟𝑟 + ∑ ∑ 𝛼𝛼𝑛𝑛,𝑗𝑗∆𝑋𝑋𝑛𝑛,𝑡𝑡−𝑗𝑗𝑟𝑟𝑞𝑞

𝑗𝑗=−𝑝𝑝𝑁𝑁𝑛𝑛=1 + 𝜀𝜀𝑡𝑡𝑟𝑟, – potential structural breaks in the data (impulses, level shifts, trend

changes),𝑇𝑇𝑡𝑡𝑟𝑟 = 𝛽𝛽1𝑟𝑟𝑋𝑋𝑡𝑡𝑟𝑟 + ∑ 𝛾𝛾𝑛𝑛𝑟𝑟𝑁𝑁𝑛𝑛=1 𝐷𝐷𝑛𝑛,𝑡𝑡𝑟𝑟 + ∑ 𝛾𝛾𝑖𝑖𝑟𝑟𝐼𝐼

𝑖𝑖=1 𝑆𝑆𝑖𝑖,𝑡𝑡𝑟𝑟 + ∑ ∑ 𝛼𝛼𝑛𝑛,𝑗𝑗∆𝑋𝑋𝑛𝑛,𝑡𝑡−𝑗𝑗𝑟𝑟𝑞𝑞𝑗𝑗=−𝑝𝑝

𝑁𝑁𝑛𝑛=1 + 𝜀𝜀𝑡𝑡𝑟𝑟, – stationary errors that denote deviations from long-run equilibrium.

3.1. Analysis of the impact of fiscal policy shocks on GDPTo estimate linear fiscal multipliers, we use SVAR mod-

els and identification schemes similar to those used by Blanchard and Perotti (2002). In accordance with this ap-proach, we construct the following VAR model:

Yt = ∑ CiYt−ik

i=1 + ∑ Dppj=1 Zt + Ut, (1)

where Yt≡[Gt,Tt,Xt]' is a three-dimensional vector of obser-vations for budget expenditures, taxes, and GDP, Zt – is a vector of exogenous variables that includes deterministic components (linear and quadratic trends, seasonal variables, dummy variables that denote structural breaks in time series, or excessive deviations) and variables that can be important determinants of endogenous variables, Ut≡[gt,tt,xt]' – a vec-tor of normally distributed residuals, which have non-zero correlation, Ci – coefficients of endogenous variables, and Dp – coefficients of exogenous variables. The residuals of model (1) are interpreted as a linear combination of the si-multaneous effects of the variables on each other, and the shocks. At the next stage, according to the Blanchar-Perotti approach, we estimated the parameters of system (2):

{gt = a1xt + a2ett + et

g

tt = b1xt + b2etg + ett

xt = c1tt + c2gt + etx,

(2)

where ett , e

gt , e

xt – are mutually uncorrelated structural shocks

with unit variance.2 The problem is that the coefficients a1, b1, c1 and c2 cannot be estimated without bias because of endo-geneity – there is a mutual instantaneous influence of GDP and taxes (expenditures). To resolve this issue, identifying re-strictions are needed.3 To impose these restrictions, we use the fact that because of institutional features, governments cannot react to GDP changes by changing budget expen-ditures within one quarter. That means the coefficient a1=0. The coefficient b1 indicates the automatic reaction of tax revenues to GDP changes, and is estimated exogenously. In Blanchard and Perotti (2002) this coefficient is estimated as cross-elasticity, calculated as a product of the tax base elas-ticity of taxes, and the GDP elasticity of tax bases. In some cases, the authors use coefficients calculated by Giorno et al. (1995). In our study, we derive the coefficient b1 from a cointegration equation of the corresponding tax revenues and GDP, which is estimated using DOLS (dynamic ordinary least squares)4, as proposed in Stock and Watson (1993).

Having information on a1 and b1 we can apply two-stage least squares (TSLS) to estimate the coefficients c1, c2, us-ing as instruments gt and t^t=tt-b1xt. Restrictions on a2, b2 are related to assumptions about the ordering of the decision-making process for fiscal policy. The restriction a2=0 means that at first, decisions are made on budget expenditures (gt), while the volume of taxes (tt) responds within a quarter, and the strength and direction of response is determined by the estimated coefficient b2. The reverse logic works when the restriction imposed is b2=0. Given the realities of the Ukrai-

29

A. Vdovychenko / Visnyk of the National Bank of Ukraine, No. 244, 2018, pp. 25–43

nian budget process, we would assume that decisions about budget expenditures are ordered first, and taxes are adjust-ed in response. Thus, for all models in our study, we impose restriction a2=0 and estimate b2.

5

As exogenous variables to control for the economic environment that affects the values of fiscal multipliers, we used the ratio of the current account to GDP, the real money supply (monetary aggregate M3, corrected with a deflator), and the debt-to-GDP ratio. The inclusion of these variables in the analysis is required because the trade openness of an economy, the level of public debt, and the state of monetary policy affect the size of fiscal multipliers. These variables are common exogenous components of empirical models for the estimation of fiscal multipliers (Ilzetzki et al., 2011, Mitra and Poghosyan, 2015).

The VAR models (1) were constructed in levels to take into account the very probable cointegration between en-dogenous variables. We also included linear and quadratic trends to control for the fit of cointegrating relationship.

The baseline model contains aggregate budget ex-penditures and taxes as endogenous variables describing fiscal policy. For the disaggregated analysis, we also built a series of models that include revenues from individual taxes instead of aggregated tax revenues (VAT, corporate income tax (CIT), personal income tax (PIT), import duties, so-cial contributions), as well as separate budget expenditure items instead of aggregate expenditures (wages, expendi-tures on goods and services, capital expenditures, current transfers to the population) and retirement expenses of the Pension Fund of Ukraine (PFU). The initial specification of all VARs contained four lags, which in our opinion is a rational choice, considering the limited number of observations and the annual nature of the payment of some taxes. Informa-tion criteria in most cases required a large number of lags, reducing the number of degrees of freedom of the models. At the same time, the Bayesian information criterion usu-ally suggested 1-2 lags in a VAR, but this was not enough to eliminate autocorrelation from errors. To mitigate the issue of limited degrees of freedom, we restricted the individual parameters of the VARs depending on their statistical signifi-cance. Appropriate restrictions were imposed through a se-quential elimination algorithm based on a top-down proce-dure, which employed the Akaike information criterion (AIC) for model selection. This allowed statistically insignificant coefficients to be excluded from the model, and to reduce the number of parameters for estimation.

Since the residuals of a VAR model should be normally distributed and not autocorrelated, we added dummy vari-ables to control for structural changes in the economy and to avoid outliers in errors. For example, such dummies were introduced for the 4th quarter of 2008 and 1st quarter of 2014, when Ukraine experienced significant political and eco-nomic upheaval. Dummies were also introduced for the 3rd quarter of 2010, when a significant reimbursement of VAT occurred through the emission of VAT bonds, artificially re-ducing the revenues from this tax.

5 Note that if the estimated coefficient b2 is statistically insignificant, then the order of imposing restrictions is not important and the change of assumptions regarding priority of decisions in fiscal policy does not impact the overall result.6 Restriction (-1.2) identifies the automatic reaction of taxes to GDP fluctuations within one period.

3.2. Analysis of the impact of fiscal shocks on inflation In a number of studies (Perotti, 2002; Parkyn and Vehbi,

2013), the transmission of fiscal policy shocks to inflation is investigated by adding the interest rate and consumer price index (CPI) to the endogenous variables of the baseline model (1). The inclusion of the interest rate in the model is intended to take into account the monetary policy stance and its response to shocks to other variables in the model. In the Ukrainian case, the inclusion of the interest rate in the model is not relevant, as there is no clear definition of the key interest rate of the National Bank of Ukraine (NBU) for the investigated period (2001-2016) and, during most of this period, monetary policy was not focused on inflation target-ing. Another argument against the inclusion of interest rate in our analysis is the scarcity of observations, which would bring into question the consistency of VAR estimates with five endogenous variables.

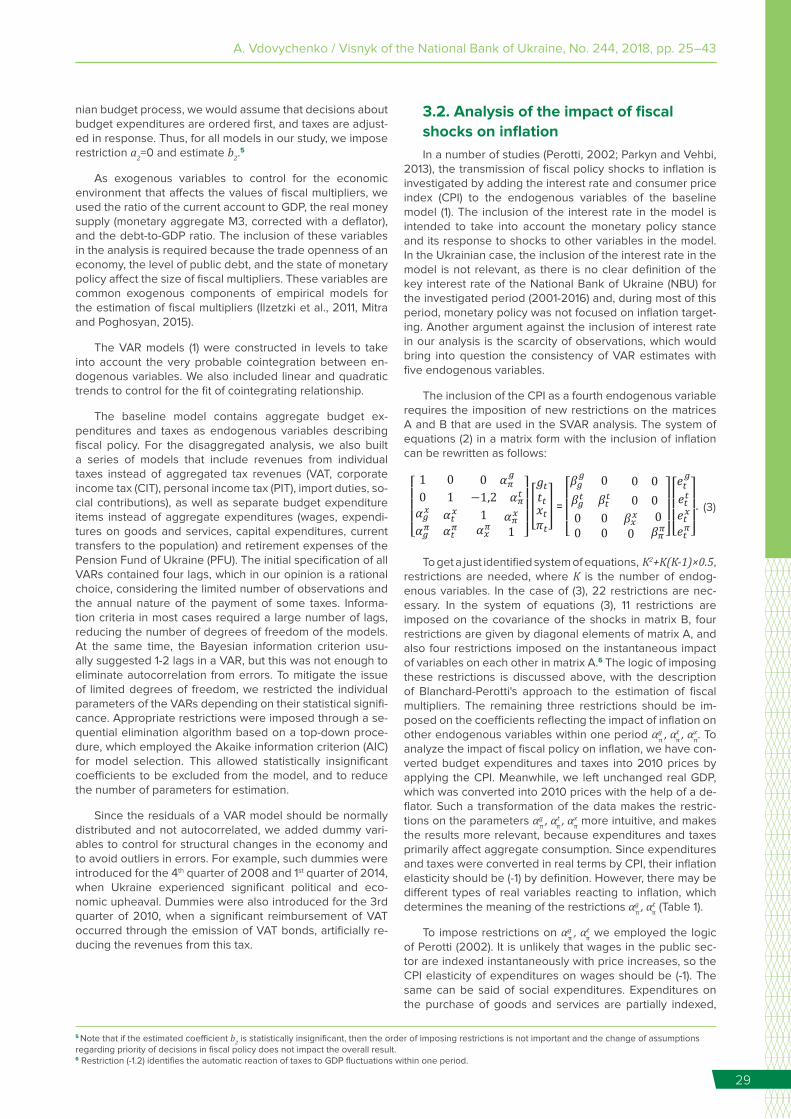
The inclusion of the CPI as a fourth endogenous variable requires the imposition of new restrictions on the matrices A and B that are used in the SVAR analysis. The system of equations (2) in a matrix form with the inclusion of inflation can be rewritten as follows:

[ 1 0 0 𝛼𝛼𝜋𝜋

𝑔𝑔

0 1 −1,2 𝛼𝛼𝜋𝜋𝑡𝑡

𝛼𝛼𝑔𝑔𝑥𝑥

𝛼𝛼𝑔𝑔𝜋𝜋

𝛼𝛼𝑡𝑡𝑥𝑥

𝛼𝛼𝑡𝑡𝜋𝜋

1𝛼𝛼𝑥𝑥

𝜋𝜋𝛼𝛼𝜋𝜋

𝑥𝑥

1 ] [𝑔𝑔𝑡𝑡𝑡𝑡𝑡𝑡𝑥𝑥𝑡𝑡𝜋𝜋𝑡𝑡

] =

[ 𝛽𝛽𝑔𝑔

𝑔𝑔 0 0 0𝛽𝛽𝑔𝑔

𝑡𝑡 𝛽𝛽𝑡𝑡𝑡𝑡 0 0

00

00

𝛽𝛽𝑥𝑥𝑥𝑥

00𝛽𝛽𝜋𝜋

𝜋𝜋]

[ 𝑒𝑒𝑡𝑡

𝑔𝑔

𝑒𝑒𝑡𝑡𝑡𝑡

𝑒𝑒𝑡𝑡𝑥𝑥

𝑒𝑒𝑡𝑡𝜋𝜋] .

(3)

To get a just identified system of equations, K2+K(K-1)×0.5, restrictions are needed, where K is the number of endog-enous variables. In the case of (3), 22 restrictions are nec-essary. In the system of equations (3), 11 restrictions are imposed on the covariance of the shocks in matrix B, four restrictions are given by diagonal elements of matrix A, and also four restrictions imposed on the instantaneous impact of variables on each other in matrix A.6 The logic of imposing these restrictions is discussed above, with the description of Blanchard-Perotti's approach to the estimation of fiscal multipliers. The remaining three restrictions should be im-posed on the coefficients reflecting the impact of inflation on other endogenous variables within one period αg

π , αtπ , α

xπ. To

analyze the impact of fiscal policy on inflation, we have con-verted budget expenditures and taxes into 2010 prices by applying the CPI. Meanwhile, we left unchanged real GDP, which was converted into 2010 prices with the help of a de-flator. Such a transformation of the data makes the restric-tions on the parameters αg

π , αtπ , α

xπ more intuitive, and makes

the results more relevant, because expenditures and taxes primarily affect aggregate consumption. Since expenditures and taxes were converted in real terms by CPI, their inflation elasticity should be (-1) by definition. However, there may be different types of real variables reacting to inflation, which determines the meaning of the restrictions αg
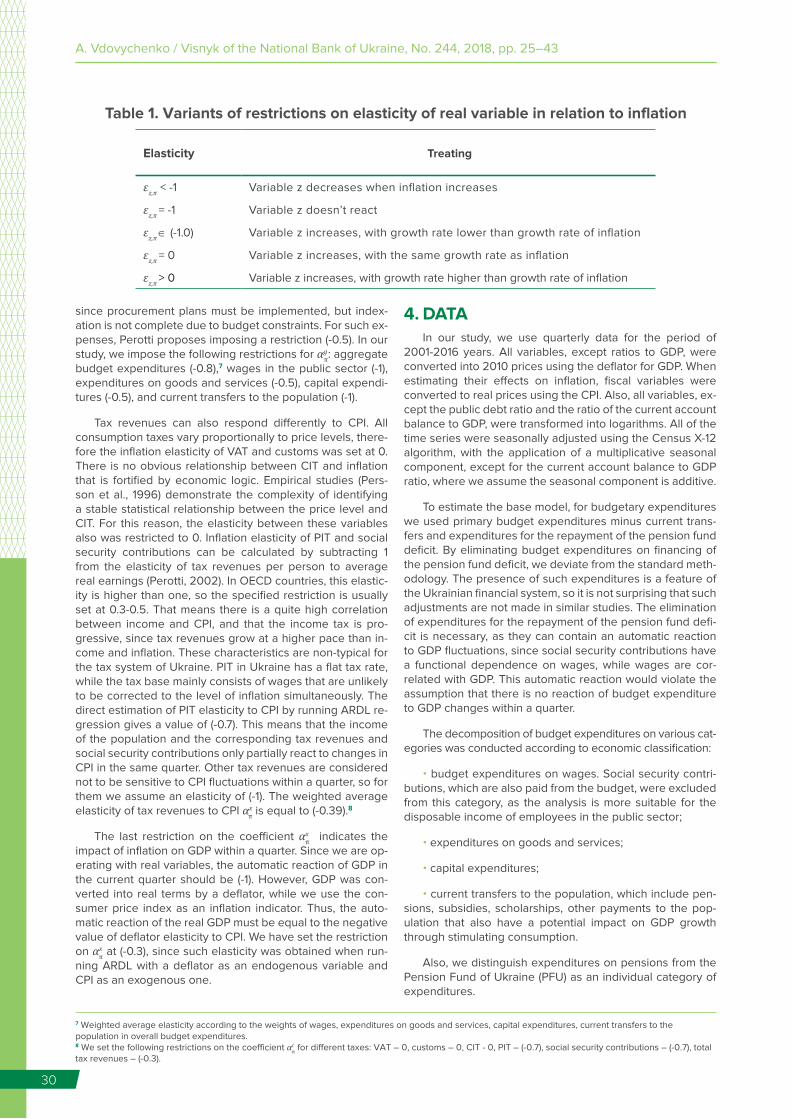
π , αtπ (Table 1).

To impose restrictions on αgπ , α

tπ we employed the logic

of Perotti (2002). It is unlikely that wages in the public sec-tor are indexed instantaneously with price increases, so the CPI elasticity of expenditures on wages should be (-1). The same can be said of social expenditures. Expenditures on the purchase of goods and services are partially indexed,

30

A. Vdovychenko / Visnyk of the National Bank of Ukraine, No. 244, 2018, pp. 25–43

since procurement plans must be implemented, but index-ation is not complete due to budget constraints. For such ex-penses, Perotti proposes imposing a restriction (-0.5). In our study, we impose the following restrictions for αg

π: aggregate budget expenditures (-0.8),7 wages in the public sector (-1), expenditures on goods and services (-0.5), capital expendi-tures (-0.5), and current transfers to the population (-1).

Tax revenues can also respond differently to CPI. All consumption taxes vary proportionally to price levels, there-fore the inflation elasticity of VAT and customs was set at 0. There is no obvious relationship between CIT and inflation that is fortified by economic logic. Empirical studies (Pers-son et al., 1996) demonstrate the complexity of identifying a stable statistical relationship between the price level and CIT. For this reason, the elasticity between these variables also was restricted to 0. Inflation elasticity of PIT and social security contributions can be calculated by subtracting 1 from the elasticity of tax revenues per person to average real earnings (Perotti, 2002). In OECD countries, this elastic-ity is higher than one, so the specified restriction is usually set at 0.3-0.5. That means there is a quite high correlation between income and CPI, and that the income tax is pro-gressive, since tax revenues grow at a higher pace than in-come and inflation. These characteristics are non-typical for the tax system of Ukraine. PIT in Ukraine has a flat tax rate, while the tax base mainly consists of wages that are unlikely to be corrected to the level of inflation simultaneously. The direct estimation of PIT elasticity to CPI by running ARDL re-gression gives a value of (-0.7). This means that the income of the population and the corresponding tax revenues and social security contributions only partially react to changes in CPI in the same quarter. Other tax revenues are considered not to be sensitive to CPI fluctuations within a quarter, so for them we assume an elasticity of (-1). The weighted average elasticity of tax revenues to CPI αx

π is equal to (-0.39).8

The last restriction on the coefficient αxπ indicates the

impact of inflation on GDP within a quarter. Since we are op-erating with real variables, the automatic reaction of GDP in the current quarter should be (-1). However, GDP was con-verted into real terms by a deflator, while we use the con-sumer price index as an inflation indicator. Thus, the auto-matic reaction of the real GDP must be equal to the negative value of deflator elasticity to CPI. We have set the restriction on αx

π at (-0.3), since such elasticity was obtained when run-ning ARDL with a deflator as an endogenous variable and CPI as an exogenous one.

7 Weighted average elasticity according to the weights of wages, expenditures on goods and services, capital expenditures, current transfers to the population in overall budget expenditures.8 We set the following restrictions on the coefficient αt

π for different taxes: VAT – 0, customs – 0, CIT - 0, PIT – (-0.7), social security contributions – (-0.7), total tax revenues – (-0.3).

4. DATAIn our study, we use quarterly data for the period of

2001-2016 years. All variables, except ratios to GDP, were converted into 2010 prices using the deflator for GDP. When estimating their effects on inflation, fiscal variables were converted to real prices using the CPI. Also, all variables, ex-cept the public debt ratio and the ratio of the current account balance to GDP, were transformed into logarithms. All of the time series were seasonally adjusted using the Census X-12 algorithm, with the application of a multiplicative seasonal component, except for the current account balance to GDP ratio, where we assume the seasonal component is additive.

To estimate the base model, for budgetary expenditures we used primary budget expenditures minus current trans-fers and expenditures for the repayment of the pension fund deficit. By eliminating budget expenditures on financing of the pension fund deficit, we deviate from the standard meth-odology. The presence of such expenditures is a feature of the Ukrainian financial system, so it is not surprising that such adjustments are not made in similar studies. The elimination of expenditures for the repayment of the pension fund defi-cit is necessary, as they can contain an automatic reaction to GDP fluctuations, since social security contributions have a functional dependence on wages, while wages are cor-related with GDP. This automatic reaction would violate the assumption that there is no reaction of budget expenditure to GDP changes within a quarter.

The decomposition of budget expenditures on various cat-egories was conducted according to economic classification:

• budget expenditures on wages. Social security contri-butions, which are also paid from the budget, were excluded from this category, as the analysis is more suitable for the disposable income of employees in the public sector;

• expenditures on goods and services;

• capital expenditures;

• current transfers to the population, which include pen-sions, subsidies, scholarships, other payments to the pop-ulation that also have a potential impact on GDP growth through stimulating consumption.

Also, we distinguish expenditures on pensions from the Pension Fund of Ukraine (PFU) as an individual category of expenditures.

Table 1. Variants of restrictions on elasticity of real variable in relation to inflation

Elasticity Treating

εz,π < -1 Variable z decreases when inflation increases

εz,π = -1 Variable z doesn’t react

εz,π ∈ (-1.0) Variable z increases, with growth rate lower than growth rate of inflation

εz,π = 0 Variable z increases, with the same growth rate as inflation

εz,π > 0 Variable z increases, with growth rate higher than growth rate of inflation

31

A. Vdovychenko / Visnyk of the National Bank of Ukraine, No. 244, 2018, pp. 25–43

Taxes in the base model are the sum of all tax receipts of the consolidated budget of Ukraine. For disaggregated estimates, we used VAT, CIT, PIT, import customs and social security contributions.

5. RESULTS 5.1. Fiscal multipliers of taxes

and budget expendituresEstimated multipliers and graphs of the impulse re-

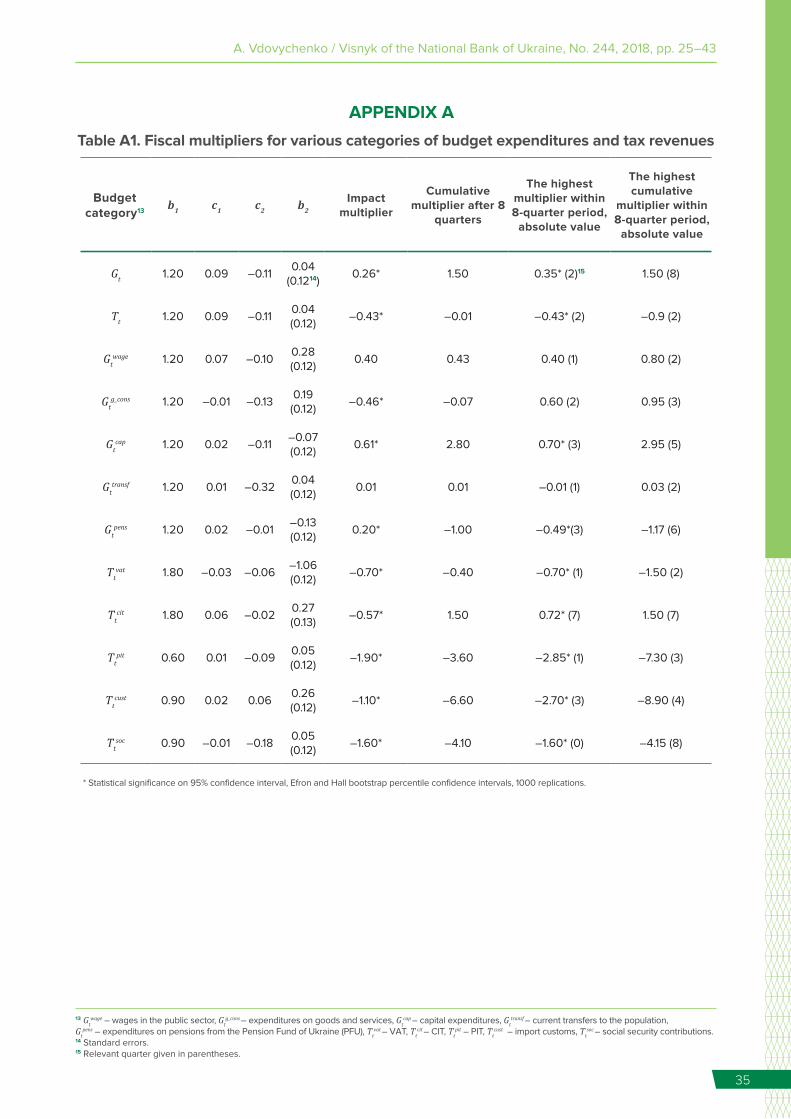
sponse functions (IRF) are given in appendix A.9 In Table A1 in Appendix A we also report restrictions on the coefficient b1, indicating an automatic response of relevant taxes to GDP, and the results of estimates for b2, с1 and с2. The re-sults presented demonstrate not only the magnitude of the multipliers, but also their persistence. According to the base model, the fiscal multiplier on impact is much higher for taxes (-0.43) than for budget expenditures, reaching a maximum cumulative value of (-0.9) in the second quarter. For aggre-gate budget expenditures the impact multiplier is 0.26 while maximum cumulative value is 1.5 in the eighth quarter. The persistence of the two multipliers is different. Over a horizon of two years, the cumulative multiplier of budget expendi-tures remains statistically significant and is higher than unity. The cumulative tax multiplier approximates to zero after two years. This happens due to the values of the tax multiplier becoming positive after the third quarter. The positive effect of a tax shock on GDP after a short-term negative impact has two explanations. The first is the cross-impact of taxes on budget expenditures and GDP. According to the IRFs for tax shocks, budget expenditures respond positively, with a lag of three quarters. Since budget expenditures in our model have a positive multiplier, they also start to have a positive impact on GDP. The second explanation is based on the crowding-out effect. Increasing taxes leads to a drop in demand for money, and with the resulting fall in the level of interest rates GDP growth is stimulated.10 However, we can-not confidently state that the crowding-out effect is present in the Ukrainian economy, since we do not include interest rates into our analysis explicitly.

The results for aggregated budget parameters are some-what different from the values of the multipliers obtained in the IMF study (Mitra and Poghosyan 2015). The difference relates primarily to the budget expenditures multiplier, which cumulatively equals 2.9 after eight quarters and is more persistent than the multiplier for taxes. The discrepancy in the results is explained by the restrictions imposed on the coefficients с1 and с2 after the preliminary estimation. The coefficient, indicating the simultaneous impact of taxes on GDP (с2), in our study approximately corresponds to the IMF value, and is (-0.11).11 These coefficients are close in their values, even despite the fact that the restriction on b1 (the automatic effect of GDP on tax revenues within a quarter) in our study is 1.21,12 while in the IMF study this coefficient is 1.47. The significant difference relates to the restriction on с1, which indicates the elasticity of GDP to budget expendi-tures within a quarter. In our case, с1 = 0.09, while in Mitra and Poghosyan (2015) this coefficient was restricted to 0.14. Such a discrepancy in estimates may be explained by the

9 Since all endogenous variables are in logarithms, the graphs reflect elasticities. In Table A1, elasticities are multiplied by the ratio of the average values of GDP to the target variable for reporting multipliers.10 The logic of the stimulating effect of raising taxes is given in Mankiw and Summers (1984).11 In Mitra and Poghosyan (2015) this restriction equals (-0.12).12 The coefficient was derived from the cointegrating equation of taxes and GDP with inclusion of constant, linear trend, and dummies for the crises of 2004, 2008, and 2014.

differing approaches to the construction of the time series of budget expenditures. To establish the possible reasons for the discrepancies, as an experiment we carried out trans-formations on our data that made our sample similar to that used in (Mitra and Poghosyan, 2015): we restricted the data sample to the fourth quarter of 2013; eliminated current ex-penditures from primary budget expenditures, but did not make an adjustment for funding of the deficit of the pen-sion fund. We imposed restriction b1 = 1.47 and constructed a VAR model similar to IMF specifications. The estimations gave a cumulative multiplier for budget expenditures at the level of 2.4 after eight quarters, and an impact multiplier of 0.7. In Mitra and Poghosyan (2015), the respective multipliers are 2.8 and 0.43. The tax multiplier in our case became very low and not statistically significant. In Mitra and Poghosyan (2015), the cumulative tax multiplier is (-0.96) after the eight quarters, (-0.3) on impact, and also statistically insignificant after the first quarter. The growth of the budget expenditures multiplier and the drop in the tax multiplier, in our opinion, are related to the following factors:

• the exclusion of transfers from budget expenditures in-creases the share of capital expenditures that have a high multiplier;

• the absence of an adjustment for funding of the pen-sion fund deficit introduces potential endogeneity in esti-mates of structural coefficients;

• the data sample in Mitra and Poghosyan (2015) does not cover 2014-2016, when there was a severe economic downturn – during such periods the values of multipliers can vary significantly.

In our estimates we do not exclude transfers from bud-get expenditures entirely, as this item of expenditure is very large and includes social security payments to the public. Potentially, these expenditures may have the impact on ag-gregate demand in the economy, and thus affect output.

5.2. Multipliers of individual tax categories and budget expenditures An analysis of multipliers estimated for various catego-

ries of budget expenditure indicates that those items that should cause a direct influence on consumption (wages in the public sector, current transfers to the population, and pension expenditures of PFU) have low and statistically not significant multipliers. These results are close to the find-ings of de Castro and de Cos (2006) and suggest a weak response of consumption to shocks in such expenditures. Such a result may be caused by “Ricardian” sentiments in the economy, and the supply shock that happens when wage in-creases in the public sector put pressure on the equilibrium level of wages in the economy as a whole, reducing profits and investment (Alesina et al., 2002). The arguments in favor of this explanation are backed up by the strong inflationary effect of wage expenditures, as shown below.

The cumulative multiplier of expenditures on goods and services approaches 1 in the third quarter, and falls to zero

32

A. Vdovychenko / Visnyk of the National Bank of Ukraine, No. 244, 2018, pp. 25–43

after two years. The peculiarity of this multiplier is that it is negative on impact. The values of this multiplier are some-what abnormal, since budget expenditures of this kind should be drivers of economic growth. According to the results, public procurements have a moderate impact on real GDP and rather quickly stimulate CPI growth, as will be shown below. An analysis of the IRFs indicates that a shock in government procurements has a negative impact on real GDP on impact, because of its accelerating effect on CPI. To explain the causes of this anomaly, we further decom-posed expenditures previously classified as expenses on goods and services into subcategories, with respect to the economic classification of these budget items:

• purchase of supplies and materials, payments for ser-vices and other expenditures;

• expenditures on business trips;

• materials, inventory, construction, overhaul and special purpose measures that have national importance;

• expenditures on utilities and energy resources;

• research and development, state programs.

Since a number of expenditures from the list above have no obvious positive impact on GDP, we eliminated expendi-tures on business trips, research and development, and on state programs. After that, we constructed the IRFs for the shock of adjusted expenditures on goods and services, fol-lowing the methodology applied in this study. The results in Appendix B indicate that the removal of potentially "unpro-ductive" categories of expenditures from government con-sumption significantly raises the fiscal multiplier (cumulative multiplier after eight quarters is 3.3 against (-0.07) before the adjustment) and significantly reduces the positive response of inflation (on impact the effect is 0.054%, against 0.13% before adjustment). These results indicate that government consumption has a high multiplier and a moderate impact on inflation. This experiment also demonstrates that inside the categories of aggregated budget expenditures, there are subcategories that can vary significantly depending on the impact on an economy.

The multiplier of capital expenditures is significantly larg-er than 1 after eight quarters, and close to the value from results of Mitra and Poghosyan (2015). For capital expendi-tures, the multiplier is more persistent compared to expen-ditures on goods and services, as it remains statistically sig-nificant after the eight quarters.

The estimates of multipliers for various types of taxes demonstrate that the most negative impact on GDP comes from shocks to labor taxes. The multipliers of PIT and social security contributions are among the highest of all budget items estimated in this study, and do not lose their statisti-cal significance after eight quarters. The multiplier of VAT is moderate, demonstrating a maximum absolute value (-0.7) on impact, and quickly losing its significance. The case of import customs is rather interesting: the multiplier is negative, very high, and statistically significant during the first four quarters, while after that it becomes positive and loses its statistical significance. This behavior of the multiplier can be seen as reflecting the short-term negative effect of a hike on import duties on GDP growth, which becomes positive in the long-term. The CIT shock has low negative impact on real GDP over the first three quarters. In the long run, the impact be-comes positive. Such an effect is a consequence of the op-

timization of profit before taxation through an increase in in-vestments and other expenses deductible from the tax base.

5.3. The reaction of inflation to fiscal shocks The estimates of the impact of budget parameters on CPI

in accordance with the restrictions in matrix (3), are given in Table C1 in Appendix C. According to the estimates, budget expenditures and taxes have a substantial positive impact on the growth rate of CPI. Budget expenditures affect CPI significantly more strongly than taxes. Tax shocks rapidly transform into higher inflation, but because taxes also depress economic growth, a gradual deflationary effect also occurs. Inflation also instantaneously reacts to the shock of budget expenditures, with a gradually decreasing effect in subsequent periods.

Among budget expenditures, the highest inflationary ef-fect is produced by wages in the public sector. Expenditures on goods and services also have a significant positive ef-fect on CPI, although this is short-lived. Capital budget ex-penditures have a negligible short-term effect on inflation. Transfers to the population do not have a clearly expressed influence on inflation in the short term, but the impact is mod-erately positive after six quarters. The pension expenditures of PFU have a moderate instantaneous impact on the CPI, which quickly falls and becomes statistically insignificant.

The estimates for various categories of taxes indicate that the PIT has the highest inflationary effect. For VAT, PIT and social security contributions, the impact on inflation is fairly persistent and still positive during the first three quar-ters after the shock. In the case of import duties, all positive effects take place during the first two quarters. The impact of CIT on inflation is negative during the first three quarters, and it becomes neutral afterwards. This effect is explained by the short-term negative impact of CIT on GDP, after which a positive impact on GDP is produced by investments, which have a weak impact on inflation.

6. CONCLUSIONSIn this study, we estimated the impact of specific bud-

get expenditures and tax categories on GDP and inflation in Ukraine. For this purpose, we applied the standard SVAR, with a Blanchard-Perotti identification scheme.

The estimated multipliers for aggregated budget expen-ditures are consistent with the values that are common for emerging markets, and are rather low (at the level of 0.1 - 0.5) during the first year (Batini, Eyraud, and Weber, 2014). Our results are somewhat different from the findings of Mitra and Poghosyan (2015) for Ukraine, who determine the cumula-tive multiplier of budget expenditures to be 2.9 after eight quarters. In our opinion, the reason for this discrepancy lies in the differences in the methods of forming budget expen-ditures as a variable for analysis, and the different sample of data used for research. The fiscal multiplier of tax revenues corresponds to similar empirical estimates for emerging economies (Batini, Eyraud, and Weber, 2014). However, un-like in previous studies, the standard value (close to (-1)) is reached in the second quarter. Such values usually match cumulative multipliers after two years. The less persistent negative effect of the tax shock suggests the existence of “non-Keynesian” mechanisms in the Ukrainian economy.

33

A. Vdovychenko / Visnyk of the National Bank of Ukraine, No. 244, 2018, pp. 25–43

The analysis of the impact on GDP from individual bud-get items demonstrated that the highest multipliers are as-sociated with capital investment and expenditures on goods and services. The multiplier of capital expenditures is the most persistent. The multipliers with low estimates are those of categories of budget expenditures that, theoretically, should stimulate consumption directly. This is an indicator of “non-Keynesian” mechanisms in action, among which is the “crowding-out” effect, “Ricardian” behavior, and negative supply shocks (Baxter and King, 1993; Unal, 2015). The same factors create a “non-Keynesian” form of GDP response to a tax shock, which becomes positive in the long term. This indicates short-term economic losses during fiscal consoli-dation episodes, with the subsequent adaptation of eco-nomic agents to new fiscal realities, and GDP growth under conditions of a sustainable fiscal policy and reduced debt levels. Among the various categories of tax revenues, the highest cumulative multipliers are associated with taxes on labor (PIT and social security contributions), what means the most significant losses are suffered by the economy when these taxes are raised. This result is in line with standard economic theory, which sees these taxes as being the most distorting (Nguyen et al., 2016). Another distorting tax, CIT, has a short-term negative impact on GDP, which becomes positive in the medium term. The positive effect of this tax on GDP is reported quite often in the literature (Unal, 2015; Arin and Koray, 2006; Guntram et al., 2006), and can be ex-plained by the redistribution of enterprises’ incomes in favor of investments and other productive expenses (Mertens and Ravn, 2013).

The impacts of individual budget items on inflation are rather varied, but on average budget expenditures place

higher inflationary pressure on the economy than taxes. For both sides of a budget, the highest inflationary pressure on the economy is associated with wages in the public sector, and PIT.

Budget expenditures can be divided into productive and unproductive. Productive expenditures are characterized by having a positive and sustained influence on real GDP and a moderate impact on inflation. This group includes capital expenditures and expenditures on government purchases. The group of unproductive expenditures includes expendi-tures of a social nature, namely transfers to the population, pensions, and expenditures on wages in the public sector. Unproductive expenditures do not have a statistically signifi-cant impact on real GDP and inflation, or affect only inflation. The latter is typical for wages in the public sector, which, ac-cording to the estimates, cause a shock of supply but not demand.

The positive response of inflation to shocks in most taxes (except CIT) indicates that taxes have a significant influence on the cost of production and affect prices from the supply side. This conclusion is consistent with the literature (de Cas-tro and de Cos 2006, Mertens and Ravn, 2013; Unal, 2015; Nguyen et al., 2016; Arin et al., 2016), where the effects of different budget items on an economy were analyzed.

One avenue for subsequent studies of this topic would be to analyze the factors that create the “non-Keynesian” re-action of Ukraine’s economy to fiscal shocks. These factors reduce the values of fiscal multipliers and raise questions about the effectiveness of fiscal stimulus in the Ukrainian economy.

34

A. Vdovychenko / Visnyk of the National Bank of Ukraine, No. 244, 2018, pp. 25–43

REFERENCES• Alesina A., Ardagna S., Perotti R., and Schiantarelli F.

(2002). Fiscal Policy, Profits, and Investment. American Economic Review, Vol. 92, No. 3, pp. 571-589. https://doi.org/10.1257/00028280260136255

• Arin K., Helles P., Koyuncu M., Reich O. (2016). Should We Care About The Composition Of Tax-Based Stimulus Packages? Contemporary Economic Policy, Vol. 34, No. 3, pp. 430-445. https://doi.org/10.1111/coep.12131

• Arin K., Koray F. (2006). Are Some Taxes Different Than Others? An Empirical Investigation of The Effects of Tax Policy in Canada. Empirical Economics, Vol. 31, No.1, pp. 183-193. https://doi.org/10.1007/s00181-005-0032-7

• Auerbach A. J., Gorodnichenko Y. (2012). Measuring the Output Responses to Fiscal Policy. American Economic Journal: Economic Policy, Vol. 4, No. 2, pp. 1-27. https://doi.org/10.1257/pol.4.2.1

• Barro R. J. (1991). Economic Growth in a Cross-Section of Countries. Quarterly Journal of Economics, Vol. 106, No. 2, pp. 407-443.

• Batini P., Eyraud L., and Weber A. (2014). A Simple Method to Compute Fiscal Multipliers. IMF Working Paper, No. 14/93.

• Baxter M., King R. (1993). Fiscal Policy in General Equilibrium. American Economic Review, Vol. 83, No. 3, pp. 315-334.

• Blanchard O., Perotti R. (2002). An Empirical Characterization of the Dynamic Effects of Changes in Government Spending and Taxes on Output. Quarterly Journal of Economics, Vol. 117, No. 4, pp. 1329-1368.

• Bonam D., de Haan J., and Soederhuizen B. (2017). The effects of fiscal policy at the effective lower bound. DNB Working Paper, No. 565.

• de Castro Fernández F., de Cos P. (2006). The Economic Effects of Exogenous Fiscal Shocks in Spain: a SVAR Approach. ECB Working Paper Series, No. 647.

• Fatás A., Mihov I. (2009). Why Fiscal Stimulus is Likely to Work. International Finance, Vol.12, No. 1, pp. 57-73. https://doi.org/10.1111/j.1468-2362.2009.01235.x

• Giavazzi F., Pagano M. (1990). Can Severe Fiscal Contractions Be Expansionary? Tales of Two Small European Countries. CEPR Discussion Paper, No. 417.

• Giorno C., Richardson P., Roseveare D., and van der Noord P. (1995). Estimating Potential Output, Output Gaps, and Structural Budget Deficits. OECD Economics Department Working Papers, No. 152.

• Guntram W., Tenhofen J., Heppke-Falk K. (2006). The Macroeconomic Effects of Exogenous Fiscal Policy Shocks in Germany: A Disaggregated Analysis. Deutsche Bundesbank Discussion Paper, No.41.

• Hasset K. (2009). Why Fiscal Stimulus is Unlikely to Work. International Finance, Vol. 12, No. 1, pp. 75-91.

• Ilzetzki E., Mendoza E., Vegh C. (2011). How Big (Small) Are Fiscal Multipliers? IMF Working Papers, No. 11/52.

• Mankiw G., Summers L. (1984). Are Tax Cuts Really Expansionary? NBER Working Papers, No. 1443.

• Mertens K., Ravn M. (2013). The Dynamic Effects of Personal and Corporate Income Tax Changes in the United States. American Economic Review. Vol. 103, No. 4, pp. 1212-1247. https://doi.org/10.1257/aer.103.4.1212

• Mitra T., Poghosyan T. (2015). Fiscal Multipliers in Ukraine. IMF Working Papers. No. 15/71.

• Nguyen A., Onnis L., Rossi R. (2016). The Macroeconomic Effects of Income and Consumption Tax Changes. Centre for Growth and Business Cycle Research Discussion Paper Series, No. 227.

• Parkyn O., Vehbi T. (2014). The Effects of Fiscal Policy in New Zealand: Evidence from a VAR Model with Debt Constraints. Economic Record, Vol. 90, No. 290, pp. 345-364. https://doi.org/10.1111/1475-4932.12116

• Perotti R. (2002). Estimating the Effects of Fiscal Policy in OECD Countries. ECB Working Paper, No. 168.

• Persson M., Persson T., Svensson L. (1996). Debt, Cash Flow and Inflation Incentives: a Swedish Example. NBER Working Papers. No. 5772.

• Romer C., Romer D. (2010). The Macroeconomic Effects of Tax Changes: Estimates Based on a New Measure of Fiscal Shocks. American Economic Review, Vol. 100, No. 3, pp.763-801. https://doi.org/10.1257/aer.100.3.763

• Rukelj D. (2009). Modelling Fiscal and Monetary Policy Interactions in Croatia Using Structural Vector Error Correction Model. Economic Trends and Economic Policy, Vol. 19, No. 121, pp. 27-59.

• Stock J., Watson M. (1993). A Simple Estimator of Cointegrating Vectors in Higher Order Integrated Systems. Econometrica, Vol. 61, No. 4, pp. 783-820.

• Unal U. (2015). Rethinking The Effects Of Fiscal Policy On Macroeconomic Aggregates: A Disaggregated SVAR Analysis. Journal for Economic Forecasting, Vol. 18, No. 3, pp. 120-135.

35

A. Vdovychenko / Visnyk of the National Bank of Ukraine, No. 244, 2018, pp. 25–43

APPENDIX А

Table A1. Fiscal multipliers for various categories of budget expenditures and tax revenues

Budget category13 b1 c1 c2 b2

Impact multiplier

Cumulative multiplier after 8

quarters

The highest multiplier within 8-quarter period,

absolute value

The highest cumulative

multiplier within 8-quarter period,

absolute value

Gt 1.20 0.09 –0.110.04

(0.1214)0.26* 1.50 0.35* (2)15 1.50 (8)

Tt 1.20 0.09 –0.110.04 (0.12)

–0.43* –0.01 –0.43* (2) –0.9 (2)

Gtwage 1.20 0.07 –0.10

0.28 (0.12)

0.40 0.43 0.40 (1) 0.80 (2)

Gtg_cons 1.20 –0.01 –0.13

0.19 (0.12)

–0.46* –0.07 0.60 (2) 0.95 (3)

Gtcap 1.20 0.02 –0.11

–0.07 (0.12)

0.61* 2.80 0.70* (3) 2.95 (5)

Gttransf 1.20 0.01 –0.32

0.04 (0.12)

0.01 0.01 –0.01 (1) 0.03 (2)

Gtpens 1.20 0.02 –0.01

–0.13 (0.12)

0.20* –1.00 –0.49*(3) –1.17 (6)

Ttvat 1.80 –0.03 –0.06

–1.06 (0.12)

–0.70* –0.40 –0.70* (1) –1.50 (2)

Ttcit 1.80 0.06 –0.02

0.27 (0.13)

–0.57* 1.50 0.72* (7) 1.50 (7)

Ttpit 0.60 0.01 –0.09

0.05 (0.12)

–1.90* –3.60 –2.85* (1) –7.30 (3)

Ttcust 0.90 0.02 0.06

0.26 (0.12)

–1.10* –6.60 –2.70* (3) –8.90 (4)

Ttsoc 0.90 –0.01 –0.18

0.05 (0.12)

–1.60* –4.10 –1.60* (0) –4.15 (8)

* Statistical significance on 95% confidence interval, Efron and Hall bootstrap percentile confidence intervals, 1000 replications.

13 Gtwage – wages in the public sector, Gt

g_cons – expenditures on goods and services, Gtcap – capital expenditures, Gt

transf – current transfers to the population, Gt

pens – expenditures on pensions from the Pension Fund of Ukraine (PFU), Ttvat – VAT, Tt

cit – CIT, Ttpit – PIT, Tt

cust – import customs, Ttsoc – social security contributions.

14 Standard errors.15 Relevant quarter given in parentheses.

13 1415

36

A. Vdovychenko / Visnyk of the National Bank of Ukraine, No. 244, 2018, pp. 25–43

Figure A1. Impulse response functions for 1% shock in model with three endogenous variables (budget expenditures, taxes, GDP), %

-0.15

-0.1

-0.05

0

0.05

0.1

0.15

0.2

-0.15

-0.1

-0.05

0

0.05

0.1

0.15

0 1 2 3 4 5 6 7 8 9 10 11 12 13 14 15 16 17 18 19 20 0 1 2 3 4 5 6 7 8 9 10 11 12 13 14 15 16 17 18 19 20

Response of CPI to the shock of budget expenditures Response of CPI to the shock of budget expenditures on goods and services

-

-0.15

-0.1

-0.05

0

0.05

0.1

-0.04

-0.02

0

0.02

0.04

0.06

0.08

0 1 2 3 4 5 6 7 8 9 10 11 12 13 14 15 16 17 18 19 20 0 1 2 3 4 5 6 7 8 9 10 11 12 13 14 15 16 17 18 19 20

Response of GDP to the shock of taxes Response of GDP to the shock of CIT

-0.6

-0.4

-0.2

0

0.2

0.4

0.6

0.8

1

0 1 2 3 4 5 6 7 8 9 10 11 12 13 14 15 16 17 18 19 20-0.8

-0.6

-0.4

-0.2

0

0.2

0.4

0.6

0 1 2 3 4 5 6 7 8 9 10 11 12 13 14 15 16 17 18 19 20

Response of budget expenditures to the shock of budget expenditures Response of budget expenditures to the shock of taxes

-0.8

-0.6

-0.4

-0.2

0

0.2

0.4

0.6

0.8

1

-0.4

-0.3

-0.2

-0.1

0

0.1

0.2

0.3

0.4

0 1 2 3 4 5 6 7 8 9 10 11 12 13 14 15 16 17 18 19 20 0 1 2 3 4 5 6 7 8 9 10 11 12 13 14 15 16 17 18 19 20

Response of GDP to the shock of GDP Response of GDP to the shock of CPI

-0.4

-0.3

-0.2

-0.1

0

0.1

0.2

0.3

0.4

-0.4

-0.2

0

0.2

0.4

0.6

0.8

1

0 1 2 3 4 5 6 7 8 9 10 11 12 13 14 15 16 17 18 19 20 0 1 2 3 4 5 6 7 8 9 10 11 12 13 14 15 16 17 18 19 20

Response of CPI to the shock of GDP Response of CPI to the shock of CPI

-0.2

0

0.2

0.4

0.6

0.8

1

1.2

0 1 2 3 4 5 6 7 8 9 10 11 12 13 14 15 16 17 18 19 20

Response of budget expenditures to the shock of budget expenditures

Perc

ent

Quarters

-0.2

-0.1

0

0.1

0.2

0.3

0.4

0.5

0 1 2 3 4 5 6 7 8 9 10 11 12 13 14 15 16 17 18 19 20

Response of budget expenditures to the shock of taxes

Perc

ent

Quarters Quarters Quarters

-0.2

-0.1

0

0.1

0.2

0.3

0.4

0.5

0 1 2 3 4 5 6 7 8 9 10 11 12 13 14 15 16 17 18 19 20

Response of taxes to the shock of budget expenditures

Perc

ent

Quarters

-0.05

0

0.05

0.1

0.15

0.2

0 1 2 3 4 5 6 7 8 9 10 11 12 13 14 15 16 17 18 19 20

Response of GDP to the shock of budget expenditures

Perc

ent

Quarters

Quarters Quarters Quarters Quarters

Quarters Quarters

Quarters Quarters

-0.4

-0.2

0

0.2

0.4

0.6

0.8

1

0 1 2 3 4 5 6 7 8 9 10 11 12 13 14 15 16 17 18 19 20

Response of taxes to the shock of taxes

Quarters

Perc

ent

-0.15

-0.1

-0.05

0

0.05

0.1

0 1 2 3 4 5 6 7 8 9 10 11 12 13 14 15 16 17 18 19 20

Response of GDP to the shock of taxes

Quarters

Perc

ent

-1

-0.5

0

0.5

1

1.5

2

0 1 2 3 4 5 6 7 8 9 10 11 12 13 14 15 16 17 18 19 20

Response of budget expenditures to the shock of GDPQuarters

Perc

ent

-1.5

-1

-0.5

0

0.5

1

1.5

0 1 2 3 4 5 6 7 8 9 10 11 12 13 14 15 16 17 18 19 20

Response of taxes to the shock of GDP

Quarters

Perc

ent

-0.6

-0.4

-0.2

0

0.2

0.4

0.6

0.8

1

0 1 2 3 4 5 6 7 8 9 10 11 12 13 14 15 16 17 18 19 20

Response of GDP to the shock of GDP

Quarters

Perc

ent

Perc

ent

-0.3

-0.25

-0.2

-0.15

-0.1

-0.05

0

0.05

0.1

0.15

0.2

0 1 2 3 4 5 6 7 8 9 10 11 12 13 14 15 16 17 18 19 20

Response of GDP to the shock of PIT

Quarters

Perc

ent

-0.08

-0.06

-0.04

-0.02

0

0.02

0.04

0.06

0 1 2 3 4 5 6 7 8 9 10 11 12 13 14 15 16 17 18 19 20

Response of GDP to the shock of VAT

Quarters

Perc

ent

Perc

ent

-0.2

-0.15

-0.1

-0.05

0

0.05

0.1

0.15

0 1 2 3 4 5 6 7 8 9 10 11 12 13 14 15 16 17 18 19 20

Response of GDP to the shock of social security contributions

Quarters

Perc

ent

-0.06

-0.05

-0.04

-0.03

-0.02

-0.01

0

0.01

0.02

0.03

0 1 2 3 4 5 6 7 8 9 10 11 12 13 14 15 16 17 18 19 20

Response of GDP to the shock of import customs

Quarters

Perc

ent

-0.05

0

0.05

0.1

0.15

0.2

0 1 2 3 4 5 6 7 8 9 10 11 12 13 14 15 16 17 18 19 20

Response of GDP to the shock of budget expendituresQuarters

Perc

ent

-0.04

-0.02

0

0.02

0.04

0.06

0.08

0 1 2 3 4 5 6 7 8 9 10 11 12 13 14 15 16 17 18 19 20

Response of GDP to the shock of budget expenditures on wagesQuarters

Perc

ent

-0.025

-0.02

-0.015

-0.01

-0.005

0

0.005

0.01

0.015

0.02

0 1 2 3 4 5 6 7 8 9 10 11 12 13 14 15 16 17 18 19 20

Response of GDP to the shock of transfers to the populationQuarters

Perc

ent

-0.08

-0.06

-0.04

-0.02

0

0.02

0.04

0.06

0.08

0.1

0.12

0 1 2 3 4 5 6 7 8 9 10 11 12 13 14 15 16 17 18 19 20

Response of GDP to the shock of expenditures on goods and servicesQuarters

Perc

ent

-0.02

-0.01

0

0.01

0.02

0.03

0.04

0.05

0 1 2 3 4 5 6 7 8 9 10 11 12 13 14 15 16 17 18 19 20

Response of GDP to the shock of capital expenditures

Quarters

Perc

ent

-0.12

-0.1

-0.08

-0.06

-0.04

-0.02

0

0.02

0.04

0 1 2 3 4 5 6 7 8 9 10 11 12 13 14 15 16 17 18 19 20

Response of GDP to the shock of pensions

Quarters

Perc

ent

-0.25

-0.2

-0.15

-0.1

-0.05

0

0.05

0.1

0.15

0.2

0 1 2 3 4 5 6 7 8 9 10 11 12 13 14 15 16 17 18 19 20

Response of CPI to the shock of taxes

Quarters

Perc

ent

-0.2

-0.15

-0.1

-0.05

0

0.05

0.1

0 1 2 3 4 5 6 7 8 9 10 11 12 13 14 15 16 17 18 19 20

Response of CPI to the shock of CIT

Quarters

Perc

ent

-0.08

-0.06

-0.04

-0.02

0

0.02

0.04

0.06

0 1 2 3 4 5 6 7 8 9 10 11 12 13 14 15 16 17 18 19 20

Response of CPI to the shock of social security contributionsQuarters

Perc

ent

Perc

ent

-0.08

-0.06

-0.04

-0.02

0

0.02

0.04

0.06

0.08

0 1 2 3 4 5 6 7 8 9 10 11 12 13 14 15 16 17 18 19 20

Response of CPI to the shock of capital expenditures Quarters

Perc

ent

-0.2

-0.1

0

0.1

0.2

0.3

0.4

0.5

0.6

0 1 2 3 4 5 6 7 8 9 10 11 12 13 14 15 16 17 18 19 20

Response of CPI to the shock of budget expenditures on wagesQuarters

Perc

ent

-1.5

-1

-0.5

0

0.5

1

0 1 2 3 4 5 6 7 8 9 10 11 12 13 14 15 16 17 18 19 20

Response of budget expenditures to the shock of CPIQuarters

Perc

ent

Perc

ent

Perc

ent

-2

-1.5

-1

-0.5

0

0.5

1

1.5

2

0 1 2 3 4 5 6 7 8 9 10 11 12 13 14 15 16 17 18 19 20

Response of budget expenditures to the shock of GDPQuarters

Perc

ent

-1

-0.5

0

0.5

1

1.5

0 1 2 3 4 5 6 7 8 9 10 11 12 13 14 15 16 17 18 19 20-0.8

-0.6

-0.4

-0.2

0

0.2

0.4

0.6

0 1 2 3 4 5 6 7 8 9 10 11 12 13 14 15 16 17 18 19 20

Response of taxes to the shock of GDP Response of taxes to the shock of CPIQuarters Quarters

Perc

ent

Perc

ent

Perc

ent

Perc

ent

Perc

ent

-0.6

-0.4

-0.2

0

0.2

0.4

0.6

0.8

1

0 1 2 3 4 5 6 7 8 9 10 11 12 13 14 15 16 17 18 19 20

Response of taxes to the shock of taxesQuarters

Perc

ent

Perc

ent

-0.5

-0.4

-0.3

-0.2

-0.1

0

0.1

0.2

0.3

0 1 2 3 4 5 6 7 8 9 10 11 12 13 14 15 16 17 18 19 20

Response of taxes to the shock of budget expendituresQuarters

Perc

ent

-0.25

-0.2

-0.15

-0.1

-0.05

0

0.05

0.1

0.15

0.2

0.25

0 1 2 3 4 5 6 7 8 9 10 11 12 13 14 15 16 17 18 19 20

Response of GDP to the shock of taxesQuarters

Perc

ent

-0.2

-0.15

-0.1

-0.05

0

0.05

0.1

0.15

0.2

0 1 2 3 4 5 6 7 8 9 10 11 12 13 14 15 16 17 18 19 20

Response of GDP to the shock of budget expendituresQuarters

Perc

ent

-0.15

-0.1

-0.05

0

0.05

0.1

0.15

0.2

-0.25

-0.2

-0.15

-0.1

-0.05

0

0.05

0.1

0.15

0.2

0 1 2 3 4 5 6 7 8 9 10 11 12 13 14 15 16 17 18 19 20 0 1 2 3 4 5 6 7 8 9 10 11 12 13 14 15 16 17 18 19 20

Response of CPI to the shock of budget expenditures Response of CPI to the shock of taxes

Quarters Quarters

Perc

ent

Perc

ent

-0.15

-0.1

-0.05

0

0.05

0.1

0.15

0 1 2 3 4 5 6 7 8 9 10 11 12 13 14 15 16 17 18 19 20

Response of CPI to the shock of import customs

Quarters

Perc

ent

-0.2

-0.1

0

0.1

0.2

0.3

0.4

0 1 2 3 4 5 6 7 8 9 10 11 12 13 14 15 16 17 18 19 20

Response of CPI to the shock of PIT

Quarters

Perc

ent

0.06

0.04

0.02

0

0.02

0.04

0.06

0.08

0 1 2 3 4 5 6 7 8 9 10 11 12 13 14 15 16 17 18 19 20

Response of CPI to the shock of VATQuarters

Perc

ent

Perc

ent

-0.1

-0.08

-0.06

-0.04

-0.02

0

0.02

0.04

0.06

0.08

0.1

0 1 2 3 4 5 6 7 8 9 10 11 12 13 14 15 16 17 18 19 20

Response of CPI to the shock of transfers to the populationQuarters

Perc

ent

-0.1

-0.08

-0.06

-0.04

-0.02

0

0.02

0.04

0.06

0 1 2 3 4 5 6 7 8 9 10 11 12 13 14 15 16 17 18 19 20

Response of CPI to the shock of pensionsQuarters

Perc

ent

-0.08

-0.06

-0.04

-0.02

Perc

ent

0

0.02

0.04

0.06

0.08

0.1

0.12

0 1 2 3 4 5 6 7 8 9 10 11 12 13 14 15 16 17 18 19 20

Response of GDP to the shock of expenditures on goods and servicesQuarters

Perc

ent

-0.15

-0.1

-0.05

0

0.05

0.1

0.15

0 1 2 3 4 5 6 7 8 9 10 11 12 13 14 15 16 17 18 19 20

Response of CPI to the shock of expenditures on goods and servicesQuarters

Perc

ent

-0.1

-0.05

0

0.05

0.1

0.15

0.2

0 1 2 3 4 5 6 7 8 9 10 11 12 13 14 15 16 17 18 19 20

0 1 2 3 4 5 6 7 8 9 10 11 12 13 14 15 16 17 18 19 20

Response of GDP to the shock of adjusted expenditures on goods and servicesQuarters

Perc

ent

-0.15

-0.1

-0.05

0

0.05

0.1

Response of CPI to the shock of adjustedon goods and servicesQuarters

37

A. Vdovychenko / Visnyk of the National Bank of Ukraine, No. 244, 2018, pp. 25–43

Figure A2. Impulse response functions of real GDP to 1% shock to various budget expenditures, %

-0.15

-0.1

-0.05

0

0.05

0.1

0.15

0.2

-0.15

-0.1

-0.05

0

0.05

0.1

0.15

0 1 2 3 4 5 6 7 8 9 10 11 12 13 14 15 16 17 18 19 20 0 1 2 3 4 5 6 7 8 9 10 11 12 13 14 15 16 17 18 19 20

Response of CPI to the shock of budget expenditures Response of CPI to the shock of budget expenditures on goods and services

-

-0.15

-0.1

-0.05

0

0.05

0.1

-0.04

-0.02

0

0.02

0.04

0.06

0.08

0 1 2 3 4 5 6 7 8 9 10 11 12 13 14 15 16 17 18 19 20 0 1 2 3 4 5 6 7 8 9 10 11 12 13 14 15 16 17 18 19 20

Response of GDP to the shock of taxes Response of GDP to the shock of CIT

-0.6

-0.4

-0.2

0

0.2

0.4

0.6

0.8

1

0 1 2 3 4 5 6 7 8 9 10 11 12 13 14 15 16 17 18 19 20-0.8

-0.6

-0.4

-0.2

0

0.2

0.4

0.6

0 1 2 3 4 5 6 7 8 9 10 11 12 13 14 15 16 17 18 19 20

Response of budget expenditures to the shock of budget expenditures Response of budget expenditures to the shock of taxes

-0.8

-0.6

-0.4

-0.2

0

0.2

0.4

0.6

0.8

1

-0.4

-0.3

-0.2

-0.1

0

0.1

0.2

0.3

0.4

0 1 2 3 4 5 6 7 8 9 10 11 12 13 14 15 16 17 18 19 20 0 1 2 3 4 5 6 7 8 9 10 11 12 13 14 15 16 17 18 19 20

Response of GDP to the shock of GDP Response of GDP to the shock of CPI

-0.4

-0.3

-0.2

-0.1

0

0.1

0.2

0.3

0.4

-0.4

-0.2

0

0.2

0.4

0.6

0.8

1

0 1 2 3 4 5 6 7 8 9 10 11 12 13 14 15 16 17 18 19 20 0 1 2 3 4 5 6 7 8 9 10 11 12 13 14 15 16 17 18 19 20

Response of CPI to the shock of GDP Response of CPI to the shock of CPI

-0.2

0

0.2

0.4

0.6

0.8

1

1.2

0 1 2 3 4 5 6 7 8 9 10 11 12 13 14 15 16 17 18 19 20

Response of budget expenditures to the shock of budget expenditures

Perc

ent

Quarters

-0.2

-0.1

0

0.1

0.2

0.3

0.4

0.5

0 1 2 3 4 5 6 7 8 9 10 11 12 13 14 15 16 17 18 19 20

Response of budget expenditures to the shock of taxes

Perc

ent

Quarters Quarters Quarters

-0.2

-0.1

0

0.1

0.2

0.3

0.4

0.5

0 1 2 3 4 5 6 7 8 9 10 11 12 13 14 15 16 17 18 19 20

Response of taxes to the shock of budget expenditures

Perc

ent

Quarters

-0.05

0

0.05

0.1

0.15

0.2

0 1 2 3 4 5 6 7 8 9 10 11 12 13 14 15 16 17 18 19 20

Response of GDP to the shock of budget expenditures

Perc

ent

Quarters

Quarters Quarters Quarters Quarters

Quarters Quarters

Quarters Quarters

-0.4

-0.2

0

0.2

0.4

0.6

0.8

1

0 1 2 3 4 5 6 7 8 9 10 11 12 13 14 15 16 17 18 19 20

Response of taxes to the shock of taxes

Quarters

Perc

ent

-0.15

-0.1

-0.05

0

0.05

0.1

0 1 2 3 4 5 6 7 8 9 10 11 12 13 14 15 16 17 18 19 20

Response of GDP to the shock of taxes

Quarters

Perc

ent

-1

-0.5

0

0.5

1

1.5

2

0 1 2 3 4 5 6 7 8 9 10 11 12 13 14 15 16 17 18 19 20

Response of budget expenditures to the shock of GDPQuarters

Perc

ent

-1.5

-1

-0.5

0

0.5

1

1.5

0 1 2 3 4 5 6 7 8 9 10 11 12 13 14 15 16 17 18 19 20

Response of taxes to the shock of GDP

Quarters

Perc

ent

-0.6

-0.4

-0.2

0

0.2

0.4

0.6

0.8

1

0 1 2 3 4 5 6 7 8 9 10 11 12 13 14 15 16 17 18 19 20

Response of GDP to the shock of GDP

Quarters

Perc

ent

Perc

ent

-0.3

-0.25

-0.2

-0.15

-0.1

-0.05

0

0.05

0.1

0.15

0.2

0 1 2 3 4 5 6 7 8 9 10 11 12 13 14 15 16 17 18 19 20

Response of GDP to the shock of PIT

Quarters

Perc

ent

-0.08

-0.06

-0.04

-0.02

0

0.02

0.04

0.06

0 1 2 3 4 5 6 7 8 9 10 11 12 13 14 15 16 17 18 19 20

Response of GDP to the shock of VAT

Quarters

Perc

ent

Perc

ent

-0.2

-0.15

-0.1

-0.05

0

0.05

0.1

0.15

0 1 2 3 4 5 6 7 8 9 10 11 12 13 14 15 16 17 18 19 20

Response of GDP to the shock of social security contributions

Quarters

Perc

ent

-0.06

-0.05

-0.04

-0.03

-0.02

-0.01

0

0.01

0.02

0.03

0 1 2 3 4 5 6 7 8 9 10 11 12 13 14 15 16 17 18 19 20

Response of GDP to the shock of import customs

Quarters

Perc

ent

-0.05

0

0.05

0.1

0.15

0.2

0 1 2 3 4 5 6 7 8 9 10 11 12 13 14 15 16 17 18 19 20

Response of GDP to the shock of budget expendituresQuarters

Perc

ent

-0.04

-0.02

0

0.02

0.04

0.06

0.08

0 1 2 3 4 5 6 7 8 9 10 11 12 13 14 15 16 17 18 19 20

Response of GDP to the shock of budget expenditures on wagesQuarters

Perc

ent

-0.025

-0.02

-0.015

-0.01

-0.005

0

0.005

0.01

0.015

0.02

0 1 2 3 4 5 6 7 8 9 10 11 12 13 14 15 16 17 18 19 20

Response of GDP to the shock of transfers to the populationQuarters

Perc

ent

-0.08

-0.06

-0.04

-0.02

0

0.02

0.04

0.06

0.08

0.1

0.12

0 1 2 3 4 5 6 7 8 9 10 11 12 13 14 15 16 17 18 19 20

Response of GDP to the shock of expenditures on goods and servicesQuarters

Perc

ent

-0.02

-0.01

0

0.01

0.02

0.03

0.04

0.05

0 1 2 3 4 5 6 7 8 9 10 11 12 13 14 15 16 17 18 19 20

Response of GDP to the shock of capital expenditures

Quarters

Perc

ent

-0.12

-0.1

-0.08

-0.06

-0.04

-0.02

0

0.02

0.04

0 1 2 3 4 5 6 7 8 9 10 11 12 13 14 15 16 17 18 19 20

Response of GDP to the shock of pensions

Quarters

Perc

ent

-0.25

-0.2

-0.15

-0.1

-0.05

0

0.05

0.1

0.15

0.2

0 1 2 3 4 5 6 7 8 9 10 11 12 13 14 15 16 17 18 19 20

Response of CPI to the shock of taxes

Quarters

Perc

ent

-0.2

-0.15

-0.1

-0.05

0

0.05

0.1

0 1 2 3 4 5 6 7 8 9 10 11 12 13 14 15 16 17 18 19 20

Response of CPI to the shock of CIT

Quarters

Perc

ent

-0.08

-0.06

-0.04

-0.02

0

0.02

0.04

0.06

0 1 2 3 4 5 6 7 8 9 10 11 12 13 14 15 16 17 18 19 20

Response of CPI to the shock of social security contributionsQuarters

Perc

ent

Perc

ent

-0.08

-0.06

-0.04

-0.02

0

0.02

0.04

0.06

0.08

0 1 2 3 4 5 6 7 8 9 10 11 12 13 14 15 16 17 18 19 20

Response of CPI to the shock of capital expenditures Quarters

Perc

ent

-0.2

-0.1

0

0.1

0.2

0.3

0.4

0.5

0.6

0 1 2 3 4 5 6 7 8 9 10 11 12 13 14 15 16 17 18 19 20

Response of CPI to the shock of budget expenditures on wagesQuarters

Perc

ent

-1.5

-1

-0.5

0

0.5

1

0 1 2 3 4 5 6 7 8 9 10 11 12 13 14 15 16 17 18 19 20

Response of budget expenditures to the shock of CPIQuarters

Perc

ent

Perc

ent

Perc

ent

-2

-1.5

-1

-0.5

0

0.5

1

1.5

2

0 1 2 3 4 5 6 7 8 9 10 11 12 13 14 15 16 17 18 19 20

Response of budget expenditures to the shock of GDPQuarters

Perc

ent

-1

-0.5

0

0.5

1

1.5

0 1 2 3 4 5 6 7 8 9 10 11 12 13 14 15 16 17 18 19 20-0.8

-0.6

-0.4

-0.2

0

0.2

0.4

0.6

0 1 2 3 4 5 6 7 8 9 10 11 12 13 14 15 16 17 18 19 20

Response of taxes to the shock of GDP Response of taxes to the shock of CPIQuarters Quarters

Perc

ent

Perc

ent

Perc

ent

Perc

ent

Perc

ent

-0.6

-0.4

-0.2

0

0.2

0.4

0.6

0.8

1

0 1 2 3 4 5 6 7 8 9 10 11 12 13 14 15 16 17 18 19 20

Response of taxes to the shock of taxesQuarters

Perc

ent

Perc

ent

-0.5

-0.4

-0.3

-0.2

-0.1

0

0.1

0.2

0.3

0 1 2 3 4 5 6 7 8 9 10 11 12 13 14 15 16 17 18 19 20

Response of taxes to the shock of budget expendituresQuarters

Perc

ent

-0.25

-0.2

-0.15

-0.1

-0.05

0

0.05

0.1

0.15

0.2

0.25

0 1 2 3 4 5 6 7 8 9 10 11 12 13 14 15 16 17 18 19 20

Response of GDP to the shock of taxesQuarters

Perc

ent

-0.2

-0.15

-0.1

-0.05

0

0.05

0.1

0.15

0.2

0 1 2 3 4 5 6 7 8 9 10 11 12 13 14 15 16 17 18 19 20

Response of GDP to the shock of budget expendituresQuarters

Perc

ent

-0.15

-0.1

-0.05

0

0.05

0.1

0.15

0.2

-0.25

-0.2

-0.15

-0.1

-0.05

0

0.05

0.1

0.15

0.2

0 1 2 3 4 5 6 7 8 9 10 11 12 13 14 15 16 17 18 19 20 0 1 2 3 4 5 6 7 8 9 10 11 12 13 14 15 16 17 18 19 20

Response of CPI to the shock of budget expenditures Response of CPI to the shock of taxes

Quarters Quarters

Perc

ent

Perc

ent

-0.15

-0.1

-0.05

0

0.05

0.1

0.15

0 1 2 3 4 5 6 7 8 9 10 11 12 13 14 15 16 17 18 19 20

Response of CPI to the shock of import customs

Quarters

Perc

ent

-0.2

-0.1

0

0.1

0.2

0.3

0.4

0 1 2 3 4 5 6 7 8 9 10 11 12 13 14 15 16 17 18 19 20

Response of CPI to the shock of PIT

Quarters

Perc

ent

0.06

0.04

0.02

0

0.02

0.04

0.06

0.08

0 1 2 3 4 5 6 7 8 9 10 11 12 13 14 15 16 17 18 19 20

Response of CPI to the shock of VATQuarters

Perc

ent

Perc

ent

-0.1

-0.08

-0.06

-0.04

-0.02

0

0.02

0.04

0.06

0.08

0.1

0 1 2 3 4 5 6 7 8 9 10 11 12 13 14 15 16 17 18 19 20

Response of CPI to the shock of transfers to the populationQuarters

Perc

ent

-0.1

-0.08

-0.06

-0.04

-0.02

0

0.02

0.04

0.06

0 1 2 3 4 5 6 7 8 9 10 11 12 13 14 15 16 17 18 19 20

Response of CPI to the shock of pensionsQuarters

Perc

ent

-0.08

-0.06

-0.04

-0.02

Perc

ent

0

0.02

0.04

0.06

0.08

0.1

0.12

0 1 2 3 4 5 6 7 8 9 10 11 12 13 14 15 16 17 18 19 20

Response of GDP to the shock of expenditures on goods and servicesQuarters

Perc

ent

-0.15

-0.1

-0.05

0

0.05

0.1

0.15

0 1 2 3 4 5 6 7 8 9 10 11 12 13 14 15 16 17 18 19 20

Response of CPI to the shock of expenditures on goods and servicesQuarters

Perc

ent

-0.1

-0.05

0

0.05

0.1

0.15

0.2

0 1 2 3 4 5 6 7 8 9 10 11 12 13 14 15 16 17 18 19 20

0 1 2 3 4 5 6 7 8 9 10 11 12 13 14 15 16 17 18 19 20

Response of GDP to the shock of adjusted expenditures on goods and servicesQuarters

Perc

ent

-0.15

-0.1

-0.05

0

0.05

0.1

Response of CPI to the shock of adjustedon goods and servicesQuarters

38

A. Vdovychenko / Visnyk of the National Bank of Ukraine, No. 244, 2018, pp. 25–43

Figure A3. Impulse response functions of real GDP to 1% shock to various taxes, %

-0.15

-0.1

-0.05

0

0.05

0.1

0.15

0.2

-0.15

-0.1

-0.05

0

0.05

0.1

0.15

0 1 2 3 4 5 6 7 8 9 10 11 12 13 14 15 16 17 18 19 20 0 1 2 3 4 5 6 7 8 9 10 11 12 13 14 15 16 17 18 19 20

Response of CPI to the shock of budget expenditures Response of CPI to the shock of budget expenditures on goods and services

-

-0.15

-0.1

-0.05

0

0.05

0.1

-0.04

-0.02

0

0.02

0.04

0.06

0.08

0 1 2 3 4 5 6 7 8 9 10 11 12 13 14 15 16 17 18 19 20 0 1 2 3 4 5 6 7 8 9 10 11 12 13 14 15 16 17 18 19 20

Response of GDP to the shock of taxes Response of GDP to the shock of CIT

-0.6

-0.4

-0.2

0

0.2

0.4

0.6

0.8

1

0 1 2 3 4 5 6 7 8 9 10 11 12 13 14 15 16 17 18 19 20-0.8

-0.6

-0.4

-0.2

0

0.2

0.4

0.6

0 1 2 3 4 5 6 7 8 9 10 11 12 13 14 15 16 17 18 19 20

Response of budget expenditures to the shock of budget expenditures Response of budget expenditures to the shock of taxes

-0.8

-0.6

-0.4

-0.2

0

0.2

0.4

0.6

0.8

1

-0.4

-0.3

-0.2

-0.1

0

0.1

0.2

0.3

0.4

0 1 2 3 4 5 6 7 8 9 10 11 12 13 14 15 16 17 18 19 20 0 1 2 3 4 5 6 7 8 9 10 11 12 13 14 15 16 17 18 19 20

Response of GDP to the shock of GDP Response of GDP to the shock of CPI

-0.4

-0.3

-0.2

-0.1

0

0.1

0.2

0.3

0.4

-0.4

-0.2

0

0.2

0.4

0.6

0.8

1

0 1 2 3 4 5 6 7 8 9 10 11 12 13 14 15 16 17 18 19 20 0 1 2 3 4 5 6 7 8 9 10 11 12 13 14 15 16 17 18 19 20

Response of CPI to the shock of GDP Response of CPI to the shock of CPI

-0.2

0

0.2

0.4

0.6

0.8

1

1.2

0 1 2 3 4 5 6 7 8 9 10 11 12 13 14 15 16 17 18 19 20

Response of budget expenditures to the shock of budget expenditures

Perc

ent

Quarters

-0.2

-0.1

0

0.1

0.2

0.3

0.4

0.5

0 1 2 3 4 5 6 7 8 9 10 11 12 13 14 15 16 17 18 19 20

Response of budget expenditures to the shock of taxes

Perc

ent

Quarters Quarters Quarters

-0.2

-0.1

0

0.1

0.2

0.3

0.4

0.5

0 1 2 3 4 5 6 7 8 9 10 11 12 13 14 15 16 17 18 19 20

Response of taxes to the shock of budget expenditures

Perc

ent

Quarters

-0.05

0

0.05

0.1

0.15

0.2

0 1 2 3 4 5 6 7 8 9 10 11 12 13 14 15 16 17 18 19 20

Response of GDP to the shock of budget expenditures

Perc

ent

Quarters

Quarters Quarters Quarters Quarters

Quarters Quarters

Quarters Quarters

-0.4

-0.2

0

0.2

0.4

0.6

0.8

1

0 1 2 3 4 5 6 7 8 9 10 11 12 13 14 15 16 17 18 19 20

Response of taxes to the shock of taxes

Quarters

Perc

ent

-0.15

-0.1

-0.05

0

0.05

0.1

0 1 2 3 4 5 6 7 8 9 10 11 12 13 14 15 16 17 18 19 20

Response of GDP to the shock of taxes

Quarters

Perc

ent

-1

-0.5

0

0.5

1

1.5

2

0 1 2 3 4 5 6 7 8 9 10 11 12 13 14 15 16 17 18 19 20

Response of budget expenditures to the shock of GDPQuarters

Perc

ent

-1.5

-1

-0.5

0

0.5

1

1.5

0 1 2 3 4 5 6 7 8 9 10 11 12 13 14 15 16 17 18 19 20

Response of taxes to the shock of GDP

Quarters

Perc

ent

-0.6

-0.4

-0.2

0

0.2

0.4

0.6

0.8

1

0 1 2 3 4 5 6 7 8 9 10 11 12 13 14 15 16 17 18 19 20

Response of GDP to the shock of GDP

Quarters

Perc

ent

Perc

ent

-0.3

-0.25

-0.2

-0.15

-0.1

-0.05

0

0.05

0.1

0.15

0.2

0 1 2 3 4 5 6 7 8 9 10 11 12 13 14 15 16 17 18 19 20

Response of GDP to the shock of PIT

Quarters

Perc

ent

-0.08

-0.06

-0.04

-0.02

0

0.02

0.04

0.06

0 1 2 3 4 5 6 7 8 9 10 11 12 13 14 15 16 17 18 19 20

Response of GDP to the shock of VAT

Quarters

Perc

ent

Perc

ent

-0.2

-0.15

-0.1

-0.05

0

0.05

0.1

0.15

0 1 2 3 4 5 6 7 8 9 10 11 12 13 14 15 16 17 18 19 20

Response of GDP to the shock of social security contributions

Quarters

Perc

ent

-0.06

-0.05

-0.04

-0.03

-0.02

-0.01

0

0.01

0.02

0.03

0 1 2 3 4 5 6 7 8 9 10 11 12 13 14 15 16 17 18 19 20

Response of GDP to the shock of import customs

Quarters

Perc

ent

-0.05

0

0.05

0.1

0.15

0.2

0 1 2 3 4 5 6 7 8 9 10 11 12 13 14 15 16 17 18 19 20

Response of GDP to the shock of budget expendituresQuarters

Perc

ent

-0.04

-0.02

0

0.02

0.04

0.06

0.08

0 1 2 3 4 5 6 7 8 9 10 11 12 13 14 15 16 17 18 19 20

Response of GDP to the shock of budget expenditures on wagesQuarters

Perc

ent

-0.025

-0.02

-0.015

-0.01

-0.005

0

0.005

0.01

0.015

0.02

0 1 2 3 4 5 6 7 8 9 10 11 12 13 14 15 16 17 18 19 20

Response of GDP to the shock of transfers to the populationQuarters

Perc

ent

-0.08

-0.06

-0.04

-0.02

0

0.02

0.04

0.06

0.08

0.1

0.12

0 1 2 3 4 5 6 7 8 9 10 11 12 13 14 15 16 17 18 19 20

Response of GDP to the shock of expenditures on goods and servicesQuarters

Perc

ent

-0.02

-0.01

0

0.01

0.02

0.03

0.04

0.05

0 1 2 3 4 5 6 7 8 9 10 11 12 13 14 15 16 17 18 19 20

Response of GDP to the shock of capital expenditures

Quarters

Perc

ent

-0.12

-0.1

-0.08

-0.06

-0.04

-0.02

0

0.02

0.04

0 1 2 3 4 5 6 7 8 9 10 11 12 13 14 15 16 17 18 19 20

Response of GDP to the shock of pensions

Quarters

Perc

ent

-0.25

-0.2

-0.15

-0.1

-0.05

0

0.05

0.1

0.15

0.2

0 1 2 3 4 5 6 7 8 9 10 11 12 13 14 15 16 17 18 19 20

Response of CPI to the shock of taxes

Quarters

Perc

ent

-0.2

-0.15

-0.1

-0.05

0

0.05

0.1

0 1 2 3 4 5 6 7 8 9 10 11 12 13 14 15 16 17 18 19 20

Response of CPI to the shock of CIT

Quarters

Perc

ent

-0.08

-0.06

-0.04

-0.02

0

0.02

0.04

0.06

0 1 2 3 4 5 6 7 8 9 10 11 12 13 14 15 16 17 18 19 20

Response of CPI to the shock of social security contributionsQuarters

Perc

ent

Perc

ent

-0.08

-0.06

-0.04

-0.02

0

0.02

0.04

0.06

0.08

0 1 2 3 4 5 6 7 8 9 10 11 12 13 14 15 16 17 18 19 20

Response of CPI to the shock of capital expenditures Quarters

Perc

ent

-0.2

-0.1

0

0.1

0.2

0.3

0.4

0.5

0.6

0 1 2 3 4 5 6 7 8 9 10 11 12 13 14 15 16 17 18 19 20

Response of CPI to the shock of budget expenditures on wagesQuarters

Perc

ent

-1.5

-1

-0.5

0

0.5

1

0 1 2 3 4 5 6 7 8 9 10 11 12 13 14 15 16 17 18 19 20

Response of budget expenditures to the shock of CPIQuarters

Perc

ent

Perc

ent

Perc

ent

-2

-1.5

-1

-0.5

0

0.5

1

1.5

2

0 1 2 3 4 5 6 7 8 9 10 11 12 13 14 15 16 17 18 19 20

Response of budget expenditures to the shock of GDPQuarters

Perc

ent

-1

-0.5

0

0.5

1

1.5

0 1 2 3 4 5 6 7 8 9 10 11 12 13 14 15 16 17 18 19 20-0.8

-0.6

-0.4

-0.2

0

0.2

0.4

0.6

0 1 2 3 4 5 6 7 8 9 10 11 12 13 14 15 16 17 18 19 20

Response of taxes to the shock of GDP Response of taxes to the shock of CPIQuarters Quarters

Perc

ent

Perc

ent

Perc

ent

Perc

ent

Perc

ent

-0.6

-0.4

-0.2

0

0.2

0.4

0.6

0.8

1

0 1 2 3 4 5 6 7 8 9 10 11 12 13 14 15 16 17 18 19 20

Response of taxes to the shock of taxesQuarters

Perc

ent

Perc

ent

-0.5

-0.4

-0.3

-0.2

-0.1

0

0.1

0.2

0.3

0 1 2 3 4 5 6 7 8 9 10 11 12 13 14 15 16 17 18 19 20

Response of taxes to the shock of budget expendituresQuarters

Perc

ent

-0.25

-0.2

-0.15

-0.1

-0.05

0

0.05

0.1

0.15

0.2

0.25

0 1 2 3 4 5 6 7 8 9 10 11 12 13 14 15 16 17 18 19 20

Response of GDP to the shock of taxesQuarters

Perc

ent

-0.2

-0.15

-0.1

-0.05

0

0.05

0.1

0.15

0.2

0 1 2 3 4 5 6 7 8 9 10 11 12 13 14 15 16 17 18 19 20

Response of GDP to the shock of budget expendituresQuarters

Perc

ent

-0.15

-0.1

-0.05

0

0.05

0.1

0.15

0.2

-0.25

-0.2

-0.15

-0.1

-0.05

0

0.05

0.1

0.15

0.2

0 1 2 3 4 5 6 7 8 9 10 11 12 13 14 15 16 17 18 19 20 0 1 2 3 4 5 6 7 8 9 10 11 12 13 14 15 16 17 18 19 20

Response of CPI to the shock of budget expenditures Response of CPI to the shock of taxes

Quarters Quarters

Perc

ent

Perc

ent

-0.15

-0.1

-0.05

0

0.05

0.1

0.15

0 1 2 3 4 5 6 7 8 9 10 11 12 13 14 15 16 17 18 19 20

Response of CPI to the shock of import customs

Quarters

Perc

ent

-0.2

-0.1

0

0.1

0.2

0.3

0.4

0 1 2 3 4 5 6 7 8 9 10 11 12 13 14 15 16 17 18 19 20

Response of CPI to the shock of PIT

Quarters

Perc

ent

0.06

0.04

0.02

0

0.02

0.04

0.06

0.08

0 1 2 3 4 5 6 7 8 9 10 11 12 13 14 15 16 17 18 19 20

Response of CPI to the shock of VATQuarters

Perc

ent

Perc

ent

-0.1

-0.08

-0.06

-0.04

-0.02

0

0.02

0.04

0.06

0.08

0.1

0 1 2 3 4 5 6 7 8 9 10 11 12 13 14 15 16 17 18 19 20

Response of CPI to the shock of transfers to the populationQuarters

Perc

ent

-0.1

-0.08

-0.06

-0.04

-0.02

0

0.02

0.04

0.06

0 1 2 3 4 5 6 7 8 9 10 11 12 13 14 15 16 17 18 19 20

Response of CPI to the shock of pensionsQuarters

Perc

ent

-0.08

-0.06

-0.04

-0.02

Perc

ent

0

0.02

0.04

0.06

0.08

0.1

0.12

0 1 2 3 4 5 6 7 8 9 10 11 12 13 14 15 16 17 18 19 20

Response of GDP to the shock of expenditures on goods and servicesQuarters

Perc

ent

-0.15

-0.1

-0.05

0

0.05

0.1

0.15

0 1 2 3 4 5 6 7 8 9 10 11 12 13 14 15 16 17 18 19 20

Response of CPI to the shock of expenditures on goods and servicesQuarters

Perc

ent

-0.1

-0.05

0

0.05

0.1

0.15

0.2

0 1 2 3 4 5 6 7 8 9 10 11 12 13 14 15 16 17 18 19 20

0 1 2 3 4 5 6 7 8 9 10 11 12 13 14 15 16 17 18 19 20

Response of GDP to the shock of adjusted expenditures on goods and servicesQuarters

Perc

ent

-0.15

-0.1

-0.05

0

0.05

0.1

Response of CPI to the shock of adjustedon goods and servicesQuarters

39

A. Vdovychenko / Visnyk of the National Bank of Ukraine, No. 244, 2018, pp. 25–43

APPENDIX В

Figure В1. Impulse response functions of real GDP and inflation to shocks to different types of expenditures on goods and services

-0.15

-0.1

-0.05

0

0.05

0.1

0.15

0.2

-0.15

-0.1

-0.05

0

0.05

0.1

0.15

0 1 2 3 4 5 6 7 8 9 10 11 12 13 14 15 16 17 18 19 20 0 1 2 3 4 5 6 7 8 9 10 11 12 13 14 15 16 17 18 19 20

Response of CPI to the shock of budget expenditures Response of CPI to the shock of budget expenditures on goods and services

-

-0.15

-0.1

-0.05

0

0.05

0.1

-0.04

-0.02

0

0.02

0.04

0.06

0.08

0 1 2 3 4 5 6 7 8 9 10 11 12 13 14 15 16 17 18 19 20 0 1 2 3 4 5 6 7 8 9 10 11 12 13 14 15 16 17 18 19 20

Response of GDP to the shock of taxes Response of GDP to the shock of CIT

-0.6

-0.4

-0.2

0

0.2

0.4

0.6

0.8

1

0 1 2 3 4 5 6 7 8 9 10 11 12 13 14 15 16 17 18 19 20-0.8

-0.6

-0.4

-0.2

0

0.2

0.4

0.6

0 1 2 3 4 5 6 7 8 9 10 11 12 13 14 15 16 17 18 19 20

Response of budget expenditures to the shock of budget expenditures Response of budget expenditures to the shock of taxes

-0.8

-0.6

-0.4

-0.2

0

0.2

0.4

0.6

0.8

1

-0.4

-0.3

-0.2

-0.1

0

0.1

0.2

0.3

0.4

0 1 2 3 4 5 6 7 8 9 10 11 12 13 14 15 16 17 18 19 20 0 1 2 3 4 5 6 7 8 9 10 11 12 13 14 15 16 17 18 19 20

Response of GDP to the shock of GDP Response of GDP to the shock of CPI

-0.4

-0.3

-0.2

-0.1

0

0.1

0.2

0.3

0.4

-0.4

-0.2

0

0.2

0.4

0.6

0.8

1

0 1 2 3 4 5 6 7 8 9 10 11 12 13 14 15 16 17 18 19 20 0 1 2 3 4 5 6 7 8 9 10 11 12 13 14 15 16 17 18 19 20

Response of CPI to the shock of GDP Response of CPI to the shock of CPI

-0.2

0

0.2

0.4

0.6

0.8

1

1.2

0 1 2 3 4 5 6 7 8 9 10 11 12 13 14 15 16 17 18 19 20

Response of budget expenditures to the shock of budget expenditures

Perc

ent

Quarters

-0.2

-0.1

0

0.1

0.2

0.3

0.4

0.5

0 1 2 3 4 5 6 7 8 9 10 11 12 13 14 15 16 17 18 19 20

Response of budget expenditures to the shock of taxes

Perc

ent

Quarters Quarters Quarters

-0.2

-0.1

0

0.1

0.2

0.3

0.4

0.5

0 1 2 3 4 5 6 7 8 9 10 11 12 13 14 15 16 17 18 19 20

Response of taxes to the shock of budget expenditures

Perc

ent

Quarters

-0.05

0

0.05

0.1

0.15

0.2

0 1 2 3 4 5 6 7 8 9 10 11 12 13 14 15 16 17 18 19 20

Response of GDP to the shock of budget expenditures

Perc

ent

Quarters

Quarters Quarters Quarters Quarters

Quarters Quarters

Quarters Quarters

-0.4

-0.2

0

0.2

0.4

0.6

0.8

1

0 1 2 3 4 5 6 7 8 9 10 11 12 13 14 15 16 17 18 19 20

Response of taxes to the shock of taxes

Quarters

Perc

ent

-0.15

-0.1

-0.05

0

0.05

0.1

0 1 2 3 4 5 6 7 8 9 10 11 12 13 14 15 16 17 18 19 20

Response of GDP to the shock of taxes

Quarters

Perc

ent

-1

-0.5

0

0.5

1

1.5

2

0 1 2 3 4 5 6 7 8 9 10 11 12 13 14 15 16 17 18 19 20

Response of budget expenditures to the shock of GDPQuarters

Perc

ent

-1.5

-1

-0.5

0

0.5

1

1.5

0 1 2 3 4 5 6 7 8 9 10 11 12 13 14 15 16 17 18 19 20

Response of taxes to the shock of GDP

Quarters

Perc

ent

-0.6

-0.4

-0.2

0

0.2

0.4

0.6

0.8

1

0 1 2 3 4 5 6 7 8 9 10 11 12 13 14 15 16 17 18 19 20

Response of GDP to the shock of GDP

Quarters

Perc

ent

Perc

ent

-0.3

-0.25

-0.2

-0.15

-0.1

-0.05

0

0.05

0.1

0.15

0.2

0 1 2 3 4 5 6 7 8 9 10 11 12 13 14 15 16 17 18 19 20

Response of GDP to the shock of PIT

Quarters

Perc

ent

-0.08

-0.06

-0.04

-0.02

0

0.02

0.04

0.06

0 1 2 3 4 5 6 7 8 9 10 11 12 13 14 15 16 17 18 19 20

Response of GDP to the shock of VAT

Quarters

Perc

ent

Perc

ent

-0.2

-0.15

-0.1

-0.05

0

0.05

0.1

0.15

0 1 2 3 4 5 6 7 8 9 10 11 12 13 14 15 16 17 18 19 20

Response of GDP to the shock of social security contributions

Quarters

Perc

ent

-0.06

-0.05

-0.04

-0.03

-0.02

-0.01

0

0.01

0.02

0.03

0 1 2 3 4 5 6 7 8 9 10 11 12 13 14 15 16 17 18 19 20

Response of GDP to the shock of import customs

Quarters

Perc

ent

-0.05

0

0.05

0.1

0.15

0.2

0 1 2 3 4 5 6 7 8 9 10 11 12 13 14 15 16 17 18 19 20

Response of GDP to the shock of budget expendituresQuarters

Perc

ent

-0.04

-0.02

0

0.02

0.04

0.06

0.08

0 1 2 3 4 5 6 7 8 9 10 11 12 13 14 15 16 17 18 19 20

Response of GDP to the shock of budget expenditures on wagesQuarters

Perc

ent

-0.025

-0.02

-0.015

-0.01

-0.005

0

0.005

0.01

0.015

0.02

0 1 2 3 4 5 6 7 8 9 10 11 12 13 14 15 16 17 18 19 20

Response of GDP to the shock of transfers to the populationQuarters

Perc

ent

-0.08

-0.06

-0.04

-0.02

0

0.02

0.04

0.06

0.08

0.1

0.12

0 1 2 3 4 5 6 7 8 9 10 11 12 13 14 15 16 17 18 19 20

Response of GDP to the shock of expenditures on goods and servicesQuarters

Perc

ent

-0.02

-0.01

0

0.01

0.02

0.03

0.04

0.05

0 1 2 3 4 5 6 7 8 9 10 11 12 13 14 15 16 17 18 19 20

Response of GDP to the shock of capital expenditures

Quarters

Perc

ent

-0.12

-0.1

-0.08

-0.06

-0.04

-0.02

0

0.02

0.04

0 1 2 3 4 5 6 7 8 9 10 11 12 13 14 15 16 17 18 19 20

Response of GDP to the shock of pensions

Quarters

Perc

ent

-0.25

-0.2

-0.15

-0.1

-0.05

0

0.05

0.1

0.15

0.2

0 1 2 3 4 5 6 7 8 9 10 11 12 13 14 15 16 17 18 19 20

Response of CPI to the shock of taxes

Quarters

Perc

ent

-0.2

-0.15

-0.1

-0.05

0

0.05

0.1

0 1 2 3 4 5 6 7 8 9 10 11 12 13 14 15 16 17 18 19 20

Response of CPI to the shock of CIT

Quarters

Perc

ent

-0.08

-0.06

-0.04

-0.02

0

0.02

0.04

0.06

0 1 2 3 4 5 6 7 8 9 10 11 12 13 14 15 16 17 18 19 20

Response of CPI to the shock of social security contributionsQuarters

Perc

ent

Perc

ent

-0.08

-0.06

-0.04

-0.02

0

0.02

0.04

0.06

0.08

0 1 2 3 4 5 6 7 8 9 10 11 12 13 14 15 16 17 18 19 20

Response of CPI to the shock of capital expenditures Quarters

Perc

ent

-0.2

-0.1

0

0.1

0.2

0.3

0.4

0.5

0.6

0 1 2 3 4 5 6 7 8 9 10 11 12 13 14 15 16 17 18 19 20

Response of CPI to the shock of budget expenditures on wagesQuarters

Perc

ent

-1.5

-1

-0.5

0

0.5

1

0 1 2 3 4 5 6 7 8 9 10 11 12 13 14 15 16 17 18 19 20

Response of budget expenditures to the shock of CPIQuarters

Perc

ent

Perc

ent

Perc

ent

-2

-1.5

-1

-0.5

0

0.5

1

1.5

2

0 1 2 3 4 5 6 7 8 9 10 11 12 13 14 15 16 17 18 19 20

Response of budget expenditures to the shock of GDPQuarters

Perc

ent

-1

-0.5

0

0.5

1

1.5

0 1 2 3 4 5 6 7 8 9 10 11 12 13 14 15 16 17 18 19 20-0.8

-0.6

-0.4

-0.2

0

0.2

0.4

0.6

0 1 2 3 4 5 6 7 8 9 10 11 12 13 14 15 16 17 18 19 20

Response of taxes to the shock of GDP Response of taxes to the shock of CPIQuarters Quarters

Perc

ent

Perc

ent

Perc

ent

Perc

ent

Perc

ent

-0.6

-0.4

-0.2

0

0.2

0.4

0.6

0.8

1

0 1 2 3 4 5 6 7 8 9 10 11 12 13 14 15 16 17 18 19 20

Response of taxes to the shock of taxesQuarters

Perc

ent

Perc

ent

-0.5

-0.4

-0.3

-0.2

-0.1

0

0.1

0.2

0.3

0 1 2 3 4 5 6 7 8 9 10 11 12 13 14 15 16 17 18 19 20

Response of taxes to the shock of budget expendituresQuarters

Perc

ent

-0.25

-0.2

-0.15

-0.1

-0.05

0

0.05

0.1

0.15

0.2

0.25

0 1 2 3 4 5 6 7 8 9 10 11 12 13 14 15 16 17 18 19 20

Response of GDP to the shock of taxesQuarters

Perc

ent

-0.2

-0.15

-0.1

-0.05

0

0.05

0.1

0.15

0.2

0 1 2 3 4 5 6 7 8 9 10 11 12 13 14 15 16 17 18 19 20

Response of GDP to the shock of budget expendituresQuarters

Perc

ent

-0.15

-0.1

-0.05

0

0.05

0.1

0.15

0.2

-0.25

-0.2

-0.15

-0.1

-0.05

0

0.05

0.1

0.15

0.2

0 1 2 3 4 5 6 7 8 9 10 11 12 13 14 15 16 17 18 19 20 0 1 2 3 4 5 6 7 8 9 10 11 12 13 14 15 16 17 18 19 20

Response of CPI to the shock of budget expenditures Response of CPI to the shock of taxes

Quarters Quarters

Perc

ent

Perc

ent

-0.15

-0.1

-0.05

0

0.05

0.1

0.15

0 1 2 3 4 5 6 7 8 9 10 11 12 13 14 15 16 17 18 19 20

Response of CPI to the shock of import customs

Quarters

Perc

ent

-0.2

-0.1

0

0.1

0.2

0.3

0.4

0 1 2 3 4 5 6 7 8 9 10 11 12 13 14 15 16 17 18 19 20

Response of CPI to the shock of PIT

Quarters

Perc

ent

0.06

0.04

0.02

0

0.02

0.04

0.06

0.08

0 1 2 3 4 5 6 7 8 9 10 11 12 13 14 15 16 17 18 19 20

Response of CPI to the shock of VATQuarters

Perc

ent

Perc

ent

-0.1

-0.08

-0.06

-0.04

-0.02

0

0.02

0.04

0.06

0.08

0.1

0 1 2 3 4 5 6 7 8 9 10 11 12 13 14 15 16 17 18 19 20

Response of CPI to the shock of transfers to the populationQuarters

Perc

ent

-0.1

-0.08

-0.06

-0.04

-0.02

0

0.02

0.04

0.06

0 1 2 3 4 5 6 7 8 9 10 11 12 13 14 15 16 17 18 19 20

Response of CPI to the shock of pensionsQuarters

Perc

ent

-0.08

-0.06

-0.04

-0.02

Perc

ent

0

0.02

0.04

0.06

0.08

0.1

0.12

0 1 2 3 4 5 6 7 8 9 10 11 12 13 14 15 16 17 18 19 20

Response of GDP to the shock of expenditures on goods and servicesQuarters

Perc

ent

-0.15

-0.1

-0.05

0

0.05

0.1

0.15

0 1 2 3 4 5 6 7 8 9 10 11 12 13 14 15 16 17 18 19 20

Response of CPI to the shock of expenditures on goods and servicesQuarters

Perc

ent

-0.1

-0.05

0

0.05

0.1

0.15

0.2

0 1 2 3 4 5 6 7 8 9 10 11 12 13 14 15 16 17 18 19 20

0 1 2 3 4 5 6 7 8 9 10 11 12 13 14 15 16 17 18 19 20

Response of GDP to the shock of adjusted expenditures on goods and servicesQuarters

Perc

ent

-0.15

-0.1

-0.05

0

0.05

0.1

Response of CPI to the shock of adjustedon goods and servicesQuarters

40

A. Vdovychenko / Visnyk of the National Bank of Ukraine, No. 244, 2018, pp. 25–43

APPENDIX С

Table C1. Response of CPI to 1% shock to various categories of budget expenditures and taxes

Budget category16 Impact multiplierCumulative multiplier

after 8 quarters

The highest multiplier within 8- quarter period, absolute

values

The highest cumulative multiplier

within 8-quarter period, absolute

values

Gt 0.16* 0.13 0.16 (0)17 0.26 (1)

Tt 0.02* –0.12 0.06* (1) –0.23 (6)

Gtwage 0.45* 0.20 0.45 (0) 0.67 (1)

Gtg_cons 0.11* –0.10 0.12 (0) 0.13 (1)

Gtcap 0.01* –0.09 0.04 (1) –0.1 (7)

Gttransf –0.02* 0.05 –0.05 (2) 0.06 (7)

Gtpens 0.04* –0.01 0.05 (0) –0.11 (8)

Ttvat 0.03* 0.04 0.04* (1) 0.08 (3)

Ttcit –0.00* –0.14 –0.10* (2) –0.18 (5)

Ttpit 0.23* 0.74 0.25* (1) 0.78 (4)

Ttcust 0.02* –0.21 0.09* (1) 0.11 (1)

Ttsoc 0.05* –0.02 0.05* (0) 0.09 (3)

* Statistical significance on 95% confidence interval, Efron and Hall bootstrap percentile confidence intervals, 1,000 replications.

16 17

16 Gtwage – wages in the public sector, Gt

g_cons – expenditures on goods and services, Gtcap – capital expenditures, Gt

transf – current transfers to the population, Gt

pens – expenditures on pensions from the Pension Fund of Ukraine (PFU), Ttvat – VAT, Tt

cit – CIT, Ttpit – PIT, Tt

cust – import customs, Ttsoc – social security contributions.

17 In parentheses we report quarters.

41

A. Vdovychenko / Visnyk of the National Bank of Ukraine, No. 244, 2018, pp. 25–43

Figure C1. Impulse response functions to 1% shock in the model with inflation, %

-0.15

-0.1

-0.05

0

0.05

0.1

0.15

0.2

-0.15

-0.1

-0.05

0

0.05

0.1

0.15

0 1 2 3 4 5 6 7 8 9 10 11 12 13 14 15 16 17 18 19 20 0 1 2 3 4 5 6 7 8 9 10 11 12 13 14 15 16 17 18 19 20

Response of CPI to the shock of budget expenditures Response of CPI to the shock of budget expenditures on goods and services

-

-0.15

-0.1

-0.05

0

0.05

0.1

-0.04

-0.02

0

0.02

0.04

0.06

0.08

0 1 2 3 4 5 6 7 8 9 10 11 12 13 14 15 16 17 18 19 20 0 1 2 3 4 5 6 7 8 9 10 11 12 13 14 15 16 17 18 19 20

Response of GDP to the shock of taxes Response of GDP to the shock of CIT

-0.6

-0.4

-0.2

0

0.2

0.4

0.6

0.8

1

0 1 2 3 4 5 6 7 8 9 10 11 12 13 14 15 16 17 18 19 20-0.8

-0.6

-0.4

-0.2

0

0.2

0.4

0.6

0 1 2 3 4 5 6 7 8 9 10 11 12 13 14 15 16 17 18 19 20

Response of budget expenditures to the shock of budget expenditures Response of budget expenditures to the shock of taxes

-0.8

-0.6

-0.4

-0.2

0

0.2

0.4

0.6

0.8

1

-0.4

-0.3

-0.2

-0.1

0

0.1

0.2

0.3

0.4

0 1 2 3 4 5 6 7 8 9 10 11 12 13 14 15 16 17 18 19 20 0 1 2 3 4 5 6 7 8 9 10 11 12 13 14 15 16 17 18 19 20

Response of GDP to the shock of GDP Response of GDP to the shock of CPI

-0.4

-0.3

-0.2

-0.1

0

0.1

0.2

0.3

0.4

-0.4

-0.2

0

0.2

0.4

0.6

0.8

1

0 1 2 3 4 5 6 7 8 9 10 11 12 13 14 15 16 17 18 19 20 0 1 2 3 4 5 6 7 8 9 10 11 12 13 14 15 16 17 18 19 20

Response of CPI to the shock of GDP Response of CPI to the shock of CPI

-0.2

0

0.2

0.4

0.6

0.8

1

1.2

0 1 2 3 4 5 6 7 8 9 10 11 12 13 14 15 16 17 18 19 20

Response of budget expenditures to the shock of budget expenditures

Perc

ent

Quarters

-0.2

-0.1

0

0.1

0.2

0.3

0.4

0.5

0 1 2 3 4 5 6 7 8 9 10 11 12 13 14 15 16 17 18 19 20

Response of budget expenditures to the shock of taxes

Perc

ent

Quarters Quarters Quarters

-0.2

-0.1

0

0.1

0.2

0.3

0.4

0.5

0 1 2 3 4 5 6 7 8 9 10 11 12 13 14 15 16 17 18 19 20

Response of taxes to the shock of budget expenditures

Perc

ent

Quarters

-0.05

0

0.05

0.1

0.15

0.2

0 1 2 3 4 5 6 7 8 9 10 11 12 13 14 15 16 17 18 19 20

Response of GDP to the shock of budget expenditures

Perc

ent

Quarters

Quarters Quarters Quarters Quarters

Quarters Quarters

Quarters Quarters

-0.4

-0.2

0

0.2

0.4

0.6

0.8

1

0 1 2 3 4 5 6 7 8 9 10 11 12 13 14 15 16 17 18 19 20

Response of taxes to the shock of taxes

Quarters

Perc

ent

-0.15

-0.1

-0.05

0

0.05

0.1

0 1 2 3 4 5 6 7 8 9 10 11 12 13 14 15 16 17 18 19 20

Response of GDP to the shock of taxes

Quarters

Perc

ent

-1

-0.5

0

0.5

1

1.5

2

0 1 2 3 4 5 6 7 8 9 10 11 12 13 14 15 16 17 18 19 20

Response of budget expenditures to the shock of GDPQuarters

Perc

ent

-1.5

-1

-0.5

0

0.5

1

1.5

0 1 2 3 4 5 6 7 8 9 10 11 12 13 14 15 16 17 18 19 20

Response of taxes to the shock of GDP

Quarters

Perc

ent

-0.6

-0.4

-0.2

0

0.2

0.4

0.6

0.8

1

0 1 2 3 4 5 6 7 8 9 10 11 12 13 14 15 16 17 18 19 20

Response of GDP to the shock of GDP

Quarters

Perc

ent

Perc

ent

-0.3

-0.25

-0.2

-0.15

-0.1

-0.05

0

0.05

0.1

0.15

0.2

0 1 2 3 4 5 6 7 8 9 10 11 12 13 14 15 16 17 18 19 20

Response of GDP to the shock of PIT

Quarters

Perc

ent

-0.08

-0.06

-0.04

-0.02

0

0.02

0.04

0.06

0 1 2 3 4 5 6 7 8 9 10 11 12 13 14 15 16 17 18 19 20

Response of GDP to the shock of VAT

Quarters

Perc

ent

Perc

ent

-0.2

-0.15

-0.1

-0.05

0

0.05

0.1

0.15

0 1 2 3 4 5 6 7 8 9 10 11 12 13 14 15 16 17 18 19 20

Response of GDP to the shock of social security contributions

Quarters

Perc

ent

-0.06

-0.05

-0.04

-0.03

-0.02

-0.01

0

0.01

0.02

0.03

0 1 2 3 4 5 6 7 8 9 10 11 12 13 14 15 16 17 18 19 20

Response of GDP to the shock of import customs

Quarters

Perc

ent

-0.05

0

0.05

0.1

0.15

0.2

0 1 2 3 4 5 6 7 8 9 10 11 12 13 14 15 16 17 18 19 20

Response of GDP to the shock of budget expendituresQuarters

Perc

ent

-0.04

-0.02

0

0.02

0.04

0.06

0.08

0 1 2 3 4 5 6 7 8 9 10 11 12 13 14 15 16 17 18 19 20

Response of GDP to the shock of budget expenditures on wagesQuarters

Perc

ent

-0.025

-0.02

-0.015

-0.01

-0.005

0

0.005

0.01

0.015

0.02

0 1 2 3 4 5 6 7 8 9 10 11 12 13 14 15 16 17 18 19 20

Response of GDP to the shock of transfers to the populationQuarters

Perc

ent

-0.08

-0.06

-0.04

-0.02

0

0.02

0.04

0.06

0.08

0.1

0.12

0 1 2 3 4 5 6 7 8 9 10 11 12 13 14 15 16 17 18 19 20

Response of GDP to the shock of expenditures on goods and servicesQuarters

Perc

ent

-0.02

-0.01

0

0.01

0.02

0.03

0.04

0.05

0 1 2 3 4 5 6 7 8 9 10 11 12 13 14 15 16 17 18 19 20

Response of GDP to the shock of capital expenditures

Quarters

Perc

ent

-0.12

-0.1

-0.08

-0.06

-0.04

-0.02

0

0.02

0.04

0 1 2 3 4 5 6 7 8 9 10 11 12 13 14 15 16 17 18 19 20

Response of GDP to the shock of pensions

Quarters

Perc

ent

-0.25

-0.2

-0.15

-0.1

-0.05

0

0.05

0.1

0.15

0.2

0 1 2 3 4 5 6 7 8 9 10 11 12 13 14 15 16 17 18 19 20

Response of CPI to the shock of taxes

Quarters

Perc

ent

-0.2

-0.15

-0.1

-0.05

0

0.05

0.1

0 1 2 3 4 5 6 7 8 9 10 11 12 13 14 15 16 17 18 19 20

Response of CPI to the shock of CIT

Quarters

Perc

ent

-0.08

-0.06

-0.04

-0.02

0

0.02

0.04

0.06

0 1 2 3 4 5 6 7 8 9 10 11 12 13 14 15 16 17 18 19 20

Response of CPI to the shock of social security contributionsQuarters

Perc

ent

Perc

ent

-0.08

-0.06

-0.04

-0.02

0

0.02

0.04

0.06

0.08

0 1 2 3 4 5 6 7 8 9 10 11 12 13 14 15 16 17 18 19 20

Response of CPI to the shock of capital expenditures Quarters

Perc

ent

-0.2

-0.1

0

0.1

0.2

0.3

0.4

0.5

0.6

0 1 2 3 4 5 6 7 8 9 10 11 12 13 14 15 16 17 18 19 20

Response of CPI to the shock of budget expenditures on wagesQuarters

Perc

ent

-1.5

-1

-0.5

0

0.5

1

0 1 2 3 4 5 6 7 8 9 10 11 12 13 14 15 16 17 18 19 20

Response of budget expenditures to the shock of CPIQuarters

Perc

ent

Perc

ent

Perc

ent

-2

-1.5

-1

-0.5

0

0.5

1

1.5

2

0 1 2 3 4 5 6 7 8 9 10 11 12 13 14 15 16 17 18 19 20

Response of budget expenditures to the shock of GDPQuarters

Perc

ent

-1

-0.5

0

0.5

1

1.5

0 1 2 3 4 5 6 7 8 9 10 11 12 13 14 15 16 17 18 19 20-0.8

-0.6

-0.4

-0.2

0

0.2

0.4

0.6

0 1 2 3 4 5 6 7 8 9 10 11 12 13 14 15 16 17 18 19 20

Response of taxes to the shock of GDP Response of taxes to the shock of CPIQuarters Quarters

Perc

ent

Perc

ent

Perc

ent

Perc

ent

Perc

ent

-0.6

-0.4

-0.2

0

0.2

0.4

0.6

0.8

1

0 1 2 3 4 5 6 7 8 9 10 11 12 13 14 15 16 17 18 19 20

Response of taxes to the shock of taxesQuarters

Perc

ent

Perc

ent

-0.5

-0.4

-0.3

-0.2

-0.1

0

0.1

0.2

0.3

0 1 2 3 4 5 6 7 8 9 10 11 12 13 14 15 16 17 18 19 20

Response of taxes to the shock of budget expendituresQuarters

Perc

ent

-0.25

-0.2

-0.15

-0.1

-0.05

0

0.05

0.1

0.15

0.2

0.25

0 1 2 3 4 5 6 7 8 9 10 11 12 13 14 15 16 17 18 19 20

Response of GDP to the shock of taxesQuarters

Perc

ent

-0.2

-0.15

-0.1

-0.05

0

0.05

0.1

0.15

0.2

0 1 2 3 4 5 6 7 8 9 10 11 12 13 14 15 16 17 18 19 20

Response of GDP to the shock of budget expendituresQuarters

Perc

ent

-0.15

-0.1

-0.05

0

0.05

0.1

0.15

0.2

-0.25

-0.2

-0.15

-0.1

-0.05

0

0.05

0.1

0.15

0.2

0 1 2 3 4 5 6 7 8 9 10 11 12 13 14 15 16 17 18 19 20 0 1 2 3 4 5 6 7 8 9 10 11 12 13 14 15 16 17 18 19 20

Response of CPI to the shock of budget expenditures Response of CPI to the shock of taxes

Quarters Quarters

Perc

ent

Perc

ent

-0.15

-0.1

-0.05

0

0.05

0.1

0.15

0 1 2 3 4 5 6 7 8 9 10 11 12 13 14 15 16 17 18 19 20

Response of CPI to the shock of import customs

Quarters

Perc

ent

-0.2

-0.1

0

0.1

0.2

0.3

0.4

0 1 2 3 4 5 6 7 8 9 10 11 12 13 14 15 16 17 18 19 20

Response of CPI to the shock of PIT

Quarters

Perc

ent

0.06

0.04

0.02

0

0.02

0.04

0.06

0.08

0 1 2 3 4 5 6 7 8 9 10 11 12 13 14 15 16 17 18 19 20

Response of CPI to the shock of VATQuarters

Perc

ent

Perc

ent

-0.1

-0.08

-0.06

-0.04

-0.02

0

0.02

0.04

0.06

0.08

0.1

0 1 2 3 4 5 6 7 8 9 10 11 12 13 14 15 16 17 18 19 20

Response of CPI to the shock of transfers to the populationQuarters

Perc

ent

-0.1

-0.08

-0.06

-0.04

-0.02

0

0.02

0.04

0.06

0 1 2 3 4 5 6 7 8 9 10 11 12 13 14 15 16 17 18 19 20

Response of CPI to the shock of pensionsQuarters

Perc

ent

-0.08

-0.06

-0.04

-0.02

Perc

ent

0

0.02

0.04

0.06

0.08

0.1

0.12

0 1 2 3 4 5 6 7 8 9 10 11 12 13 14 15 16 17 18 19 20

Response of GDP to the shock of expenditures on goods and servicesQuarters

Perc

ent

-0.15

-0.1

-0.05

0

0.05

0.1

0.15

0 1 2 3 4 5 6 7 8 9 10 11 12 13 14 15 16 17 18 19 20

Response of CPI to the shock of expenditures on goods and servicesQuarters

Perc

ent

-0.1

-0.05

0

0.05

0.1

0.15

0.2

0 1 2 3 4 5 6 7 8 9 10 11 12 13 14 15 16 17 18 19 20

0 1 2 3 4 5 6 7 8 9 10 11 12 13 14 15 16 17 18 19 20

Response of GDP to the shock of adjusted expenditures on goods and servicesQuarters

Perc

ent

-0.15

-0.1

-0.05

0

0.05

0.1

Response of CPI to the shock of adjustedon goods and servicesQuarters

42

A. Vdovychenko / Visnyk of the National Bank of Ukraine, No. 244, 2018, pp. 25–43

Figure C2. Impulse response functions of inflation to 1% shock to various budget expenditures, %

-0.15

-0.1

-0.05

0

0.05

0.1

0.15

0.2

-0.15

-0.1

-0.05

0

0.05

0.1

0.15

0 1 2 3 4 5 6 7 8 9 10 11 12 13 14 15 16 17 18 19 20 0 1 2 3 4 5 6 7 8 9 10 11 12 13 14 15 16 17 18 19 20

Response of CPI to the shock of budget expenditures Response of CPI to the shock of budget expenditures on goods and services

-

-0.15

-0.1

-0.05

0

0.05

0.1

-0.04

-0.02

0

0.02

0.04

0.06

0.08

0 1 2 3 4 5 6 7 8 9 10 11 12 13 14 15 16 17 18 19 20 0 1 2 3 4 5 6 7 8 9 10 11 12 13 14 15 16 17 18 19 20

Response of GDP to the shock of taxes Response of GDP to the shock of CIT

-0.6

-0.4

-0.2

0

0.2

0.4

0.6

0.8

1

0 1 2 3 4 5 6 7 8 9 10 11 12 13 14 15 16 17 18 19 20-0.8

-0.6

-0.4

-0.2

0

0.2

0.4

0.6

0 1 2 3 4 5 6 7 8 9 10 11 12 13 14 15 16 17 18 19 20

Response of budget expenditures to the shock of budget expenditures Response of budget expenditures to the shock of taxes

-0.8

-0.6

-0.4

-0.2

0

0.2

0.4

0.6

0.8

1

-0.4

-0.3

-0.2

-0.1

0

0.1

0.2

0.3

0.4

0 1 2 3 4 5 6 7 8 9 10 11 12 13 14 15 16 17 18 19 20 0 1 2 3 4 5 6 7 8 9 10 11 12 13 14 15 16 17 18 19 20

Response of GDP to the shock of GDP Response of GDP to the shock of CPI

-0.4

-0.3

-0.2

-0.1

0

0.1

0.2

0.3

0.4

-0.4

-0.2

0

0.2

0.4

0.6

0.8

1

0 1 2 3 4 5 6 7 8 9 10 11 12 13 14 15 16 17 18 19 20 0 1 2 3 4 5 6 7 8 9 10 11 12 13 14 15 16 17 18 19 20

Response of CPI to the shock of GDP Response of CPI to the shock of CPI

-0.2

0

0.2

0.4

0.6

0.8

1

1.2

0 1 2 3 4 5 6 7 8 9 10 11 12 13 14 15 16 17 18 19 20

Response of budget expenditures to the shock of budget expenditures

Perc

ent

Quarters

-0.2

-0.1

0

0.1

0.2

0.3

0.4

0.5

0 1 2 3 4 5 6 7 8 9 10 11 12 13 14 15 16 17 18 19 20

Response of budget expenditures to the shock of taxes

Perc

ent

Quarters Quarters Quarters

-0.2

-0.1

0

0.1

0.2

0.3

0.4

0.5

0 1 2 3 4 5 6 7 8 9 10 11 12 13 14 15 16 17 18 19 20

Response of taxes to the shock of budget expenditures

Perc

ent

Quarters

-0.05

0

0.05

0.1

0.15

0.2

0 1 2 3 4 5 6 7 8 9 10 11 12 13 14 15 16 17 18 19 20

Response of GDP to the shock of budget expenditures

Perc

ent

Quarters

Quarters Quarters Quarters Quarters

Quarters Quarters

Quarters Quarters

-0.4

-0.2

0

0.2

0.4

0.6

0.8

1

0 1 2 3 4 5 6 7 8 9 10 11 12 13 14 15 16 17 18 19 20

Response of taxes to the shock of taxes

Quarters

Perc

ent

-0.15

-0.1

-0.05

0

0.05

0.1

0 1 2 3 4 5 6 7 8 9 10 11 12 13 14 15 16 17 18 19 20

Response of GDP to the shock of taxes

Quarters

Perc

ent

-1

-0.5

0

0.5

1

1.5

2

0 1 2 3 4 5 6 7 8 9 10 11 12 13 14 15 16 17 18 19 20

Response of budget expenditures to the shock of GDPQuarters

Perc

ent

-1.5

-1

-0.5

0

0.5

1

1.5

0 1 2 3 4 5 6 7 8 9 10 11 12 13 14 15 16 17 18 19 20

Response of taxes to the shock of GDP

Quarters

Perc

ent

-0.6

-0.4

-0.2

0

0.2

0.4

0.6

0.8

1

0 1 2 3 4 5 6 7 8 9 10 11 12 13 14 15 16 17 18 19 20

Response of GDP to the shock of GDP

Quarters

Perc

ent

Perc

ent

-0.3

-0.25

-0.2

-0.15

-0.1

-0.05

0

0.05

0.1

0.15

0.2

0 1 2 3 4 5 6 7 8 9 10 11 12 13 14 15 16 17 18 19 20

Response of GDP to the shock of PIT

Quarters

Perc

ent

-0.08

-0.06

-0.04

-0.02

0

0.02

0.04

0.06

0 1 2 3 4 5 6 7 8 9 10 11 12 13 14 15 16 17 18 19 20

Response of GDP to the shock of VAT

Quarters

Perc

ent

Perc

ent

-0.2

-0.15

-0.1

-0.05

0

0.05

0.1

0.15

0 1 2 3 4 5 6 7 8 9 10 11 12 13 14 15 16 17 18 19 20

Response of GDP to the shock of social security contributions

Quarters

Perc

ent

-0.06

-0.05

-0.04

-0.03

-0.02

-0.01

0

0.01

0.02

0.03

0 1 2 3 4 5 6 7 8 9 10 11 12 13 14 15 16 17 18 19 20

Response of GDP to the shock of import customs

Quarters

Perc

ent

-0.05

0

0.05

0.1

0.15

0.2

0 1 2 3 4 5 6 7 8 9 10 11 12 13 14 15 16 17 18 19 20

Response of GDP to the shock of budget expendituresQuarters

Perc

ent

-0.04

-0.02

0

0.02

0.04

0.06

0.08

0 1 2 3 4 5 6 7 8 9 10 11 12 13 14 15 16 17 18 19 20

Response of GDP to the shock of budget expenditures on wagesQuarters

Perc

ent

-0.025

-0.02

-0.015

-0.01

-0.005

0

0.005

0.01

0.015

0.02

0 1 2 3 4 5 6 7 8 9 10 11 12 13 14 15 16 17 18 19 20

Response of GDP to the shock of transfers to the populationQuarters

Perc

ent

-0.08

-0.06

-0.04

-0.02

0

0.02

0.04

0.06

0.08

0.1

0.12

0 1 2 3 4 5 6 7 8 9 10 11 12 13 14 15 16 17 18 19 20

Response of GDP to the shock of expenditures on goods and servicesQuarters

Perc

ent

-0.02

-0.01

0

0.01

0.02

0.03

0.04

0.05

0 1 2 3 4 5 6 7 8 9 10 11 12 13 14 15 16 17 18 19 20

Response of GDP to the shock of capital expenditures

Quarters

Perc

ent

-0.12

-0.1

-0.08

-0.06

-0.04

-0.02

0

0.02

0.04

0 1 2 3 4 5 6 7 8 9 10 11 12 13 14 15 16 17 18 19 20

Response of GDP to the shock of pensions

Quarters

Perc

ent

-0.25

-0.2

-0.15

-0.1

-0.05

0

0.05

0.1

0.15

0.2

0 1 2 3 4 5 6 7 8 9 10 11 12 13 14 15 16 17 18 19 20

Response of CPI to the shock of taxes

Quarters

Perc

ent

-0.2

-0.15

-0.1

-0.05

0

0.05

0.1

0 1 2 3 4 5 6 7 8 9 10 11 12 13 14 15 16 17 18 19 20

Response of CPI to the shock of CIT

Quarters

Perc

ent

-0.08

-0.06

-0.04

-0.02

0

0.02

0.04

0.06

0 1 2 3 4 5 6 7 8 9 10 11 12 13 14 15 16 17 18 19 20

Response of CPI to the shock of social security contributionsQuarters

Perc

ent

Perc

ent

-0.08

-0.06

-0.04

-0.02

0

0.02

0.04

0.06

0.08

0 1 2 3 4 5 6 7 8 9 10 11 12 13 14 15 16 17 18 19 20

Response of CPI to the shock of capital expenditures Quarters

Perc

ent

-0.2

-0.1

0

0.1

0.2

0.3

0.4

0.5

0.6

0 1 2 3 4 5 6 7 8 9 10 11 12 13 14 15 16 17 18 19 20

Response of CPI to the shock of budget expenditures on wagesQuarters

Perc

ent

-1.5

-1

-0.5

0

0.5

1

0 1 2 3 4 5 6 7 8 9 10 11 12 13 14 15 16 17 18 19 20

Response of budget expenditures to the shock of CPIQuarters

Perc

ent

Perc

ent

Perc

ent

-2

-1.5

-1

-0.5

0

0.5

1

1.5

2

0 1 2 3 4 5 6 7 8 9 10 11 12 13 14 15 16 17 18 19 20

Response of budget expenditures to the shock of GDPQuarters

Perc

ent

-1

-0.5

0

0.5

1

1.5

0 1 2 3 4 5 6 7 8 9 10 11 12 13 14 15 16 17 18 19 20-0.8

-0.6

-0.4

-0.2

0

0.2

0.4

0.6

0 1 2 3 4 5 6 7 8 9 10 11 12 13 14 15 16 17 18 19 20

Response of taxes to the shock of GDP Response of taxes to the shock of CPIQuarters Quarters

Perc

ent

Perc

ent

Perc

ent

Perc

ent

Perc

ent

-0.6

-0.4

-0.2

0

0.2

0.4

0.6

0.8

1

0 1 2 3 4 5 6 7 8 9 10 11 12 13 14 15 16 17 18 19 20

Response of taxes to the shock of taxesQuarters

Perc

ent

Perc

ent

-0.5

-0.4

-0.3

-0.2

-0.1

0

0.1

0.2

0.3

0 1 2 3 4 5 6 7 8 9 10 11 12 13 14 15 16 17 18 19 20

Response of taxes to the shock of budget expendituresQuarters

Perc

ent

-0.25

-0.2

-0.15

-0.1

-0.05

0

0.05

0.1

0.15

0.2

0.25

0 1 2 3 4 5 6 7 8 9 10 11 12 13 14 15 16 17 18 19 20

Response of GDP to the shock of taxesQuarters

Perc

ent

-0.2

-0.15

-0.1

-0.05

0

0.05

0.1

0.15

0.2

0 1 2 3 4 5 6 7 8 9 10 11 12 13 14 15 16 17 18 19 20

Response of GDP to the shock of budget expendituresQuarters

Perc

ent

-0.15

-0.1

-0.05

0

0.05

0.1

0.15

0.2

-0.25

-0.2

-0.15

-0.1

-0.05

0

0.05

0.1

0.15

0.2

0 1 2 3 4 5 6 7 8 9 10 11 12 13 14 15 16 17 18 19 20 0 1 2 3 4 5 6 7 8 9 10 11 12 13 14 15 16 17 18 19 20

Response of CPI to the shock of budget expenditures Response of CPI to the shock of taxes

Quarters Quarters

Perc

ent

Perc

ent

-0.15

-0.1

-0.05

0

0.05

0.1

0.15

0 1 2 3 4 5 6 7 8 9 10 11 12 13 14 15 16 17 18 19 20

Response of CPI to the shock of import customs

Quarters

Perc

ent

-0.2

-0.1

0

0.1

0.2

0.3

0.4

0 1 2 3 4 5 6 7 8 9 10 11 12 13 14 15 16 17 18 19 20

Response of CPI to the shock of PIT

Quarters

Perc

ent

0.06

0.04

0.02

0

0.02

0.04

0.06

0.08

0 1 2 3 4 5 6 7 8 9 10 11 12 13 14 15 16 17 18 19 20

Response of CPI to the shock of VATQuarters

Perc

ent

Perc

ent

-0.1

-0.08

-0.06

-0.04

-0.02

0

0.02

0.04

0.06

0.08

0.1

0 1 2 3 4 5 6 7 8 9 10 11 12 13 14 15 16 17 18 19 20

Response of CPI to the shock of transfers to the populationQuarters

Perc

ent

-0.1

-0.08

-0.06

-0.04

-0.02

0

0.02

0.04

0.06

0 1 2 3 4 5 6 7 8 9 10 11 12 13 14 15 16 17 18 19 20

Response of CPI to the shock of pensionsQuarters

Perc

ent

-0.08

-0.06

-0.04

-0.02

Perc

ent

0

0.02

0.04

0.06

0.08

0.1

0.12

0 1 2 3 4 5 6 7 8 9 10 11 12 13 14 15 16 17 18 19 20

Response of GDP to the shock of expenditures on goods and servicesQuarters

Perc

ent

-0.15

-0.1

-0.05

0

0.05

0.1

0.15

0 1 2 3 4 5 6 7 8 9 10 11 12 13 14 15 16 17 18 19 20

Response of CPI to the shock of expenditures on goods and servicesQuarters

Perc

ent

-0.1

-0.05

0

0.05

0.1

0.15

0.2

0 1 2 3 4 5 6 7 8 9 10 11 12 13 14 15 16 17 18 19 20

0 1 2 3 4 5 6 7 8 9 10 11 12 13 14 15 16 17 18 19 20

Response of GDP to the shock of adjusted expenditures on goods and servicesQuarters

Perc

ent

-0.15

-0.1

-0.05

0

0.05

0.1

Response of CPI to the shock of adjustedon goods and servicesQuarters

43

A. Vdovychenko / Visnyk of the National Bank of Ukraine, No. 244, 2018, pp. 25–43

Figure C3. Impulse response functions of inflation to 1% shock to various taxes, %

-0.15

-0.1

-0.05

0

0.05

0.1

0.15

0.2

-0.15

-0.1

-0.05

0

0.05

0.1

0.15

0 1 2 3 4 5 6 7 8 9 10 11 12 13 14 15 16 17 18 19 20 0 1 2 3 4 5 6 7 8 9 10 11 12 13 14 15 16 17 18 19 20

Response of CPI to the shock of budget expenditures Response of CPI to the shock of budget expenditures on goods and services

-

-0.15

-0.1

-0.05

0

0.05

0.1

-0.04

-0.02

0

0.02

0.04

0.06

0.08

0 1 2 3 4 5 6 7 8 9 10 11 12 13 14 15 16 17 18 19 20 0 1 2 3 4 5 6 7 8 9 10 11 12 13 14 15 16 17 18 19 20

Response of GDP to the shock of taxes Response of GDP to the shock of CIT

-0.6

-0.4

-0.2

0

0.2

0.4

0.6

0.8

1

0 1 2 3 4 5 6 7 8 9 10 11 12 13 14 15 16 17 18 19 20-0.8

-0.6

-0.4

-0.2

0

0.2

0.4

0.6

0 1 2 3 4 5 6 7 8 9 10 11 12 13 14 15 16 17 18 19 20

Response of budget expenditures to the shock of budget expenditures Response of budget expenditures to the shock of taxes

-0.8

-0.6

-0.4

-0.2

0

0.2

0.4

0.6

0.8

1

-0.4

-0.3

-0.2

-0.1

0

0.1

0.2

0.3

0.4

0 1 2 3 4 5 6 7 8 9 10 11 12 13 14 15 16 17 18 19 20 0 1 2 3 4 5 6 7 8 9 10 11 12 13 14 15 16 17 18 19 20

Response of GDP to the shock of GDP Response of GDP to the shock of CPI

-0.4

-0.3

-0.2

-0.1

0

0.1

0.2

0.3

0.4

-0.4

-0.2

0

0.2

0.4

0.6

0.8

1

0 1 2 3 4 5 6 7 8 9 10 11 12 13 14 15 16 17 18 19 20 0 1 2 3 4 5 6 7 8 9 10 11 12 13 14 15 16 17 18 19 20

Response of CPI to the shock of GDP Response of CPI to the shock of CPI

-0.2

0

0.2

0.4

0.6

0.8

1

1.2

0 1 2 3 4 5 6 7 8 9 10 11 12 13 14 15 16 17 18 19 20

Response of budget expenditures to the shock of budget expenditures

Perc

ent

Quarters

-0.2

-0.1

0

0.1

0.2

0.3

0.4

0.5

0 1 2 3 4 5 6 7 8 9 10 11 12 13 14 15 16 17 18 19 20

Response of budget expenditures to the shock of taxes

Perc

ent

Quarters Quarters Quarters

-0.2

-0.1

0

0.1

0.2

0.3

0.4

0.5

0 1 2 3 4 5 6 7 8 9 10 11 12 13 14 15 16 17 18 19 20

Response of taxes to the shock of budget expenditures

Perc

ent

Quarters

-0.05

0

0.05

0.1

0.15

0.2

0 1 2 3 4 5 6 7 8 9 10 11 12 13 14 15 16 17 18 19 20

Response of GDP to the shock of budget expenditures

Perc

ent

Quarters

Quarters Quarters Quarters Quarters

Quarters Quarters

Quarters Quarters

-0.4

-0.2

0

0.2

0.4

0.6

0.8

1

0 1 2 3 4 5 6 7 8 9 10 11 12 13 14 15 16 17 18 19 20

Response of taxes to the shock of taxes

Quarters

Perc

ent

-0.15

-0.1

-0.05

0

0.05

0.1

0 1 2 3 4 5 6 7 8 9 10 11 12 13 14 15 16 17 18 19 20

Response of GDP to the shock of taxes

Quarters

Perc

ent

-1

-0.5

0

0.5

1

1.5

2

0 1 2 3 4 5 6 7 8 9 10 11 12 13 14 15 16 17 18 19 20

Response of budget expenditures to the shock of GDPQuarters

Perc

ent

-1.5

-1

-0.5

0

0.5

1

1.5

0 1 2 3 4 5 6 7 8 9 10 11 12 13 14 15 16 17 18 19 20

Response of taxes to the shock of GDP

Quarters

Perc

ent

-0.6

-0.4

-0.2

0

0.2

0.4

0.6

0.8

1

0 1 2 3 4 5 6 7 8 9 10 11 12 13 14 15 16 17 18 19 20

Response of GDP to the shock of GDP

Quarters

Perc

ent

Perc

ent

-0.3

-0.25

-0.2

-0.15

-0.1

-0.05

0

0.05

0.1

0.15

0.2

0 1 2 3 4 5 6 7 8 9 10 11 12 13 14 15 16 17 18 19 20

Response of GDP to the shock of PIT

Quarters

Perc

ent

-0.08

-0.06

-0.04

-0.02

0

0.02

0.04

0.06

0 1 2 3 4 5 6 7 8 9 10 11 12 13 14 15 16 17 18 19 20

Response of GDP to the shock of VAT

Quarters

Perc

ent

Perc

ent

-0.2

-0.15

-0.1

-0.05

0

0.05

0.1

0.15

0 1 2 3 4 5 6 7 8 9 10 11 12 13 14 15 16 17 18 19 20

Response of GDP to the shock of social security contributions

Quarters

Perc

ent

-0.06

-0.05

-0.04

-0.03

-0.02

-0.01

0

0.01

0.02

0.03

0 1 2 3 4 5 6 7 8 9 10 11 12 13 14 15 16 17 18 19 20

Response of GDP to the shock of import customs

Quarters

Perc

ent

-0.05

0

0.05

0.1

0.15

0.2

0 1 2 3 4 5 6 7 8 9 10 11 12 13 14 15 16 17 18 19 20

Response of GDP to the shock of budget expendituresQuarters

Perc

ent

-0.04

-0.02

0

0.02

0.04

0.06

0.08

0 1 2 3 4 5 6 7 8 9 10 11 12 13 14 15 16 17 18 19 20

Response of GDP to the shock of budget expenditures on wagesQuarters

Perc

ent

-0.025

-0.02

-0.015

-0.01

-0.005

0

0.005

0.01

0.015

0.02

0 1 2 3 4 5 6 7 8 9 10 11 12 13 14 15 16 17 18 19 20

Response of GDP to the shock of transfers to the populationQuarters

Perc

ent

-0.08

-0.06

-0.04

-0.02

0

0.02

0.04

0.06

0.08

0.1

0.12

0 1 2 3 4 5 6 7 8 9 10 11 12 13 14 15 16 17 18 19 20

Response of GDP to the shock of expenditures on goods and servicesQuarters

Perc

ent

-0.02

-0.01

0

0.01

0.02

0.03

0.04

0.05

0 1 2 3 4 5 6 7 8 9 10 11 12 13 14 15 16 17 18 19 20

Response of GDP to the shock of capital expenditures

Quarters

Perc

ent

-0.12

-0.1

-0.08

-0.06

-0.04

-0.02

0

0.02

0.04

0 1 2 3 4 5 6 7 8 9 10 11 12 13 14 15 16 17 18 19 20

Response of GDP to the shock of pensions

Quarters

Perc

ent

-0.25

-0.2

-0.15

-0.1

-0.05

0

0.05

0.1

0.15

0.2

0 1 2 3 4 5 6 7 8 9 10 11 12 13 14 15 16 17 18 19 20

Response of CPI to the shock of taxes

Quarters

Perc

ent

-0.2

-0.15

-0.1

-0.05

0

0.05

0.1

0 1 2 3 4 5 6 7 8 9 10 11 12 13 14 15 16 17 18 19 20

Response of CPI to the shock of CIT

Quarters

Perc

ent

-0.08

-0.06

-0.04

-0.02

0

0.02

0.04

0.06

0 1 2 3 4 5 6 7 8 9 10 11 12 13 14 15 16 17 18 19 20

Response of CPI to the shock of social security contributionsQuarters

Perc

ent

Perc

ent

-0.08

-0.06

-0.04

-0.02

0

0.02

0.04

0.06

0.08

0 1 2 3 4 5 6 7 8 9 10 11 12 13 14 15 16 17 18 19 20

Response of CPI to the shock of capital expenditures Quarters

Perc

ent

-0.2

-0.1

0

0.1

0.2

0.3

0.4

0.5

0.6

0 1 2 3 4 5 6 7 8 9 10 11 12 13 14 15 16 17 18 19 20

Response of CPI to the shock of budget expenditures on wagesQuarters

Perc

ent

-1.5

-1

-0.5

0

0.5

1

0 1 2 3 4 5 6 7 8 9 10 11 12 13 14 15 16 17 18 19 20

Response of budget expenditures to the shock of CPIQuarters

Perc

ent

Perc

ent

Perc

ent

-2

-1.5

-1

-0.5

0

0.5

1

1.5

2

0 1 2 3 4 5 6 7 8 9 10 11 12 13 14 15 16 17 18 19 20

Response of budget expenditures to the shock of GDPQuarters

Perc

ent

-1

-0.5

0

0.5

1

1.5

0 1 2 3 4 5 6 7 8 9 10 11 12 13 14 15 16 17 18 19 20-0.8

-0.6

-0.4

-0.2

0

0.2

0.4

0.6

0 1 2 3 4 5 6 7 8 9 10 11 12 13 14 15 16 17 18 19 20

Response of taxes to the shock of GDP Response of taxes to the shock of CPIQuarters Quarters

Perc

ent

Perc

ent

Perc

ent

Perc

ent

Perc

ent

-0.6

-0.4

-0.2

0

0.2

0.4

0.6

0.8

1

0 1 2 3 4 5 6 7 8 9 10 11 12 13 14 15 16 17 18 19 20

Response of taxes to the shock of taxesQuarters

Perc

ent

Perc

ent

-0.5

-0.4

-0.3

-0.2

-0.1

0

0.1

0.2

0.3

0 1 2 3 4 5 6 7 8 9 10 11 12 13 14 15 16 17 18 19 20

Response of taxes to the shock of budget expendituresQuarters

Perc

ent

-0.25

-0.2

-0.15

-0.1

-0.05

0

0.05

0.1

0.15

0.2

0.25

0 1 2 3 4 5 6 7 8 9 10 11 12 13 14 15 16 17 18 19 20

Response of GDP to the shock of taxesQuarters

Perc

ent

-0.2

-0.15

-0.1

-0.05

0

0.05

0.1

0.15

0.2

0 1 2 3 4 5 6 7 8 9 10 11 12 13 14 15 16 17 18 19 20

Response of GDP to the shock of budget expendituresQuarters

Perc

ent

-0.15

-0.1

-0.05

0

0.05

0.1

0.15

0.2

-0.25

-0.2

-0.15

-0.1

-0.05

0

0.05

0.1

0.15

0.2

0 1 2 3 4 5 6 7 8 9 10 11 12 13 14 15 16 17 18 19 20 0 1 2 3 4 5 6 7 8 9 10 11 12 13 14 15 16 17 18 19 20

Response of CPI to the shock of budget expenditures Response of CPI to the shock of taxes

Quarters Quarters

Perc

ent

Perc

ent

-0.15

-0.1

-0.05

0

0.05

0.1

0.15

0 1 2 3 4 5 6 7 8 9 10 11 12 13 14 15 16 17 18 19 20

Response of CPI to the shock of import customs

Quarters

Perc

ent

-0.2

-0.1

0

0.1

0.2

0.3

0.4

0 1 2 3 4 5 6 7 8 9 10 11 12 13 14 15 16 17 18 19 20

Response of CPI to the shock of PIT

Quarters

Perc

ent

0.06

0.04

0.02

0

0.02

0.04

0.06

0.08

0 1 2 3 4 5 6 7 8 9 10 11 12 13 14 15 16 17 18 19 20

Response of CPI to the shock of VATQuarters

Perc

ent

Perc

ent

-0.1

-0.08

-0.06

-0.04

-0.02

0

0.02

0.04

0.06

0.08

0.1

0 1 2 3 4 5 6 7 8 9 10 11 12 13 14 15 16 17 18 19 20

Response of CPI to the shock of transfers to the populationQuarters

Perc

ent

-0.1

-0.08

-0.06

-0.04

-0.02

0

0.02

0.04

0.06

0 1 2 3 4 5 6 7 8 9 10 11 12 13 14 15 16 17 18 19 20

Response of CPI to the shock of pensionsQuarters

Perc

ent

-0.08

-0.06

-0.04

-0.02

Perc

ent

0

0.02

0.04

0.06

0.08

0.1

0.12

0 1 2 3 4 5 6 7 8 9 10 11 12 13 14 15 16 17 18 19 20

Response of GDP to the shock of expenditures on goods and servicesQuarters

Perc

ent

-0.15

-0.1

-0.05

0

0.05

0.1

0.15

0 1 2 3 4 5 6 7 8 9 10 11 12 13 14 15 16 17 18 19 20

Response of CPI to the shock of expenditures on goods and servicesQuarters

Perc

ent

-0.1

-0.05

0

0.05

0.1

0.15

0.2

0 1 2 3 4 5 6 7 8 9 10 11 12 13 14 15 16 17 18 19 20

0 1 2 3 4 5 6 7 8 9 10 11 12 13 14 15 16 17 18 19 20

Response of GDP to the shock of adjusted expenditures on goods and servicesQuarters

Perc

ent

-0.15

-0.1

-0.05

0

0.05

0.1

Response of CPI to the shock of adjustedon goods and servicesQuarters


Recommended