How Does Household Expenditure Change With Age for Older Americans? p. 2
2014 Health and Voluntary Workplace Benefits Survey: Most Workers Continue to be Satisfied With Their Own Health Plan, but Growing Number Give Low Ratings to Health Care System, p. 12
A T A G L A N C E
How Does Household Expenditure Change With Age for Older Americans? by Sudipto Banerjee, Ph.D., EBRI
Home and home-related expenses is the largest spending category for every age group.
Health expenses increase steadily with age. In 2011, households with at least one member between ages 50 and 64 spent 8 percent of their total budget on health items, compared with 19 percent for those age 85 or over. Health-related expenses occupy the second-largest share of total expenditure for those ages 75 or older.
The two components of household expenditures that show a declining pattern across age groups are transportation expenses and entertainment expenses. Food and clothing expenses (as a share of total expenditure) remain more or less flat across the different age groups.
There is a large increase in spending at the 95th percentile for those ages 90 or older, which can be attributed to very high health care expenses.
2014 Health and Voluntary Workplace Benefits Survey: Most Workers Continue to be Satisfied With Their Own Health Plan, but Growing Number Give Low Ratings to Health Care System, by Paul Fronstin, Ph.D., EBRI, and Ruth Helman, Greenwald & Associates
Asked to rate the U.S. health care system, many workers describe it as poor (29 percent) or fair (32 percent). One-quarter consider it good, while only a small minority rate it as very good (10 percent) or excellent (1 per-cent). Dissatisfaction with the health care system appears to be focused primarily on cost.
The 2013–2014 EBRI/Greenwald & Associates Workplace Benefits Survey (WBS) and the 1998–2012 EBRI/ Greenwald & Associates Health Confidence Survey (HCS) find that the percentage of workers rating the health care system as poor more than doubled between 1998‒2006 (rising from 14 percent to 32 percent); however, while between 2006‒2013 that percentage fell slightly, it jumped to 29 percent in 2014.
In contrast to the ratings for the health care system overall, workers’ ratings of their own health plans continue to be generally favorable. One-half of those with health insurance coverage are extremely or very satisfied.
While 47 percent of workers indicate they are extremely or very confident about their ability to get the treatments they need today, only 30 percent are confident about their ability to get needed treatments during the next 10 years, and just 19 percent are confident about this once they are eligible for Medicare.
How Does Household Expenditure Change With Age for Older Americans? By Sudipto Banerjee, Ph.D., Employee Benefit Research Institute
Introduction Retirement saving involves a lot of unknowns, the most important being not knowing how much money will be needed in retirement. Although it is impossible to predict the retirement expenses of any particular household, the average amounts spent by current retirees can serve as important benchmarks for individual savers as well as for industry experts and policymakers.
This Notes article examines the expenditure pattern of the older segment of the U.S. population. The majority of the households studied here have either reached retirement age or are on the cusp of retirement. The data come from the Health and Retirement Study (HRS) and the Consumption and Activities Mail Survey (CAMS), which is a supplement of the HRS (described below). CAMS contains detailed spending information on 26 nondurable and six durable categories, and it follows the same group of people over time. Using this information coupled with the income information available in the HRS, this study summarizes the consumption behavior of the American elderly. The primary goal is to examine how overall spending and spending in different categories change with age.
Data Two data sources are used for this study. First is the HRS, which is a study of a nationally representative sample of U.S. households with individuals over age 50. It is the most comprehensive survey of older Americans in the nation and covers topics such as health, assets, income, and labor-force status in detail. It is a biennial, longitudinal survey with questionnaire waves in even-numbered years beginning in 1992. The initial sample consisted of individuals born between 1931‒1941 and their spouses, regardless of their birth year. Younger cohorts have been added in following years. The study is sponsored by the National Institute on Aging (NIA) and the Social Security Administration (SSA) and administered by the Institute for Social Research (ISR) at the University of Michigan.
The second source of data used in this study comes from CAMS, which was started in 2001 as a supplement to the HRS. From the participants in the 2000 HRS, 5,000 households were selected at random and mailed the CAMS questionnaire. In couple households, the questionnaire was sent randomly to one of the two spouses. Since 2001, CAMS has been conducted every two years, with 2011 being the latest round of available data. It collects spending information on 32 categories (six durable and 26 non-durable categories).
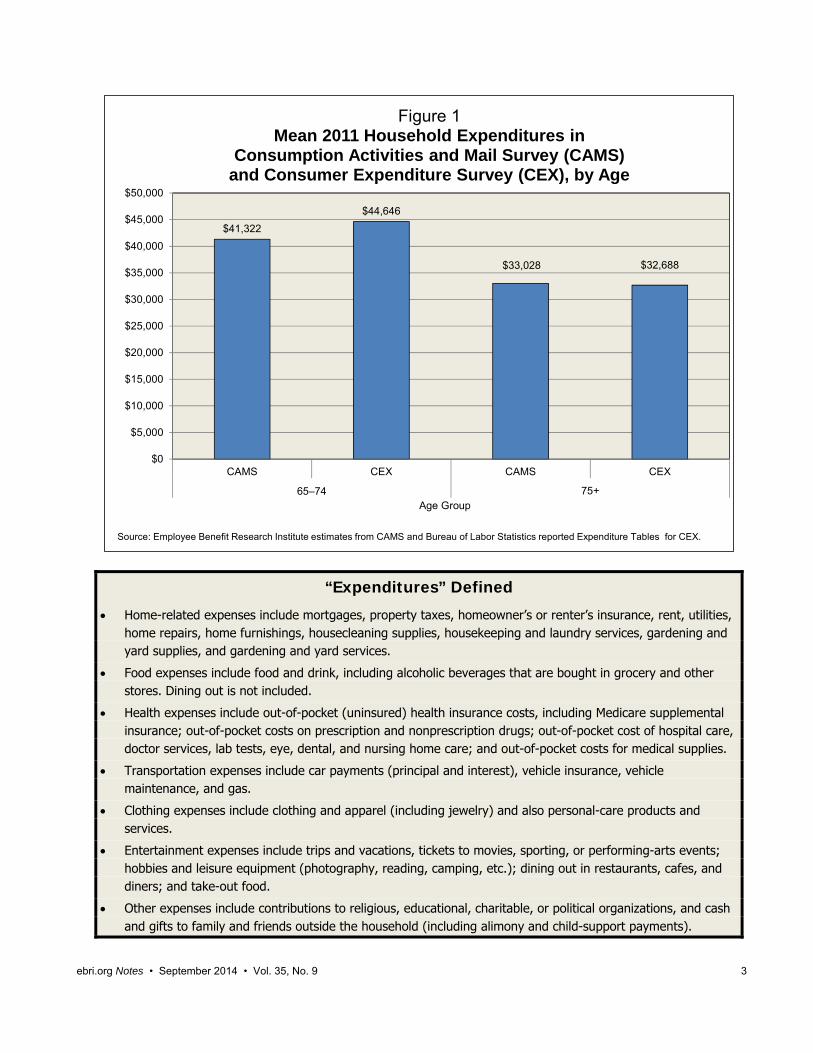
Figure 1 shows how overall reported spending in CAMS households with at least one member above age 65 in 2011 compares with those reported in the Consumer Expenditure Survey (CEX), which is the benchmark survey on household expenditure in the United States. For households with at least one member between ages 65 and 74, CAMS reports a slightly lower ($41,322) mean household expenditure than CEX ($44,646). But for those ages 75 and above, there is not much difference in mean household expenditure between CAMS ($33,028) and CEX ($32,688). The household-income data are taken from the RAND version of HRS data because it provides a consistent measure of income across all waves.1
Household Income and Expenditure Across Ages Figure 2 takes a closer look at the expenditure pattern across ages, both by breaking total household expenditure into different categories and also by separating it into different age groups. The mean, median (in 2013 dollars) and percentage share of each category in total spending are reported. The different expenditure categories are described above.
Home-related expenses include mortgages, property taxes, homeowner’s or renter’s insurance, rent, utilities, home repairs, home furnishings, housecleaning supplies, housekeeping and laundry services, gardening and yard supplies, and gardening and yard services.
Food expenses include food and drink, including alcoholic beverages that are bought in grocery and other stores. Dining out is not included.
Health expenses include out-of-pocket (uninsured) health insurance costs, including Medicare supplemental insurance; out-of-pocket costs on prescription and nonprescription drugs; out-of-pocket cost of hospital care, doctor services, lab tests, eye, dental, and nursing home care; and out-of-pocket costs for medical supplies.
Transportation expenses include car payments (principal and interest), vehicle insurance, vehicle maintenance, and gas.
Clothing expenses include clothing and apparel (including jewelry) and also personal-care products and services.
Entertainment expenses include trips and vacations, tickets to movies, sporting, or performing-arts events; hobbies and leisure equipment (photography, reading, camping, etc.); dining out in restaurants, cafes, and diners; and take-out food.
Other expenses include contributions to religious, educational, charitable, or political organizations, and cash and gifts to family and friends outside the household (including alimony and child-support payments).
$41,322
$44,646
$33,028 $32,688
$0
$5,000
$10,000
$15,000
$20,000
$25,000
$30,000
$35,000
$40,000
$45,000
$50,000
CAMS CEX CAMS CEX
65–74 75+
Figure 1Mean 2011 Household Expenditures in
Consumption Activities and Mail Survey (CAMS) and Consumer Expenditure Survey (CEX), by Age
Source: Employee Benefit Research Institute estimates from CAMS and Bureau of Labor Statistics reported Expenditure Tables for CEX.
Some immediate patterns emerge from Figure 2. First, as in previous studies (Banerjee, 2012; Butrica, Goldwyn, and Johnson, 2005; Butrica and Mermin, 2006), it is found that home and home-related expenses is the largest spending category for every age group. In any given year, the percentage of total expenditures for home-related items was very close for every age group. Second, health expenses increase steadily with age. In 2011, households with at least one member between ages 50 and 64 spent 8 percent of their total budget on health items, while those ages 85 or over spent 19 percent of their budget on health items. Health-related expenses occupy the second-largest share of total expenditure for those over age 75. For some, health care expenses can be heavily skewed toward the end of life (DeNardi et. al., 2010). To that extent, the difference between mean and median health care expenses for the oldest age group (85 and above) is important. For example, in 2011, while the median health care expenditure for this group was $2,814, the mean was much higher at $6,603.
The two components of household expenditures that show a declining pattern across age groups are transportation expenses and entertainment expenses. As a share of total expenses, transportation expenses fall the most. For example, in 2011, they constituted 16 percent of total expenses for households with at least one member between ages 50 and 64, as opposed to 7 percent for those ages 85 and above. With retirement, daily transportation needs (such as commuting to work) decrease, and with increasing age and declining health, people become more restricted to the indoors, which cuts entertainment expenses as well. Food and clothing expenses (as a share of total expenditure) remain more or less flat across the different age groups.
Change in Household Expenditure for a Fixed Group of Households
Although Figure 2 shows detailed household spending across several years, Figure 3 is more helpful in understanding how household spending changed in recent years as the household’s members aged, because Figure 3 tracks the spending of a fixed set of households over time. Starting with 2005, it shows how total spending as well as spending in different categories have changed as people aged through 2011.
Average household spending dropped between 2005 and 2011 in every age group, and younger households cut back spending more than older households during that period. For example, households between ages 50‒59 in 2005, most of whom were presumably still in the labor force but on the cusp of retirement, reported the highest drop. Their average household spending dropped from $53,284 in 2005 to $45,234 in 2011 (in 2013 $s), a real decrease of 15 percent. In terms of specific categories, their average spending on clothing dropped 36 percent, followed by other spending at 25 percent.
Whether this was a short-run drop in response to the 2008 market crash or part of a long-run trend remains to be seen. Households between ages 60 and 64 and those between ages 65 and 74 both reported a 10 percent drop in average household spending. For both of these two groups, the highest drops came in transportation and clothing expenses. A large part of these expenses are related to work, and with many households in these age groups moving into retirement during the time frame these changes are not surprising. For the oldest group, 75 and above, there was a 5 percent drop in overall spending but a 6 percent increase in health-care expenses.
Age Trends This section takes a detailed look at different components of household spending and how they change with age. Combining data from 2003 to 2009, Figure 4 shows how mean household income and expenditures change with age. Income falls much faster than expenditures for older age groups. Taking age 65 (i.e., households that have at least one member age 65) as the benchmark, average household income is 20 percent less by age 75 and 50 percent less by age 85. In comparison, average household expenditures, again measured against the age-65 benchmark, are 16 percent lower by age 75 and 40 percent lower by age 85. It should be noted here that the income and consumption paths do not show the same group of households at different ages (this is a cross-sectional trend).
Data from 2003 to 2011 are used for Figures 5 and 6. First, Figure 5 shows how the dollar amounts (in 2013 $s) spent in different categories change with every single year of age. It is clear that home-related expenditures are by far the largest spending category, and even if the dollar amount spent on homes is significantly smaller for those who are older, it remains the largest spending category through the oldest ages. Second, for working-age households, transportation remains the second-largest spending category, only to be replaced by health care expenses around age 75. Not surprisingly, health care expenditures are the only category in which the dollar amount spent is larger for those who are older. Finally, the average amount spent for entertainment purposes does not show any significant increase around the traditional retirement ages, and, in fact, clearly trends downward with age.
Source: Employee Benefit Research Institute estimates from Consumption Activities and Mail Survey (CAMS).
Mean and Median 2011 Spending in 2013 $s in Each Category, and Mean Percentage Share of Each Category in Total Spending for a Fixed Group of Households (Odd Years Only), by Age Groups as of 2005
Figure 6 shows how the share of each spending category changes with age. There are a few things to note. First, although the dollar amount spent on home expenditures are lower for those that are older (as shown in Figure 5), its share in total household spending does not change much. It remains between 40 and 45 percent for most households across all ages considered. Second, just like the dollar amounts shown in Figure 5, transportation captures the second-largest share of working-age households’ budgets. But around age 75, health care expenses become the second-largest spending item for older households. By age 90, health care expenses account for more than 20 per-cent of the households’ entire budgets.
How Does Overall Distribution of Household Expenditure Change With Age? The mean and median results are useful statistics and most widely used to summarize the distribution of different factors, but they give only an idea about the middle of the distribution. Understanding the entire distribution is very important for multiple reasons: First, it gives household members an idea of where they are in the spending distribution and can help them evaluate if they are spending more or less relative to their age group. Second, in terms of retirement planning, it can also give household members an idea of how much people in similar positions at older ages spend. For example, consider the members of a 60-year-old household that is in the 90th percentile of its age-specific spending distribution who want to know what the household’s expenses might be at age 85. Knowing the median spending at age 85 is less informative for members of this household, as they might expect to be toward the top of the distribution at age 85.
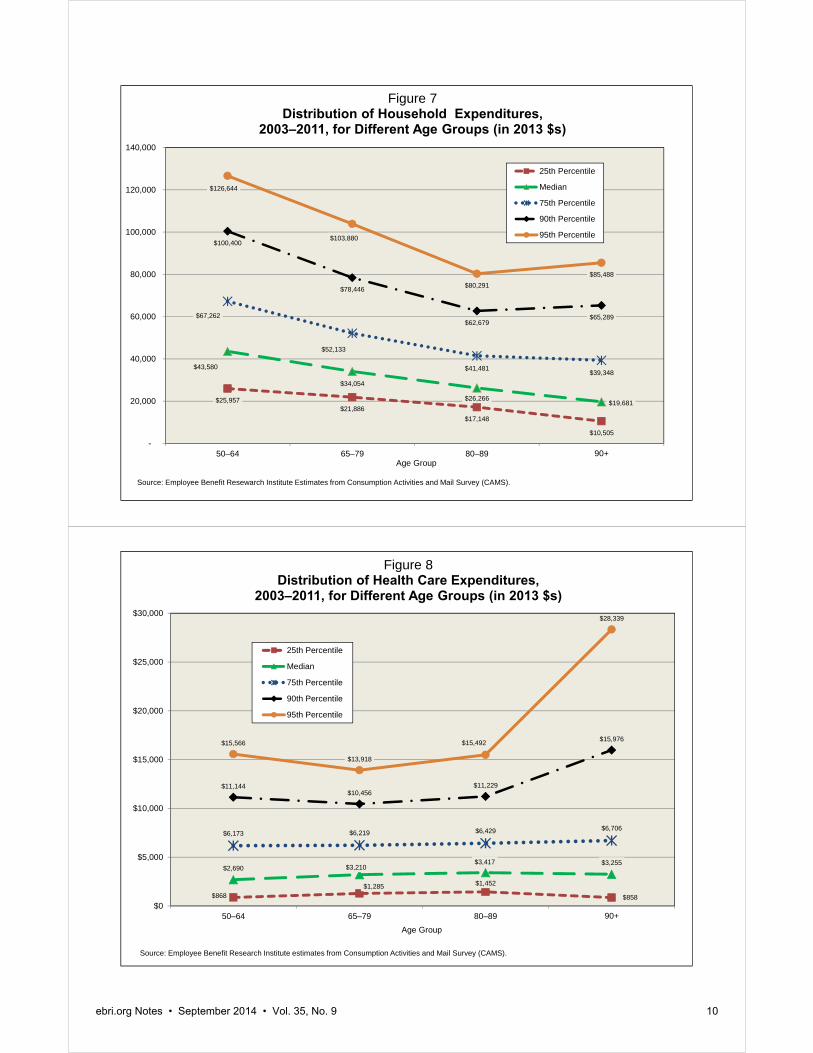
Figure 7 addresses this by breaking down the distribution of overall household spending, combining data from 2003 to 2011. Households are divided into four age groups: 50‒64, 65‒79, 80‒89 and 90 and above. For each age group, the 25th, 50th (median), 75th, 90th, and 95th percentiles are reported. Worth noting: First, it shows that spending
doesn’t fall uniformly across the distribution with age. For example, the median drops from $43,580 (for those between ages 50‒64) to $19,681 (for those age 90 or older), a 55 percent drop. For the same age groups, the 90th percentile drops from $100,400 to $65,289, a 35 percent drop. Second, until age 90, all the reported percentiles show a decline, and the distribution narrows as well. But for those 90 and above,2 the 90th and 95th percentiles show an increase. To figure out the reason for this, similar breakdowns were calculated for all the spending components separately. Health care spending stands out to be the biggest contributor to this increase.
Figure 8 shows the detailed distribution of health care expenditure across these age groups. Until age 90, the distribution looks very stable with little change in the percentiles across age groups—but at age 90 and older, the 90th and 95th percentiles of health care expenses show abrupt increases. This shows that for some people, end-of-life health care spending can be very high.
Conclusion This study attempts to show how household spending along with its different components changes with age. Household spending data is used from a nationally representative survey of Americans 50 years or older. The key findings include:
Household spending is lower for older households, but the decrease is not uniform across the spending distribution. Between age groups 50‒64 and 90 or older, the median drops nearly 55 percent, but the 90th percentile drops only 35 percent.
There is a large increase in spending at the 95th percentile for those ages 90 or older, which can be attributed to very high health care expenses.
Home and home-related expenses are the largest spending items in the household budget across all ages. For almost all ages 50 or older, they capture 40‒45 percent of household budget.
Health care spending is the only item that is larger for older households. This is in both dollar terms and as a percentage of total household spending.
Butrica, Barbara A., Joshua H. Goldwyn, and Richard W. Johnson. “Understanding Expenditure Patterns in Retirement.” CRR Working Paper No. 2005‒03. Chestnut Hill, MA: Center for Retirement Research at Boston College, 2005.
Butrica, Barbara A., and Gordon B.T. Mermin. “Annuitized Wealth and Consumption at Older Ages.” CRR Working Paper No. 2006‒26. Chestnut Hill, MA: Center for Retirement Research at Boston College, 2006.
Butrica, Barbara A., Gordon B.T. Mermin, and Richard W. Johnson. “Do Health Problems Reduce Consumption at Older Ages?” CRR Working Paper No. 2009‐9. Chestnut Hill, MA: Center for Retirement Research at Boston College, 2009.
Copeland, Craig. “How Are New Retirees Doing Financially in Retirement?” EBRI Issue Brief, no. 302 (Employee Benefit Research Institute, February 2007).
DeNardi, Mariacristina., Eric French, and John B. Jones. “Why Do the Elderly Save? The Role of Medical Expenses,” Journal of Political Economy, Vol. 118, No. 1 (February 2010), pp. 37‐75.
Hurd, Michael, and Susann Rohwedder. “Economic Preparation For Retirement,” NBER Working Paper #17203 (July 2011).
Goda, Gopi Shah, Ezra Golberstein, and David C. Grabowski. “Income and the Utilization of Long‐Term Care Services: Evidence from the Social Security Benefit Notch,” NBER Working Paper #16076 (June 2010).
VanDerhei, Jack. “Measuring Retirement Income Adequacy: Calculating Realistic Income Replacement Rates.” EBRI Issue Brief, no. 297 (Employee Benefit Research Institute, September 2006).
Endnotes 1 RAND provides an easy-to-use version of HRS that includes some very important household-level information derived from the raw HRS files. This includes variables like total household income, household net worth etc. Although many of the survey questions regarding these variables have changed over the years, the RAND variable definitions are consistent across years.
2 The 90-and-above age group had 421 observations.
2014 Health and Voluntary Workplace Benefits Survey: Most Workers Continue to be Satisfied With Their Own Health Plan, but Growing Number Give Low Ratings to Health Care System By Paul Fronstin, Ph.D., Employee Benefit Research Institute, and Ruth Helman, Greenwald & Associates, Inc.
2014 Health and Voluntary Workplace Benefits Survey Underwriters AARP
Fidelity Investments
Guardian Life
Lincoln Financial Group
Mercer
MetLife
The Segal Group
T. Rowe Price
Unum
Walgreens
Introduction
Four years after passage of the Patient Protection and Affordable Care Act of 2010 (PPACA), implementation of many of its provisions and delay of others, an increasing majority of workers continue to give low marks to the U.S. health care system.
This article examines public opinion with respect to various aspects of the United States health care system using data from the 2014 EBRI/Greenwald & Associates Health and Voluntary Workplace Benefits Survey (WBS) as well as from the 1998–2012 EBRI/Greenwald & Associates Health Confidence Survey (HCS) and the 2013 WBS. The WBS and HCS examine a broad spectrum of health care issues, including workers’ satisfaction with health care today, their confidence in the future of the health care system and the Medicare program, and their attitudes toward benefits in the workplace.
The U.S. Health Care System Health care is not the issue that the majority of workers consider to be the most pressing in the United States today. The 2014 WBS finds they are most likely to identify the economy (37 percent) when asked about the most critical issue; health care (19 percent) is the second-most critical issue named, followed by the federal budget deficit (12 per-cent), education (11 percent), and unemployment (9 percent). Six percent of workers consider immigration to be the most pressing issue, and 5 percent report it to be the environment. Nevertheless, four years after passage of PPACA and implementation of a number of provisions in the legislation, dissatisfaction with the U.S. health care system remains widespread.
When asked to rate the health care system, a majority of workers (61 percent) describe it as poor (29 percent) or fair (32 percent), up from 55 percent in 2013. One-quarter (27 percent) consider it good, while only a small minority rate it as very good (10 percent) or excellent (1 percent) (Figure 1). The 2013‒2014 WBS and the 1998–2012 HCS find that the percentage of workers rating the health care system as poor more than doubled between 1998 and 2006 (rising from 14 percent to 32 percent). While that percentage fell between 2006 and 2013, it jumped to 29 percent in 2014. Between 2006 and 2013, the percentage of workers reporting that the health care system was fair or poor fell from 61 percent to 55 percent, and then increased to 61 percent in 2014.
Confidence in the Health Care System Confidence about various aspects of today’s health care system has also remained fairly level before and after the passage of PPACA. According to the 2014 WBS, nearly one-half (47 percent) of workers report being extremely or very confident that they are able to get the treatments they need (Figure 2). (The decline between 2012 and 2013 appears large, but is due to a change in the way the data is collected, which is described in more detail in the appendix). One-third (33 percent) report being somewhat confident that they are able to get the treatments they need in 2014, and 20 percent are not too (14 percent) or not at all (6 percent) confident.
Confidence in having enough choices about who provides medical care also is fairly steady between 2013 and 2014. In 2014, 4 in 10 workers (38 percent) are extremely or very confident that they have enough choices about who provides their medical care. Thirty-five percent are somewhat confident, and 27 percent are not too (19 percent) or not at all (8 percent) confident.
Confidence about the health care system decreases as workers look to the future. While 47 percent of workers indicate they are extremely or very confident about their ability to get the treatments they need today, only 30 percent are confident about their ability to get needed treatments during the next 10 years, and just 19 percent are confident about this once they are eligible for Medicare (Figure 3). Similarly, 38 percent are confident they have enough choices about who provides their medical care today, but only 26 percent are confident about this aspect of the health care system over the next 10 years, and just 18 percent are confident that they will have enough choices once they are eligible for Medicare. Finally, 24 percent of workers say they are confident that they are able to afford health care without financial hardship today, but this percentage decreases to 20 percent when they look out over the next 10 years and to 17 per-cent when they consider the Medicare years.
Figure 1Rating of Health Care System in America, 1998–2014
Excellent Very Good Good Fair Poor
Source: Employee Benefit Research Institute and Greenwald & Associates, Inc., 1998–2012 Health Confidence Surveys, and 2013-2014 Health and Voluntary Workplace Benefits Survey.
Workers are generally confident that their employers or unions will continue to offer health insurance in the future. In 2014, 29 percent of workers report that they are extremely confident their employers or unions will continue to offer coverage, 35 percent are very confident, and 27 percent are somewhat confident (Figure 4). The percentages of those who are not too or not at all confident their employer or union will continue to offer health insurance have been low historically, and 2014 is no exception. In 2014, only 7 percent are not too confident and 2 percent are not at all confident that their employers or unions will continue to offer health insurance.
Satisfaction In contrast to the ratings for the health care system overall, workers’ ratings of their own health plans continue to be generally favorable. One-half (50 percent) of those with health insurance coverage are extremely or very satisfied with their current plans, and 38 percent are somewhat satisfied (Figure 5). Only 11 percent say they are not too (9 percent) or not at all (2 percent) satisfied.
Dissatisfaction with the health care system appears to be focused primarily on cost. Satisfaction with health care quality continues to remain fairly high, with 46 percent of workers saying they are extremely or very satisfied with the quality of the medical care they have received in the past two years, 32 percent somewhat satisfied, and 15 percent not too (10 percent) or not at all (5 percent) satisfied (Figure 6). In contrast, just 13 percent are extremely or very satisfied with the cost of their health insurance plan, and only 10 percent are satisfied with the costs of health care services not covered by insurance.
The Cost of Health Care About 6 in 10 workers (59 percent) with health insurance coverage report having experienced an increase in health care costs in the past year, roughly in line with the historical findings (Figure 7). In response, workers continue to report they are changing the way they use the health care system. Nearly three-quarters (73 percent) say these increased costs lead them to try to take better care of themselves, and 61 percent indicate they choose generic drugs more often (Figure 8). About one-half also say they go to the doctor only for more serious conditions or symptoms (55 percent) and delay going to the doctor (49 percent).
The rising cost of health care also causes many workers to encounter financial difficulties. Among those experiencing cost increases in their plans in the past year, 27 percent state they have decreased their contributions to retirement plans, and one-half (47 percent) have decreased their contributions to other savings as a result (Figure 9). Two in 10 (21 percent) also report they have had difficulty paying for basic necessities such as food, heat, and housing, while 32 percent say they have had difficulty paying other bills. About one-quarter (23 percent) say they have used up all or most of their savings, 32 percent have increased their credit card debt, 16 percent report that they have borrowed money, 28 percent have delayed retirement, and 16 percent have dropped other insurance benefits.
Appendix—The 2014 WBS These findings are part of the 2014 EBRI/Greenwald & Associates Health and Voluntary Workplace Benefits Survey (WBS), which examines a broad spectrum of health care issues, including workers’ satisfaction with health care today, their confidence in the future of the health care system and the Medicare program, and their attitudes toward benefits in the workplace. The survey was conducted online June 12–19, 2014, using the Research Now consumer panel. A total of 1,517 workers in the United States ages 21–64 participated in the survey. The data are weighted by gender, age, and education to reflect the actual proportions in the employed population.
Previously published trend data from the EBRI/Greenwald & Associates Health Confidence Survey (HCS) may differ from those published in more recent reports as the prior data have been recut from the total adult population to match the survey population of the WBS: workers ages 21–64. In addition, comparisons of 2014 data with data from years prior to 2013 should be viewed with caution due to the move from telephone to online methodology in 2013.
No theoretical basis exists for judging the accuracy of estimates obtained from non-probability samples such as the one used for the WBS. However, there are possible sources of error in all surveys (both probability and non-probability) that may affect the reliability of survey results. These include imperfect sampling frames, refusals to be interviewed and other forms of nonresponse, the effects of question wording and question order, interviewer bias, and screening. While attempts are made to minimize these factors, it is impossible to quantify the errors that may result from them.
The WBS is co-sponsored by the Employee Benefit Research Institute (EBRI), a private, nonprofit, nonpartisan, public-policy research organization, and Greenwald & Associates, Inc., a Washington, DC-based market research firm. The 2014 WBS data collection was funded by grants from nine private organizations. Staffing was donated by EBRI and Greenwald & Associates. WBS materials and a list of underwriters may be accessed at the EBRI website: www.ebri.org/surveys/hcs/
65%67%
57%59%
63%60%
55%
61%59%
32%29%
40%38%
35% 36%
42%
36% 36%
3% 4% 3% 3% 2%4%
2% 3% 4%
0%
10%
20%
30%
40%
50%
60%
70%
80%
2006 2007 2008 2009 2010 2011 2012 2013 2014
Figure 7Percentage of Individuals with Private Insurance Reporting an Increase or Decrease in Premiums or Cost Sharing, 2006-2014
Increased Stayed the Same Decreased
Source: Employee Benefit Research Institute and Greenwald & Associates, Inc., 2006–2012 Health Confidence Surveys, and 2013-2014 Health and Voluntary Workplace Benefits Survey.
EBRI Employee Benefit Research Institute Notes (ISSN 10854452) is published monthly by the Employee Benefit Research Institute, 1100 13th St. NW, Suite 878, Washington, DC 20005-4051, at $300 per year or is included as part of a membership subscription. Periodicals postage rate paid in Washington, DC, and additional mailing offices. POSTMASTER: Send address changes to: EBRI Notes, 1100 13th St. NW, Suite 878, Washington, DC 20005-4051. Copyright 2014 by Employee Benefit Research Institute. All rights reserved, Vol. 35, no. 9.
The Employee Benefit Research Institute (EBRI) was founded in 1978. Its mission is to contribute to, to encourage, and to enhance the development of sound employee benefit programs and sound public policy through objective research and education. EBRI is the only private, nonprofit, nonpartisan, Washington, DC-based organization committed exclusively to public policy research and education on economic security and employee benefit issues. EBRI’s membership includes a cross-section of pension funds; businesses; trade associations; labor unions; health care providers and insurers; government organizations; and service firms.
EBRI’s work advances knowledge and understanding of employee benefits and their importance to the nation’s economy among policymakers, the news media, and the public. It does this by conducting and publishing policy research, analysis, and special reports on employee benefits issues; holding educational briefings for EBRI members, congressional and federal agency staff, and the news media; and sponsoring public opinion surveys on employee benefit issues. EBRI’s Education and Research Fund (EBRI-ERF) performs the charitable, educational, and scientific functions of the Institute. EBRI-ERF is a tax-exempt organization supported by contributions and grants.
EBRI Issue Briefs are periodicals providing expert evaluations of employee benefit issues and trends, as well as critical analyses of employee benefit policies and proposals. EBRI Notes is a monthly periodical providing current information on a variety of employee benefit topics. EBRIef is a weekly roundup of EBRI research and insights, as well as updates on surveys, studies, litigation, legislation and regulation affecting employee benefit plans, while EBRI’s Blog supplements our regular publications, offering commentary on questions received from news reporters, policymakers, and others. The EBRI Databook on Employee Benefits is a statistical reference work on employee benefit programs and work force-related issues.
Contact EBRI Publications, (202) 659-0670; fax publication orders to (202) 775-6312. Subscriptions to EBRI Issue Briefs are included as part of EBRI membership, or as part of a $199 annual subscription to EBRI Notes and EBRI Issue Briefs. Change of Address: EBRI, 1100 13th St. NW, Suite 878, Washington, DC, 20005-4051, (202) 659-0670; fax number, (202) 775-6312; e-mail: [email protected] Membership Information: Inquiries regarding EBRI membership and/or contributions to EBRI-ERF should be directed to EBRI President Dallas Salisbury at the above address, (202) 659-0670; e-mail: [email protected]
Editorial Board: Dallas L. Salisbury, publisher; Stephen Blakely, editor. Any views expressed in this publication and those of the authors should not be ascribed to the officers, trustees, members, or other sponsors of the Employee Benefit Research Institute, the EBRI Education and Research Fund, or their staffs. Nothing herein is to be construed as an attempt to aid or hinder the adoption of any pending legislation, regulation, or interpretative rule, or as legal, accounting, actuarial, or other such professional advice.
EBRI Notes is registered in the U.S. Patent and Trademark Office. ISSN: 10854452 10854452/90 $ .50+.50