+ All Categories
Home > Documents > How does it work? Side-scan sonar · 1 Side-scan sonar Habitat mapping and sediment detection...

How does it work? Side-scan sonar · 1 Side-scan sonar Habitat mapping and sediment detection...

Date post: 18-Jul-2018
Category:
Upload: duongcong
View: 220 times
Download: 0 times
Share this document with a friend
5
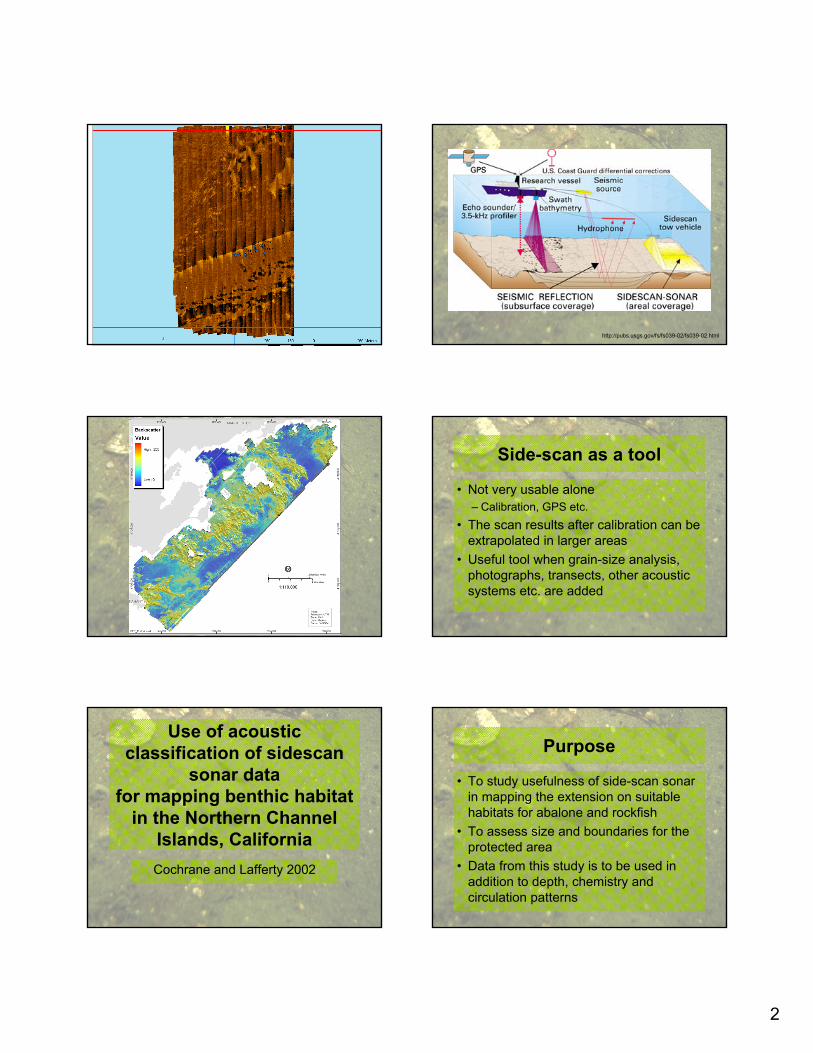
1 Side-scan sonar Habitat mapping and sediment detection Geological oceanography Riikka Puntila 2.4.2008 How does it work? Sonar uses ultrasound which needs a medium, water, to progress Image is constructed of different reflections of different objects Sound frequencies vary from 100-500 kHz – High frequencies give better resolution but smaller range http://woodshole.er.usgs.gov/operations/sfmapping/sonar.htm stones sand gravel rock
Transcript

1

Side-scan sonarHabitat mapping and sediment

detection

Geological oceanographyRiikka Puntila

2.4.2008

How does it work?

• Sonar uses ultrasound which needs a medium, water, to progress

• Image is constructed of different reflections of different objects

• Sound frequencies vary from 100-500 kHz– High frequencies give better resolution but

smaller range

http://woodshole.er.usgs.gov/operations/sfmapping/sonar.htm

stones

sand

gravel

rock

2

http://pubs.usgs.gov/fs/fs039-02/fs039-02.html

Side-scan as a tool

• Not very usable alone– Calibration, GPS etc.

• The scan results after calibration can be extrapolated in larger areas

• Useful tool when grain-size analysis, photographs, transects, other acoustic systems etc. are added

Cochrane and Lafferty 2002

Use of acoustic classification of sidescan

sonar datafor mapping benthic habitat

in the Northern ChannelIslands, California

Purpose

• To study usefulness of side-scan sonar in mapping the extension on suitable habitats for abalone and rockfish

• To assess size and boundaries for the protected area

• Data from this study is to be used in addition to depth, chemistry and circulation patterns

3

Study area

Submersible ground-truthing

• Three distinct bottom types– Thick bioturbated

sand– Thin winnowed sand– Encrusted rock

Black:overlapping sand

Dark grey:bioturbated thick sand

Light grey:winnowed sand

White:encrusted rock

Conclusions

• The side-scan sonar picture was useful for distinguishing sand areas from rock

• In the far ends of the range interpretation was not certain

• This method helped to reveal far greater areas of sandy bottom than previous maps of the area Goff et al. 2000

Correlation of side-scan backscatter intensity with

grain-sizedistribution of shelf

sediments, New Jersey margin

4

Purpose

• To study correlation between backscatter intensity and sediment grain-size– Quantitative interpretation

• To evaluate the accuracy of assumptions made in earlier study by Goff et al. 1999

Higher backscatter,

mobile sediments

Lower backscatter,

static sediments

Figure 2.

Figure 3.

5

Conclusions

• In well sorted sediments a good level of correlation can be obtained

• The presence of unsorted sediments and in trimodal sediments mean grain size is not representative

• Backscatter is the most sensitive to larger grain sizes

Conclusions&Discussion

• Side-scan sonar is a useful tool with some constraints– Other methods needed for calibration

• Sonar surveys can cover larger areas than traditional methods

• Multiple geological and ecological applications

Thanks, ya’ll!


Recommended