146
i Healthcare in Focus 2016 – How does NSW compare? bhi.nsw.gov.au ! Healthcare in Focus 2016 How does NSW compare?
iHealthcare in Focus 2016 – How does NSW compare? bhi.nsw.gov.au
!
Healthcare in Focus 2016
How does NSW compare?
BUREAU OF HEALTH INFORMATION
Level 11, 67 Albert Avenue Chatswood NSW 2067 Australia Telephone: +61 2 9464 4444 Email: [email protected] bhi.nsw.gov.au
© Copyright Bureau of Health Information 2017 This work is copyrighted. It may be reproduced in whole or in part for study or training purposes subject to the inclusion of an acknowledgement of the source. It may not be reproduced for commercial usage or sale. Reproduction for purposes other than those indicated above requires written permission from the Bureau of Health Information.
State Health Publication Number: (BHI) 170456 ISSN: 1838-6989
Suggested citation:Bureau of Health Information. Healthcare in Focus 2016. Sydney (NSW); BHI; 2017.
Published September 2017
Please note that there is the potential for minor revisions of data in this report.Please check the online version at bhi.nsw.gov.au for any amendments.
The conclusions in this report are those of BHI and no official endorsement by the NSW Minister for Health, the NSW Ministry of Health or any other NSW public health organisation is intended or should be inferred.
Healthcare in Focus 2016 – How does NSW compare? bhi.nsw.gov.au
Foreword v
10 key findings 1
Summary 3
Setting the scene 6
Data sources and methods 9
Interpreting selected graphs 11
Applying a framework 13
Overview of measures included in this report 15
Overall views of performance 18
Healthcare performance
Accessibility 22
Appropriateness 38
Effectiveness 62
Efficiency 86
Equity 98
Sustainability 114
Appendices 130
References 134
Acronyms 139
Acknowledgements 140
Table of contents
vHealthcare in Focus 2016 – How does NSW compare? bhi.nsw.gov.au
Healthcare in Focus is a compendium-style report that takes a comprehensive look at healthcare performance in NSW. It draws on different data sources, and features some 140 indicators – placing NSW results, where possible, in an international or national context.
As in previous years, the 2016 edition is structured around a conceptual framework that considers performance in terms of six key dimensions: accessibility; appropriateness; effectiveness; efficiency; equity; and sustainability.
Compendia are in many ways ‘compromise’ reports. Any effort to compile a complete account of health performance is destined to be overwhelmed by the sheer volume and detail of data, and can quickly result in ‘indicator chaos’ and ‘paralysis by analysis’.
At the same time, restricting our focus to a few clinical areas or to a limited set of metrics risks creating a short-sighted or blinkered picture of performance. This was largely the case 20 years ago, when most measurement and reporting covered financial viability and patient waiting times only. Since then, healthcare systems have made significant advances in the measurement and appreciation of the complexity of performance – with much attention paid to patient safety and risk, patient-centredness, integration of care, assessment of value, minimisation of waste, and preventive care.
With the broader view of performance however, comes a need for more sophisticated interpretation and presentation of data so that we can assess impact, trade-offs, and unanticipated consequences of change.
This is where compendia continue to play an important role – balancing the competing virtues of parsimony and comprehensiveness – providing enough information to give a fair and meaningful account of healthcare performance without drowning out core messages with too much detail. They can encompass different perspectives, and different types of indicators – allowing measurement of processes, outcomes and structures.
Healthcare in Focus 2016 shows that overall, NSW continues to perform well. In recent years there has been significant progress across the state in the timeliness of care and patient-centredness. However, there remain important areas for improvement – for example, in effectiveness and safety outcomes such as rates of post-operative complications; in value and in equity where we continue to see significant disparities in health and healthcare provided to different socioeconomic and community groups.
We are confident that the compendium approach remains a useful one. However, we do know that there are a range of information needs across health and wider audiences and so we are publishing our results in different formats – in a full 140-page report, in a chart pack allowing people to see key results in graphs, and in data tables for those who want to explore the results in detail.
Dr Kim Sutherland MSc, MBA, PhDActing Chief Executive Bureau of Health Information
Foreword

1 Healthcare in Focus 2016 – How does NSW compare? bhi.nsw.gov.au
Key findings
2Healthcare in Focus 2016 – How does NSW compare? bhi.nsw.gov.au
10 key findings
1 The NSW healthcare system overall performs well. Across the indicators featured in this report, NSW was a high performer in international comparisons for almost 40% of the measures; and mid-range for almost 40%.
2 Healthcare is accessible to most people in NSW. Few people said they had unmet primary healthcare needs. In public hospitals in 2015–16, there were 2.7 million emergency department visits, almost 1.9 million inpatient episodes and more than 200,000 elective surgical procedures performed. However, among NSW adults who said they needed to see a specialist, 15% did not do so.
3 Patients generally receive timely healthcare. Despite growing patient numbers, the proportion of people treated in emergency departments within recommended times has increased over the past five years and in 2016, almost all elective surgery was performed on time. Median waiting times for key surgical procedures were however longer than in many comparator countries.
4 NSW outperforms most comparator countries in survey questions about the provision of patient-centred, responsive care. Most hospital patients said health professionals always discussed medication before discharge, involved them in decisions about their healthcare, and arranged follow-up care after discharge.
5 Most patients said they were given the ‘right amount’ of understandable information. However, consistency in communication is sometimes problematic – 32% of new mothers said they received conflicting advice about feeding their babies, and 18% of emergency department patients said they received contradictory information about their condition or treatment.
6 There has been some improvement in mental healthcare. Between 2010–11 and 2015–16, the percentage of people who received follow-up community support within a week of discharge increased from 48% to 63%. Rates of unplanned readmission to, and of seclusion in, acute psychiatric inpatient units have remained fairly steady.
7 Most patients receive safe hospital care. Hand hygiene compliance among healthcare workers is high. Adverse event rates are similar to those in other Australian states but post-surgical complications are relatively high. Among admitted hospital patients, 15% said they experienced a complication of care.
8 Rates of unplanned readmission, emergency department re-presentations and re-fracture vary across NSW. While not all are avoidable, levels of variation indicate potential for improvement.
9 Several value-for-money indicators reflect positively on NSW, including potential years of life lost, healthcare spending per capita, and average length of stay in hospital. There are areas where better value could be achieved, such as reducing falls in hospital and more appropriate use of knee arthroscopy.
10 Patients from low socioeconomic status (SES) groups had less positive experiences of care. They also had longer median waiting times for elective surgery than people from higher SES groups.
3 Healthcare in Focus 2016 – How does NSW compare? bhi.nsw.gov.au
The NSW healthcare system overall performs well, and is a higher performer for almost 40% of measures with international comparators and mid-range for almost 40% (see Appendix 1). Patients mostly report positive experiences of hospital care, deaths from cardiovascular diseases are decreasing, and no comparator country spends less and achieves better outcomes on premature mortality. However, there are areas where NSW was outperformed, including some key indicators of safety and value, and median waiting times for specific surgical procedures.
Accessibility: Healthcare when and where needed
Most people in NSW have access to healthcare. In 2015–16, two in 10 adults visited an emergency department (ED), two in 10 were hospitalised, and eight in 10 visited a general practitioner (GP). However, about one in 10 adults said they skipped a test, medication or consultation with a health professional due to cost, and 5% said they had serious problems paying, or were unable to pay, medical bills. For both of these measures, fewer people had cost barriers than in most comparator countries.
In terms of timeliness, ED performance has improved significantly over the past five years – with faster times to treatment in most urgency categories, and increases in the percentage of patients who spent four hours or less in the ED. These improvements were achieved despite marked increases in activity and patient numbers.
Almost all patients received elective surgery within clinically recommended time frames. In international comparisons, a relatively high percentage of NSW patients (public and private) received surgery within one month. However, for a number of elective surgical procedures, NSW patients had longer median waiting times than those in many comparator countries. In 2014, the median waiting time for cataract extraction was 222 days – placing NSW 15th out of 16 countries in terms of waiting times. Across all elective procedures in NSW, median waiting times increased from 49 to 55 days between 2011–12 and 2015–16.
Appropriateness: The right healthcare, the right way
Overall, most NSW patients receive high-quality, appropriate care and NSW outperforms comparator countries on many patient-centredness measures.
Most patients report that health professionals discussed their medication with them (89%) and that they were given written information about their care upon hospital discharge (85%).
Hand hygiene compliance among health professionals increased by four percentage points to 85% between October 2013 and October 2016. Less positively, only 73% of patients had hip fracture surgery within the clinically recommended time frame of two days, and NSW was outperformed by all eight comparator countries that publish data for this measure.
Like NSW, many healthcare systems are actively seeking to reduce inappropriate and low-value care. There is a particular focus on knee arthroscopy, which has been shown to confer little benefit for osteoarthritis degenerative knee conditions or for those aged 50+ years. In 2014–15, 70% of knee arthroscopies in NSW were performed on patients in these groups (63% in public hospitals and 72% in private hospitals).
With respect to appropriate mental health care, current policy emphasises that the use of restrictive practices such as seclusion should be minimised. The rate of seclusion in NSW psychiatric inpatient units was nine per 1,000 in 2015–16, and this has been fairly stable since 2010–11. The result places NSW mid-range compared with other Australian states and territories.
NSW is also mid-range compared with other Australian jurisdictions in providing support in the community following discharge from a psychiatric unit. In 2015–16, 63% of patients received community follow-up within a week of discharge, compared with 48% in 2010–11.
Summary
4Healthcare in Focus 2016 – How does NSW compare? bhi.nsw.gov.au
Effectiveness: Making a difference for patients
Healthcare in NSW makes a difference – most patients say that the care and treatment they received in hospital ‘definitely’ helped them. Mortality for cardiovascular diseases has fallen sharply over the past decade. NSW is mid-range compared with other countries on mortality due to acute myocardial infarction (heart attack), and cerebrovascular diseases such as stroke.
An important set of effectiveness measures focus on unplanned patient returns to care. Such returns are not always avoidable, however they can reflect shortcomings in the initial healthcare encounter – in follow-up arrangements, integration of care or the adequacy of discharge planning. Among the 2.6 million emergency presentations to EDs in NSW public hospitals in 2015–16, 6% were followed by another emergency presentation within two days, and 10% within seven days.
Among patients aged 50+ years who were hospitalised with a fracture between July 2011 and June 2013, 14% returned to hospital within two years with a subsequent fracture. In mental health, 15% of discharges from psychiatric inpatient care were followed by an unplanned readmission within 28 days in 2015–16.
In terms of key safety measures, about 2.5% of NSW patients who underwent hip and knee replacements suffered a venous thromboembolism, and about 2.5% of abdominal surgery patients developed sepsis – these are relatively high rates internationally.
More broadly, across NSW public hospitals in 2014–15, 6.5% of admissions had noted in the patient record an adverse event (an unintended and potentially harmful event such as bloodstream infections, complications and falls) – which was mid-range compared with other Australian states and territories. The rate of falls resulting in patient harm in NSW public hospitals was 5.6 per 1,000 hospitalisations in 2014–15 – a relatively high rate nationally.
Efficiency: Value for money
Total expenditure on healthcare in NSW – from all sources – was estimated at $46 billion in 2014–15. This equates to $6,122 per person. NSW spends less per capita on healthcare than most comparator countries. The average length of stay in NSW hospitals (public and private) was 5.8 days in 2014–15, shorter than in most comparator countries. In 2015–16, 97% of cataract extractions in NSW were performed as a same-day procedure. This result placed NSW mid-range among comparator countries and other Australian states and territories.
Equity: Health for all, healthcare that’s fair
Important disparities were revealed in terms of socioeconomic status (SES), particularly in access to healthcare. This includes visiting an ED for care that could have been provided by a GP, financial barriers, and accessing healthcare during times of emotional distress. Among patients waiting for non-urgent elective surgery, those from low SES areas had median waiting times almost twice as long as those from high SES areas in 2015–16 (66 and 38 days, respectively). This was not seen as disparities within hospitals – rather, hospitals with long median waiting times treat more patients from low SES areas.
Sustainability: Caring for the future
The ageing population and accompanying rise in chronic disease, advances in technology and increasing consumer expectation are among the drivers of increasing healthcare utilisation. Compared with other Australian states and territories, NSW has relatively high utilisation of EDs and the highest number of GP visits per capita. In 2015–16, there were 15,767 ED presentations per 100,000 population in the most urgent triage categories 1–3. There were 19,745 fewer urgent triage 4 and 5 ED presentations per 100,000. Visits to GPs increased by 11% between 2010–11 and 2015–16 to 621,465 per 100,000 population. Over the same time period, the population of NSW increased by 7%.

5 Healthcare in Focus 2016 – How does NSW compare? bhi.nsw.gov.au
6Healthcare in Focus 2016 – How does NSW compare? bhi.nsw.gov.au
Setting the scene
7 Healthcare in Focus 2016 – How does NSW compare? bhi.nsw.gov.au
Healthcare in Focus is an annual publication that reports on the performance of the healthcare system in NSW. This year, it features about 140 measures, drawing on information from the Organisation for Economic Cooperation and Development (OECD), the 2016 Commonwealth Fund International Health Policy Survey of Adults, the Australian Bureau of Statistics, Australian Institute of Health and Welfare, NSW Patient Survey Program and NSW Ministry of Health datasets.
Each year the set of measures included in the report is reconfigured slightly. This provides an opportunity to cover different sub-populations, clinical conditions and topics. It means, however, that in any one year, a particular group or topic may appear to be under-represented.
This year’s report focuses on acute care. Some measures also address the intersection between hospital care and primary care and preventive services, community health services and long-term care. This recognises the importance of the healthcare system working as a whole to provide multidisciplinary care for patients as they move between different parts of the healthcare system.
The Equity chapter in this 2016 edition focuses on socioeconomic status (SES). Inequalities present one of the most significant public health challenges.1,2 The chapter provides an analysis of measures featured in other parts of the report, stratified into SES quintiles.
About this report
The measures included draw on two main types of data:
• Administrative data and medical records, which when analysed using valid and consistent methods, form the foundation for many measurement efforts. These data are amenable to comprehensive and standardised measurement approaches that support fair comparisons within and between jurisdictions.
• Survey data provide unique insights into patients’ experiences of care and healthcare performance. Patients, the central participants in healthcare, can describe the services they received, the way in which those services were delivered and the outcomes of care.
Structure of the report
The report begins with a brief synthesis of 10 key findings, drawn from the report to provide a snapshot of how the NSW healthcare system is performing. Following a summary and introductory section, detailed results are provided in six chapters that focus on the main dimensions of performance: accessibility, appropriateness, effectiveness, efficiency, equity and sustainability. NSW results for each chapter are placed in an international context with a summary graph based on interquartile ranges – identifying measures for which NSW is in the top 25% or bottom 25% of countries with available data. A summary for each chapter’s results stratified by SES is provided.
8Healthcare in Focus 2016 – How does NSW compare? bhi.nsw.gov.au
The NSW healthcare system
Here in NSW, the healthcare system is complex. Responsibilities for funding, management, delivery and regulation of care are shared across different layers of government; between public, private and not-for-profit sectors; and in community and hospital-based settings. The Commonwealth Government’s main responsibilities cover Medicare (the national scheme that provides free or subsidised access to primary care services) and the pharmaceutical benefits scheme (which subsidises access to prescription medicines). The state government’s responsibilities encompass the administration of public hospitals, community and mental health services, delivery of public health, ambulance and emergency services, patient transport and public dental clinics.
While each healthcare system has a unique set of structural, financial and regulatory arrangements to deliver care, meaningful comparisons of system performance are possible – particularly when those comparisons adopt a patient perspective. Measurement of how well patients’ needs and expectations were met – whether the right care was provided, at the right time, delivered in the right way, and resulted in improvements in patients’ health and wellbeing – can highlight relative strengths and weaknesses in system performance.
Making comparisons
International comparisons are increasingly seen as an essential part of performance measurement, helping to identify areas for health system improvement. Where data are available, NSW performance is compared with Australia and 10 other high-performing systems that participate in The Commonwealth Fund survey and provide data to the OECD. Response rates for the Commonwealth Fund International Health Policy Survey of Adults 2016 ranged from 11% in Norway to 47% in Switzerland. In Australia, the response rate was 25%.
In recent years, greater use of international comparisons has resulted in significant harmonisation of data definitions, measurement, analysis and reporting approaches.3,4,5 Nevertheless, there continue to be challenges with respect to international data comparability. Patient safety is a key area where there is wide variation in the quality of data across countries. This includes differences in coding practices and reporting. Some countries have more robust systems for reporting, and cultures where reporting of safety incidents is encouraged. As with all statistics, interpretation requires care.
Further information
The Technical Supplement provides further detail on data definitions and methods.
9 Healthcare in Focus 2016 – How does NSW compare? bhi.nsw.gov.au
Healthcare in Focus 2016 draws on a range of data sources. In addition to healthcare performance data already published by governments or journal articles (as referenced in figures and text), the primary sources of data used in the report include:
2016 Commonwealth Fund International Health Policy Survey of Adults
This survey assessed people’s experiences of healthcare. The sample was drawn from adults aged 18+ years in Australia, Canada, France, Germany, the Netherlands, New Zealand, Norway, Sweden, Switzerland, the United Kingdom and the United States.
In total, 26,863 adults were surveyed between March and June 2016. In Australia, 5,248 adults were surveyed, of which 3,835 were from NSW. The response rate in Australia was 25%. The response rates for all countries ranged from 11% in Norway to 47% in Switzerland.
Final samples were weighted to reflect the age, gender, education and geographic distribution of the adult population in each country.
For information on sample sizes and response rates for The Commonwealth Fund’s surveys, see the Technical Supplement.
Organisation for Economic Cooperation and Development (OECD)
The OECD Health Statistics online database provided indicator definitions and international data for mortality, hospitalisation, procedure and expenditure indicators. Figures included in report chapters draw on available data from the cohort of 11 countries that participate in the Commonwealth Fund International Policy Survey. Summary synthesis graphs, based on interquartile ranges, include available data from the 35 OECD countries. For more information on the synthesis and standardised score methods for the OECD and the Commonwealth Fund survey data see the Technical Supplement.
Australian Bureau of Statistics (ABS)
The ABS provided a customised report on NSW results from its 2015–16 Patient Experience Survey. The sample of 28,276 people aged 15+ years was weighted to represent the estimated population in private dwellings in each state and territory. The ABS also provided a customised report on causes of death in NSW for 2005–2015.
Australian Institute of Health and Welfare (AIHW)
The AIHW provided a customised report of health expenditures in NSW and Australia based on definitions that allow fair comparisons with OECD countries. AIHW reports were the source for Australian hospital statistics on emergency departments (EDs), elective surgery and admitted patients and radiotherapy statistics.
Australian Department of Health
The Australian Department of Health’s data collection on instances of primary healthcare service that are described by items in the Medicare Benefits Schedule (MBS) was used to report on the number of telehealth services in NSW.
Productivity Commission
The Productivity Commission’s Report on Government Services (RoGS) provided information on healthcare services.
Clinical Excellence Commission (CEC)
The CEC’s reports on the Incident Information Management System (IIMS) in NSW public hospitals provided information on hospital safety and quality.
Data sources and methods
10Healthcare in Focus 2016 – How does NSW compare? bhi.nsw.gov.au
Bureau of Health Information (BHI) NSW Patient Survey Program
The latest Adult Admitted Patient Survey includes responses from 28,391 patients admitted to NSW public hospitals between January and December 2015 (adjusted response rate 42%). The Emergency Department Patient Survey includes 23,810 patients who visited an ED in a NSW public hospital between July 2015 and June 2016 (adjusted response rate 26%). The Maternity Care Patient Survey includes 4,739 women who gave birth in a NSW public hospital during 2015 (response rate 36%). The Outpatient Cancer Clinics Survey includes 3,706 patients who visited a public outpatient cancer clinic during February and March 2015 (response rate 57%).
For more information on the NSW Patient Survey Program see: bhi.nsw.gov.au/nsw_ patient_survey_program
NSW Ministry of Health
Three key data sources were drawn on for utilisation and waiting time data: the NSW Admitted Patient Data Collection (APDC) (a count of all admitted patient services provided by public and private hospitals in the state); the Emergency Department Data Collection (EDDC) (a count of all emergency department services provided by public hospitals with electronic data collection); and the Waiting List Collection Online System (a count of patients waiting for planned treatment; it covers public patients, either at public hospitals or contracted to private hospitals).
For patient-level analyses, linked admitted patient, ED, fact of death and perinatal data were extracted from SAPHaRI, Centre for Epidemiology and Evidence.
NSW Ambulance
The NSW Ambulance Computer Aided Dispatch system, which records ambulance activity and time points across the patient journey, was used to report on ambulance performance.
Statistical Reporting
Differences in results are generally only discussed when they are statistically significant (i.e. 5% or less likelihood that the differences are due to chance). In graphical representations, statistically significant differences are denoted by an asterisk (*) or shading as noted.
For international survey data analyses, logistic regression was used to compare the performance of all other countries (and the ‘rest of Australia’) with NSW. While significance testing compared NSW results with the ‘rest of Australia’, the results for ‘Australia’ shown in figures and referred to in text are the national results. For patient survey analyses, results were denoted as significantly different from NSW if the 95% confidence intervals did not overlap.
Where the distribution of hospital results is provided, highlighted hospitals differ significantly from the NSW result based on non-overlapping 95% confidence intervals. Statistical significance is affected by sample size and so there may be some hospital results that appear to differ from the NSW result yet are not highlighted; this is a consequence of limited statistical power to detect differences in small samples.
Results are rounded to the nearest whole number, except where rounding would mask meaningful differences. Data are the most recent available.

11 Healthcare in Focus 2016 – How does NSW compare? bhi.nsw.gov.au
Example 1: Comparing NSW to OECD countries
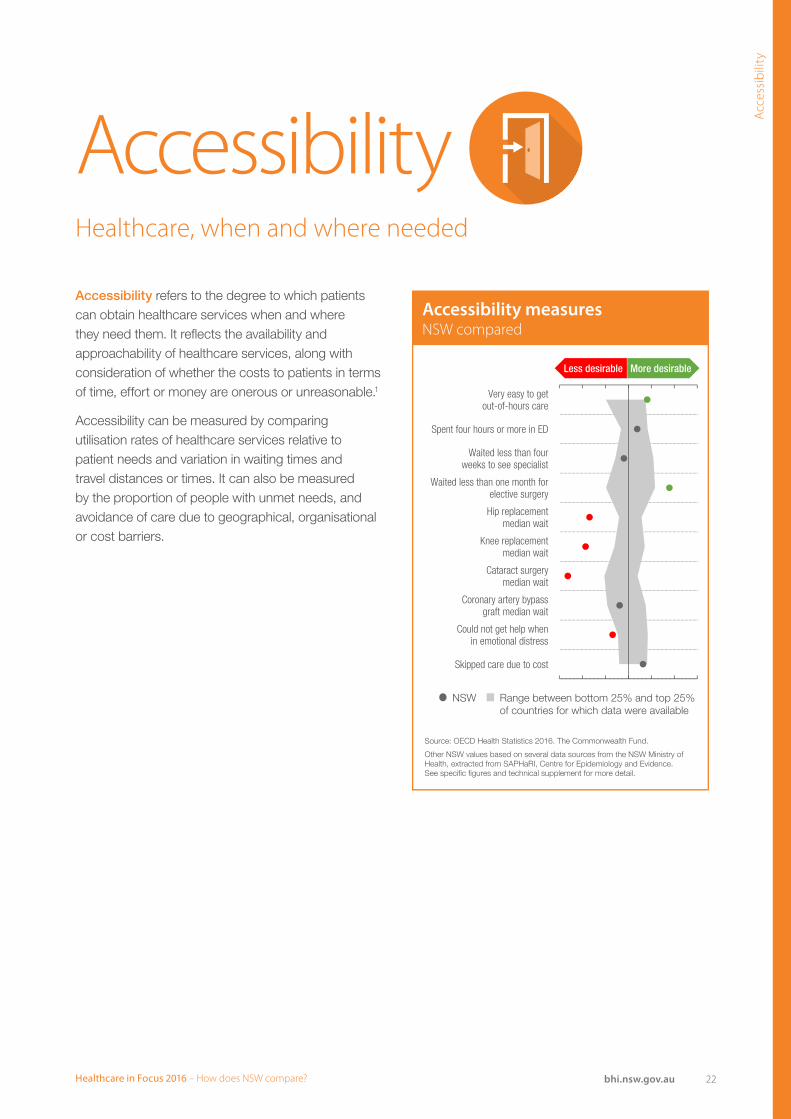
The graph displays the interquartile range of standardised country results for each given indicator, as a grey shaded area. The interquartile range describes the difference between the bottom 25% and top 25% of OECD countries for which data are available.
The country results have been standardised so multiple indicators can be presented on the one graph and NSW’s performance relative to other countries assessed. The standardised score for NSW is shown as a dot for each indicator. If the NSW score falls below the bottom 25th percentile a red dot indicates a less desirable result, and if it falls above the top 25th percentile a green dot indicates a more desirable result for NSW.
In this example, NSW had a desirable result for two indicators (green dots) and an undesirable result for four indicators (red dots). NSW performed within the interquartile range for four indicators (grey dots).
Interpreting selected graphs
Very easy to getout-of-hours care
Spent four hours or more in ED
Waited less than fourweeks to see specialist
Waited less than one month for elective surgery
Hip replacementmedian wait
Knee replacementmedian wait
Cataract surgerymedian wait
Coronary artery bypassgraft median wait
Could not get help whenin emotional distress
Skipped care due to cost
More desirableLess desirable
NSW Range between bottom 25% and top 25%of countries for which data were available
Source: OECD Health Statistics 2016. The Commonwealth Fund.
Other NSW values based on several data sources from the NSW Ministry of Health, extracted from SAPHaRI, Centre for Epidemiology and Evidence.See specific figures and technical supplement for more detail.
Accessibility measuresNSW compared
12Healthcare in Focus 2016 – How does NSW compare? bhi.nsw.gov.au
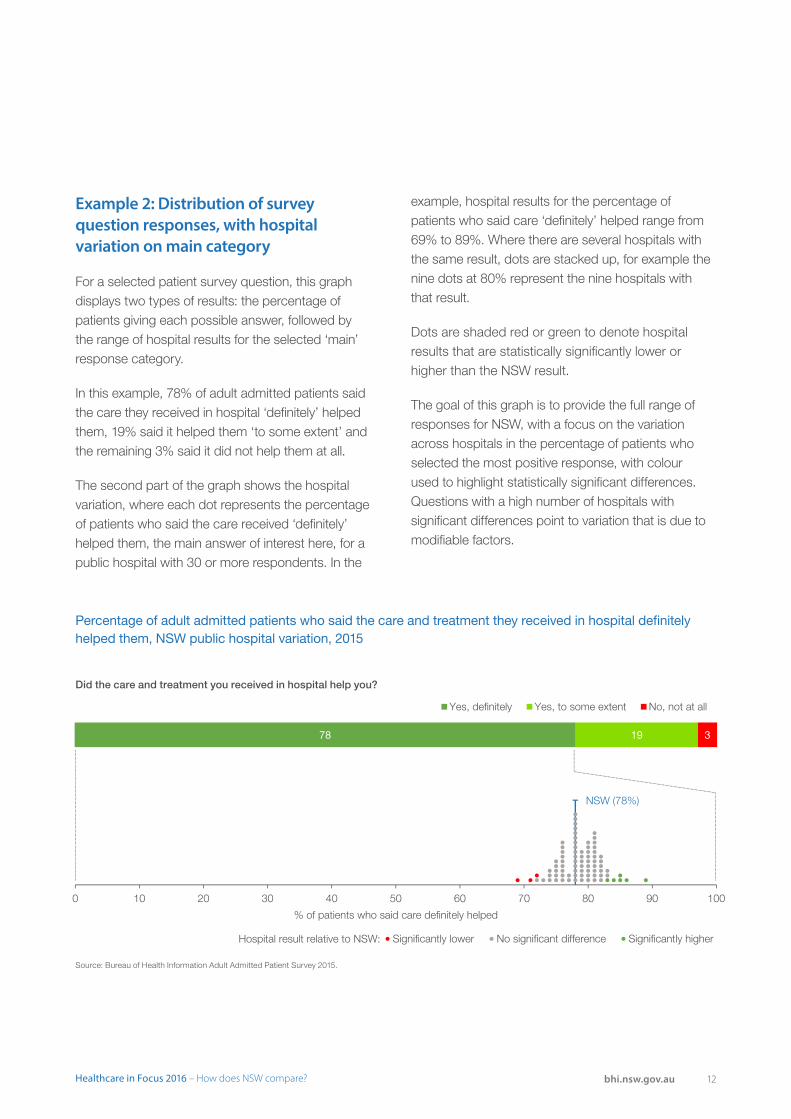
Example 2: Distribution of survey question responses, with hospital variation on main category
For a selected patient survey question, this graph displays two types of results: the percentage of patients giving each possible answer, followed by the range of hospital results for the selected ‘main’ response category.
In this example, 78% of adult admitted patients said the care they received in hospital ‘definitely’ helped them, 19% said it helped them ‘to some extent’ and the remaining 3% said it did not help them at all.
The second part of the graph shows the hospital variation, where each dot represents the percentage of patients who said the care received ‘definitely’ helped them, the main answer of interest here, for a public hospital with 30 or more respondents. In the
example, hospital results for the percentage of patients who said care ‘definitely’ helped range from 69% to 89%. Where there are several hospitals with the same result, dots are stacked up, for example the nine dots at 80% represent the nine hospitals with that result.
Dots are shaded red or green to denote hospital results that are statistically significantly lower or higher than the NSW result.
The goal of this graph is to provide the full range of responses for NSW, with a focus on the variation across hospitals in the percentage of patients who selected the most positive response, with colour used to highlight statistically significant differences. Questions with a high number of hospitals with significant differences point to variation that is due to modifiable factors.
NSW (78%)
0 10 20 30 40 50 60 70 80 90 100
% of patients who said care definitely helped
Significantly lower No significant difference Significantly higher
78 19 3
Yes, definitely Yes, to some extent No, not at all
Hospital result relative to NSW:
Percentage of adult admitted patients who said the care and treatment they received in hospital definitely helped them, NSW public hospital variation, 2015
Did the care and treatment you received in hospital help you?
Source: Bureau of Health Information Adult Admitted Patient Survey 2015.
13 Healthcare in Focus 2016 – How does NSW compare? bhi.nsw.gov.au
Healthcare in Focus contributes to two important functions of the Bureau of Health Information (BHI). First, it informs the people of NSW about healthcare performance in the state. It addresses the question ‘how does NSW compare?’ – contextualising performance by providing information about how other systems perform, relative to NSW. Second, it addresses the question ‘where to look?’ – identifying opportunities to improve care. Here, international comparisons quantify potential gains – how far is NSW from the top performing countries? The report also examines, for a selection of measures, the extent of variation within NSW – across hospitals or regions. Here too, it can inform improvement – identifying areas where there is significant variation across the state and potential for future improvements in performance.
How to assess performance?
Healthcare services are shaped, directly and indirectly, by a wide array of organisations and professionals working with patients. Together, they perform a huge variety and volume of tasks to diagnose, deliver, support, guide, and assure provision of care that improves people’s health. Because healthcare is complex, performance measurement requires a systematic and balanced approach; one that includes sufficient measures to reflect the diversity of the system.
Applying a frameworkTo know where NSW stands; and guide performance assessment
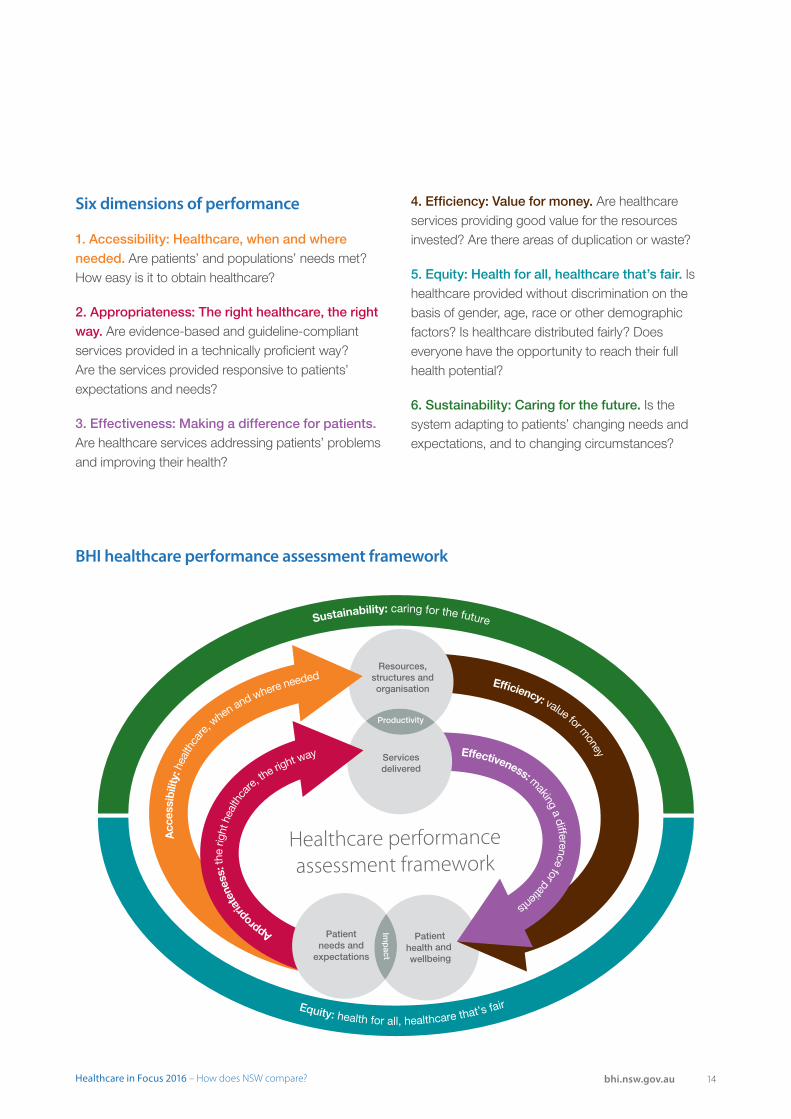
If it is to be coherent, comprehensive and concise, healthcare performance assessment must be guided by a clear framework: one structured around key dimensions of performance.6,7,8 The BHI framework is an analytical tool that guides assessment, by describing key dimensions of performance and organising them into a logical structure. It was developed following a review of performance assessment approaches, models and frameworks in use across different jurisdictions, nationally and internationally.9
The framework uses counts, or measures of inputs, outputs and outcomes, as a starting point for assessment – providing a description of what was done. These counts are clustered into four categories: patient needs and expectations; services delivered; resources, structures and organisation of the system; and health and wellbeing of the population.
Comprehensive assessment goes beyond consideration of what was done, to focus on questions of how well it was done and the outcomes of the recipients of the care. Performance – achieving goals, adding value, balancing priorities, responding to context – is captured in constructs that link healthcare inputs, outputs and outcomes. These constructs, or dimensions of performance – accessibility, appropriateness, effectiveness, efficiency, equity and sustainability – are explored through a series of questions, and form the themes for the report.
14Healthcare in Focus 2016 – How does NSW compare? bhi.nsw.gov.au
Six dimensions of performance
1. Accessibility: Healthcare, when and where needed. Are patients’ and populations’ needs met? How easy is it to obtain healthcare?
2. Appropriateness: The right healthcare, the right way. Are evidence-based and guideline-compliant services provided in a technically proficient way? Are the services provided responsive to patients’ expectations and needs?
3. Effectiveness: Making a difference for patients. Are healthcare services addressing patients’ problems and improving their health?
4. Efficiency: Value for money. Are healthcare services providing good value for the resources invested? Are there areas of duplication or waste?
5. Equity: Health for all, healthcare that’s fair. Is healthcare provided without discrimination on the basis of gender, age, race or other demographic factors? Is healthcare distributed fairly? Does everyone have the opportunity to reach their full health potential?
6. Sustainability: Caring for the future. Is the system adapting to patients’ changing needs and expectations, and to changing circumstances?
Resources,structures andorganisation
Servicesdelivered
Productivity
Healthcare performanceassessment framework
Patienthealth and wellbeing
Patientneeds and
expectations
Imp
act
Appropr
iate
ness
: the
righ
t hea
lthca
re, th
e right way
Acc
essi
bilit
y: h
ealth
care
, when and where needed Efficiency: value for m
oney Effectiveness: making a difference for patients
Sustainability: caring for the future
Equity: health for all, healthcare that’s fair
BHI healthcare performance assessment framework
15 Healthcare in Focus 2016 – How does NSW compare? bhi.nsw.gov.au
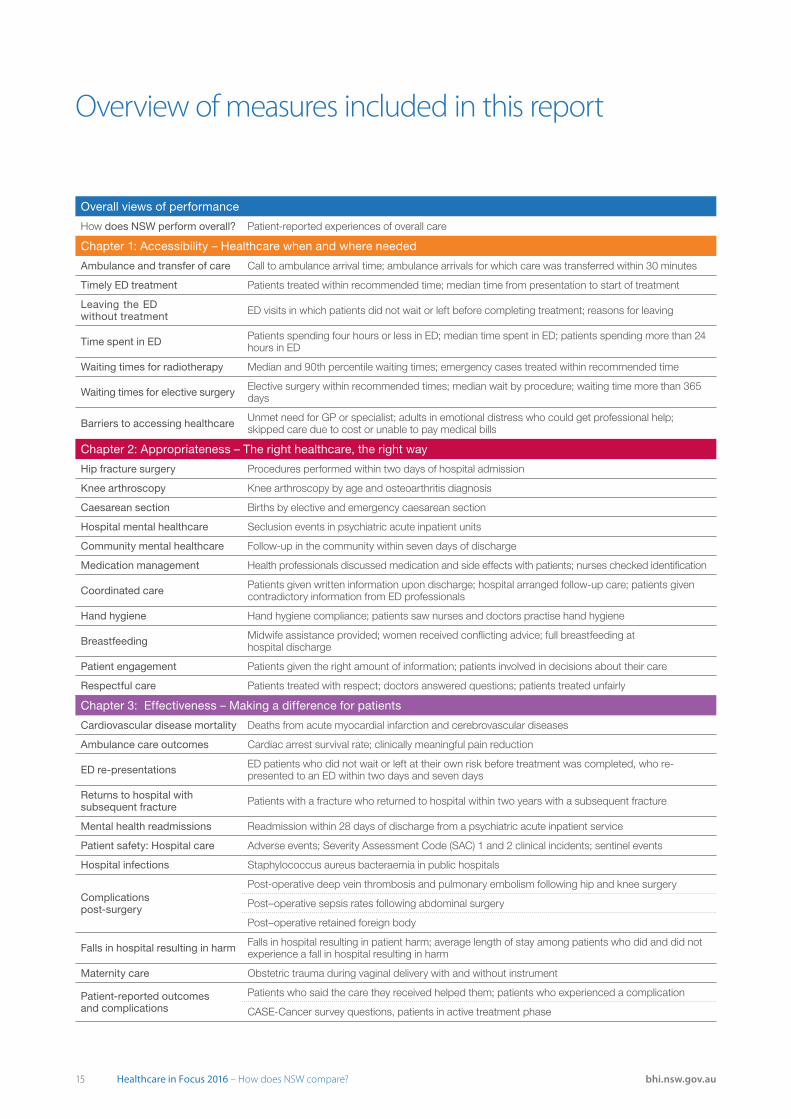
Overview of measures included in this report
Overall views of performance
How does NSW perform overall? Patient-reported experiences of overall care
Chapter 1: Accessibility – Healthcare when and where needed
Ambulance and transfer of care Call to ambulance arrival time; ambulance arrivals for which care was transferred within 30 minutes
Timely ED treatment Patients treated within recommended time; median time from presentation to start of treatment
Leaving the ED without treatment ED visits in which patients did not wait or left before completing treatment; reasons for leaving
Time spent in ED Patients spending four hours or less in ED; median time spent in ED; patients spending more than 24 hours in ED
Waiting times for radiotherapy Median and 90th percentile waiting times; emergency cases treated within recommended time
Waiting times for elective surgery Elective surgery within recommended times; median wait by procedure; waiting time more than 365 days
Barriers to accessing healthcare Unmet need for GP or specialist; adults in emotional distress who could get professional help; skipped care due to cost or unable to pay medical bills
Chapter 2: Appropriateness – The right healthcare, the right way
Hip fracture surgery Procedures performed within two days of hospital admission
Knee arthroscopy Knee arthroscopy by age and osteoarthritis diagnosis
Caesarean section Births by elective and emergency caesarean section
Hospital mental healthcare Seclusion events in psychiatric acute inpatient units
Community mental healthcare Follow-up in the community within seven days of discharge
Medication management Health professionals discussed medication and side effects with patients; nurses checked identification
Coordinated care Patients given written information upon discharge; hospital arranged follow-up care; patients given contradictory information from ED professionals
Hand hygiene Hand hygiene compliance; patients saw nurses and doctors practise hand hygiene
Breastfeeding Midwife assistance provided; women received conflicting advice; full breastfeeding at hospital discharge
Patient engagement Patients given the right amount of information; patients involved in decisions about their care
Respectful care Patients treated with respect; doctors answered questions; patients treated unfairly
Chapter 3: Effectiveness – Making a difference for patients
Cardiovascular disease mortality Deaths from acute myocardial infarction and cerebrovascular diseases
Ambulance care outcomes Cardiac arrest survival rate; clinically meaningful pain reduction
ED re-presentations ED patients who did not wait or left at their own risk before treatment was completed, who re-presented to an ED within two days and seven days
Returns to hospital with subsequent fracture Patients with a fracture who returned to hospital within two years with a subsequent fracture
Mental health readmissions Readmission within 28 days of discharge from a psychiatric acute inpatient service
Patient safety: Hospital care Adverse events; Severity Assessment Code (SAC) 1 and 2 clinical incidents; sentinel events
Hospital infections Staphylococcus aureus bacteraemia in public hospitals
Complications post-surgery
Post-operative deep vein thrombosis and pulmonary embolism following hip and knee surgery
Post–operative sepsis rates following abdominal surgery
Post–operative retained foreign body
Falls in hospital resulting in harm Falls in hospital resulting in patient harm; average length of stay among patients who did and did not experience a fall in hospital resulting in harm
Maternity care Obstetric trauma during vaginal delivery with and without instrument
Patient-reported outcomes and complications
Patients who said the care they received helped them; patients who experienced a complication
CASE-Cancer survey questions, patients in active treatment phase
16Healthcare in Focus 2016 – How does NSW compare? bhi.nsw.gov.au
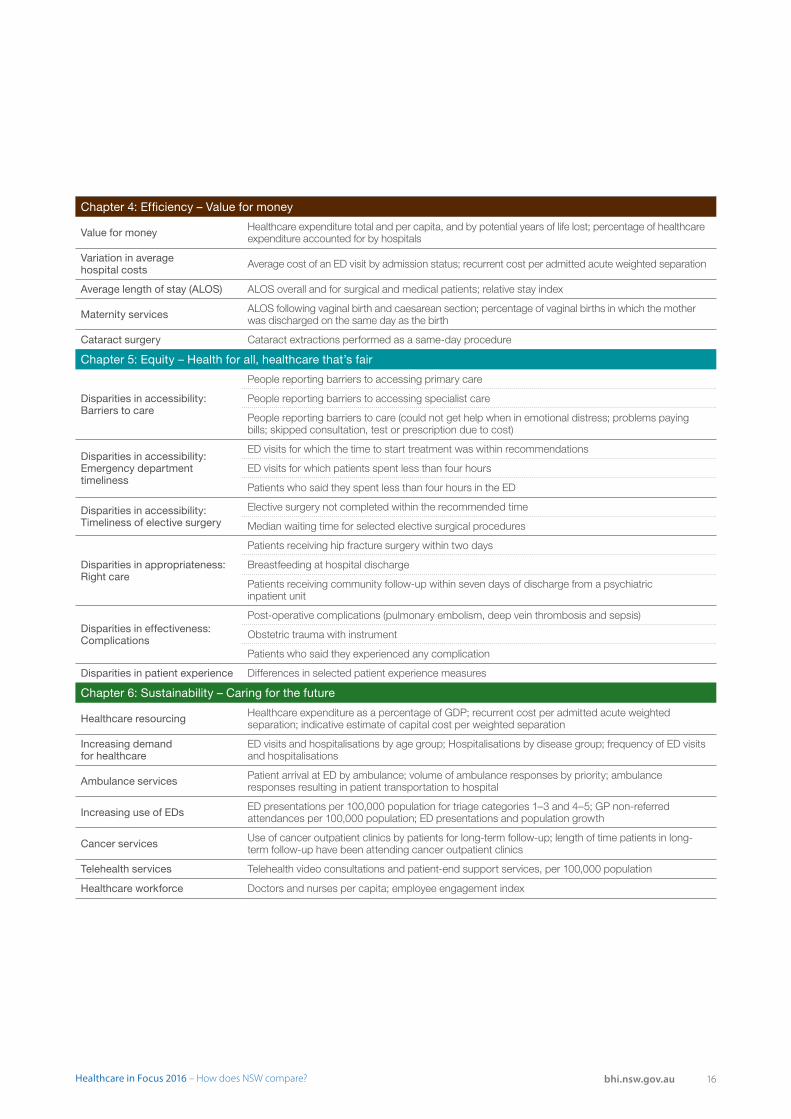
Chapter 4: Efficiency – Value for money
Value for money Healthcare expenditure total and per capita, and by potential years of life lost; percentage of healthcare expenditure accounted for by hospitals
Variation in average hospital costs Average cost of an ED visit by admission status; recurrent cost per admitted acute weighted separation
Average length of stay (ALOS) ALOS overall and for surgical and medical patients; relative stay index
Maternity services ALOS following vaginal birth and caesarean section; percentage of vaginal births in which the mother was discharged on the same day as the birth
Cataract surgery Cataract extractions performed as a same-day procedure
Chapter 5: Equity – Health for all, healthcare that’s fair
Disparities in accessibility: Barriers to care
People reporting barriers to accessing primary care
People reporting barriers to accessing specialist care
People reporting barriers to care (could not get help when in emotional distress; problems paying bills; skipped consultation, test or prescription due to cost)
Disparities in accessibility: Emergency department timeliness
ED visits for which the time to start treatment was within recommendations
ED visits for which patients spent less than four hours
Patients who said they spent less than four hours in the ED
Disparities in accessibility: Timeliness of elective surgery
Elective surgery not completed within the recommended time
Median waiting time for selected elective surgical procedures
Disparities in appropriateness: Right care
Patients receiving hip fracture surgery within two days
Breastfeeding at hospital discharge
Patients receiving community follow-up within seven days of discharge from a psychiatric inpatient unit
Disparities in effectiveness: Complications
Post-operative complications (pulmonary embolism, deep vein thrombosis and sepsis)
Obstetric trauma with instrument
Patients who said they experienced any complication
Disparities in patient experience Differences in selected patient experience measures
Chapter 6: Sustainability – Caring for the future
Healthcare resourcing Healthcare expenditure as a percentage of GDP; recurrent cost per admitted acute weighted separation; indicative estimate of capital cost per weighted separation
Increasing demand for healthcare
ED visits and hospitalisations by age group; Hospitalisations by disease group; frequency of ED visits and hospitalisations
Ambulance services Patient arrival at ED by ambulance; volume of ambulance responses by priority; ambulance responses resulting in patient transportation to hospital
Increasing use of EDs ED presentations per 100,000 population for triage categories 1–3 and 4–5; GP non-referred attendances per 100,000 population; ED presentations and population growth
Cancer services Use of cancer outpatient clinics by patients for long-term follow-up; length of time patients in long-term follow-up have been attending cancer outpatient clinics
Telehealth services Telehealth video consultations and patient-end support services, per 100,000 population
Healthcare workforce Doctors and nurses per capita; employee engagement index

17 Healthcare in Focus 2016 – How does NSW compare? bhi.nsw.gov.au
18Healthcare in Focus 2016 – How does NSW compare? bhi.nsw.gov.au
Overall views of performance
19 Healthcare in Focus 2016 – How does NSW compare? bhi.nsw.gov.au
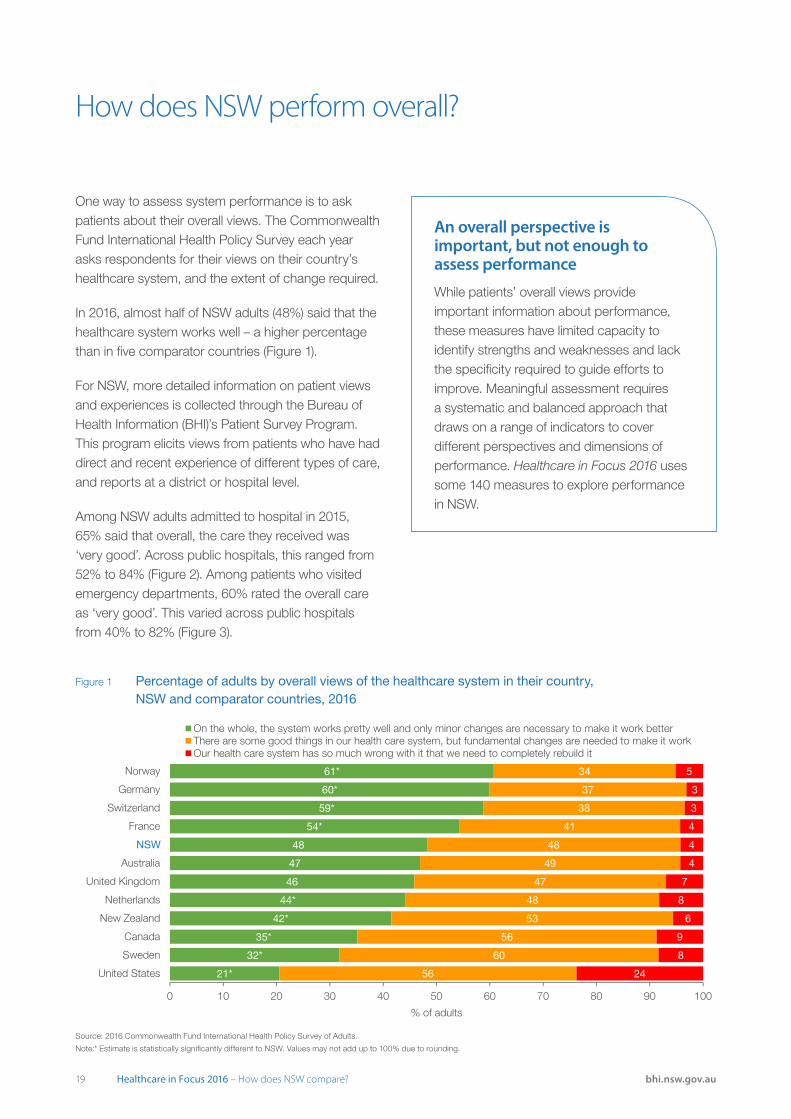
One way to assess system performance is to ask patients about their overall views. The Commonwealth Fund International Health Policy Survey each year asks respondents for their views on their country’s healthcare system, and the extent of change required.
In 2016, almost half of NSW adults (48%) said that the healthcare system works well – a higher percentage than in five comparator countries (Figure 1).
For NSW, more detailed information on patient views and experiences is collected through the Bureau of Health Information (BHI)’s Patient Survey Program. This program elicits views from patients who have had direct and recent experience of different types of care, and reports at a district or hospital level.
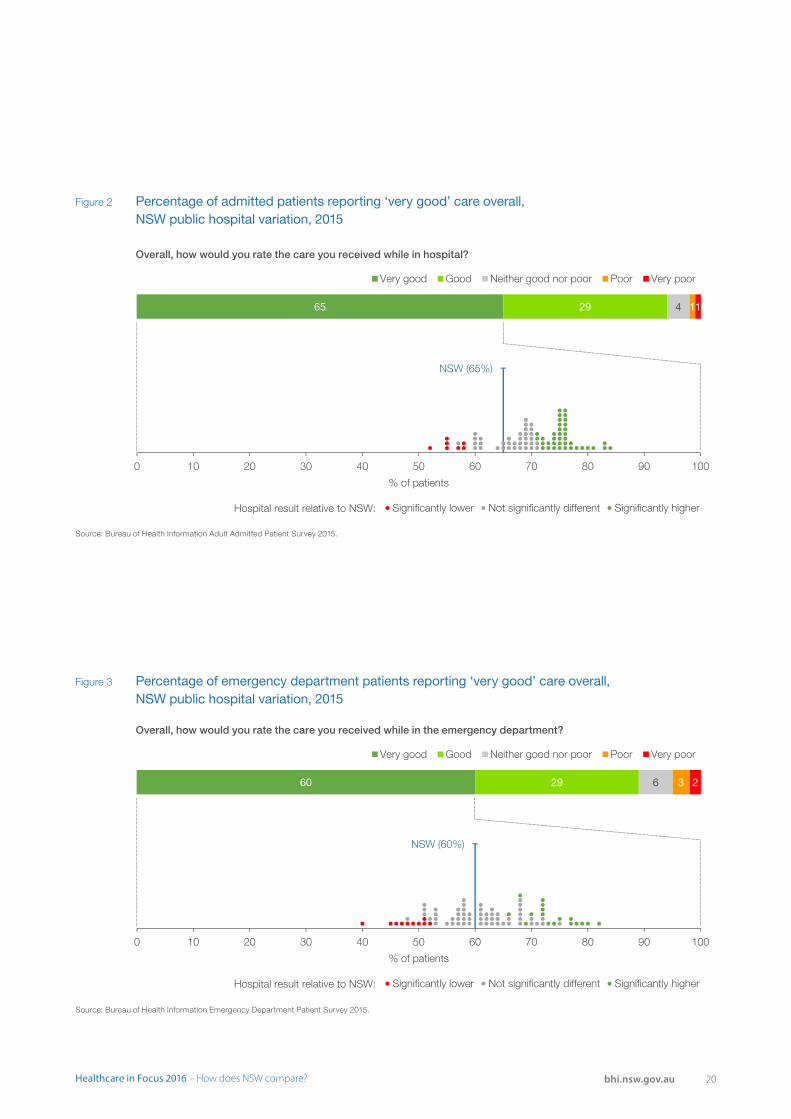
Among NSW adults admitted to hospital in 2015, 65% said that overall, the care they received was ‘very good’. Across public hospitals, this ranged from 52% to 84% (Figure 2). Among patients who visited emergency departments, 60% rated the overall care as ‘very good’. This varied across public hospitals from 40% to 82% (Figure 3).
How does NSW perform overall?
An overall perspective is important, but not enough to assess performance
While patients’ overall views provide important information about performance, these measures have limited capacity to identify strengths and weaknesses and lack the specificity required to guide efforts to improve. Meaningful assessment requires a systematic and balanced approach that draws on a range of indicators to cover different perspectives and dimensions of performance. Healthcare in Focus 2016 uses some 140 measures to explore performance in NSW.
Figure 1 Percentage of adults by overall views of the healthcare system in their country, NSW and comparator countries, 2016
21*
32*
35*
42*
44*
46
47
48
54*
59*
60*
61*
56
60
56
53
48
47
49
48
41
38
37
34
24
8
9
6
8
7
4
4
4
3
3
5
0 10 20 30 40 50 60 70 80 90 100
United States
Sweden
Canada
New Zealand
Netherlands
United Kingdom
Australia
France
Switzerland
Germany
Norway
% of adults
On the whole, the system works pretty well and only minor changes are necessary to make it work betterThere are some good things in our health care system, but fundamental changes are needed to make it workOur health care system has so much wrong with it that we need to completely rebuild it
NSW
Source: 2016 Commonwealth Fund International Health Policy Survey of Adults.
Note:* Estimate is statistically significantly different to NSW. Values may not add up to 100% due to rounding.
20Healthcare in Focus 2016 – How does NSW compare? bhi.nsw.gov.au
Figure 2 Percentage of admitted patients reporting ‘very good’ care overall, NSW public hospital variation, 2015
NSW (65%)
0 10 20 30 40 50 60 70 80 90 100
% of patients
Significantly lower Not significantly different Significantly higher
65 29 4 11
Very good Good Neither good nor poor Poor Very poor
Hospital result relative to NSW:
Source: Bureau of Health Information Adult Admitted Patient Survey 2015.
Overall, how would you rate the care you received while in hospital?
NSW (60%)
0 10 20 30 40 50 60 70 80 90 100
% of patients
Significantly lower Not significantly different Significantly higher
60 29 6 3 2
Very good Good Neither good nor poor Poor Very poor
Hospital result relative to NSW:
Figure 3 Percentage of emergency department patients reporting ‘very good’ care overall, NSW public hospital variation, 2015
Source: Bureau of Health Information Emergency Department Patient Survey 2015.
Overall, how would you rate the care you received while in the emergency department?

21 Healthcare in Focus 2016 – How does NSW compare? bhi.nsw.gov.au
AccessibilityHealthcare, when and where needed
22Healthcare in Focus 2016 – How does NSW compare? bhi.nsw.gov.au
Acc
essi
bili
ty
AccessibilityHealthcare, when and where needed
Accessibility refers to the degree to which patients can obtain healthcare services when and where they need them. It reflects the availability and approachability of healthcare services, along with consideration of whether the costs to patients in terms of time, effort or money are onerous or unreasonable.1
Accessibility can be measured by comparing utilisation rates of healthcare services relative to patient needs and variation in waiting times and travel distances or times. It can also be measured by the proportion of people with unmet needs, and avoidance of care due to geographical, organisational or cost barriers.
Very easy to getout-of-hours care
Spent four hours or more in ED
Waited less than fourweeks to see specialist
Waited less than one month for elective surgery
Hip replacementmedian wait
Knee replacementmedian wait
Cataract surgerymedian wait
Coronary artery bypassgraft median wait
Could not get help whenin emotional distress
Skipped care due to cost
More desirableLess desirable
NSW Range between bottom 25% and top 25%of countries for which data were available
Source: OECD Health Statistics 2016. The Commonwealth Fund.
Other NSW values based on several data sources from the NSW Ministry of Health, extracted from SAPHaRI, Centre for Epidemiology and Evidence.See specific figures and technical supplement for more detail.
Accessibility measuresNSW compared
23 Healthcare in Focus 2016 – How does NSW compare? bhi.nsw.gov.au
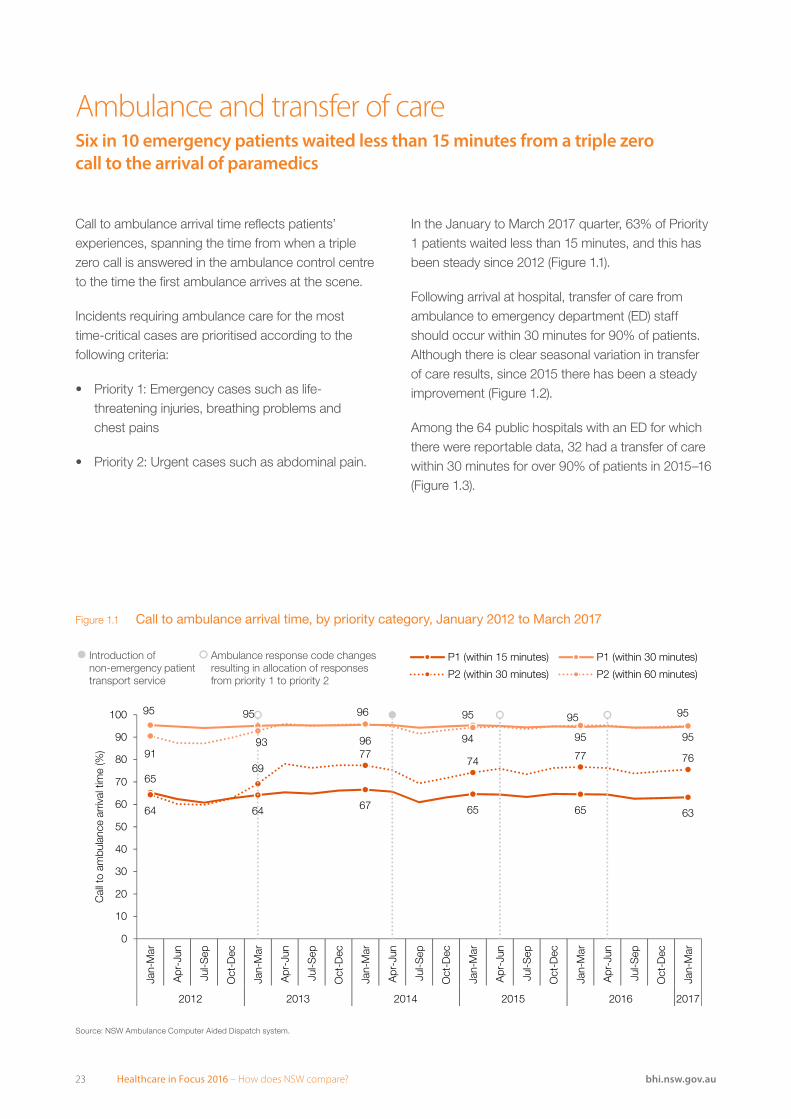
Call to ambulance arrival time reflects patients’ experiences, spanning the time from when a triple zero call is answered in the ambulance control centre to the time the first ambulance arrives at the scene.
Incidents requiring ambulance care for the most time-critical cases are prioritised according to the following criteria:
• Priority 1: Emergency cases such as life-threatening injuries, breathing problems and chest pains
• Priority 2: Urgent cases such as abdominal pain.
In the January to March 2017 quarter, 63% of Priority 1 patients waited less than 15 minutes, and this has been steady since 2012 (Figure 1.1).
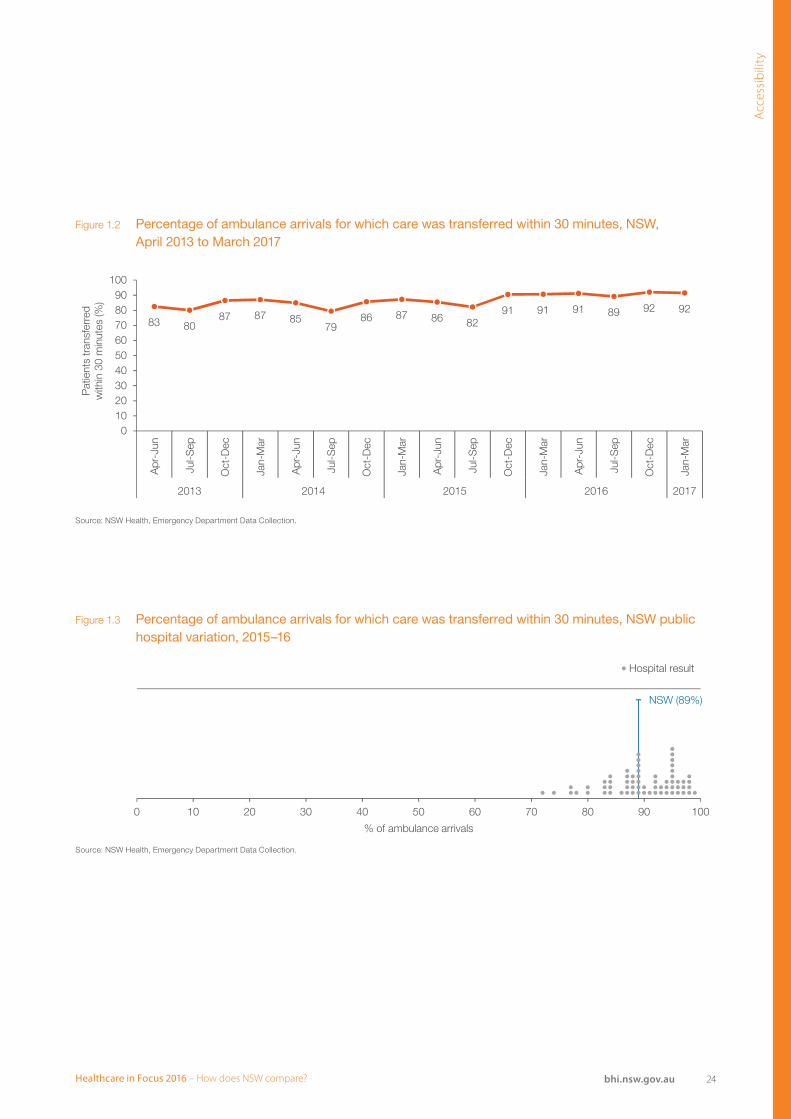
Following arrival at hospital, transfer of care from ambulance to emergency department (ED) staff should occur within 30 minutes for 90% of patients. Although there is clear seasonal variation in transfer of care results, since 2015 there has been a steady improvement (Figure 1.2).
Among the 64 public hospitals with an ED for which there were reportable data, 32 had a transfer of care within 30 minutes for over 90% of patients in 2015–16 (Figure 1.3).
Figure 1.1 Call to ambulance arrival time, by priority category, January 2012 to March 2017
Ambulance and transfer of careSix in 10 emergency patients waited less than 15 minutes from a triple zero call to the arrival of paramedics
65
64 67 65 65 63
95 95
96
95
95 95
64
6977
74 77 769193
96
94
95 95
0
10
20
30
40
50
60
70
80
90
100
Jan-
Mar
Apr
-Jun
Jul-S
ep
Oct
-Dec
Jan-
Mar
Apr
-Jun
Jul-S
ep
Oct
-Dec
Jan-
Mar
Apr
-Jun
Jul-S
ep
Oct
-Dec
Jan-
Mar
Apr
-Jun
Jul-S
ep
Oct
-Dec
Jan-
Mar
Apr
-Jun
Jul-S
ep
Oct
-Dec
Jan-
Mar
2012 2013 2014 2015 2016 2017
Cal
l to
ambu
lanc
e ar
rival
tim
e (%
)
P1 (within 15 minutes) P1 (within 30 minutes)
P2 (within 30 minutes) P2 (within 60 minutes)
Introduction ofnon-emergency patienttransport service
Ambulance response code changesresulting in allocation of responsesfrom priority 1 to priority 2
Source: NSW Ambulance Computer Aided Dispatch system.
24Healthcare in Focus 2016 – How does NSW compare? bhi.nsw.gov.au
Acc
essi
bili
ty
Figure 1.2 Percentage of ambulance arrivals for which care was transferred within 30 minutes, NSW, April 2013 to March 2017
83 8087 87 85
7986 87 86 82
91 91 91 89 92 92
0102030405060708090
100
Apr
-Jun
Jul-S
ep
Oct
-Dec
Jan-
Mar
Apr
-Jun
Jul-S
ep
Oct
-Dec
Jan-
Mar
Apr
-Jun
Jul-S
ep
Oct
-Dec
Jan-
Mar
Apr
-Jun
Jul-S
ep
Oct
-Dec
Jan-
Mar
2013 2014 2015 2016 2017
Pat
ient
s tr
ansf
erre
dw
ithin
30
min
utes
(%)
Figure 1.3 Percentage of ambulance arrivals for which care was transferred within 30 minutes, NSW public hospital variation, 2015–16
NSW (89%)
0 10 20 30 40 50 60 70 80 90 100
% of ambulance arrivals
Hospital result
Source: NSW Health, Emergency Department Data Collection.
Source: NSW Health, Emergency Department Data Collection.
25 Healthcare in Focus 2016 – How does NSW compare? bhi.nsw.gov.au
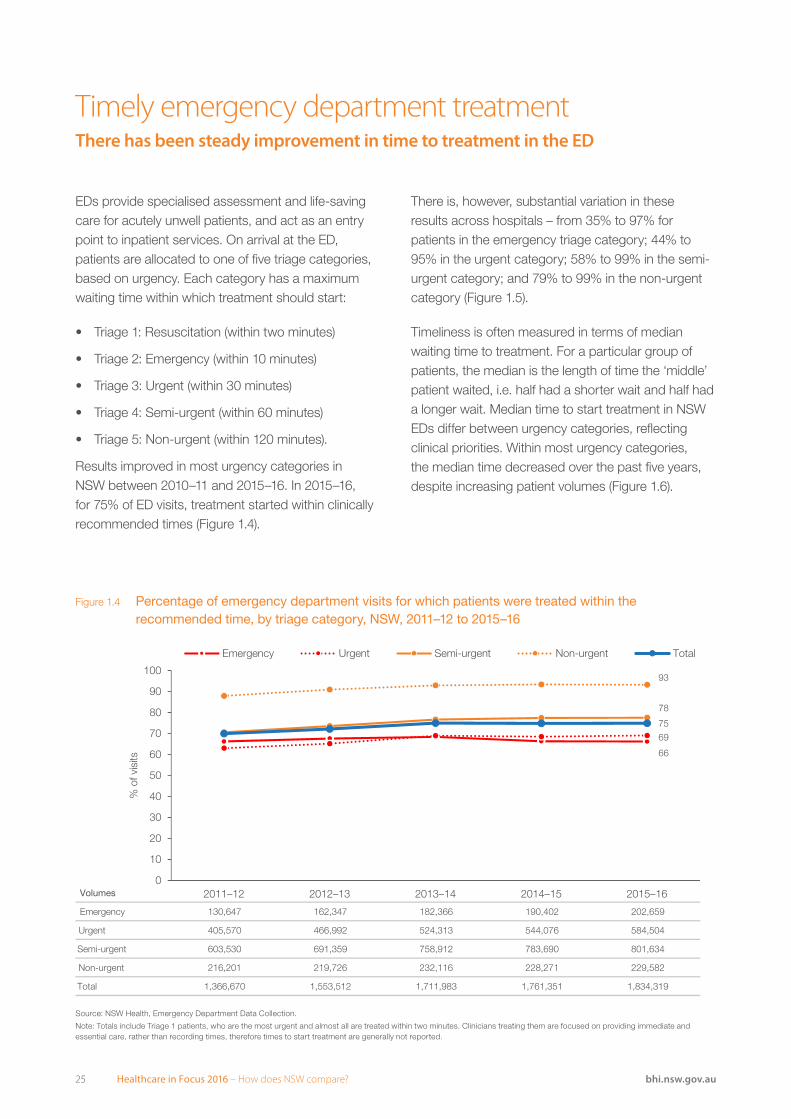
EDs provide specialised assessment and life-saving care for acutely unwell patients, and act as an entry point to inpatient services. On arrival at the ED, patients are allocated to one of five triage categories, based on urgency. Each category has a maximum waiting time within which treatment should start:
• Triage 1: Resuscitation (within two minutes)
• Triage 2: Emergency (within 10 minutes)
• Triage 3: Urgent (within 30 minutes)
• Triage 4: Semi-urgent (within 60 minutes)
• Triage 5: Non-urgent (within 120 minutes).
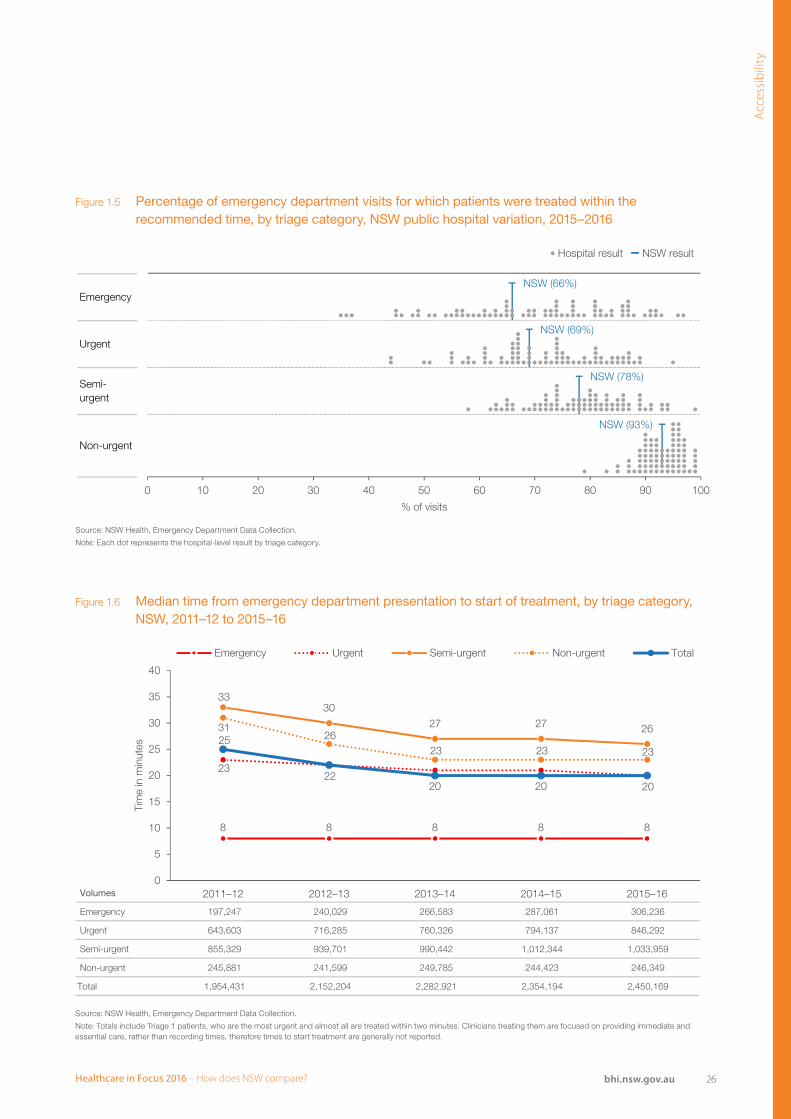
Results improved in most urgency categories in NSW between 2010–11 and 2015–16. In 2015–16, for 75% of ED visits, treatment started within clinically recommended times (Figure 1.4).
There is, however, substantial variation in these results across hospitals – from 35% to 97% for patients in the emergency triage category; 44% to 95% in the urgent category; 58% to 99% in the semi-urgent category; and 79% to 99% in the non-urgent category (Figure 1.5).
Timeliness is often measured in terms of median waiting time to treatment. For a particular group of patients, the median is the length of time the ‘middle’ patient waited, i.e. half had a shorter wait and half had a longer wait. Median time to start treatment in NSW EDs differ between urgency categories, reflecting clinical priorities. Within most urgency categories, the median time decreased over the past five years, despite increasing patient volumes (Figure 1.6).
Figure 1.4 Percentage of emergency department visits for which patients were treated within the recommended time, by triage category, NSW, 2011–12 to 2015–16
Volumes
Emergency 130,647 162,347 182,366 190,402 202,659
Urgent 405,570 466,992 524,313 544,076 584,504
Semi-urgent 603,530 691,359 758,912 783,690 801,634
Non-urgent 216,201 219,726 232,116 228,271 229,582
Total 1,366,670 1,553,512 1,711,983 1,761,351 1,834,319
66
69
78
93
75
0
10
20
30
40
50
60
70
80
90
100
2011–12 2012–13 2013–14 2014–15 2015–16
% o
f vis
its
Emergency Urgent Semi-urgent Non-urgent Total
Timely emergency department treatmentThere has been steady improvement in time to treatment in the ED
Source: NSW Health, Emergency Department Data Collection.
Note: Totals include Triage 1 patients, who are the most urgent and almost all are treated within two minutes. Clinicians treating them are focused on providing immediate and essential care, rather than recording times, therefore times to start treatment are generally not reported.
26Healthcare in Focus 2016 – How does NSW compare? bhi.nsw.gov.au
Acc
essi
bili
ty
Emergency
Urgent
Semi-urgent
Non-urgent
NSW (66%)
Hospital result NSW result
NSW (69%)
NSW (78%)
NSW (93%)
0 10 20 30 40 50 60 70 80 90 100
% of visits
Figure 1.5 Percentage of emergency department visits for which patients were treated within the recommended time, by triage category, NSW public hospital variation, 2015–2016
Figure 1.6 Median time from emergency department presentation to start of treatment, by triage category, NSW, 2011–12 to 2015–16
Volumes
Emergency 197,247 240,029 266,583 287,061 306,236
Urgent 643,603 716,285 760,326 794,137 846,292
Semi-urgent 855,329 939,701 990,442 1,012,344 1,033,959
Non-urgent 245,881 241,599 249,785 244,423 246,349
Total 1,954,431 2,152,204 2,282,921 2,354,194 2,450,169
8 8 8 8 8
2322
20
3330
27 27 263126
23 23 2325
20 20
0
5
10
15
20
25
30
35
40
2011–12 2012–13 2013–14 2014–15 2015–16
Tim
e in
min
utes
Emergency Urgent Semi-urgent Non-urgent Total
Source: NSW Health, Emergency Department Data Collection.
Note: Each dot represents the hospital-level result by triage category.
Source: NSW Health, Emergency Department Data Collection.
Note: Totals include Triage 1 patients, who are the most urgent and almost all are treated within two minutes. Clinicians treating them are focused on providing immediate and essential care, rather than recording times, therefore times to start treatment are generally not reported.
27 Healthcare in Focus 2016 – How does NSW compare? bhi.nsw.gov.au
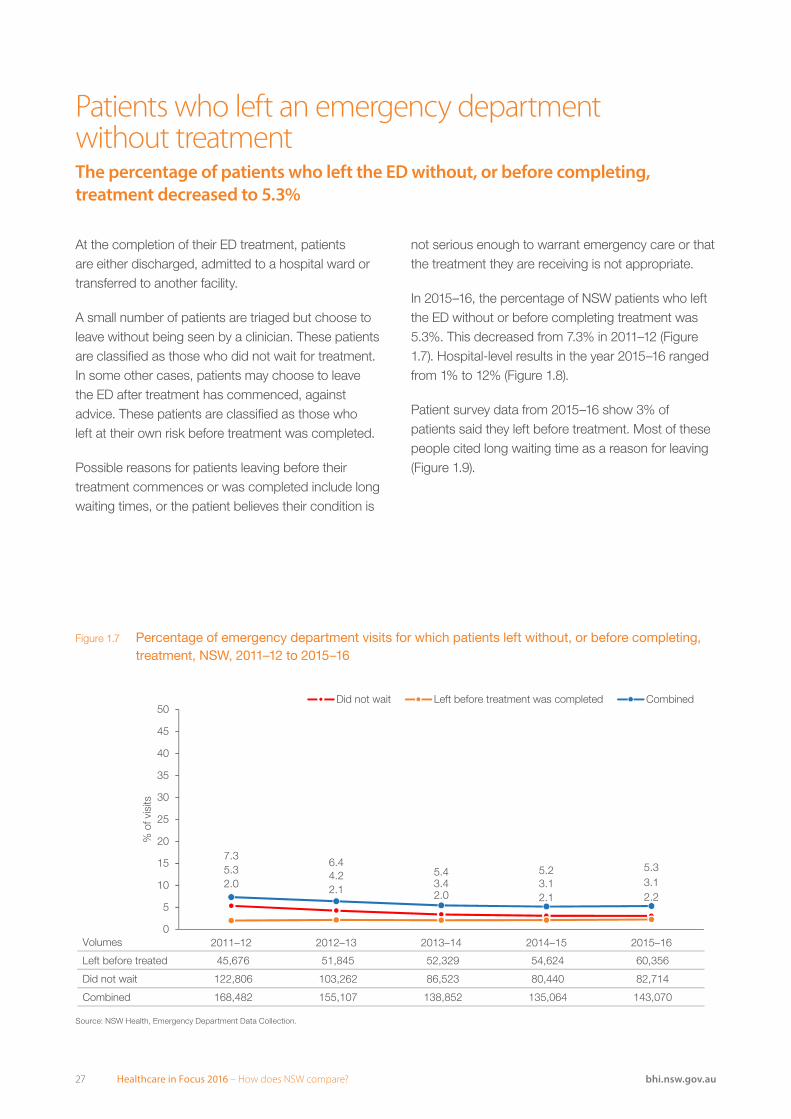
At the completion of their ED treatment, patients are either discharged, admitted to a hospital ward or transferred to another facility.
A small number of patients are triaged but choose to leave without being seen by a clinician. These patients are classified as those who did not wait for treatment. In some other cases, patients may choose to leave the ED after treatment has commenced, against advice. These patients are classified as those who left at their own risk before treatment was completed.
Possible reasons for patients leaving before their treatment commences or was completed include long waiting times, or the patient believes their condition is
Patients who left an emergency department without treatmentThe percentage of patients who left the ED without, or before completing, treatment decreased to 5.3%
not serious enough to warrant emergency care or that the treatment they are receiving is not appropriate.
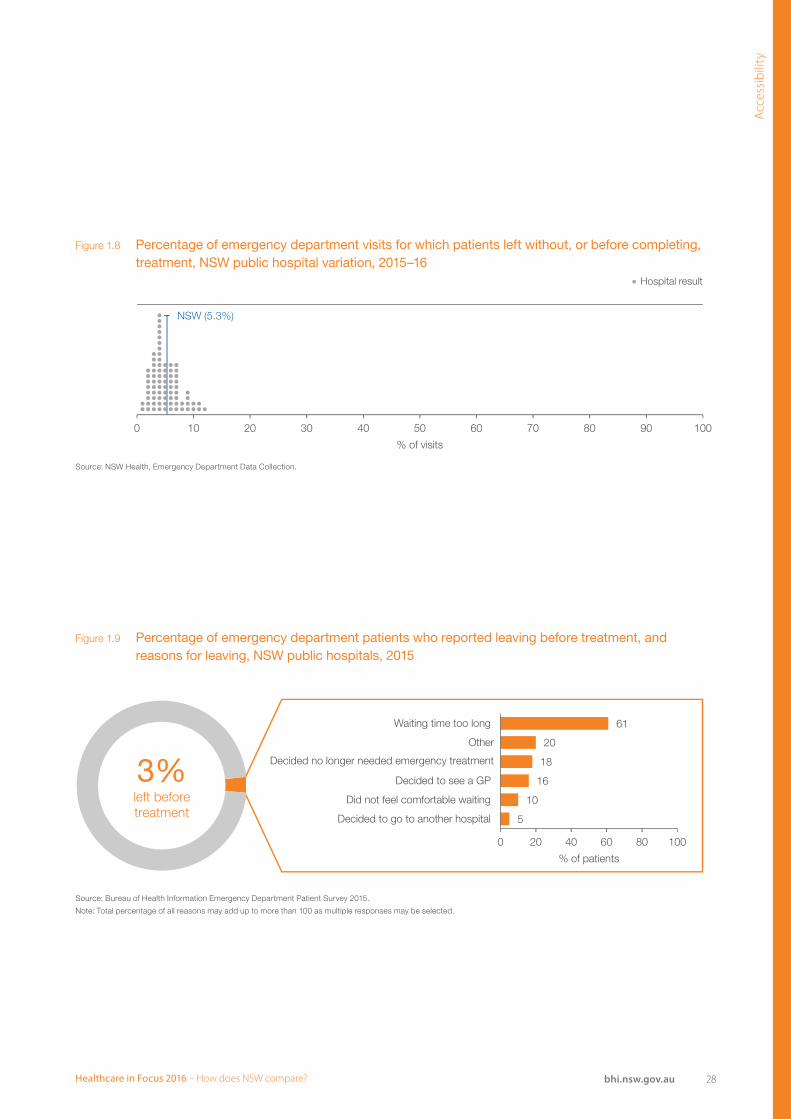
In 2015–16, the percentage of NSW patients who left the ED without or before completing treatment was 5.3%. This decreased from 7.3% in 2011–12 (Figure 1.7). Hospital-level results in the year 2015–16 ranged from 1% to 12% (Figure 1.8).
Patient survey data from 2015–16 show 3% of patients said they left before treatment. Most of these people cited long waiting time as a reason for leaving (Figure 1.9).
Figure 1.7 Percentage of emergency department visits for which patients left without, or before completing, treatment, NSW, 2011–12 to 2015–16
Volumes
Left before treated 45,676 51,845 52,329 54,624 60,356
Did not wait 122,806 103,262 86,523 80,440 82,714
Combined 168,482 155,107 138,852 135,064 143,070
5.3 4.23.4 3.1 3.12.0 2.1 2.0 2.1 2.2
7.36.4
5.4 5.2 5.3
0
5
10
15
20
25
30
35
40
45
50
2011–12 2012–13 2013–14 2014–15 2015–16
% o
f vis
its
Did not wait Left before treatment was completed Combined
Source: NSW Health, Emergency Department Data Collection.
28Healthcare in Focus 2016 – How does NSW compare? bhi.nsw.gov.au
Acc
essi
bili
ty
Figure 1.8 Percentage of emergency department visits for which patients left without, or before completing, treatment, NSW public hospital variation, 2015–16
Figure 1.9 Percentage of emergency department patients who reported leaving before treatment, and reasons for leaving, NSW public hospitals, 2015
NSW (5.3%)
0 10 20 30 40 50 60 70 80 90 100
% of visits
Hospital result
3%left beforetreatment 5
10
16
18
20
61
0 20 40 60 80 100
Waiting time too long
Other
Decided no longer needed emergency treatment
Decided to see a GP
Did not feel comfortable waiting
Decided to go to another hospital
% of patients
Source: NSW Health, Emergency Department Data Collection.
Source: Bureau of Health Information Emergency Department Patient Survey 2015.
Note: Total percentage of all reasons may add up to more than 100 as multiple responses may be selected.
Hospital result
29 Healthcare in Focus 2016 – How does NSW compare? bhi.nsw.gov.au
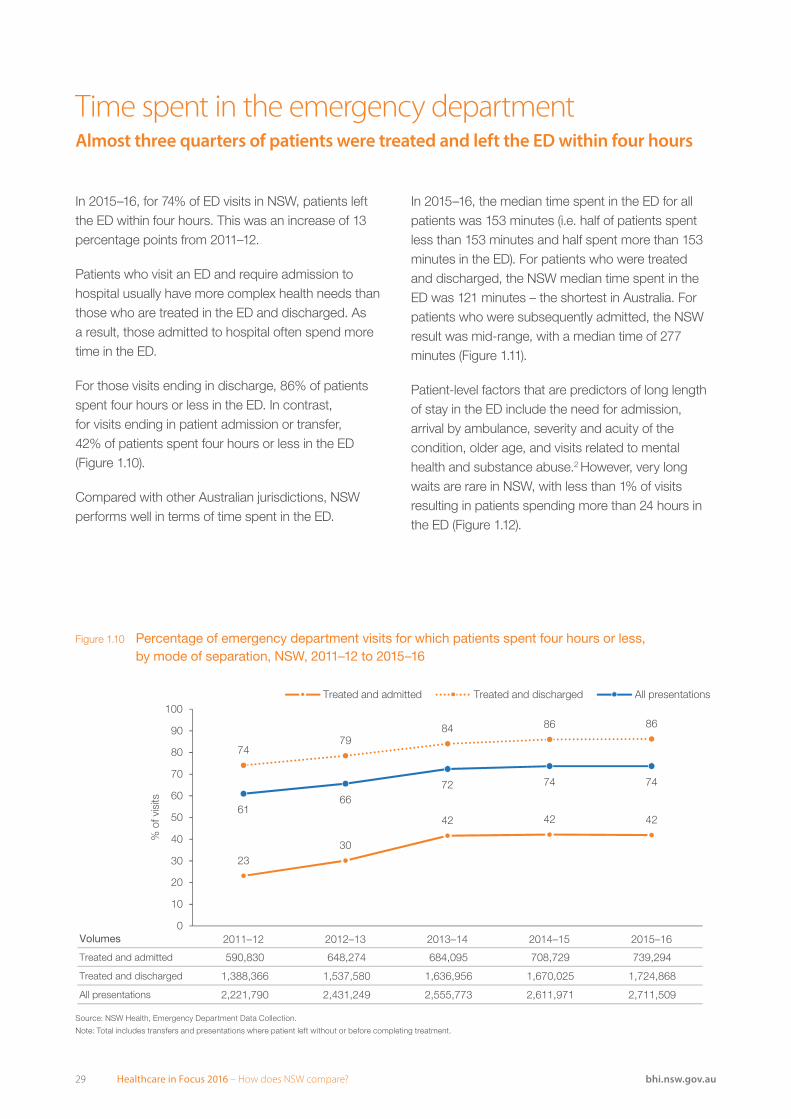
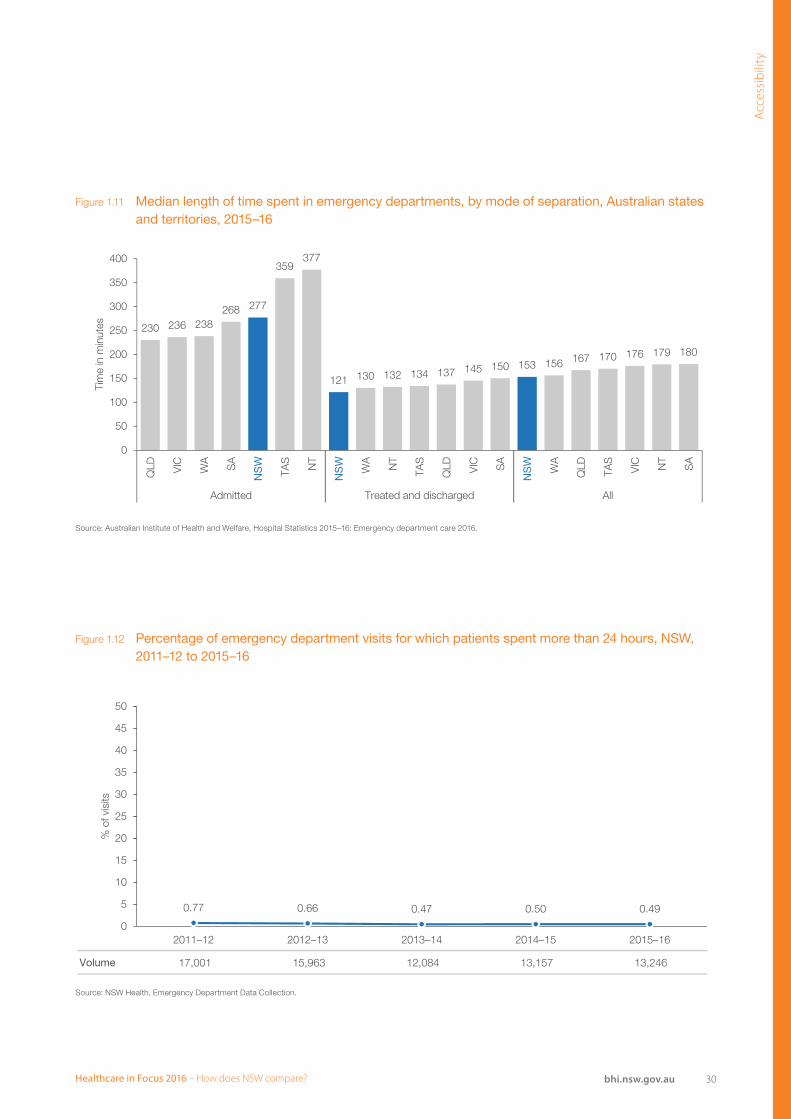
In 2015–16, for 74% of ED visits in NSW, patients left the ED within four hours. This was an increase of 13 percentage points from 2011–12.
Patients who visit an ED and require admission to hospital usually have more complex health needs than those who are treated in the ED and discharged. As a result, those admitted to hospital often spend more time in the ED.
For those visits ending in discharge, 86% of patients spent four hours or less in the ED. In contrast, for visits ending in patient admission or transfer, 42% of patients spent four hours or less in the ED (Figure 1.10).
Compared with other Australian jurisdictions, NSW performs well in terms of time spent in the ED.
Time spent in the emergency departmentAlmost three quarters of patients were treated and left the ED within four hours
In 2015–16, the median time spent in the ED for all patients was 153 minutes (i.e. half of patients spent less than 153 minutes and half spent more than 153 minutes in the ED). For patients who were treated and discharged, the NSW median time spent in the ED was 121 minutes – the shortest in Australia. For patients who were subsequently admitted, the NSW result was mid-range, with a median time of 277 minutes (Figure 1.11).
Patient-level factors that are predictors of long length of stay in the ED include the need for admission, arrival by ambulance, severity and acuity of the condition, older age, and visits related to mental health and substance abuse.2 However, very long waits are rare in NSW, with less than 1% of visits resulting in patients spending more than 24 hours in the ED (Figure 1.12).
Figure 1.10 Percentage of emergency department visits for which patients spent four hours or less, by mode of separation, NSW, 2011–12 to 2015–16
Volumes
Treated and admitted 590,830 648,274 684,095 708,729 739,294
Treated and discharged 1,388,366 1,537,580 1,636,956 1,670,025 1,724,868
All presentations 2,221,790 2,431,249 2,555,773 2,611,971 2,711,509
2330
42 42 42
7479
84 86 86
6166
72 74 74
0
10
20
30
40
50
60
70
80
90
100
2011–12 2012–13 2013–14 2014–15 2015–16
% o
f vis
its
Treated and admitted Treated and discharged All presentations
Source: NSW Health, Emergency Department Data Collection.
Note: Total includes transfers and presentations where patient left without or before completing treatment.
30Healthcare in Focus 2016 – How does NSW compare? bhi.nsw.gov.au
Acc
essi
bili
ty
Figure 1.11 Median length of time spent in emergency departments, by mode of separation, Australian states and territories, 2015–16
Figure 1.12 Percentage of emergency department visits for which patients spent more than 24 hours, NSW, 2011–12 to 2015–16
230 236 238268
359377
130 132 134 137 145 150 156 167 170 176 179 180
277
121153
0
50
100
150
200
250
300
350
400
QLD VIC
WA
SA
TAS
NT
WA
NT
TAS
QLD VIC SA
WA
QLD
TAS
VIC NT
SA
Admitted Treated and discharged All
Tim
e in
min
utes
NS
W
NS
W
NS
W
Volume 17,001 15,963 12,084 13,157 13,246
0.77 0.66 0.47 0.50 0.49
0
5
10
15
20
25
30
35
40
45
50
2011–12 2012–13 2013–14 2014–15 2015–16
% o
f vis
its
Source: Australian Institute of Health and Welfare, Hospital Statistics 2015–16: Emergency department care 2016.
Source: NSW Health, Emergency Department Data Collection.
31 Healthcare in Focus 2016 – How does NSW compare? bhi.nsw.gov.au
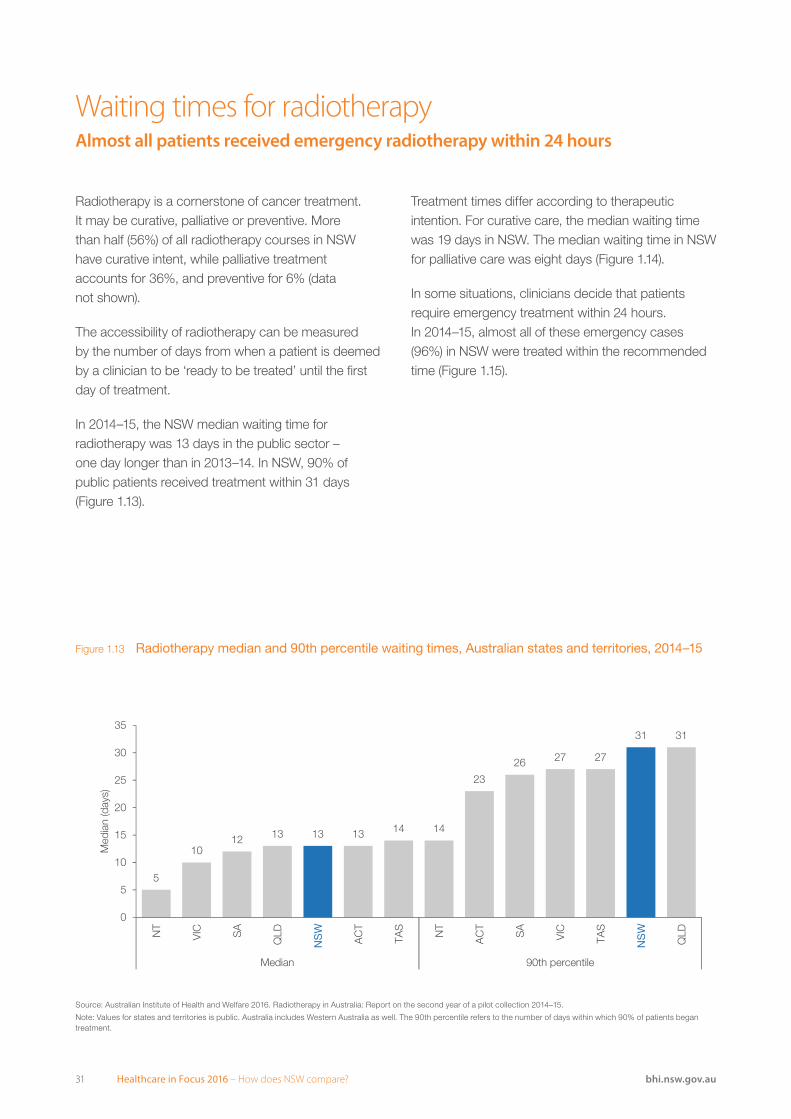
Radiotherapy is a cornerstone of cancer treatment. It may be curative, palliative or preventive. More than half (56%) of all radiotherapy courses in NSW have curative intent, while palliative treatment accounts for 36%, and preventive for 6% (data not shown).
The accessibility of radiotherapy can be measured by the number of days from when a patient is deemed by a clinician to be ‘ready to be treated’ until the first day of treatment.
In 2014–15, the NSW median waiting time for radiotherapy was 13 days in the public sector – one day longer than in 2013–14. In NSW, 90% of public patients received treatment within 31 days (Figure 1.13).
Waiting times for radiotherapyAlmost all patients received emergency radiotherapy within 24 hours
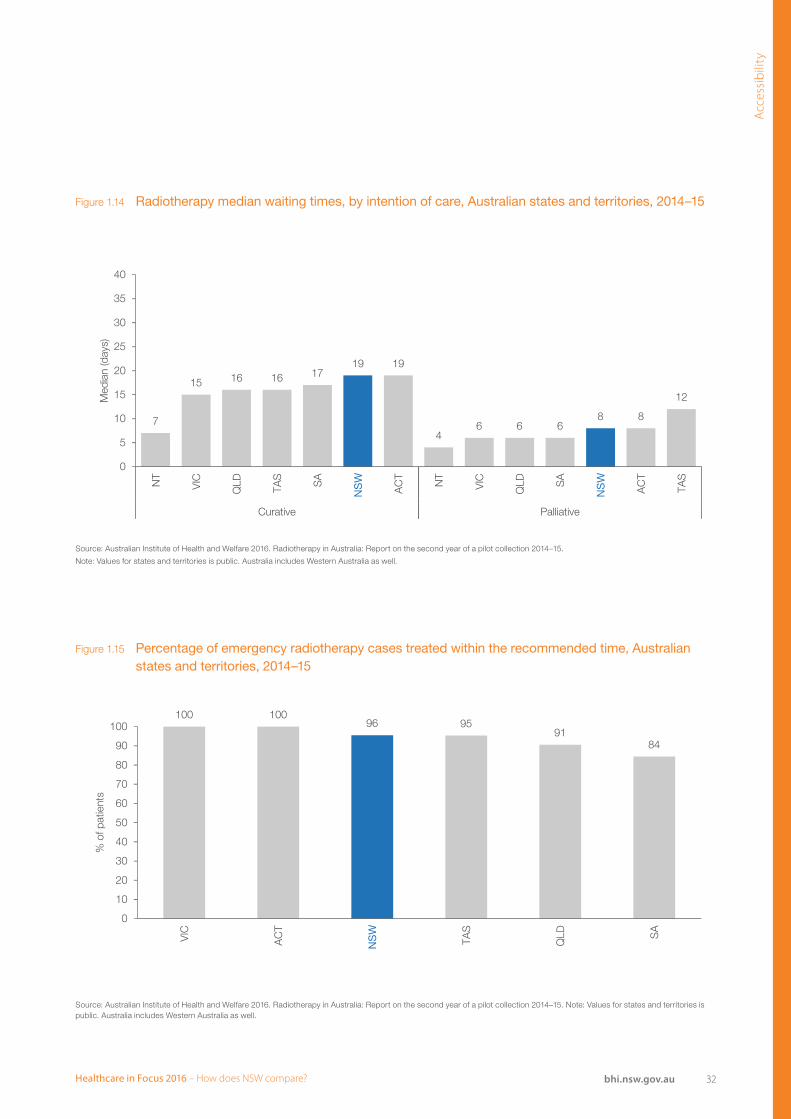
Treatment times differ according to therapeutic intention. For curative care, the median waiting time was 19 days in NSW. The median waiting time in NSW for palliative care was eight days (Figure 1.14).
In some situations, clinicians decide that patients require emergency treatment within 24 hours. In 2014–15, almost all of these emergency cases (96%) in NSW were treated within the recommended time (Figure 1.15).
Figure 1.13 Radiotherapy median and 90th percentile waiting times, Australian states and territories, 2014–15
5
1012 13 13 14 14
23
26 27 27
31
13
31
0
5
10
15
20
25
30
35
NT
VIC SA
QLD
AC
T
TAS
NT
AC
T
SA
VIC
TAS
QLD
Median 90th percentile
Med
ian
(day
s)
NS
W
NS
W
Source: Australian Institute of Health and Welfare 2016. Radiotherapy in Australia: Report on the second year of a pilot collection 2014–15.
Note: Values for states and territories is public. Australia includes Western Australia as well. The 90th percentile refers to the number of days within which 90% of patients began treatment.
32Healthcare in Focus 2016 – How does NSW compare? bhi.nsw.gov.au
Acc
essi
bili
ty
Figure 1.14 Radiotherapy median waiting times, by intention of care, Australian states and territories, 2014–15
Figure 1.15 Percentage of emergency radiotherapy cases treated within the recommended time, Australian states and territories, 2014–15
7
15 16 16 1719
46 6 6
8
12
19
8
0
5
10
15
20
25
30
35
40
NT
VIC
QLD
TAS
SA
AC
T
NT
VIC
QLD S
A
AC
T
TAS
Curative Palliative
Med
ian
(day
s)
NS
W
NS
W
100 10095
9184
96
0
10
20
30
40
50
60
70
80
90
100
VIC
AC
T
TAS
QLD S
A
% o
f pat
ient
s
NS
W
Source: Australian Institute of Health and Welfare 2016. Radiotherapy in Australia: Report on the second year of a pilot collection 2014–15.
Note: Values for states and territories is public. Australia includes Western Australia as well.
Source: Australian Institute of Health and Welfare 2016. Radiotherapy in Australia: Report on the second year of a pilot collection 2014–15. Note: Values for states and territories is public. Australia includes Western Australia as well.
33 Healthcare in Focus 2016 – How does NSW compare? bhi.nsw.gov.au
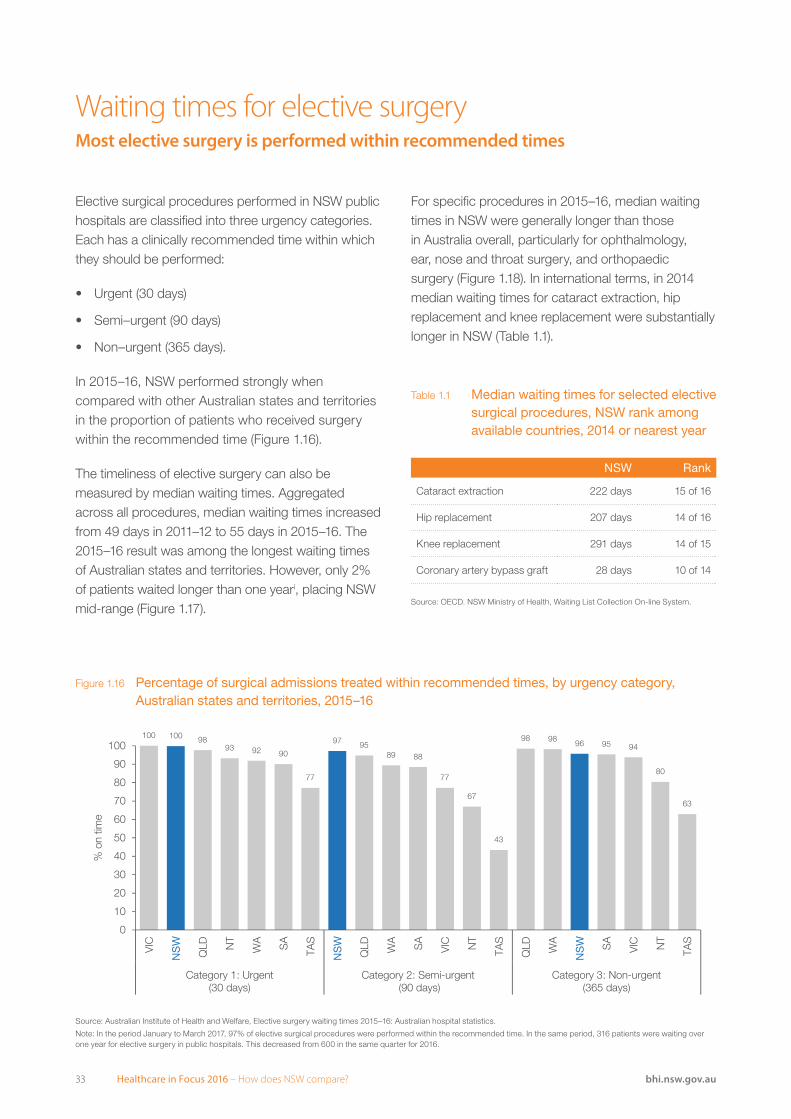
Elective surgical procedures performed in NSW public hospitals are classified into three urgency categories. Each has a clinically recommended time within which they should be performed:
• Urgent (30 days)
• Semi–urgent (90 days)
• Non–urgent (365 days).
In 2015–16, NSW performed strongly when compared with other Australian states and territories in the proportion of patients who received surgery within the recommended time (Figure 1.16).
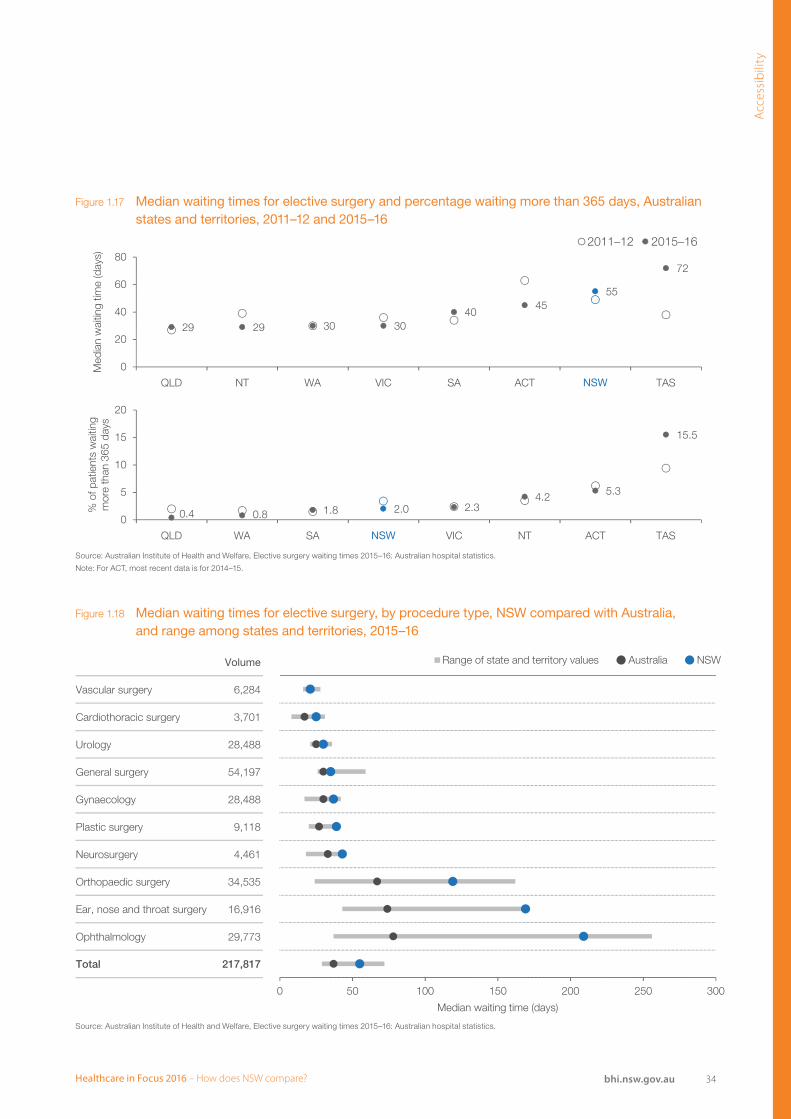
The timeliness of elective surgery can also be measured by median waiting times. Aggregated across all procedures, median waiting times increased from 49 days in 2011–12 to 55 days in 2015–16. The 2015–16 result was among the longest waiting times of Australian states and territories. However, only 2% of patients waited longer than one yeari, placing NSW mid-range (Figure 1.17).
Waiting times for elective surgeryMost elective surgery is performed within recommended times
For specific procedures in 2015–16, median waiting times in NSW were generally longer than those in Australia overall, particularly for ophthalmology, ear, nose and throat surgery, and orthopaedic surgery (Figure 1.18). In international terms, in 2014 median waiting times for cataract extraction, hip replacement and knee replacement were substantially longer in NSW (Table 1.1).
Table 1.1 Median waiting times for selected elective surgical procedures, NSW rank among available countries, 2014 or nearest year
NSW Rank
Cataract extraction 222 days 15 of 16
Hip replacement 207 days 14 of 16
Knee replacement 291 days 14 of 15
Coronary artery bypass graft 28 days 10 of 14
Figure 1.16 Percentage of surgical admissions treated within recommended times, by urgency category, Australian states and territories, 2015–16
100 9893 92 90
77
9589 88
77
67
43
98 9895 94
80
63
10097 96
0
10
20
30
40
50
60
70
80
90
100
VIC
QLD N
T
WA
SA
TAS
QLD W
A
SA
VIC NT
TAS
QLD W
A
SA
VIC NT
TAS
Category 1: Urgent(30 days)
Category 2: Semi-urgent (90 days)
Category 3: Non-urgent(365 days)
% o
n tim
e
NS
W
NS
W
NS
W
Source: Australian Institute of Health and Welfare, Elective surgery waiting times 2015–16: Australian hospital statistics.
Note: In the period January to March 2017, 97% of elective surgical procedures were performed within the recommended time. In the same period, 316 patients were waiting over one year for elective surgery in public hospitals. This decreased from 600 in the same quarter for 2016.
Source: OECD. NSW Ministry of Health, Waiting List Collection On-line System.
34Healthcare in Focus 2016 – How does NSW compare? bhi.nsw.gov.au
Acc
essi
bili
ty
29 29 30 3040
4555
72
QLD NT WA VIC SA ACT NSW TAS
0
20
40
60
80
Med
ian
wai
ting
time
(day
s)
2011–12 2015–16
0.4 0.8 1.8 2.0 2.34.2 5.3
15.5
QLD WA SA NSW VIC NT ACT TAS
0
5
10
15
20
% o
f pat
ient
s w
aitin
gm
ore
than
365
day
s
Volume
Vascular surgery 6,284
Cardiothoracic surgery 3,701
Urology 28,488
General surgery 54,197
Gynaecology 28,488
Plastic surgery 9,118
Neurosurgery 4,461
Orthopaedic surgery 34,535
Ear, nose and throat surgery 16,916
Ophthalmology 29,773
Total 217,817
0 50 100 150 200 250 300
Median waiting time (days)
Range of state and territory value s Australi a NSW
Figure 1.17 Median waiting times for elective surgery and percentage waiting more than 365 days, Australian states and territories, 2011–12 and 2015–16
Figure 1.18 Median waiting times for elective surgery, by procedure type, NSW compared with Australia, and range among states and territories, 2015–16
Source: Australian Institute of Health and Welfare, Elective surgery waiting times 2015–16: Australian hospital statistics.
Note: For ACT, most recent data is for 2014–15.
Source: Australian Institute of Health and Welfare, Elective surgery waiting times 2015–16: Australian hospital statistics.
35 Healthcare in Focus 2016 – How does NSW compare? bhi.nsw.gov.au
One way of assessing accessibility of healthcare measures unmet need or barriers to care.3 Unmet healthcare needs may be rooted in a range of factors that limit the extent to which patients can:
• Perceive that a potential source of treatment or advice relevant to their needs exists.
• Seek socially and culturally acceptable services, reach healthcare services in a timely way.
• Afford both direct costs such as co–payments, gap payments or consultation fees4; and indirect costs such as transportation or loss of income.
• Engage in their care.1
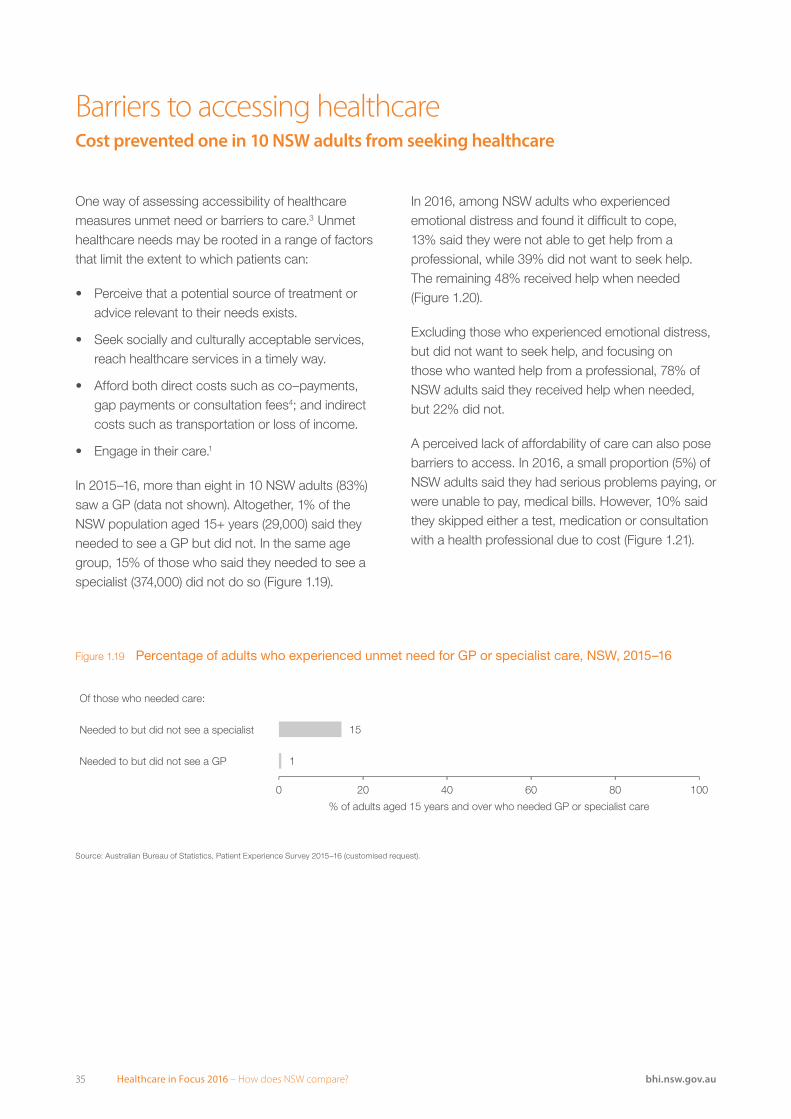
In 2015–16, more than eight in 10 NSW adults (83%) saw a GP (data not shown). Altogether, 1% of the NSW population aged 15+ years (29,000) said they needed to see a GP but did not. In the same age group, 15% of those who said they needed to see a specialist (374,000) did not do so (Figure 1.19).
Barriers to accessing healthcareCost prevented one in 10 NSW adults from seeking healthcare
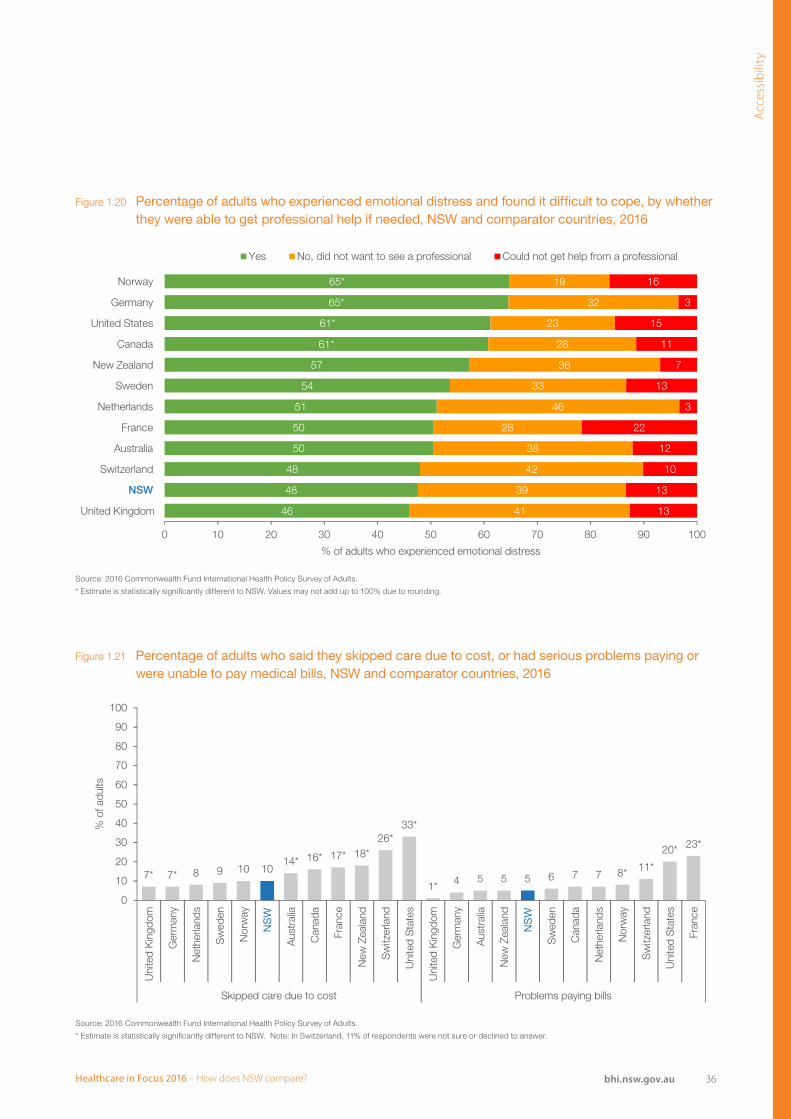
In 2016, among NSW adults who experienced emotional distress and found it difficult to cope, 13% said they were not able to get help from a professional, while 39% did not want to seek help. The remaining 48% received help when needed (Figure 1.20).
Excluding those who experienced emotional distress, but did not want to seek help, and focusing on those who wanted help from a professional, 78% of NSW adults said they received help when needed, but 22% did not.
A perceived lack of affordability of care can also pose barriers to access. In 2016, a small proportion (5%) of NSW adults said they had serious problems paying, or were unable to pay, medical bills. However, 10% said they skipped either a test, medication or consultation with a health professional due to cost (Figure 1.21).
Figure 1.19 Percentage of adults who experienced unmet need for GP or specialist care, NSW, 2015–16
Of those who needed care:
Needed to but did not see a specialist
Needed to but did not see a GP
15
1
0 20 40 60 80 100
% of adults aged 15 years and over who needed GP or specialist care
Source: Australian Bureau of Statistics, Patient Experience Survey 2015–16 (customised request).
36Healthcare in Focus 2016 – How does NSW compare? bhi.nsw.gov.au
Acc
essi
bili
ty
Figure 1.20 Percentage of adults who experienced emotional distress and found it difficult to cope, by whether they were able to get professional help if needed, NSW and comparator countries, 2016
65*
65*
61*
61*
57
54
51
50
50
48
48
46
19
32
23
28
36
33
46
28
38
42
39
41
16
3
15
11
7
13
3
22
12
10
13
13
Norway
Germany
United States
Canada
New Zealand
Sweden
Netherlands
France
Australia
Switzerland
NSW
United Kingdom
0 10 20 30 40 50 60 70 80 90 100
% of adults who experienced emotional distress
Yes No, did not want to see a professional Could not get help from a professional
Source: 2016 Commonwealth Fund International Health Policy Survey of Adults.
* Estimate is statistically significantly different to NSW. Values may not add up to 100% due to rounding.
Source: 2016 Commonwealth Fund International Health Policy Survey of Adults.
* Estimate is statistically significantly different to NSW. Note: In Switzerland, 11% of respondents were not sure or declined to answer.
Figure 1.21 Percentage of adults who said they skipped care due to cost, or had serious problems paying or were unable to pay medical bills, NSW and comparator countries, 2016
23*20*
11*8*77655541*
33*26*
18*17*16*14*1010987*7*
0
10
20
30
40
50
60
70
80
90
100Fr
ance
Uni
ted
Sta
tes
Sw
itzer
land
Nor
way
Net
herla
nds
Can
ada
Sw
eden
New
Zea
land
Aus
tral
ia
Ger
man
y
Uni
ted
Kin
gdom
Uni
ted
Sta
tes
Sw
itzer
land
New
Zea
land
Fran
ce
Can
ada
Aus
tral
ia
Nor
way
Sw
eden
Net
herla
nds
Ger
man
y
Uni
ted
Kin
gdom
Problems paying billsSkipped care due to cost
% o
f adu
lts
NS
W
NS
W

37 Healthcare in Focus 2016 – How does NSW compare? bhi.nsw.gov.au
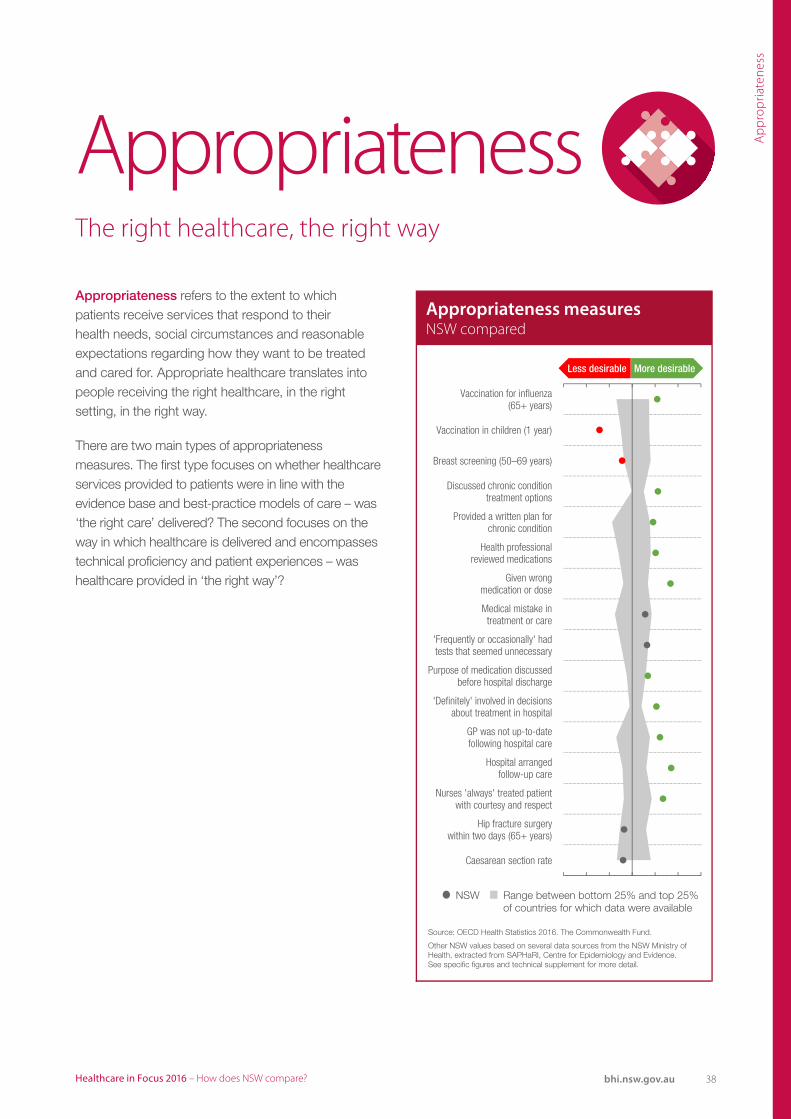
AppropriatenessThe right healthcare, the right way
38Healthcare in Focus 2016 – How does NSW compare? bhi.nsw.gov.au
Ap
pro
pria
tene
ss
AppropriatenessThe right healthcare, the right way
Appropriateness refers to the extent to which patients receive services that respond to their health needs, social circumstances and reasonable expectations regarding how they want to be treated and cared for. Appropriate healthcare translates into people receiving the right healthcare, in the right setting, in the right way.
There are two main types of appropriateness measures. The first type focuses on whether healthcare services provided to patients were in line with the evidence base and best-practice models of care – was ‘the right care’ delivered? The second focuses on the way in which healthcare is delivered and encompasses technical proficiency and patient experiences – was healthcare provided in ‘the right way’?
Vaccination for influenza (65+ years)
Vaccination in children (1 year)
Breast screening (50–69 years)
Discussed chronic condition treatment options
Provided a written plan forchronic condition
Health professionalreviewed medications
Given wrongmedication or dose
Medical mistake intreatment or care
'Frequently or occasionally' hadtests that seemed unnecessary
Purpose of medication discussedbefore hospital discharge
'Definitely' involved in decisionsabout treatment in hospital
GP was not up-to-datefollowing hospital care
Hospital arrangedfollow-up care
Nurses 'always' treated patientwith courtesy and respect
Hip fracture surgerywithin two days (65+ years)
Caesarean section rate
More desirableLess desirable
NSW Range between bottom 25% and top 25%of countries for which data were available
Source: OECD Health Statistics 2016. The Commonwealth Fund.
Other NSW values based on several data sources from the NSW Ministry of Health, extracted from SAPHaRI, Centre for Epidemiology and Evidence.See specific figures and technical supplement for more detail.
Appropriateness measuresNSW compared
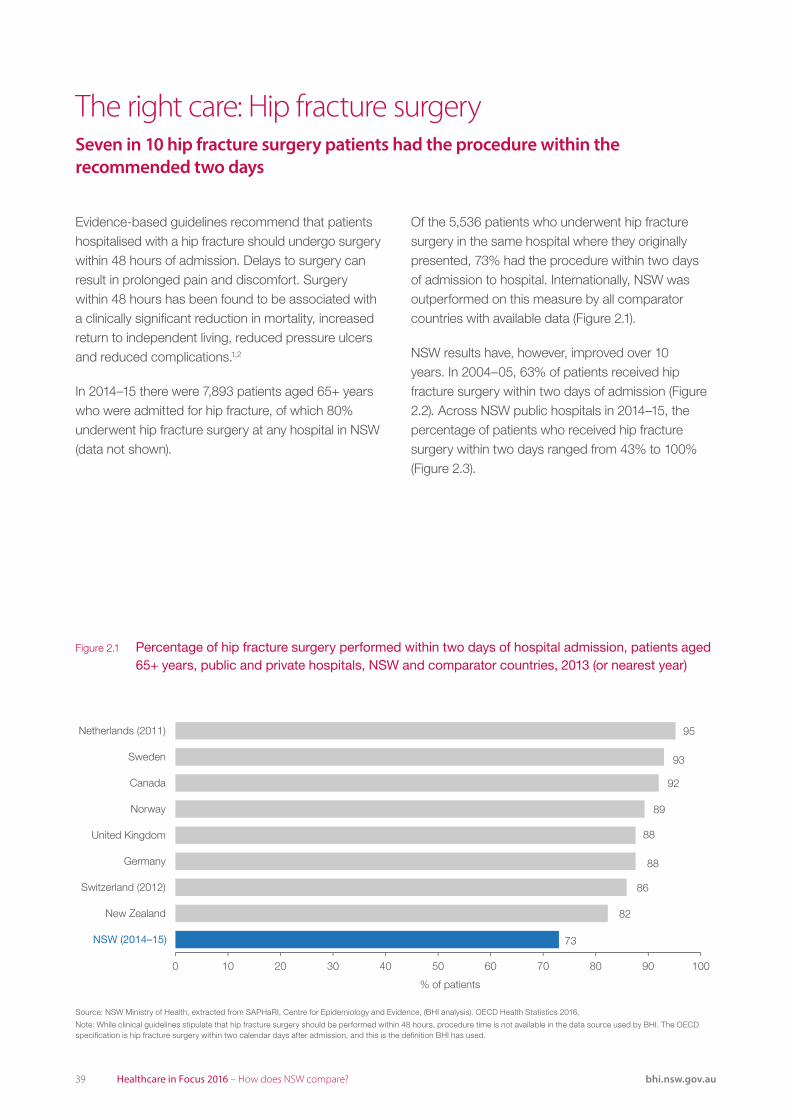
39 Healthcare in Focus 2016 – How does NSW compare? bhi.nsw.gov.au
Evidence-based guidelines recommend that patients hospitalised with a hip fracture should undergo surgery within 48 hours of admission. Delays to surgery can result in prolonged pain and discomfort. Surgery within 48 hours has been found to be associated with a clinically significant reduction in mortality, increased return to independent living, reduced pressure ulcers and reduced complications.1,2
In 2014–15 there were 7,893 patients aged 65+ years who were admitted for hip fracture, of which 80% underwent hip fracture surgery at any hospital in NSW (data not shown).
The right care: Hip fracture surgerySeven in 10 hip fracture surgery patients had the procedure within the recommended two days
Of the 5,536 patients who underwent hip fracture surgery in the same hospital where they originally presented, 73% had the procedure within two days of admission to hospital. Internationally, NSW was outperformed on this measure by all comparator countries with available data (Figure 2.1).
NSW results have, however, improved over 10 years. In 2004–05, 63% of patients received hip fracture surgery within two days of admission (Figure 2.2). Across NSW public hospitals in 2014–15, the percentage of patients who received hip fracture surgery within two days ranged from 43% to 100% (Figure 2.3).
82
86
88
88
89
92
93
95
73
0 10 20 30 40 50 60 70 80 90 100
% of patients
Netherlands (2011)
Sweden
Canada
Norway
United Kingdom
Germany
Switzerland (2012)
New Zealand
NSW (2014–15)
Figure 2.1 Percentage of hip fracture surgery performed within two days of hospital admission, patients aged 65+ years, public and private hospitals, NSW and comparator countries, 2013 (or nearest year)
Source: NSW Ministry of Health, extracted from SAPHaRI, Centre for Epidemiology and Evidence, (BHI analysis). OECD Health Statistics 2016.
Note: While clinical guidelines stipulate that hip fracture surgery should be performed within 48 hours, procedure time is not available in the data source used by BHI. The OECD specification is hip fracture surgery within two calendar days after admission, and this is the definition BHI has used.
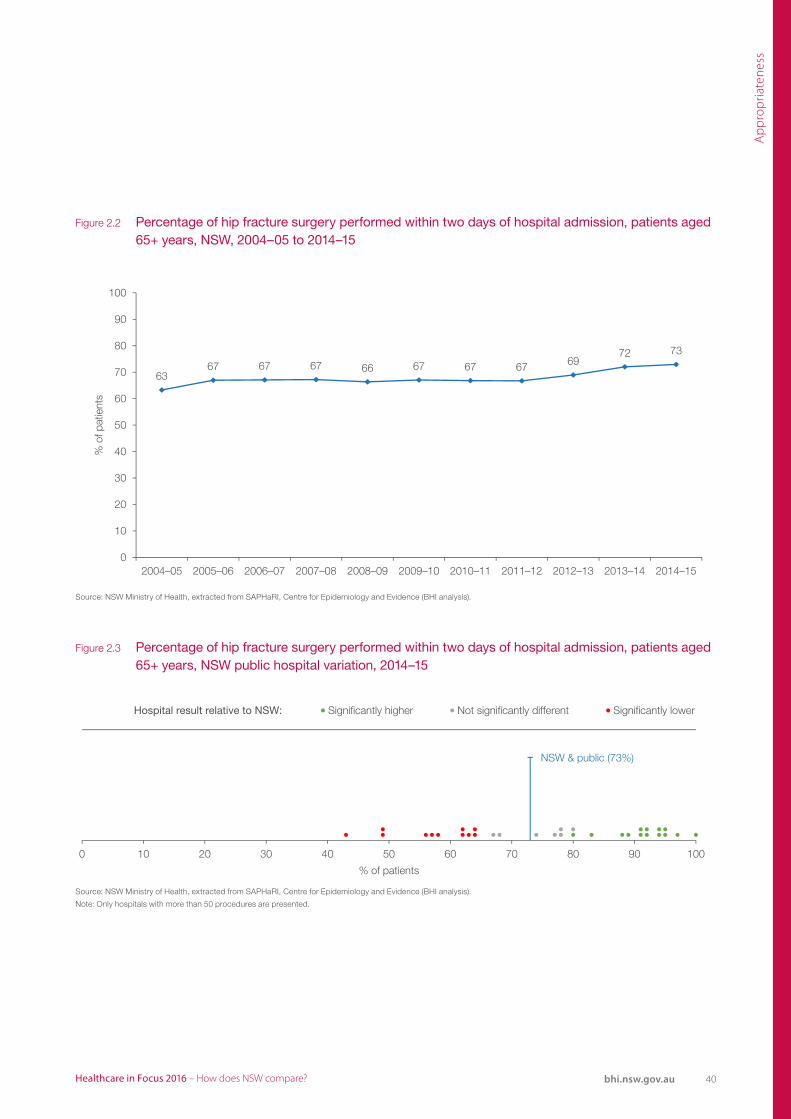
40Healthcare in Focus 2016 – How does NSW compare? bhi.nsw.gov.au
Ap
pro
pria
tene
ss
6367 67 67 66 67 67 67 69
72 73
0
10
20
30
40
50
60
70
80
90
100
2004–05 2005–06 2006–07 2007–08 2008–09 2009–10 2010–11 2011–12 2012–13 2013–14 2014–15
% o
f pat
ient
s
Hospital result relative to NSW:
NSW & public (73%)
0 10 20 30 40 50 60 70 80 90 100
% of patients
Significantly higher Not significantly different Significantly lower
Figure 2.2 Percentage of hip fracture surgery performed within two days of hospital admission, patients aged 65+ years, NSW, 2004–05 to 2014–15
Figure 2.3 Percentage of hip fracture surgery performed within two days of hospital admission, patients aged 65+ years, NSW public hospital variation, 2014–15
Source: NSW Ministry of Health, extracted from SAPHaRI, Centre for Epidemiology and Evidence (BHI analysis).
Source: NSW Ministry of Health, extracted from SAPHaRI, Centre for Epidemiology and Evidence (BHI analysis).
Note: Only hospitals with more than 50 procedures are presented.
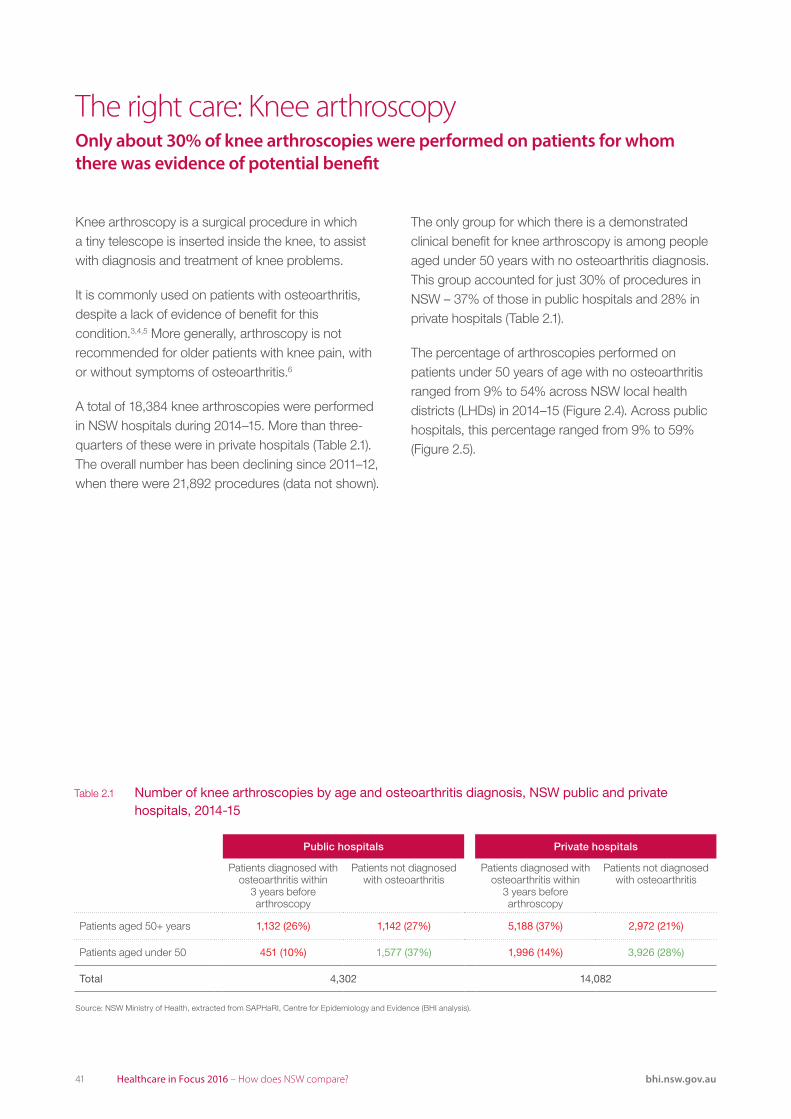
41 Healthcare in Focus 2016 – How does NSW compare? bhi.nsw.gov.au
Knee arthroscopy is a surgical procedure in which a tiny telescope is inserted inside the knee, to assist with diagnosis and treatment of knee problems.
It is commonly used on patients with osteoarthritis, despite a lack of evidence of benefit for this condition.3,4,5 More generally, arthroscopy is not recommended for older patients with knee pain, with or without symptoms of osteoarthritis.6
A total of 18,384 knee arthroscopies were performed in NSW hospitals during 2014–15. More than three-quarters of these were in private hospitals (Table 2.1). The overall number has been declining since 2011–12, when there were 21,892 procedures (data not shown).
The right care: Knee arthroscopyOnly about 30% of knee arthroscopies were performed on patients for whom there was evidence of potential benefit
The only group for which there is a demonstrated clinical benefit for knee arthroscopy is among people aged under 50 years with no osteoarthritis diagnosis. This group accounted for just 30% of procedures in NSW – 37% of those in public hospitals and 28% in private hospitals (Table 2.1).
The percentage of arthroscopies performed on patients under 50 years of age with no osteoarthritis ranged from 9% to 54% across NSW local health districts (LHDs) in 2014–15 (Figure 2.4). Across public hospitals, this percentage ranged from 9% to 59% (Figure 2.5).
Table 2.1 Number of knee arthroscopies by age and osteoarthritis diagnosis, NSW public and private hospitals, 2014-15
Public hospitals Private hospitals
Patients diagnosed with osteoarthritis within
3 years before arthroscopy
Patients not diagnosed with osteoarthritis
Patients diagnosed with osteoarthritis within
3 years before arthroscopy
Patients not diagnosed with osteoarthritis
Patients aged 50+ years 1,132 (26%) 1,142 (27%) 5,188 (37%) 2,972 (21%)
Patients aged under 50 451 (10%) 1,577 (37%) 1,996 (14%) 3,926 (28%)
Total 4,302 14,082
Source: NSW Ministry of Health, extracted from SAPHaRI, Centre for Epidemiology and Evidence (BHI analysis).
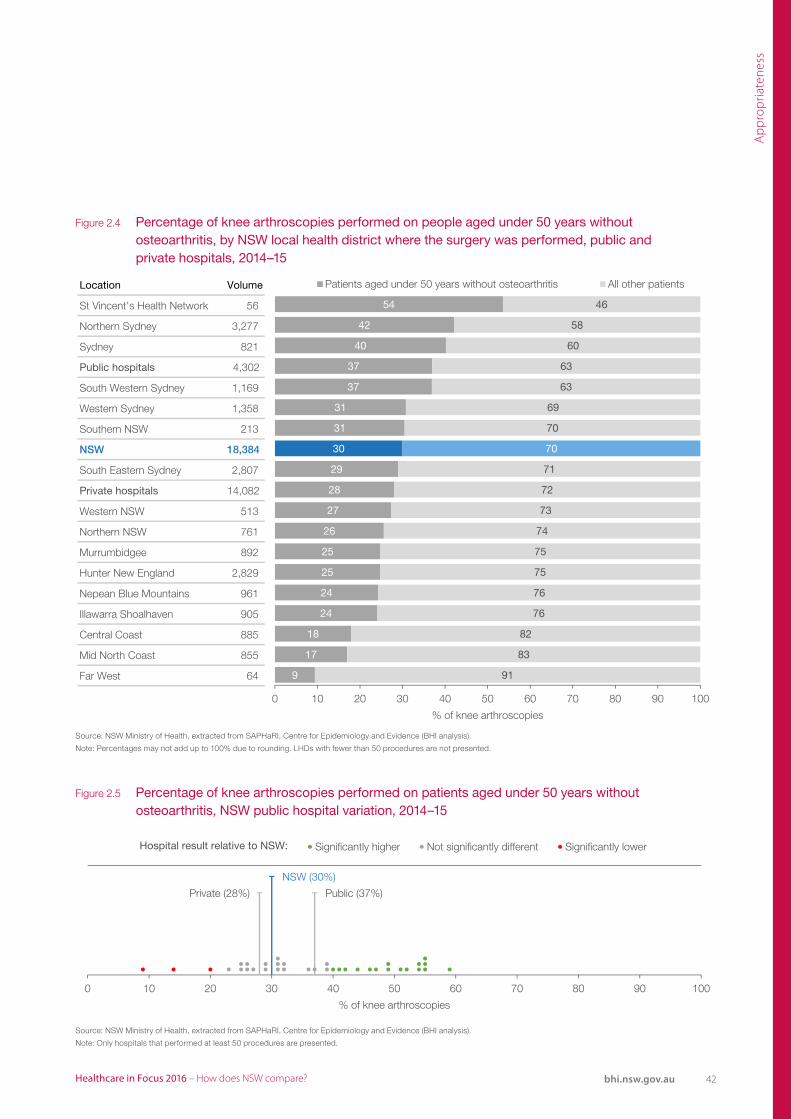
42Healthcare in Focus 2016 – How does NSW compare? bhi.nsw.gov.au
Ap
pro
pria
tene
ss
Location Volume
St Vincent's Health Network 56
Northern Sydney 3,277
Sydney 821
Public hospitals 4,302
South Western Sydney 1,169
Western Sydney 1,358
Southern NSW 213
NSW 18,384
South Eastern Sydney 2,807
Private hospitals 14,082
Western NSW 513
Northern NSW 761
Murrumbidgee 892
Hunter New England 2,829
Nepean Blue Mountains 961
Illawarra Shoalhaven 905
Central Coast 885
Mid North Coast 855
Far West 64
Note: Percentages may not add up to 100% due to rounding.Source: NSW Ministry of Health, extracted from SAPHaRI, Centre for Epidemiology and Evidence (BHI analysis).
54
42
40
37
37
31
31
30
29
28
27
26
25
25
24
24
18
17
9
46
58
60
63
63
69
70
70
71
72
73
74
75
75
76
76
82
83
91
0 10 20 30 40 50 60 70 80 90 100
% of knee arthroscopies
Patients aged under 50 years without osteoarthritis All other patients
Hospital result relative to NSW:
Source: NSW Ministry of Health, extracted from SAPHaRI, Centre for Epidemiology and Evidence (BHI analysis).
Note: Only includes hospitals with at least 50 procedures.
Public (37%)Private (28%)
NSW (30%)
0 10 20 30 40 50 60 70 80 90 100
% of knee arthroscopies
Significantly higher Not significantly different Significantly lower
Figure 2.4 Percentage of knee arthroscopies performed on people aged under 50 years without osteoarthritis, by NSW local health district where the surgery was performed, public and private hospitals, 2014–15
Figure 2.5 Percentage of knee arthroscopies performed on patients aged under 50 years without osteoarthritis, NSW public hospital variation, 2014–15
Source: NSW Ministry of Health, extracted from SAPHaRI, Centre for Epidemiology and Evidence (BHI analysis).
Note: Only hospitals that performed at least 50 procedures are presented.
Source: NSW Ministry of Health, extracted from SAPHaRI, Centre for Epidemiology and Evidence (BHI analysis).
Note: Percentages may not add up to 100% due to rounding. LHDs with fewer than 50 procedures are not presented.
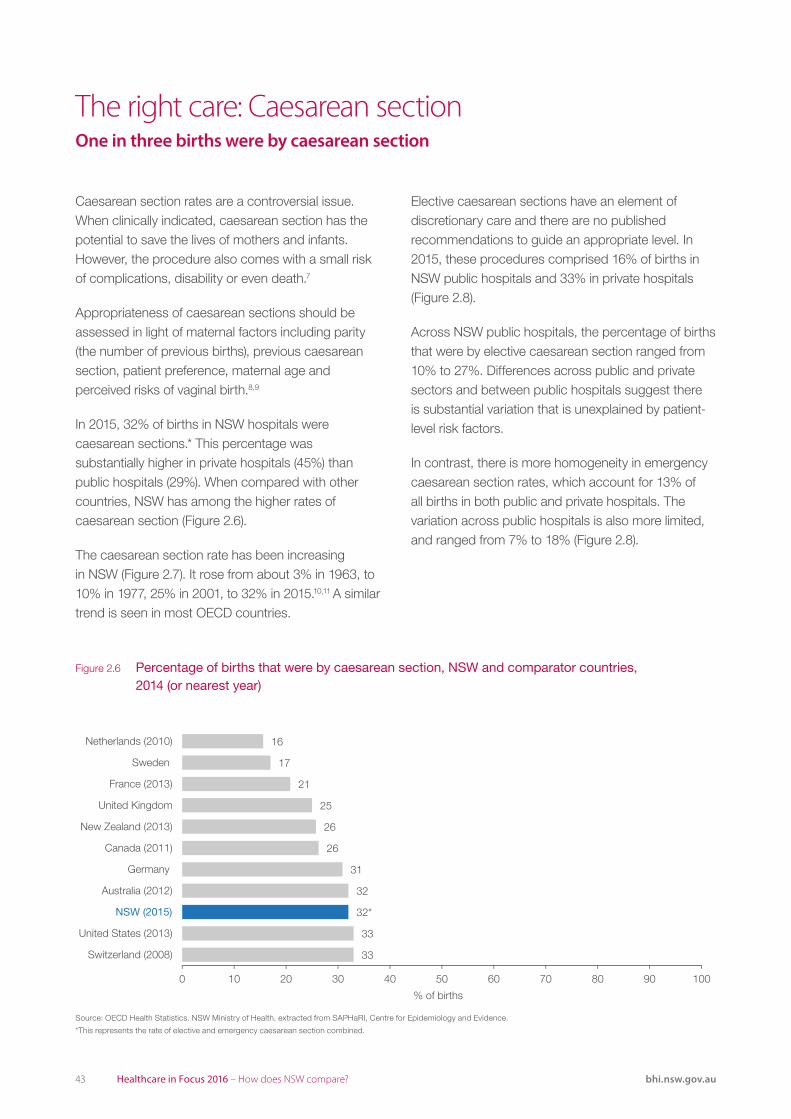
43 Healthcare in Focus 2016 – How does NSW compare? bhi.nsw.gov.au
Caesarean section rates are a controversial issue. When clinically indicated, caesarean section has the potential to save the lives of mothers and infants. However, the procedure also comes with a small risk of complications, disability or even death.7
Appropriateness of caesarean sections should be assessed in light of maternal factors including parity (the number of previous births), previous caesarean section, patient preference, maternal age and perceived risks of vaginal birth.8,9
In 2015, 32% of births in NSW hospitals were caesarean sections.* This percentage was substantially higher in private hospitals (45%) than public hospitals (29%). When compared with other countries, NSW has among the higher rates of caesarean section (Figure 2.6).
The caesarean section rate has been increasing in NSW (Figure 2.7). It rose from about 3% in 1963, to 10% in 1977, 25% in 2001, to 32% in 2015.10,11 A similar trend is seen in most OECD countries.
The right care: Caesarean sectionOne in three births were by caesarean section
Elective caesarean sections have an element of discretionary care and there are no published recommendations to guide an appropriate level. In 2015, these procedures comprised 16% of births in NSW public hospitals and 33% in private hospitals (Figure 2.8).
Across NSW public hospitals, the percentage of births that were by elective caesarean section ranged from 10% to 27%. Differences across public and private sectors and between public hospitals suggest there is substantial variation that is unexplained by patient-level risk factors.
In contrast, there is more homogeneity in emergency caesarean section rates, which account for 13% of all births in both public and private hospitals. The variation across public hospitals is also more limited, and ranged from 7% to 18% (Figure 2.8).
33
33
32
31
26
26
25
21
17
16
32*
0 10 20 30 40 50 60 70 80 90 100
Germany
Canada (2011)
New Zealand (2013)
United Kingdom
France (2013)
Sweden
Netherlands (2010)
% of births
Australia (2012)
NSW (2015)
United States (2013)
Switzerland (2008)
Figure 2.6 Percentage of births that were by caesarean section, NSW and comparator countries, 2014 (or nearest year)
Source: OECD Health Statistics. NSW Ministry of Health, extracted from SAPHaRI, Centre for Epidemiology and Evidence.
*This represents the rate of elective and emergency caesarean section combined.
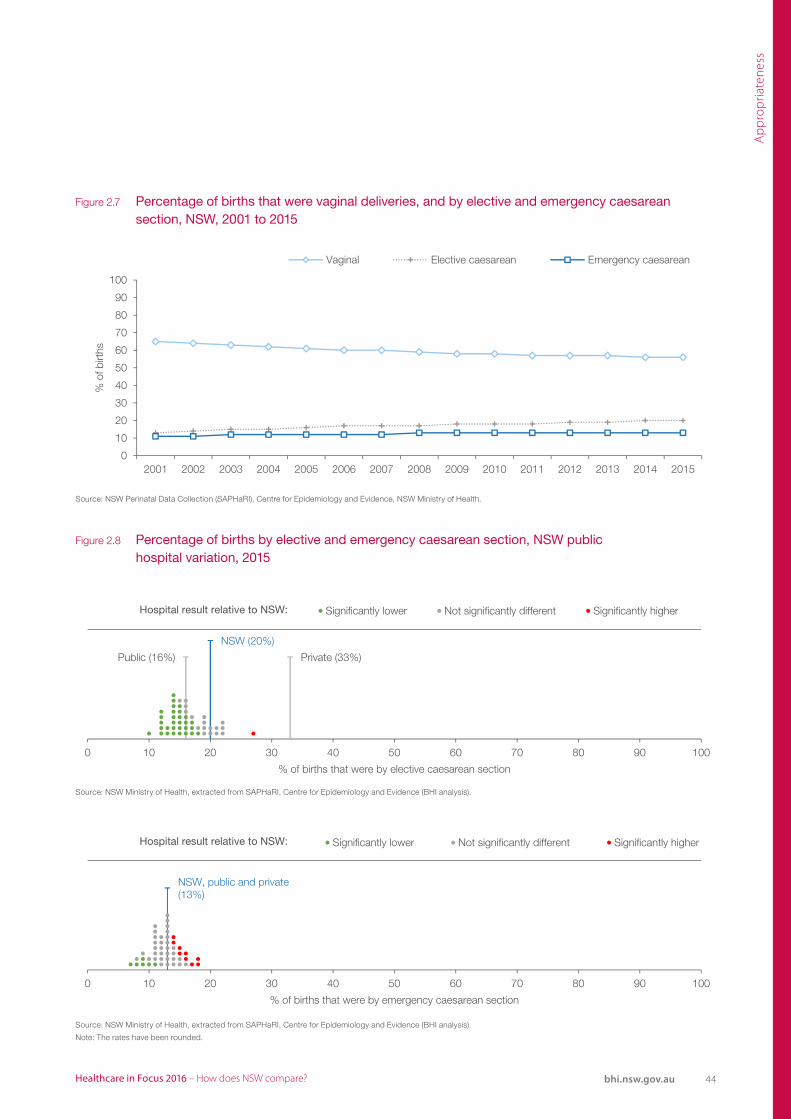
44Healthcare in Focus 2016 – How does NSW compare? bhi.nsw.gov.au
Ap
pro
pria
tene
ss
Hospital result relative to NSW:
Source: NSW Ministry of Health, extracted from SAPHaRI, Centre for Epidemiology and Evidence (BHI analysis).
Percentage of births that were by elective caesarean, NSW hospital variation, 2015
Public (16%) Private (33%)
NSW (20%)
0 10 20 30 40 50 60 70 80 90 100
% of births that were by elective caesarean section
Significantly lower Not significantly different Significantly higher
Hospital result relative to NSW:
NSW, public and private (13%)
0 10 20 30 40 50 60 70 80 90 100
% of births that were by emergency caesarean section
Significantly lower Not significantly different Significantly higher
0
10
20
30
40
50
60
70
80
90
100
2001 2002 2003 2004 2005 2006 2007 2008 2009 2010 2011 2012 2013 2014 2015
% o
f birt
hs
Vaginal Elective caesarean Emergency caesarean
Figure 2.7 Percentage of births that were vaginal deliveries, and by elective and emergency caesarean section, NSW, 2001 to 2015
Figure 2.8 Percentage of births by elective and emergency caesarean section, NSW public hospital variation, 2015
Source: NSW Perinatal Data Collection (SAPHaRI), Centre for Epidemiology and Evidence, NSW Ministry of Health.
Source: NSW Ministry of Health, extracted from SAPHaRI, Centre for Epidemiology and Evidence (BHI analysis).
Source: NSW Ministry of Health, extracted from SAPHaRI, Centre for Epidemiology and Evidence (BHI analysis).
Note: The rates have been rounded.
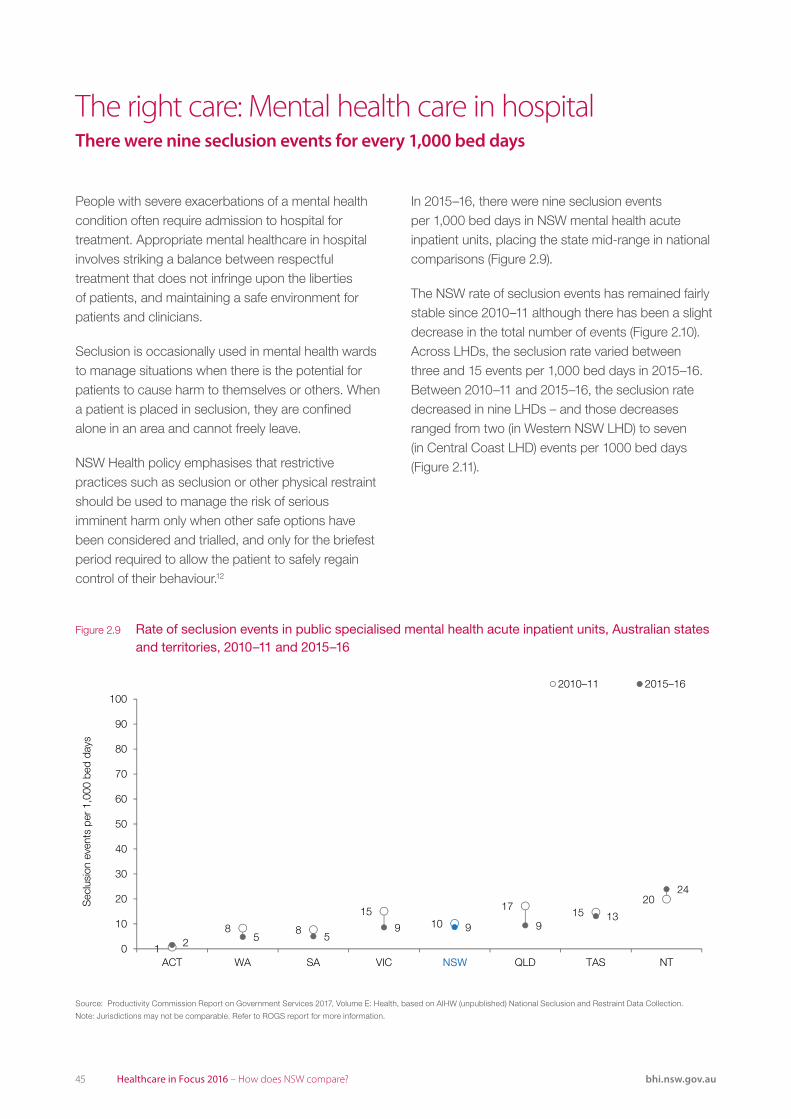
45 Healthcare in Focus 2016 – How does NSW compare? bhi.nsw.gov.au
People with severe exacerbations of a mental health condition often require admission to hospital for treatment. Appropriate mental healthcare in hospital involves striking a balance between respectful treatment that does not infringe upon the liberties of patients, and maintaining a safe environment for patients and clinicians.
Seclusion is occasionally used in mental health wards to manage situations when there is the potential for patients to cause harm to themselves or others. When a patient is placed in seclusion, they are confined alone in an area and cannot freely leave.
NSW Health policy emphasises that restrictive practices such as seclusion or other physical restraint should be used to manage the risk of serious imminent harm only when other safe options have been considered and trialled, and only for the briefest period required to allow the patient to safely regain control of their behaviour.12
The right care: Mental health care in hospitalThere were nine seclusion events for every 1,000 bed days
In 2015–16, there were nine seclusion events per 1,000 bed days in NSW mental health acute inpatient units, placing the state mid-range in national comparisons (Figure 2.9).
The NSW rate of seclusion events has remained fairly stable since 2010–11 although there has been a slight decrease in the total number of events (Figure 2.10). Across LHDs, the seclusion rate varied between three and 15 events per 1,000 bed days in 2015–16. Between 2010–11 and 2015–16, the seclusion rate decreased in nine LHDs – and those decreases ranged from two (in Western NSW LHD) to seven (in Central Coast LHD) events per 1000 bed days (Figure 2.11).
1
8 8
1510
17 1520
2 5 59 9 9
13
24
0
10
20
30
40
50
60
70
80
90
100
ACT WA SA VIC QLD TAS NT
Sec
lusi
on e
vent
s pe
r 1,
000
bed
days
2010–11 2015–16
NSW
Figure 2.9 Rate of seclusion events in public specialised mental health acute inpatient units, Australian states and territories, 2010–11 and 2015–16
Source: Productivity Commission Report on Government Services 2017, Volume E: Health, based on AIHW (unpublished) National Seclusion and Restraint Data Collection.
Note: Jurisdictions may not be comparable. Refer to ROGS report for more information.
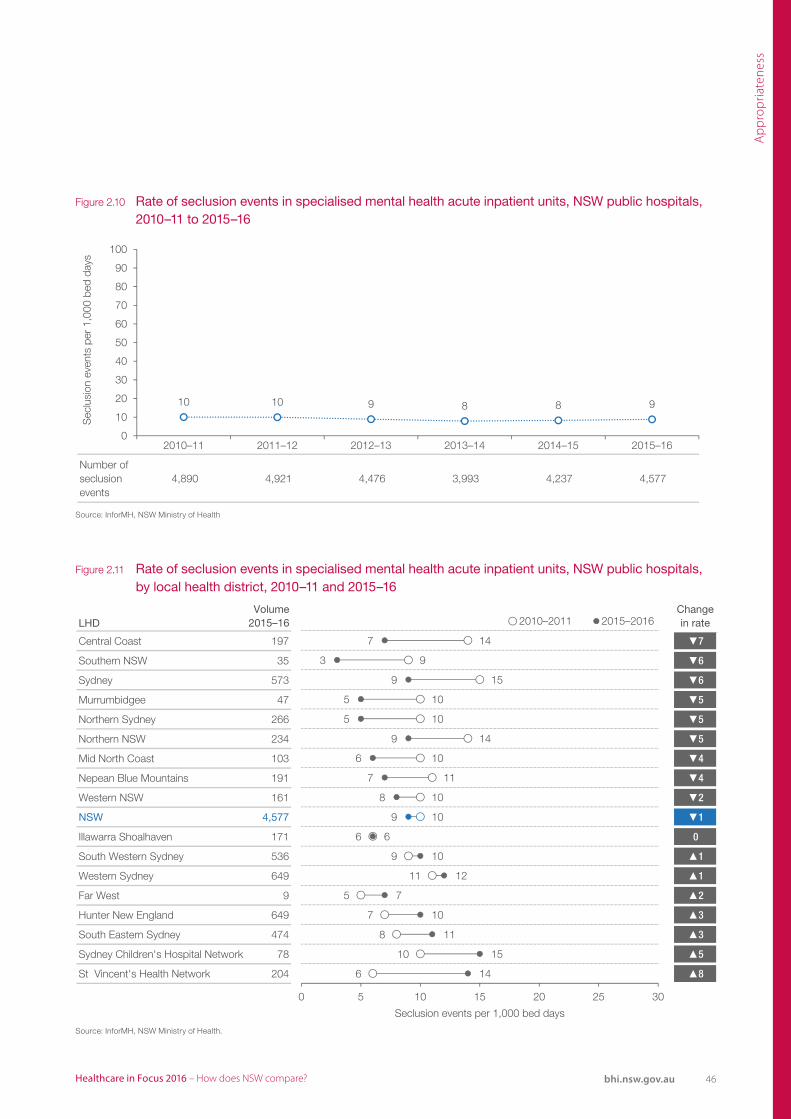
46Healthcare in Focus 2016 – How does NSW compare? bhi.nsw.gov.au
Ap
pro
pria
tene
ss
Number of seclusion events
4,890 4,921 4,476 3,993 4,237 4,577
10 10 9 8 8 9
0
10
20
30
40
50
60
70
80
90
100
2010–11 2011–12 2012–13 2013–14 2014–15 2015–16
Sec
lusi
on e
vent
s pe
r 1,
000
bed
days
Figure 2.10 Rate of seclusion events in specialised mental health acute inpatient units, NSW public hospitals, 2010–11 to 2015–16
Figure 2.11 Rate of seclusion events in specialised mental health acute inpatient units, NSW public hospitals, by local health district, 2010–11 and 2015–16
LHDVolume
2015–16Change in rate
Central Coast 197 ▼7
Southern NSW 35 ▼6
Sydney 573 ▼6
Murrumbidgee 47 ▼5
Northern Sydney 266 ▼5
Northern NSW 234 ▼5
Mid North Coast 103 ▼4
Nepean Blue Mountains 191 ▼4
Western NSW 161 ▼2
NSW 4,577 ▼1
Illawarra Shoalhaven 171 0
South Western Sydney 536 ▲1
Western Sydney 649 ▲1
Far West 9 ▲2
Hunter New England 649 ▲3
South Eastern Sydney 474 ▲3
Sydney Children's Hospital Network 78 ▲5
St Vincent's Health Network 204 ▲8
7
3
9
5
5
9
6
7
8
9
6
9
11
5
7
8
10
6
14
9
15
10
10
14
10
11
10
10
6
10
12
7
10
11
15
14
0 5 10 15 20 25 30
Seclusion events per 1,000 bed days
2015–20162010–2011
Source: InforMH, NSW Ministry of Health
Source: InforMH, NSW Ministry of Health.
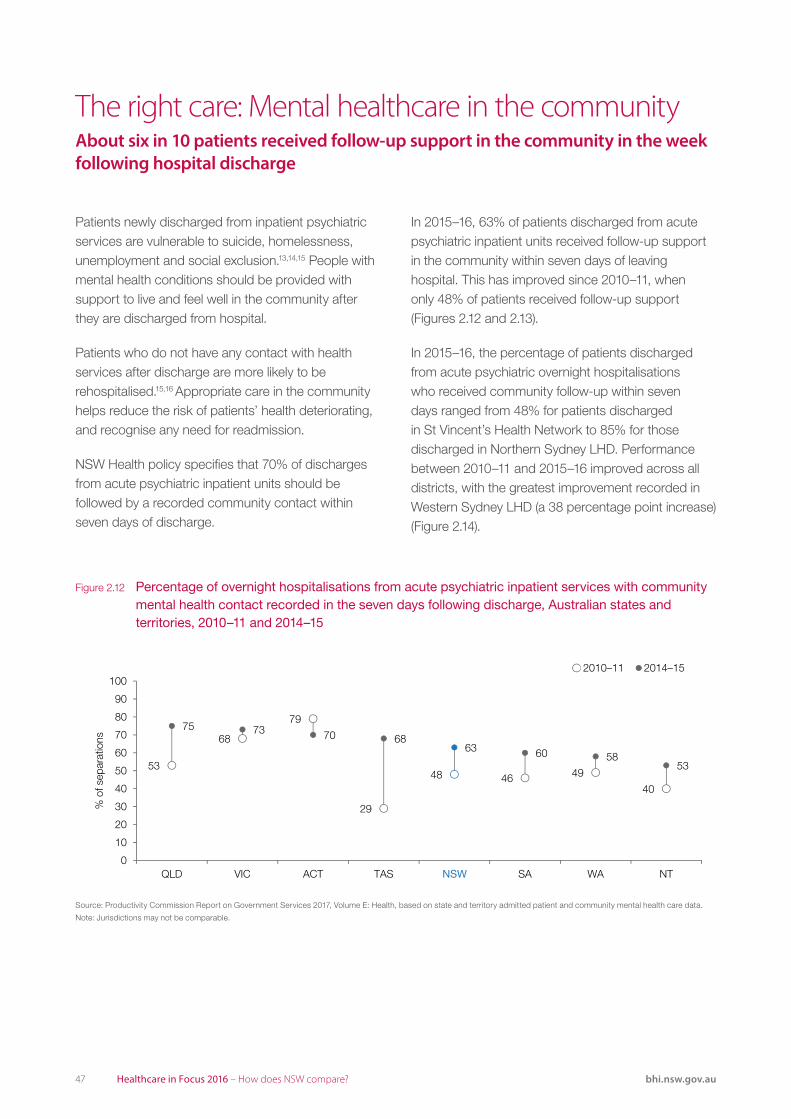
47 Healthcare in Focus 2016 – How does NSW compare? bhi.nsw.gov.au
Patients newly discharged from inpatient psychiatric services are vulnerable to suicide, homelessness, unemployment and social exclusion.13,14,15 People with mental health conditions should be provided with support to live and feel well in the community after they are discharged from hospital.
Patients who do not have any contact with health services after discharge are more likely to be rehospitalised.15,16 Appropriate care in the community helps reduce the risk of patients’ health deteriorating, and recognise any need for readmission.
NSW Health policy specifies that 70% of discharges from acute psychiatric inpatient units should be followed by a recorded community contact within seven days of discharge.
The right care: Mental healthcare in the communityAbout six in 10 patients received follow-up support in the community in the week following hospital discharge
In 2015–16, 63% of patients discharged from acute psychiatric inpatient units received follow-up support in the community within seven days of leaving hospital. This has improved since 2010–11, when only 48% of patients received follow-up support (Figures 2.12 and 2.13).
In 2015–16, the percentage of patients discharged from acute psychiatric overnight hospitalisations who received community follow-up within seven days ranged from 48% for patients discharged in St Vincent’s Health Network to 85% for those discharged in Northern Sydney LHD. Performance between 2010–11 and 2015–16 improved across all districts, with the greatest improvement recorded in Western Sydney LHD (a 38 percentage point increase) (Figure 2.14).
53
68
79
29
48 46 49
40
75 73 70 6863 60 58
53
0
10
20
30
40
50
60
70
80
90
100
QLD VIC ACT TAS SA WA NT
% o
f sep
arat
ions
2014–15
NSW
2010–11
Figure 2.12 Percentage of overnight hospitalisations from acute psychiatric inpatient services with community mental health contact recorded in the seven days following discharge, Australian states and territories, 2010–11 and 2014–15
Source: Productivity Commission Report on Government Services 2017, Volume E: Health, based on state and territory admitted patient and community mental health care data.
Note: Jurisdictions may not be comparable.
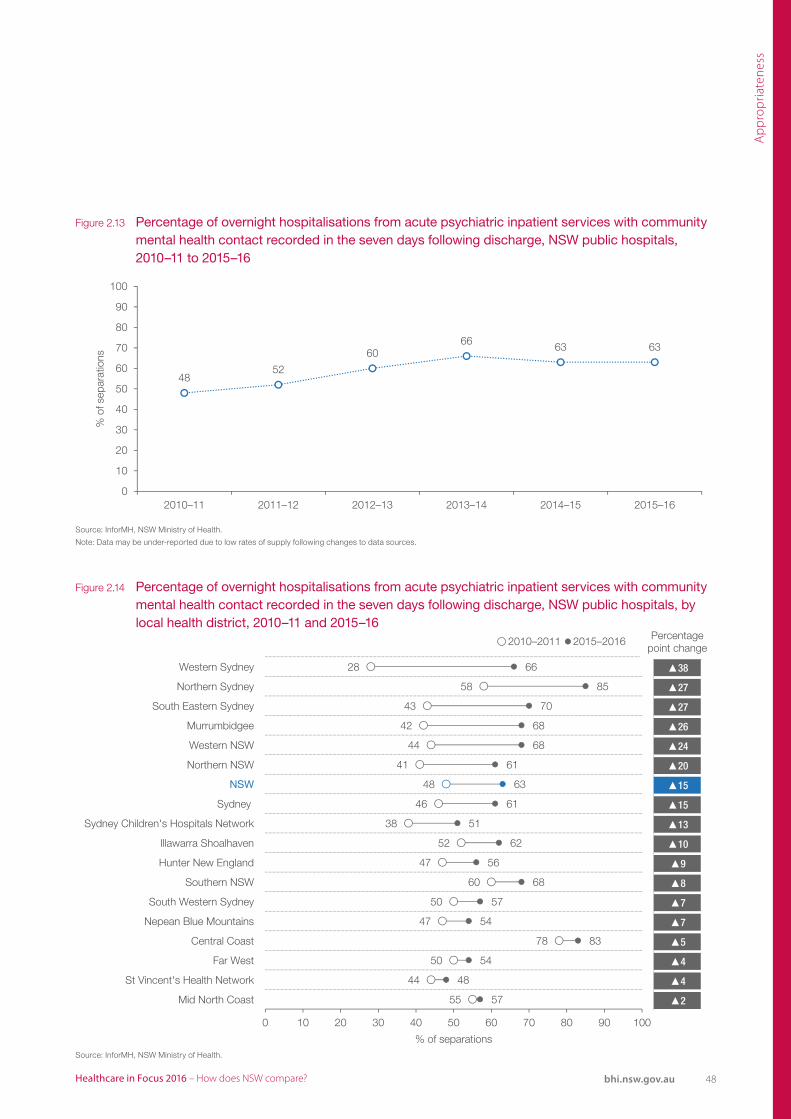
48Healthcare in Focus 2016 – How does NSW compare? bhi.nsw.gov.au
Ap
pro
pria
tene
ss
4852
6066 63 63
0
10
20
30
40
50
60
70
80
90
100
2010–11 2011–12 2012–13 2013–14 2014–15 2015–16
% o
f sep
arat
ions
▲38
▲27
▲27
▲26
▲24
▲20
▲15
▲15
▲13
▲10
▲9
▲8
▲7
▲7
▲5
▲4
▲4
▲2
Western Sydney
Northern Sydney
South Eastern Sydney
Murrumbidgee
Western NSW
Northern NSW
NSW
Sydney
Sydney Children's Hospitals Network
Illawarra Shoalhaven
Hunter New England
Southern NSW
South Western Sydney
Nepean Blue Mountains
Central Coast
Far West
St Vincent's Health Network
Mid North Coast
28
58
43
42
44
41
48
46
38
52
47
60
50
47
78
50
44
55
66
85
70
68
68
61
63
61
51
62
56
68
57
54
83
54
48
57
0 10 20 30 40 50 60 70 80 90 100
% of separations
2010–2011 2015–2016 Percentage point change
Figure 2.13 Percentage of overnight hospitalisations from acute psychiatric inpatient services with community mental health contact recorded in the seven days following discharge, NSW public hospitals, 2010–11 to 2015–16
Figure 2.14 Percentage of overnight hospitalisations from acute psychiatric inpatient services with community mental health contact recorded in the seven days following discharge, NSW public hospitals, by local health district, 2010–11 and 2015–16
Source: InforMH, NSW Ministry of Health.
Note: Data may be under-reported due to low rates of supply following changes to data sources.
Source: InforMH, NSW Ministry of Health.
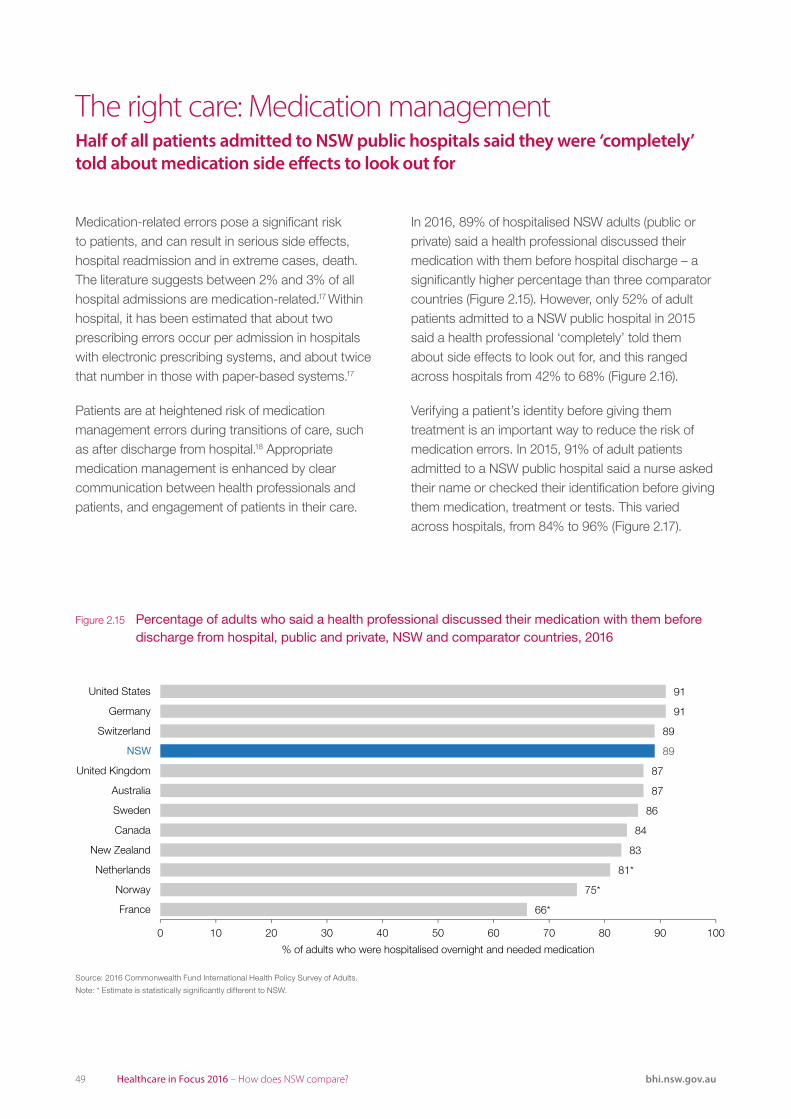
49 Healthcare in Focus 2016 – How does NSW compare? bhi.nsw.gov.au
Medication-related errors pose a significant risk to patients, and can result in serious side effects, hospital readmission and in extreme cases, death. The literature suggests between 2% and 3% of all hospital admissions are medication-related.17 Within hospital, it has been estimated that about two prescribing errors occur per admission in hospitals with electronic prescribing systems, and about twice that number in those with paper-based systems.17
Patients are at heightened risk of medication management errors during transitions of care, such as after discharge from hospital.18 Appropriate medication management is enhanced by clear communication between health professionals and patients, and engagement of patients in their care.
The right care: Medication managementHalf of all patients admitted to NSW public hospitals said they were ‘completely’ told about medication side effects to look out for
In 2016, 89% of hospitalised NSW adults (public or private) said a health professional discussed their medication with them before hospital discharge – a significantly higher percentage than three comparator countries (Figure 2.15). However, only 52% of adult patients admitted to a NSW public hospital in 2015 said a health professional ‘completely’ told them about side effects to look out for, and this ranged across hospitals from 42% to 68% (Figure 2.16).
Verifying a patient’s identity before giving them treatment is an important way to reduce the risk of medication errors. In 2015, 91% of adult patients admitted to a NSW public hospital said a nurse asked their name or checked their identification before giving them medication, treatment or tests. This varied across hospitals, from 84% to 96% (Figure 2.17).
66*
75*
81*
83
84
86
87
87
89
91
91
89
0 10 20 30 40 50 60 70 80 90 100
France
Norway
Netherlands
New Zealand
Canada
Sweden
Australia
United Kingdom
Switzerland
Germany
United States
% of adults who were hospitalised overnight and needed medication
NSW
Figure 2.15 Percentage of adults who said a health professional discussed their medication with them before discharge from hospital, public and private, NSW and comparator countries, 2016
Source: 2016 Commonwealth Fund International Health Policy Survey of Adults.
Note: * Estimate is statistically significantly different to NSW.
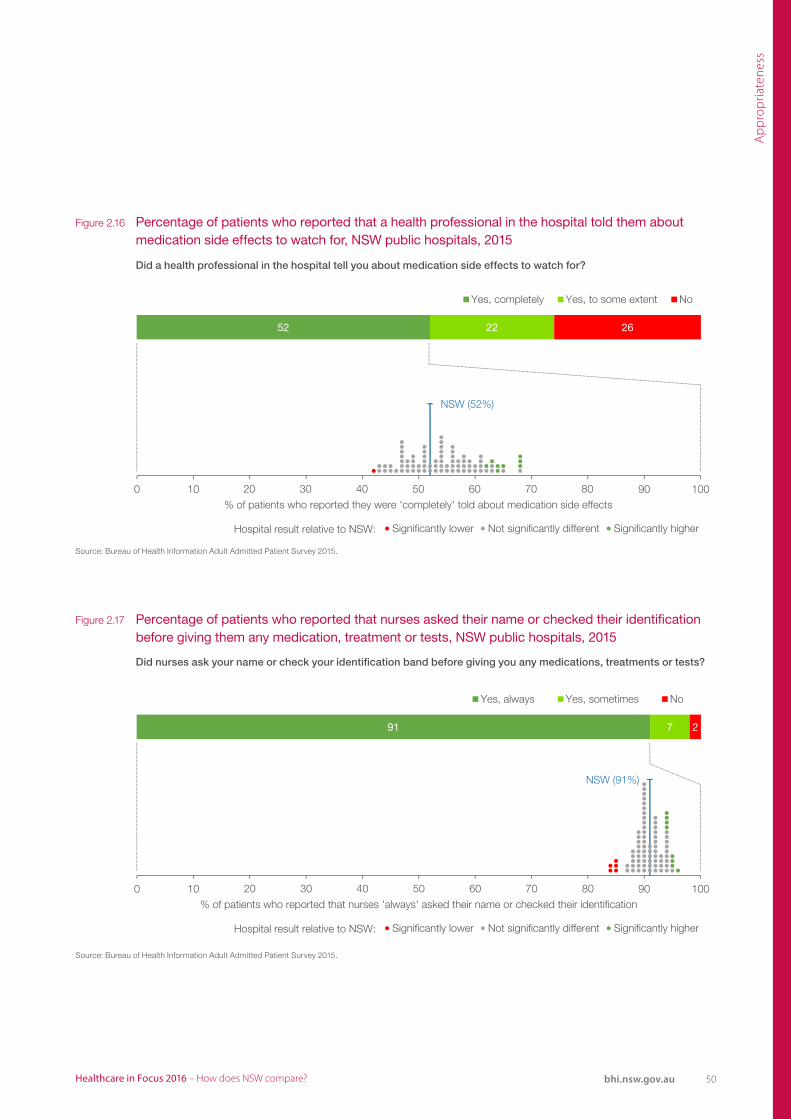
50Healthcare in Focus 2016 – How does NSW compare? bhi.nsw.gov.au
Ap
pro
pria
tene
ss
NSW (52%)
0 10 90 10020 30 40 50 60 70 80
% of patients who reported they were 'completely' told about medication side effects
Significantly lower Not significantly different Significantly higher
52 22 26
Yes, completely Yes, to some extent No
Hospital result relative to NSW:
NSW (91%)
0 10 90 10020 30 40 50 60 70 80
% of patients who reported that nurses 'always' asked their name or checked their identification
Significantly lower Not significantly different Significantly higher
91 7 2
Yes, always Yes, sometimes No
Hospital result relative to NSW:
Figure 2.16 Percentage of patients who reported that a health professional in the hospital told them about medication side effects to watch for, NSW public hospitals, 2015
Figure 2.17 Percentage of patients who reported that nurses asked their name or checked their identification before giving them any medication, treatment or tests, NSW public hospitals, 2015
Source: Bureau of Health Information Adult Admitted Patient Survey 2015.
Source: Bureau of Health Information Adult Admitted Patient Survey 2015.
Did a health professional in the hospital tell you about medication side effects to watch for?
Did nurses ask your name or check your identification band before giving you any medications, treatments or tests?
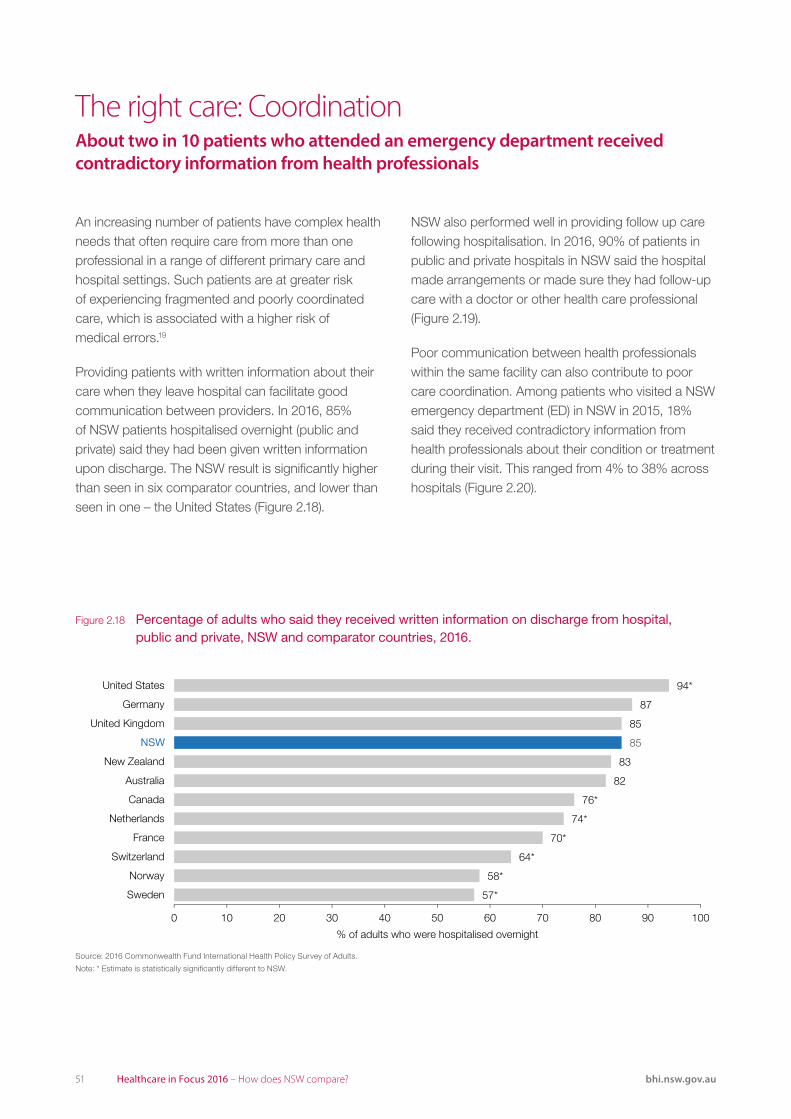
51 Healthcare in Focus 2016 – How does NSW compare? bhi.nsw.gov.au
An increasing number of patients have complex health needs that often require care from more than one professional in a range of different primary care and hospital settings. Such patients are at greater risk of experiencing fragmented and poorly coordinated care, which is associated with a higher risk of medical errors.19
Providing patients with written information about their care when they leave hospital can facilitate good communication between providers. In 2016, 85% of NSW patients hospitalised overnight (public and private) said they had been given written information upon discharge. The NSW result is significantly higher than seen in six comparator countries, and lower than seen in one – the United States (Figure 2.18).
The right care: Coordination About two in 10 patients who attended an emergency department received contradictory information from health professionals
NSW also performed well in providing follow up care following hospitalisation. In 2016, 90% of patients in public and private hospitals in NSW said the hospital made arrangements or made sure they had follow-up care with a doctor or other health care professional (Figure 2.19).
Poor communication between health professionals within the same facility can also contribute to poor care coordination. Among patients who visited a NSW emergency department (ED) in NSW in 2015, 18% said they received contradictory information from health professionals about their condition or treatment during their visit. This ranged from 4% to 38% across hospitals (Figure 2.20).
57*
58*
64*
70*
74*
76*
82
83
85
87
94*
85
0 10 20 30 40 50 60 70 80 90 100
Sweden
Norway
Switzerland
France
Netherlands
Canada
Australia
New Zealand
United Kingdom
Germany
United States
% of adults who were hospitalised overnight
NSW
Figure 2.18 Percentage of adults who said they received written information on discharge from hospital, public and private, NSW and comparator countries, 2016.
Source: 2016 Commonwealth Fund International Health Policy Survey of Adults.
Note: * Estimate is statistically significantly different to NSW.
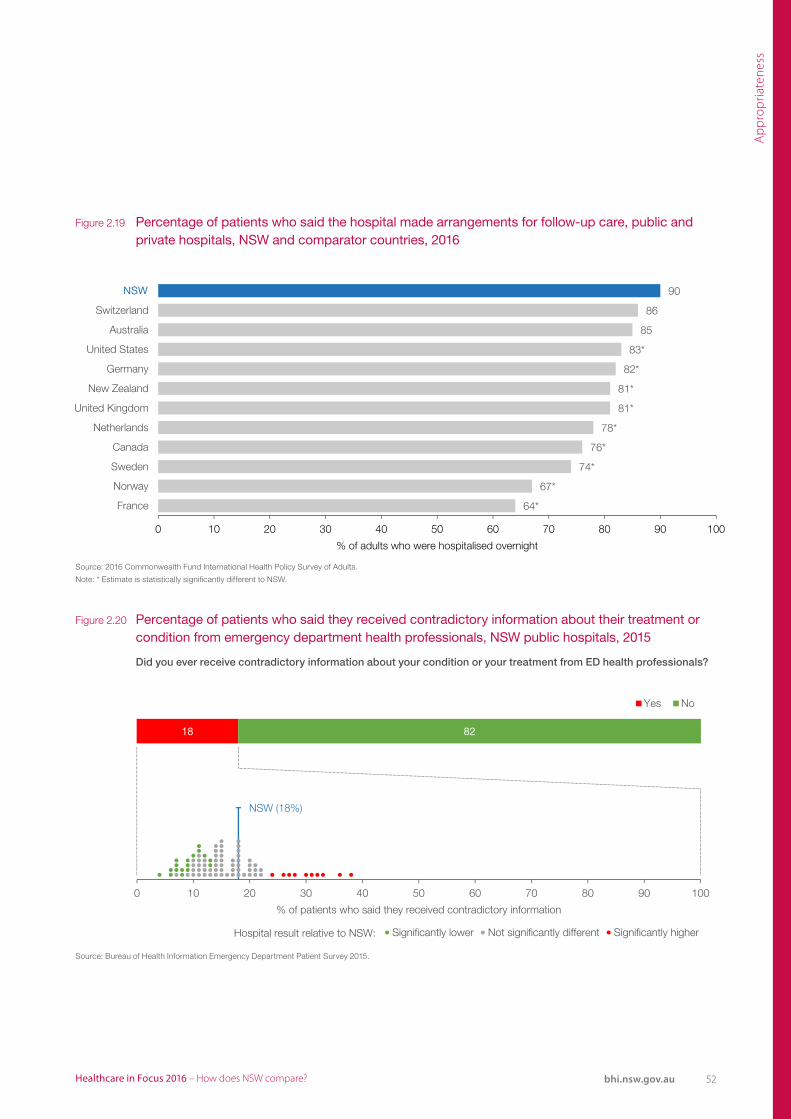
52Healthcare in Focus 2016 – How does NSW compare? bhi.nsw.gov.au
Ap
pro
pria
tene
ss
NSW 90
64*
67*
74*
76*
78*
81*
81*
82*
83*
85
86
0 10 20 30 40 50 60 70 80 90 100
France
Norway
Sweden
Canada
Netherlands
United Kingdom
New Zealand
Germany
United States
Australia
Switzerland
% of adults who were hospitalised overnight
NSW (18%)
0 10 20 30 40 50 60 70 80 90 100
% of patients who said they received contradictory information
Significantly lower Not significantly different Significantly higher
18 82
Yes No
Hospital result relative to NSW:
Figure 2.19 Percentage of patients who said the hospital made arrangements for follow-up care, public and private hospitals, NSW and comparator countries, 2016
Figure 2.20 Percentage of patients who said they received contradictory information about their treatment or condition from emergency department health professionals, NSW public hospitals, 2015
Source: 2016 Commonwealth Fund International Health Policy Survey of Adults.
Note: * Estimate is statistically significantly different to NSW.
Source: Bureau of Health Information Emergency Department Patient Survey 2015.
Did you ever receive contradictory information about your condition or your treatment from ED health professionals?
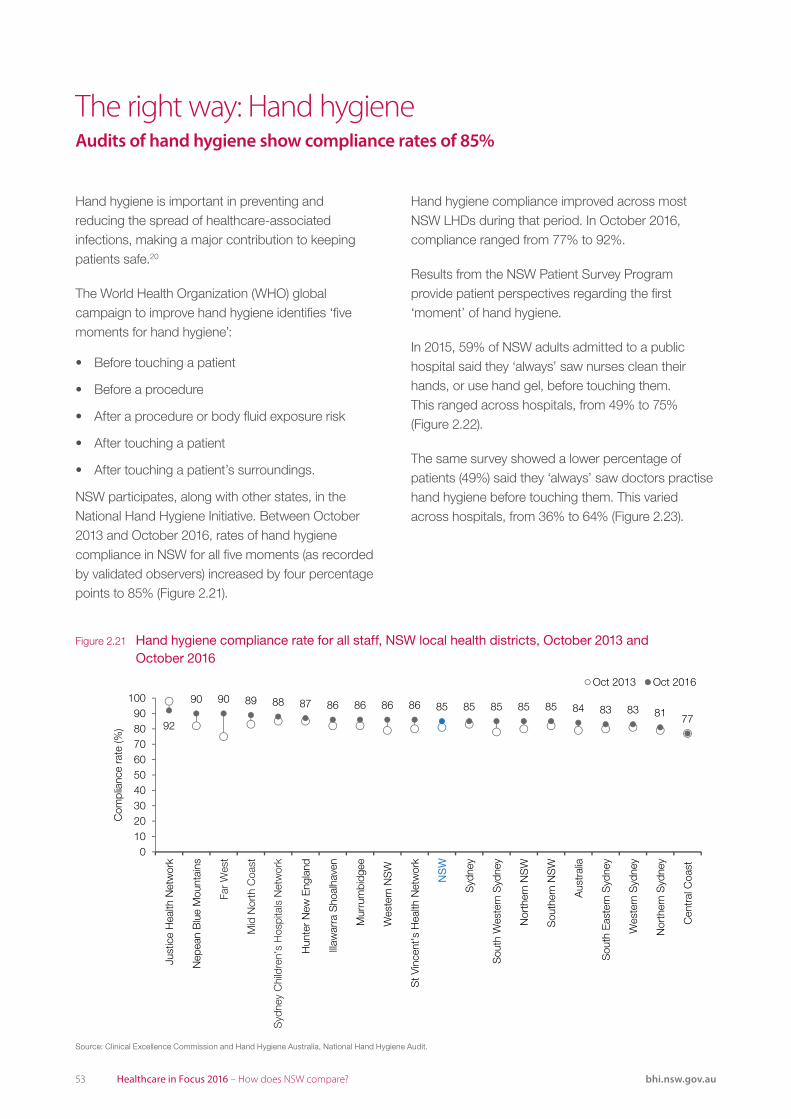
53 Healthcare in Focus 2016 – How does NSW compare? bhi.nsw.gov.au
Hand hygiene is important in preventing and reducing the spread of healthcare-associated infections, making a major contribution to keeping patients safe.20
The World Health Organization (WHO) global campaign to improve hand hygiene identifies ‘five moments for hand hygiene’:
• Before touching a patient
• Before a procedure
• After a procedure or body fluid exposure risk
• After touching a patient
• After touching a patient’s surroundings.
NSW participates, along with other states, in the National Hand Hygiene Initiative. Between October 2013 and October 2016, rates of hand hygiene compliance in NSW for all five moments (as recorded by validated observers) increased by four percentage points to 85% (Figure 2.21).
The right way: Hand hygiene Audits of hand hygiene show compliance rates of 85%
Hand hygiene compliance improved across most NSW LHDs during that period. In October 2016, compliance ranged from 77% to 92%.
Results from the NSW Patient Survey Program provide patient perspectives regarding the first ‘moment’ of hand hygiene.
In 2015, 59% of NSW adults admitted to a public hospital said they ‘always’ saw nurses clean their hands, or use hand gel, before touching them. This ranged across hospitals, from 49% to 75% (Figure 2.22).
The same survey showed a lower percentage of patients (49%) said they ‘always’ saw doctors practise hand hygiene before touching them. This varied across hospitals, from 36% to 64% (Figure 2.23).
92
90 90 89 88 87 86 86 86 86 85 85 85 85 85 84 83 83 81 77
0102030405060708090
100
Just
ice
Hea
lth N
etw
ork
Nep
ean
Blu
e M
ount
ains
Hun
ter
New
Eng
land
Illaw
arra
Sho
alha
ven
Mur
rum
bidg
ee
Wes
tern
NS
W
St V
ince
nt's
Hea
lth N
etw
ork
Nor
ther
n N
SW
Sou
ther
n N
SW
Aus
tral
ia
Sou
th E
aste
rn S
ydne
y
Wes
tern
Syd
ney
Nor
ther
n S
ydne
y
Cen
tral
Coa
st
Com
plia
nce
rate
(%)
Oct 2013 Oct 2016
NS
W
Syd
ney
Sou
th W
este
rn S
ydne
y
Far
Wes
t
Mid
Nor
th C
oast
Syd
ney
Chi
ldre
n's
Hos
pita
ls N
etw
ork
Figure 2.21 Hand hygiene compliance rate for all staff, NSW local health districts, October 2013 and October 2016
Source: Clinical Excellence Commission and Hand Hygiene Australia, National Hand Hygiene Audit.
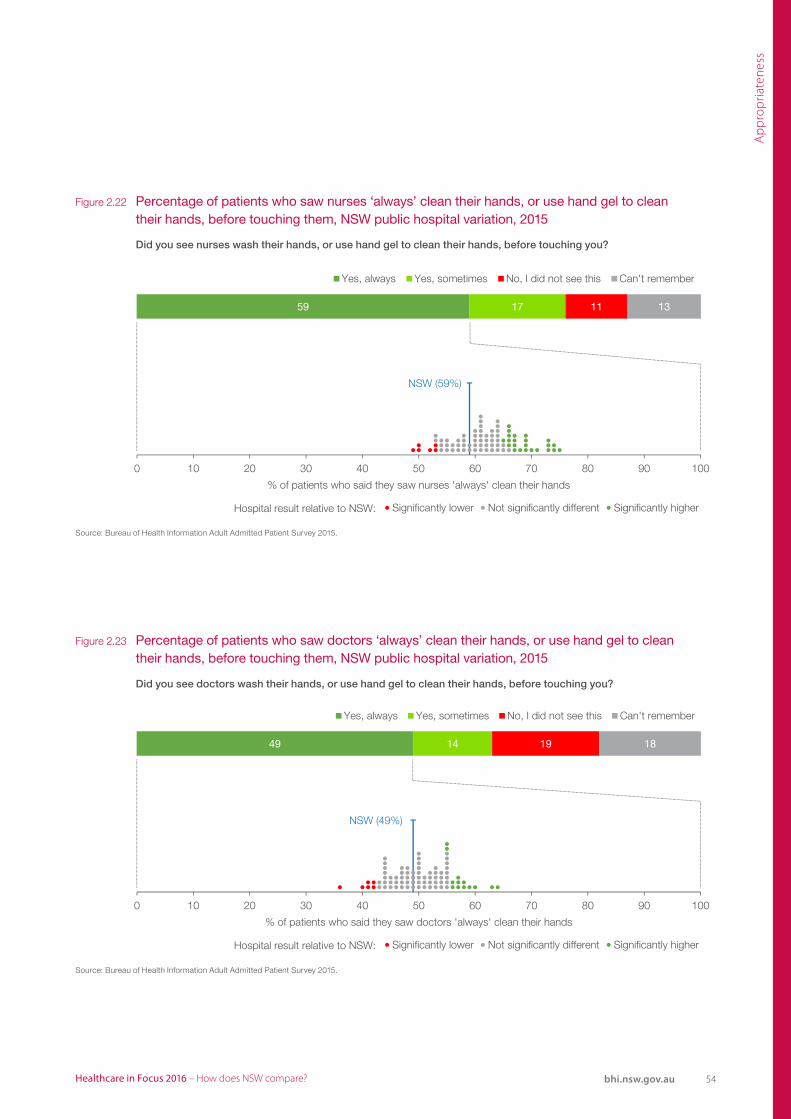
54Healthcare in Focus 2016 – How does NSW compare? bhi.nsw.gov.au
Ap
pro
pria
tene
ss
NSW (59%)
0 10 20 30 40 50 60 70 80 90 100
% of patients who said they saw nurses 'always' clean their hands
Significantly lower Not significantly different Significantly higher
59 17 11 13
Yes, always Yes, sometimes No, I did not see this Can't remember
Hospital result relative to NSW:
NSW (49%)
0 10 20 30 40 50 60 70 80 90 100
% of patients who said they saw doctors 'always' clean their hands
Significantly lower Not significantly different Significantly higher
49 14 19 18
Yes, always Yes, sometimes No, I did not see this Can't remember
Hospital result relative to NSW:
Figure 2.22 Percentage of patients who saw nurses ‘always’ clean their hands, or use hand gel to clean their hands, before touching them, NSW public hospital variation, 2015
Figure 2.23 Percentage of patients who saw doctors ‘always’ clean their hands, or use hand gel to clean their hands, before touching them, NSW public hospital variation, 2015
Source: Bureau of Health Information Adult Admitted Patient Survey 2015.
Source: Bureau of Health Information Adult Admitted Patient Survey 2015.
Did you see nurses wash their hands, or use hand gel to clean their hands, before touching you?
Did you see doctors wash their hands, or use hand gel to clean their hands, before touching you?
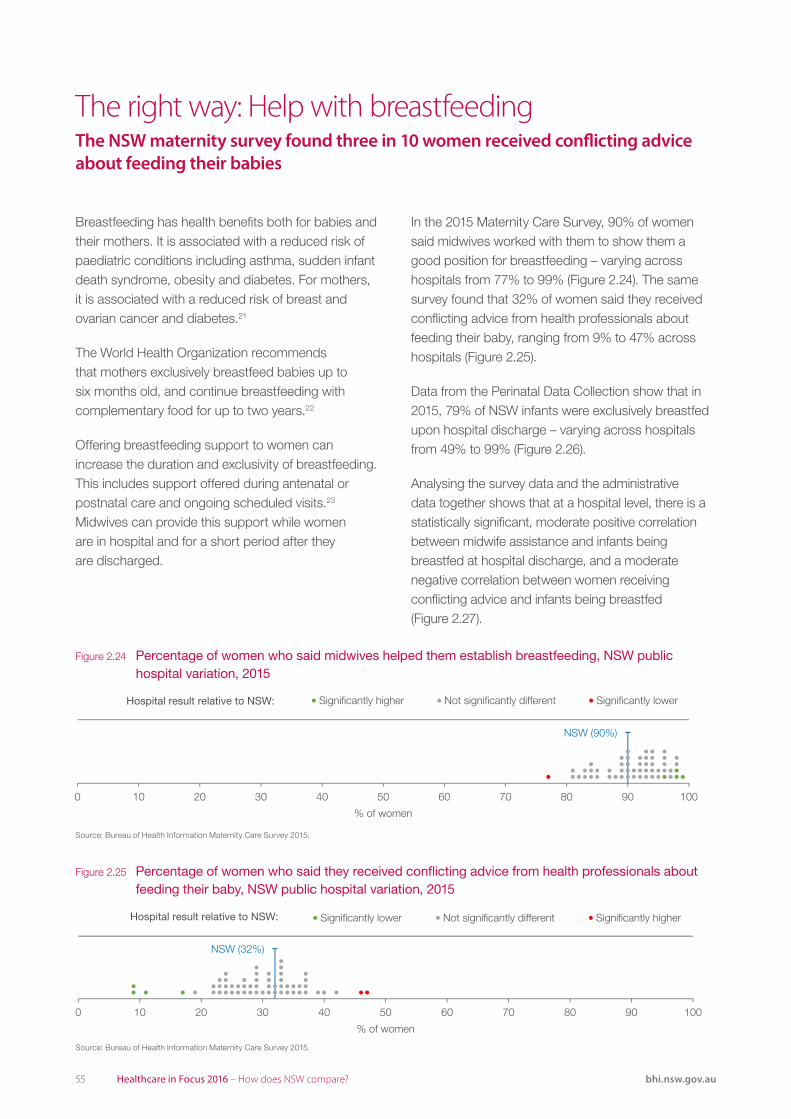
55 Healthcare in Focus 2016 – How does NSW compare? bhi.nsw.gov.au
Breastfeeding has health benefits both for babies and their mothers. It is associated with a reduced risk of paediatric conditions including asthma, sudden infant death syndrome, obesity and diabetes. For mothers, it is associated with a reduced risk of breast and ovarian cancer and diabetes.21
The World Health Organization recommends that mothers exclusively breastfeed babies up to six months old, and continue breastfeeding with complementary food for up to two years.22
Offering breastfeeding support to women can increase the duration and exclusivity of breastfeeding. This includes support offered during antenatal or postnatal care and ongoing scheduled visits.23 Midwives can provide this support while women are in hospital and for a short period after they are discharged.
The right way: Help with breastfeedingThe NSW maternity survey found three in 10 women received conflicting advice about feeding their babies
In the 2015 Maternity Care Survey, 90% of women said midwives worked with them to show them a good position for breastfeeding – varying across hospitals from 77% to 99% (Figure 2.24). The same survey found that 32% of women said they received conflicting advice from health professionals about feeding their baby, ranging from 9% to 47% across hospitals (Figure 2.25).
Data from the Perinatal Data Collection show that in 2015, 79% of NSW infants were exclusively breastfed upon hospital discharge – varying across hospitals from 49% to 99% (Figure 2.26).
Analysing the survey data and the administrative data together shows that at a hospital level, there is a statistically significant, moderate positive correlation between midwife assistance and infants being breastfed at hospital discharge, and a moderate negative correlation between women receiving conflicting advice and infants being breastfed (Figure 2.27).
Hospital result relative to NSW:
NSW (32%)
0 10 20 30 40 50 60 70 80 90 100
% of women
Significantly lower Not significantly different Significantly higher
Hospital result relative to NSW:
NSW (90%)
0 10 20 30 40 50 60 70 80 90 100
% of women
Significantly higher Not significantly different Significantly lower
Figure 2.24 Percentage of women who said midwives helped them establish breastfeeding, NSW public hospital variation, 2015
Figure 2.25 Percentage of women who said they received conflicting advice from health professionals about feeding their baby, NSW public hospital variation, 2015
Source: Bureau of Health Information Maternity Care Survey 2015.
Source: Bureau of Health Information Maternity Care Survey 2015.
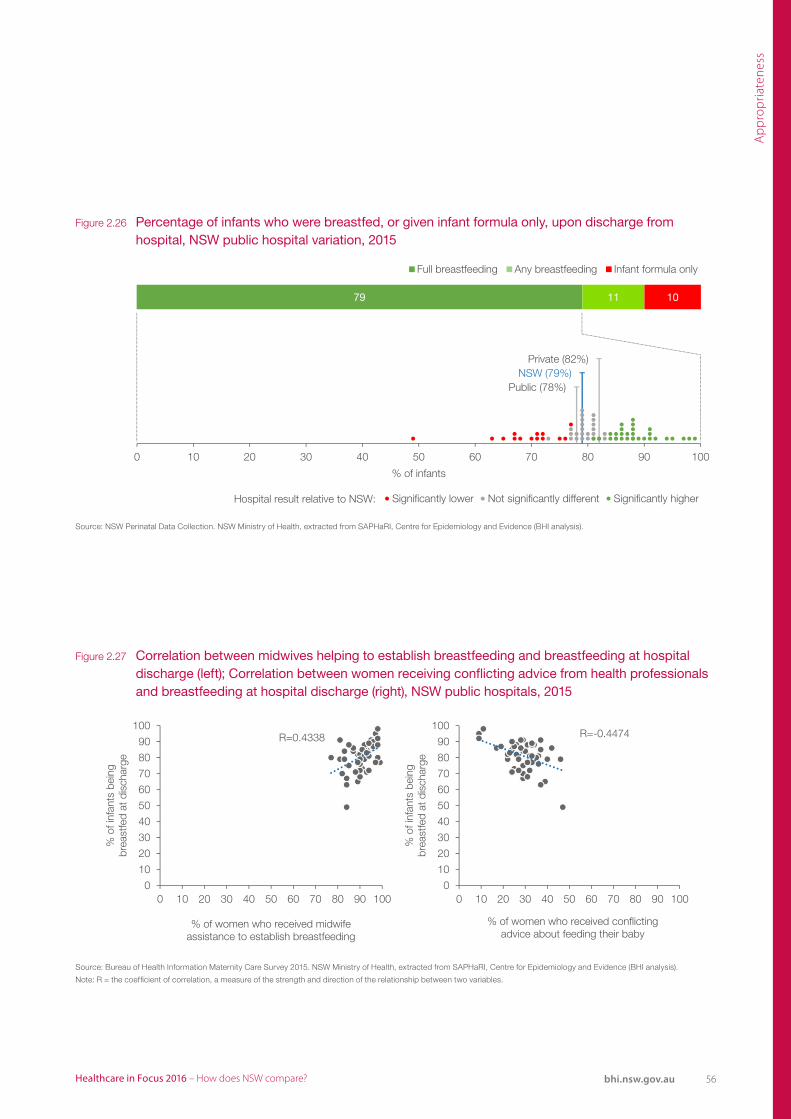
56Healthcare in Focus 2016 – How does NSW compare? bhi.nsw.gov.au
Ap
pro
pria
tene
ss
Public (78%)
Private (82%)NSW (79%)
0 10 20 30 40 50 60 70 80 90 100
% of infants
Significantly lower Not significantly different Significantly higher
79 11 10
Full breastfeeding Any breastfeeding Infant formula only
Hospital result relative to NSW:
0
10
20
30
40
50
60
70
80
90
100
0 10 20 30 40 50 60 70 80 90 100
% o
f inf
ants
bei
ngbr
east
fed
at d
isch
arge
% of women who received midwifeassistance to establish breastfeeding
R=0.4338
0
10
20
30
40
50
60
70
80
90
100
0 10 20 30 40 50 60 70 80 90 100
% o
f inf
ants
bei
ngbr
east
fed
at d
isch
arge
% of women who received conflictingadvice about feeding their baby
R=-0.4474
Figure 2.26 Percentage of infants who were breastfed, or given infant formula only, upon discharge from hospital, NSW public hospital variation, 2015
Figure 2.27 Correlation between midwives helping to establish breastfeeding and breastfeeding at hospital discharge (left); Correlation between women receiving conflicting advice from health professionals and breastfeeding at hospital discharge (right), NSW public hospitals, 2015
Source: NSW Perinatal Data Collection. NSW Ministry of Health, extracted from SAPHaRI, Centre for Epidemiology and Evidence (BHI analysis).
Source: Bureau of Health Information Maternity Care Survey 2015. NSW Ministry of Health, extracted from SAPHaRI, Centre for Epidemiology and Evidence (BHI analysis).
Note: R = the coefficient of correlation, a measure of the strength and direction of the relationship between two variables.
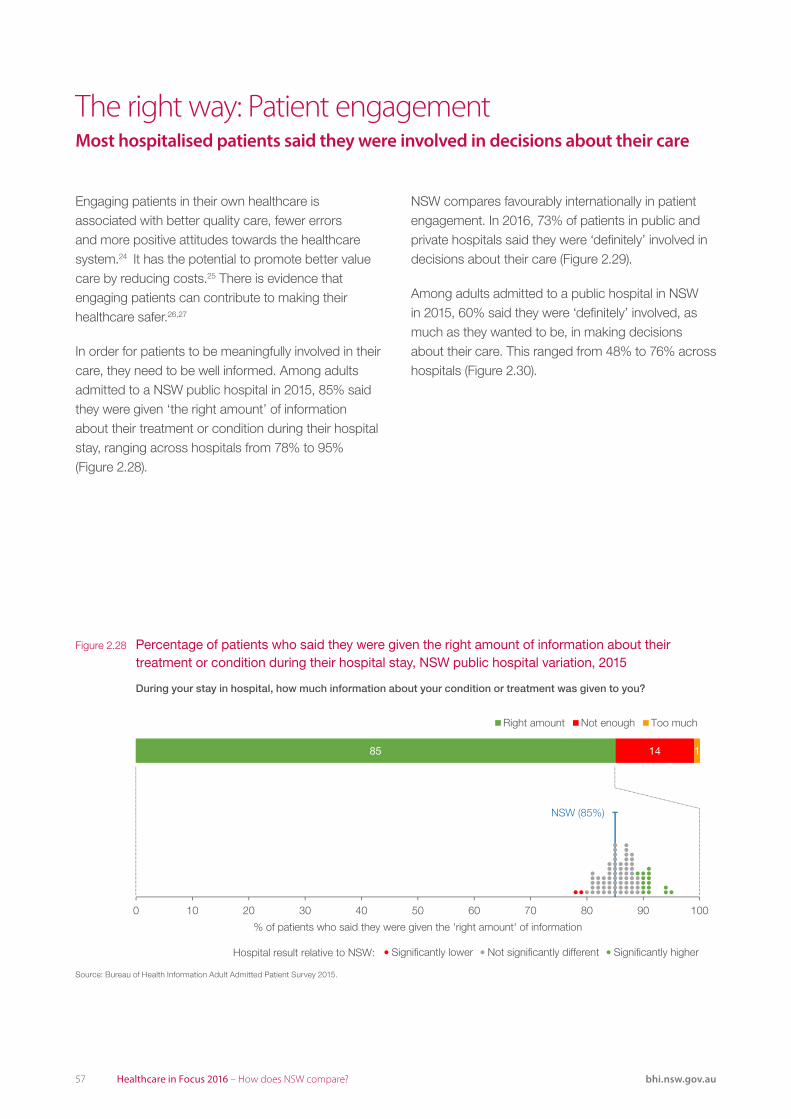
57 Healthcare in Focus 2016 – How does NSW compare? bhi.nsw.gov.au
Engaging patients in their own healthcare is associated with better quality care, fewer errors and more positive attitudes towards the healthcare system.24 It has the potential to promote better value care by reducing costs.25 There is evidence that engaging patients can contribute to making their healthcare safer.26,27
In order for patients to be meaningfully involved in their care, they need to be well informed. Among adults admitted to a NSW public hospital in 2015, 85% said they were given ‘the right amount’ of information about their treatment or condition during their hospital stay, ranging across hospitals from 78% to 95% (Figure 2.28).
The right way: Patient engagementMost hospitalised patients said they were involved in decisions about their care
NSW compares favourably internationally in patient engagement. In 2016, 73% of patients in public and private hospitals said they were ‘definitely’ involved in decisions about their care (Figure 2.29).
Among adults admitted to a public hospital in NSW in 2015, 60% said they were ‘definitely’ involved, as much as they wanted to be, in making decisions about their care. This ranged from 48% to 76% across hospitals (Figure 2.30).
NSW (85%)
0 10 20 30 40 50 60 70 80 90 100
% of patients who said they were given the 'right amount' of information
Significantly lower Not significantly different Significantly higher
85 14 1
Right amount Not enough Too much
Hospital result relative to NSW:
Figure 2.28 Percentage of patients who said they were given the right amount of information about their treatment or condition during their hospital stay, NSW public hospital variation, 2015
Source: Bureau of Health Information Adult Admitted Patient Survey 2015.
During your stay in hospital, how much information about your condition or treatment was given to you?
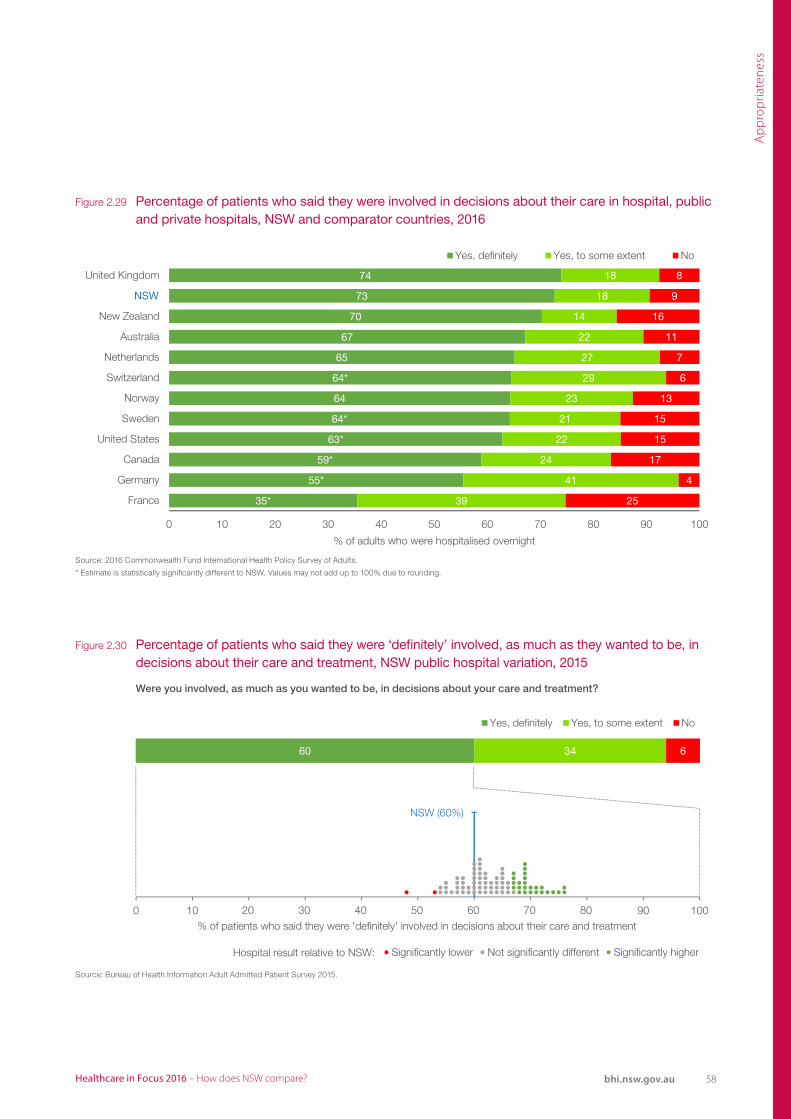
58Healthcare in Focus 2016 – How does NSW compare? bhi.nsw.gov.au
Ap
pro
pria
tene
ss
35*
55*
59*
63*
64*
64
64*
65
67
70
73
74
39
41
24
22
21
23
29
27
22
14
18
18
25
4
17
15
15
13
6
7
11
16
9
8
0 10 20 30 40 50 60 70 80 90 100
France
Germany
Canada
United States
Sweden
Norway
Switzerland
Netherlands
Australia
New Zealand
United Kingdom
% of adults who were hospitalised overnight
Yes, definitely Yes, to some extent No
NSW
NSW (60%)
0 10 90 10020 30 40 50 60 70 80
% of patients who said they were 'definitely' involved in decisions about their care and treatment
Significantly lower Not significantly different Significantly higher
60 34 6
Yes, definitely Yes, to some extent No
Hospital result relative to NSW:
Figure 2.29 Percentage of patients who said they were involved in decisions about their care in hospital, public and private hospitals, NSW and comparator countries, 2016
Figure 2.30 Percentage of patients who said they were ‘definitely’ involved, as much as they wanted to be, in decisions about their care and treatment, NSW public hospital variation, 2015
Source: 2016 Commonwealth Fund International Health Policy Survey of Adults.
* Estimate is statistically significantly different to NSW. Values may not add up to 100% due to rounding.
Source: Bureau of Health Information Adult Admitted Patient Survey 2015.
Were you involved, as much as you wanted to be, in decisions about your care and treatment?
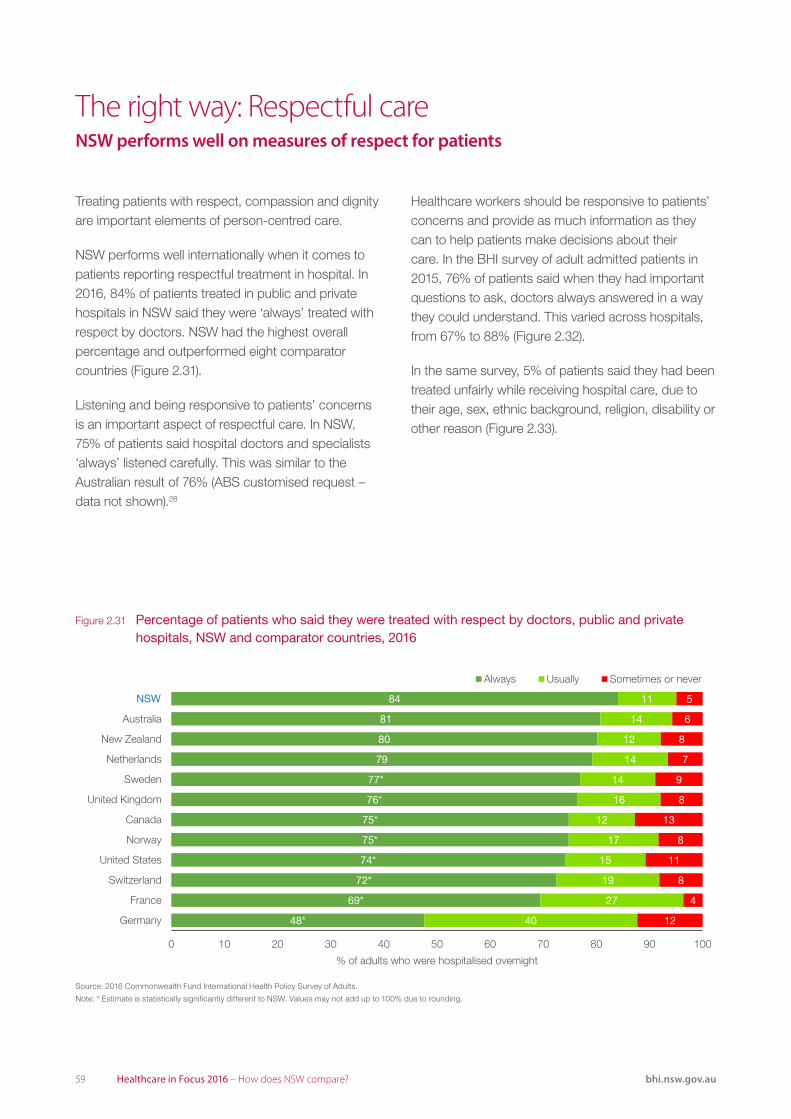
59 Healthcare in Focus 2016 – How does NSW compare? bhi.nsw.gov.au
Treating patients with respect, compassion and dignity are important elements of person-centred care.
NSW performs well internationally when it comes to patients reporting respectful treatment in hospital. In 2016, 84% of patients treated in public and private hospitals in NSW said they were ‘always’ treated with respect by doctors. NSW had the highest overall percentage and outperformed eight comparator countries (Figure 2.31).
Listening and being responsive to patients’ concerns is an important aspect of respectful care. In NSW, 75% of patients said hospital doctors and specialists ‘always’ listened carefully. This was similar to the Australian result of 76% (ABS customised request – data not shown).28
The right way: Respectful careNSW performs well on measures of respect for patients
Healthcare workers should be responsive to patients’ concerns and provide as much information as they can to help patients make decisions about their care. In the BHI survey of adult admitted patients in 2015, 76% of patients said when they had important questions to ask, doctors always answered in a way they could understand. This varied across hospitals, from 67% to 88% (Figure 2.32).
In the same survey, 5% of patients said they had been treated unfairly while receiving hospital care, due to their age, sex, ethnic background, religion, disability or other reason (Figure 2.33).
48*
69*
72*
74*
75*
75*
76*
77*
79
80
81
84
40
27
19
15
17
12
16
14
14
12
14
11
12
4
8
11
8
13
8
9
7
8
6
5
0 10 20 30 40 50 60 70 80 90 100
Germany
France
Switzerland
United States
Norway
Canada
United Kingdom
Sweden
Netherlands
New Zealand
Australia
% of adults who were hospitalised overnight
Always Usually Sometimes or never
NSW
Figure 2.31 Percentage of patients who said they were treated with respect by doctors, public and private hospitals, NSW and comparator countries, 2016
Source: 2016 Commonwealth Fund International Health Policy Survey of Adults.
Note: * Estimate is statistically significantly different to NSW. Values may not add up to 100% due to rounding.
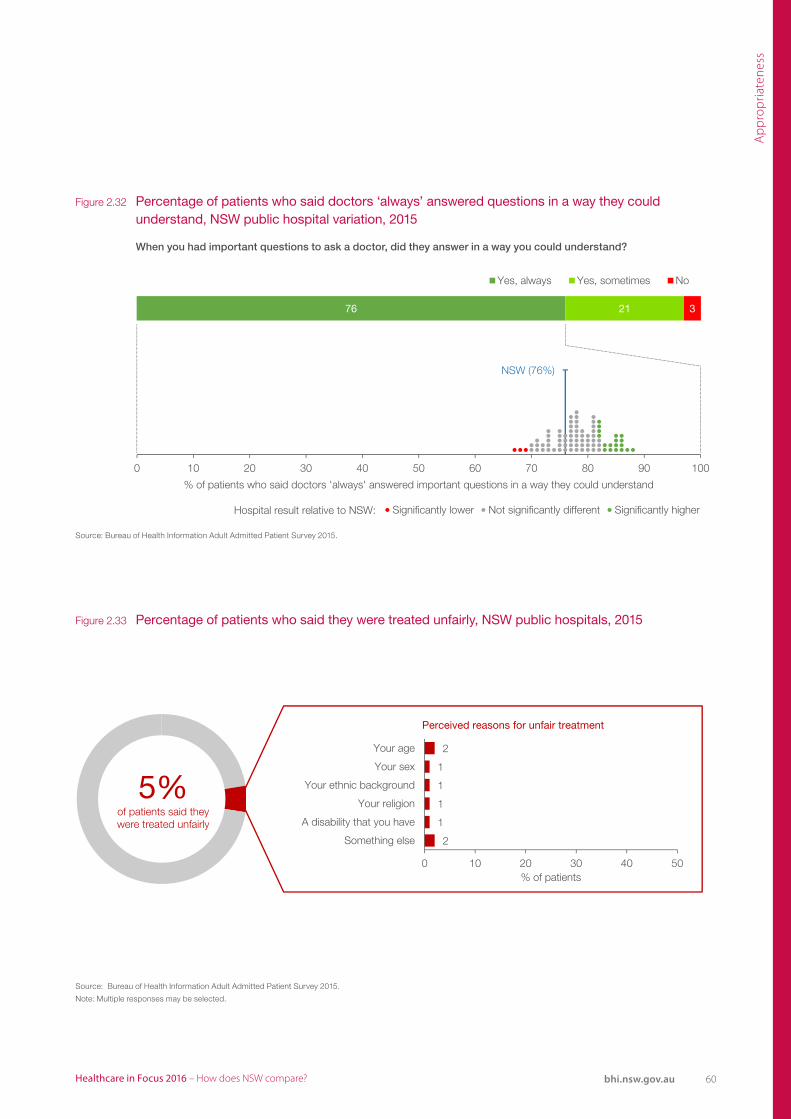
60Healthcare in Focus 2016 – How does NSW compare? bhi.nsw.gov.au
Ap
pro
pria
tene
ss
NSW (76%)
0 10 20 30 40 50 60 70 80 90 100
% of patients who said doctors 'always' answered important questions in a way they could understand
Significantly lower Not significantly different Significantly higher
76 21 3
Yes, always Yes, sometimes No
Hospital result relative to NSW:
Figure 2.32 Percentage of patients who said doctors ‘always’ answered questions in a way they could understand, NSW public hospital variation, 2015
Source: Bureau of Health Information Adult Admitted Patient Survey 2015.
When you had important questions to ask a doctor, did they answer in a way you could understand?
2
1
1
1
1
2
0 10 20 30 40 50
Something else
A disability that you have
Your religion
Your ethnic background
Your sex
Your age
% of patients
Perceived reasons for unfair treatment
5%of patients said they were treated unfairly
Figure 2.33 Percentage of patients who said they were treated unfairly, NSW public hospitals, 2015
Source: Bureau of Health Information Adult Admitted Patient Survey 2015.
Note: Multiple responses may be selected.

61 Healthcare in Focus 2016 – How does NSW compare? bhi.nsw.gov.au
EffectivenessMaking a difference for patients
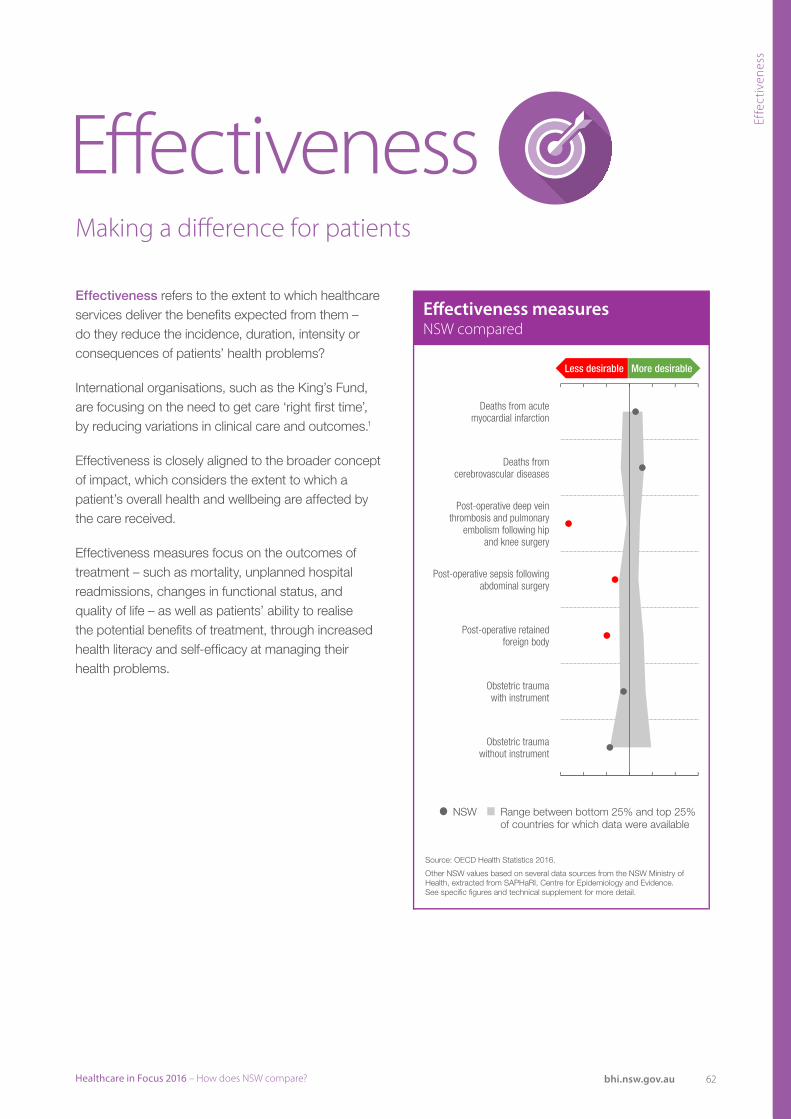
62Healthcare in Focus 2016 – How does NSW compare? bhi.nsw.gov.au
Effe
ctiv
enes
s
EffectivenessMaking a difference for patients
Effectiveness refers to the extent to which healthcare services deliver the benefits expected from them – do they reduce the incidence, duration, intensity or consequences of patients’ health problems?
International organisations, such as the King’s Fund, are focusing on the need to get care ‘right first time’, by reducing variations in clinical care and outcomes.1
Effectiveness is closely aligned to the broader concept of impact, which considers the extent to which a patient’s overall health and wellbeing are affected by the care received.
Effectiveness measures focus on the outcomes of treatment – such as mortality, unplanned hospital readmissions, changes in functional status, and quality of life – as well as patients’ ability to realise the potential benefits of treatment, through increased health literacy and self-efficacy at managing their health problems.
Deaths from acutemyocardial infarction
Deaths from cerebrovascular diseases
Post-operative deep veinthrombosis and pulmonary
embolism following hipand knee surgery
Post-operative sepsis following abdominal surgery
Post-operative retainedforeign body
Obstetric traumawith instrument
Obstetric traumawithout instrument
More desirableLess desirable
NSW Range between bottom 25% and top 25%of countries for which data were available
Source: OECD Health Statistics 2016.
Other NSW values based on several data sources from the NSW Ministry of Health, extracted from SAPHaRI, Centre for Epidemiology and Evidence.See specific figures and technical supplement for more detail.
Effectiveness measuresNSW compared
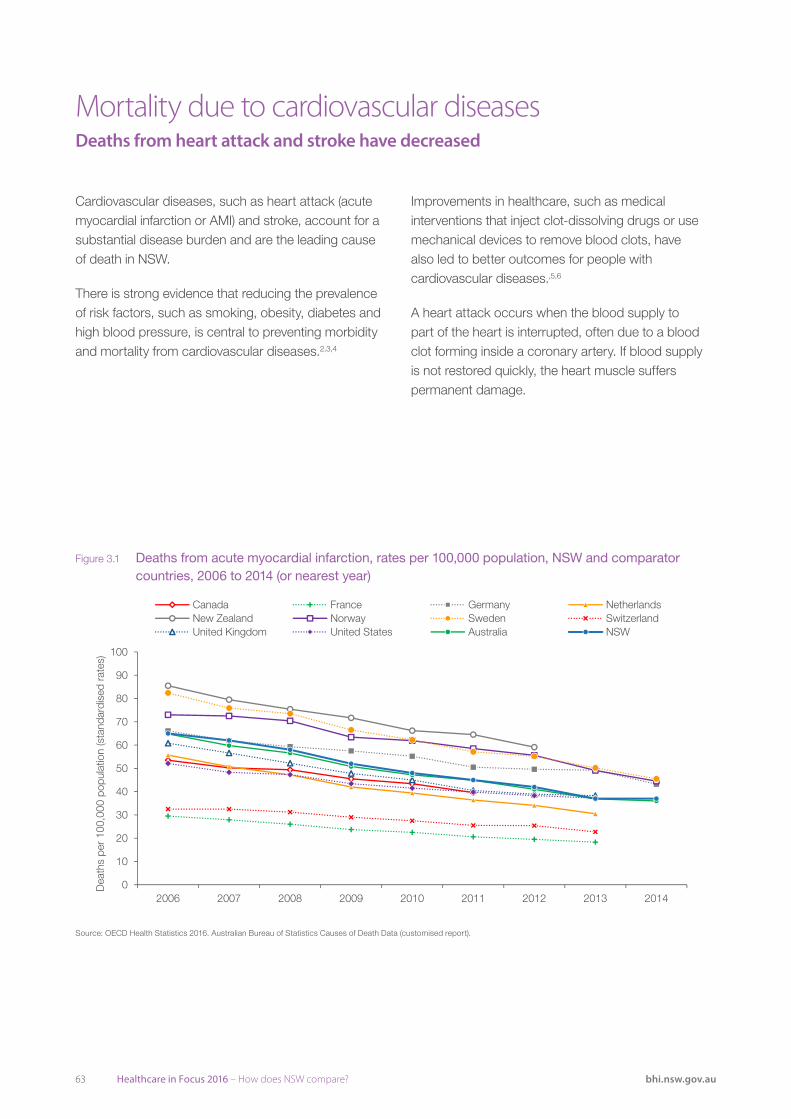
63 Healthcare in Focus 2016 – How does NSW compare? bhi.nsw.gov.au
Cardiovascular diseases, such as heart attack (acute myocardial infarction or AMI) and stroke, account for a substantial disease burden and are the leading cause of death in NSW.
There is strong evidence that reducing the prevalence of risk factors, such as smoking, obesity, diabetes and high blood pressure, is central to preventing morbidity and mortality from cardiovascular diseases.2,3,4
Mortality due to cardiovascular diseases Deaths from heart attack and stroke have decreased
Improvements in healthcare, such as medical interventions that inject clot-dissolving drugs or use mechanical devices to remove blood clots, have also led to better outcomes for people with cardiovascular diseases.,5,6
A heart attack occurs when the blood supply to part of the heart is interrupted, often due to a blood clot forming inside a coronary artery. If blood supply is not restored quickly, the heart muscle suffers permanent damage.
Source: OECD Health Statistics 2016. ABS Causes of Death Data (customised report).
0
10
20
30
40
50
60
70
80
90
100
2006 2007 2008 2009 2010 2011 2012 2013 2014
Dea
ths
per
100,
000
popu
latio
n (s
tand
ardi
sed
rate
s)
Canada France Germany NetherlandsNew Zealand Norway Sweden SwitzerlandUnited Kingdom United States Australia NSW
Figure 3.1 Deaths from acute myocardial infarction, rates per 100,000 population, NSW and comparator countries, 2006 to 2014 (or nearest year)
Source: OECD Health Statistics 2016. Australian Bureau of Statistics Causes of Death Data (customised report).
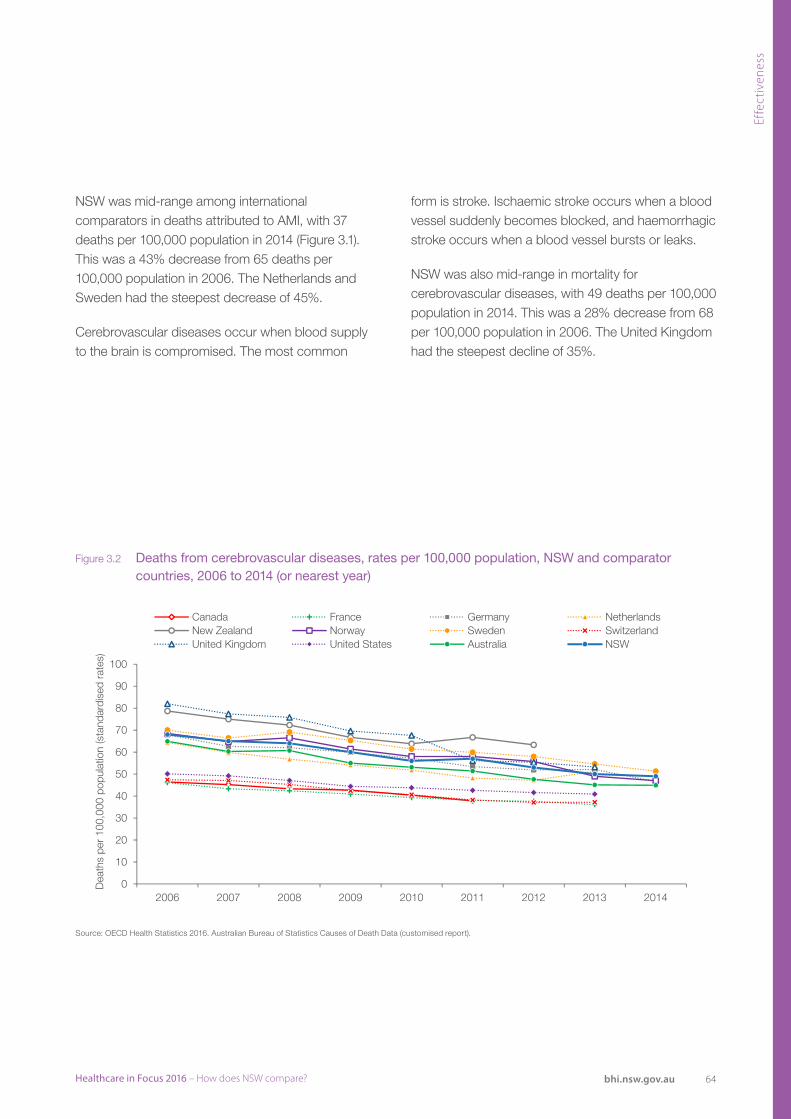
64Healthcare in Focus 2016 – How does NSW compare? bhi.nsw.gov.au
Effe
ctiv
enes
s
Source: OECD Health Statistics 2016. ABS Causes of Death Data (customised report).
0
10
20
30
40
50
60
70
80
90
100
2006 2007 2008 2009 2010 2011 2012 2013 2014
Dea
ths
per
100,
000
popu
latio
n (s
tand
ardi
sed
rate
s)
Canada France Germany NetherlandsNew Zealand Norway Sweden SwitzerlandUnited Kingdom United States Australia NSW
Figure 3.2 Deaths from cerebrovascular diseases, rates per 100,000 population, NSW and comparator countries, 2006 to 2014 (or nearest year)
Source: OECD Health Statistics 2016. Australian Bureau of Statistics Causes of Death Data (customised report).
NSW was mid-range among international comparators in deaths attributed to AMI, with 37 deaths per 100,000 population in 2014 (Figure 3.1). This was a 43% decrease from 65 deaths per 100,000 population in 2006. The Netherlands and Sweden had the steepest decrease of 45%.
Cerebrovascular diseases occur when blood supply to the brain is compromised. The most common
form is stroke. Ischaemic stroke occurs when a blood vessel suddenly becomes blocked, and haemorrhagic stroke occurs when a blood vessel bursts or leaks.
NSW was also mid-range in mortality for cerebrovascular diseases, with 49 deaths per 100,000 population in 2014. This was a 28% decrease from 68 per 100,000 population in 2006. The United Kingdom had the steepest decline of 35%.
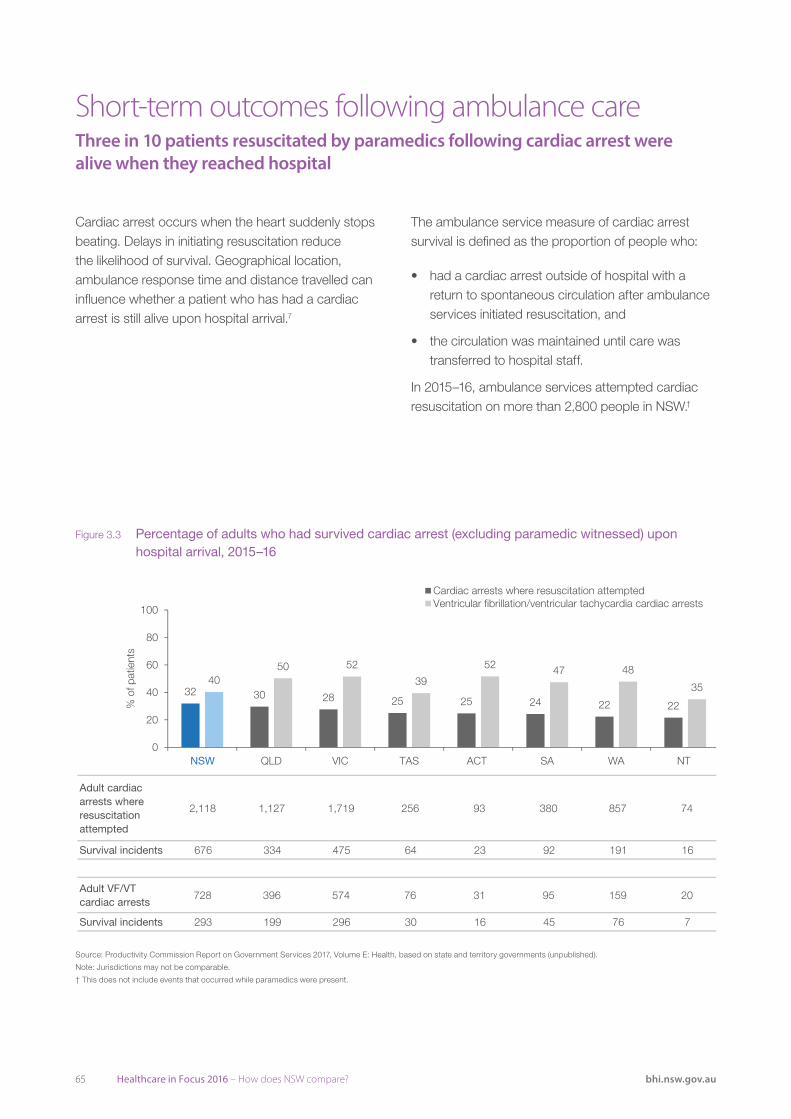
65 Healthcare in Focus 2016 – How does NSW compare? bhi.nsw.gov.au
Cardiac arrest occurs when the heart suddenly stops beating. Delays in initiating resuscitation reduce the likelihood of survival. Geographical location, ambulance response time and distance travelled can influence whether a patient who has had a cardiac arrest is still alive upon hospital arrival.7
Short-term outcomes following ambulance care Three in 10 patients resuscitated by paramedics following cardiac arrest were alive when they reached hospital
The ambulance service measure of cardiac arrest survival is defined as the proportion of people who:
• had a cardiac arrest outside of hospital with a return to spontaneous circulation after ambulance services initiated resuscitation, and
• the circulation was maintained until care was transferred to hospital staff.
In 2015–16, ambulance services attempted cardiac resuscitation on more than 2,800 people in NSW.†
Adult cardiac arrests where resuscitation attempted
2,118 1,127 1,719 256 93 380 857 74
Survival incidents 676 334 475 64 23 92 191 16
Adult VF/VT cardiac arrests
728 396 574 76 31 95 159 20
Survival incidents 293 199 296 30 16 45 76 7
Source: Productivity Commission Report on Government Services 2017, Volume E: Health, based on state and territory governments (unpublished).
Note: Differences in definitions may not make the jurisdictions directly comparable. In NSW, only data available in the electronic Medical Record (eMR) are used. There may be limitations
around the accuracy and completeness of data. The NSW Ambulance source of information are the datasets populated by paramedics. Therefore, rates can only reflect a best estimate of actual rates.
32 30 28 25 25 24 22 22
4050 52
39
52 47 48
35
0
20
40
60
80
100
QLD VIC TAS ACT SA WA NT
% o
f pat
ient
s
Cardiac arrests where resuscitation attemptedVentricular fibrillation/ventricular tachycardia cardiac arrests
NSW
Figure 3.3 Percentage of adults who had survived cardiac arrest (excluding paramedic witnessed) upon hospital arrival, 2015–16
Source: Productivity Commission Report on Government Services 2017, Volume E: Health, based on state and territory governments (unpublished).
Note: Jurisdictions may not be comparable.
† This does not include events that occurred while paramedics were present.
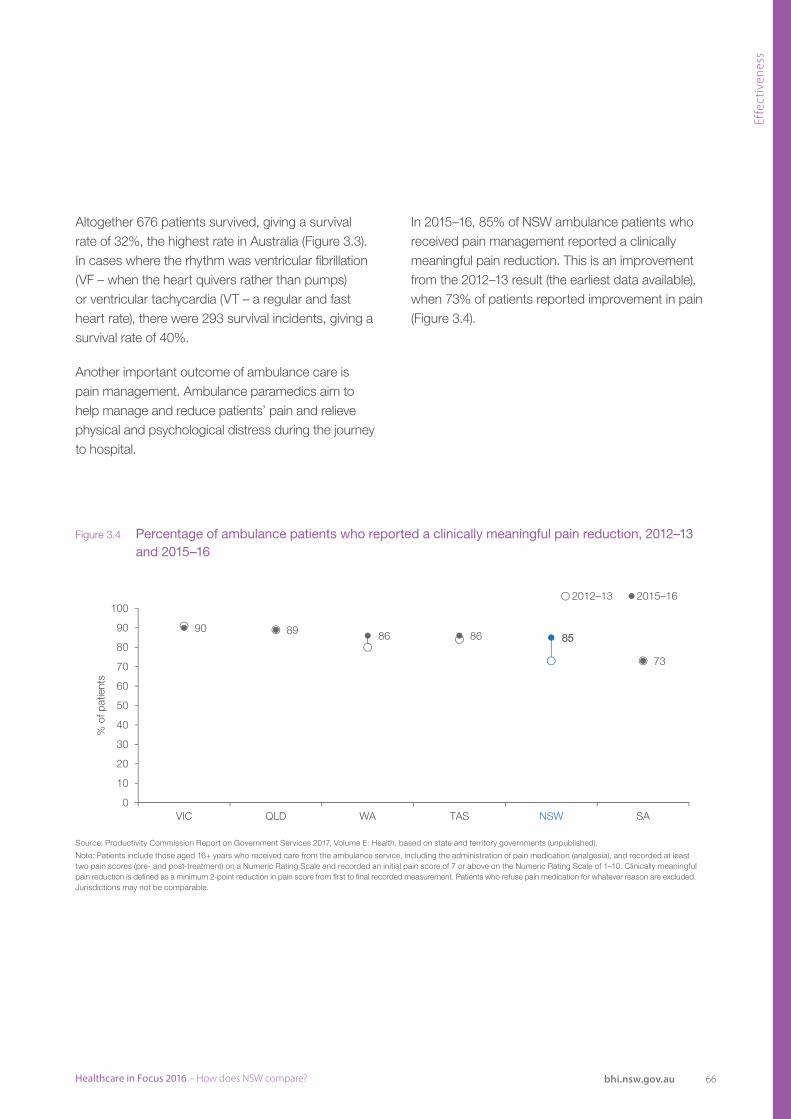
66Healthcare in Focus 2016 – How does NSW compare? bhi.nsw.gov.au
Effe
ctiv
enes
s
Source: Productivity Commission Report on Government Services 2017, Volume E: Health, based on state and territory governments (unpublished).
Note: Patients include those aged 16 years and over who received care from the ambulance service, including the administration of pain medication (analgesia), and recorded at least two pain
scores (pre- and post-treatment) on a Numeric Rating Scale and recorded an initial pain score of 7 or above on the Numeric Rating Scale of 1-10. Clinically meaningful pain reduction is defined
as a minimum 2-point reduction in pain score from first to final recorded measurement. Patients who refuse pain medication for whatever reason are excluded.
90 89 86 86 85
73
85
0
10
20
30
40
50
60
70
80
90
100
VIC QLD WA TAS SA
% o
f pat
ient
s
2012–13 2015–16
NSW
Figure 3.4 Percentage of ambulance patients who reported a clinically meaningful pain reduction, 2012–13 and 2015–16
Source: Productivity Commission Report on Government Services 2017, Volume E: Health, based on state and territory governments (unpublished).
Note: Patients include those aged 16+ years who received care from the ambulance service, including the administration of pain medication (analgesia), and recorded at least two pain scores (pre- and post-treatment) on a Numeric Rating Scale and recorded an initial pain score of 7 or above on the Numeric Rating Scale of 1–10. Clinically meaningful pain reduction is defined as a minimum 2-point reduction in pain score from first to final recorded measurement. Patients who refuse pain medication for whatever reason are excluded. Jurisdictions may not be comparable.
Altogether 676 patients survived, giving a survival rate of 32%, the highest rate in Australia (Figure 3.3). In cases where the rhythm was ventricular fibrillation (VF – when the heart quivers rather than pumps) or ventricular tachycardia (VT – a regular and fast heart rate), there were 293 survival incidents, giving a survival rate of 40%.
Another important outcome of ambulance care is pain management. Ambulance paramedics aim to help manage and reduce patients’ pain and relieve physical and psychological distress during the journey to hospital.
In 2015–16, 85% of NSW ambulance patients who received pain management reported a clinically meaningful pain reduction. This is an improvement from the 2012–13 result (the earliest data available), when 73% of patients reported improvement in pain (Figure 3.4).
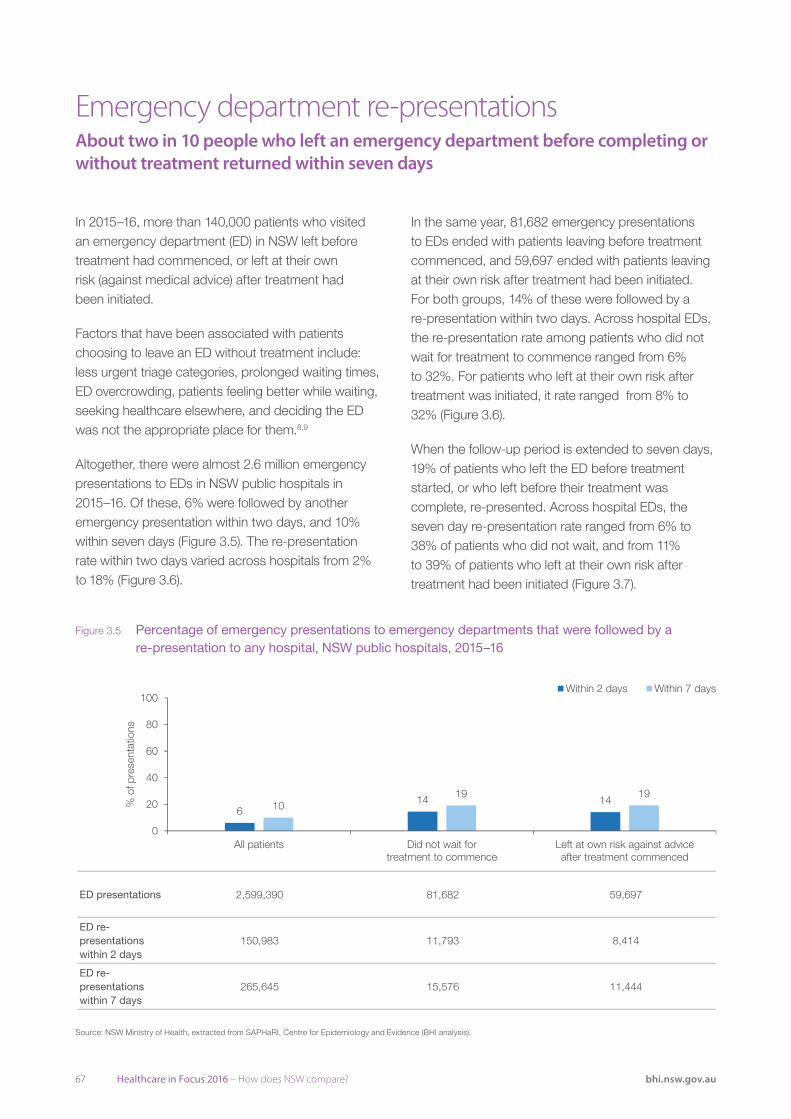
67 Healthcare in Focus 2016 – How does NSW compare? bhi.nsw.gov.au
In 2015–16, more than 140,000 patients who visited an emergency department (ED) in NSW left before treatment had commenced, or left at their own risk (against medical advice) after treatment had been initiated.
Factors that have been associated with patients choosing to leave an ED without treatment include: less urgent triage categories, prolonged waiting times, ED overcrowding, patients feeling better while waiting, seeking healthcare elsewhere, and deciding the ED was not the appropriate place for them.8,9
Altogether, there were almost 2.6 million emergency presentations to EDs in NSW public hospitals in 2015–16. Of these, 6% were followed by another emergency presentation within two days, and 10% within seven days (Figure 3.5). The re-presentation rate within two days varied across hospitals from 2% to 18% (Figure 3.6).
Emergency department re-presentations About two in 10 people who left an emergency department before completing or without treatment returned within seven days
In the same year, 81,682 emergency presentations to EDs ended with patients leaving before treatment commenced, and 59,697 ended with patients leaving at their own risk after treatment had been initiated. For both groups, 14% of these were followed by a re-presentation within two days. Across hospital EDs, the re-presentation rate among patients who did not wait for treatment to commence ranged from 6% to 32%. For patients who left at their own risk after treatment was initiated, it rate ranged from 8% to 32% (Figure 3.6).
When the follow-up period is extended to seven days, 19% of patients who left the ED before treatment started, or who left before their treatment was complete, re-presented. Across hospital EDs, the seven day re-presentation rate ranged from 6% to 38% of patients who did not wait, and from 11% to 39% of patients who left at their own risk after treatment had been initiated (Figure 3.7).
ED presentations 2,599,390 81,682 59,697
ED re-presentations within 2 days
150,983 11,793 8,414
ED re-presentations within 7 days
265,645 15,576 11,444
Source: NSW Ministry of Health, extracted from SAPHaRI, Centre for Epidemiology and Evidence (BHI analysis).
614 1410
19 19
0
20
40
60
80
100
All patients Did not wait fortreatment to commence
Left at own risk against adviceafter treatment commenced
% o
f pre
sent
atio
ns
Within 2 days Within 7 days
Figure 3.5 Percentage of emergency presentations to emergency departments that were followed by a re-presentation to any hospital, NSW public hospitals, 2015–16
Source: NSW Ministry of Health, extracted from SAPHaRI, Centre for Epidemiology and Evidence (BHI analysis).
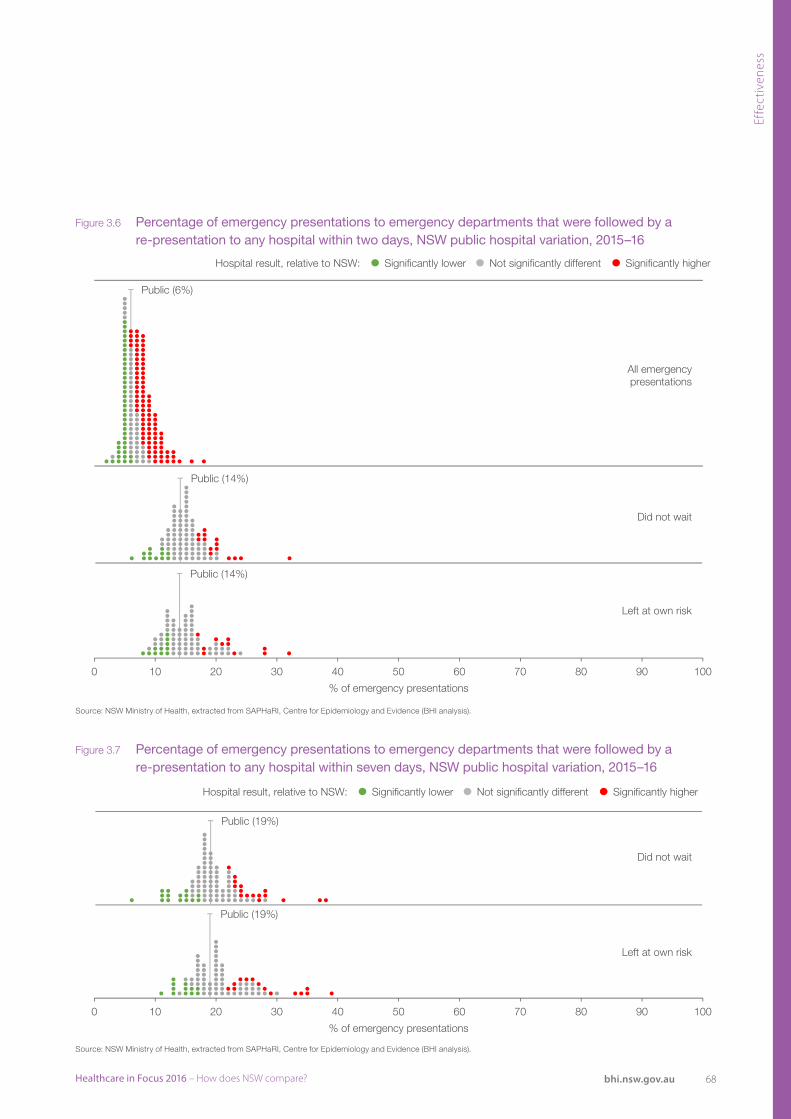
68Healthcare in Focus 2016 – How does NSW compare? bhi.nsw.gov.au
Effe
ctiv
enes
s
Public (6%)
Did not wait
Left at own risk
All emergencypresentations
Significantly higherNot significantly differentSignificantly lowerHospital result, relative to NSW:
Public (14%)
Public (14%)
0 10 20 30 40 50 60 70 80 90 100
% of emergency presentations
Public (19%)
Significantly higherNot significantly differentSignificantly lowerHospital result, relative to NSW:
Public (19%)
0 10 20 30 40 50 60 70 80 90 100
% of emergency presentations
Did not wait
Left at own risk
Figure 3.6 Percentage of emergency presentations to emergency departments that were followed by a re-presentation to any hospital within two days, NSW public hospital variation, 2015–16
Figure 3.7 Percentage of emergency presentations to emergency departments that were followed by a re-presentation to any hospital within seven days, NSW public hospital variation, 2015–16
Source: NSW Ministry of Health, extracted from SAPHaRI, Centre for Epidemiology and Evidence (BHI analysis).
Source: NSW Ministry of Health, extracted from SAPHaRI, Centre for Epidemiology and Evidence (BHI analysis).
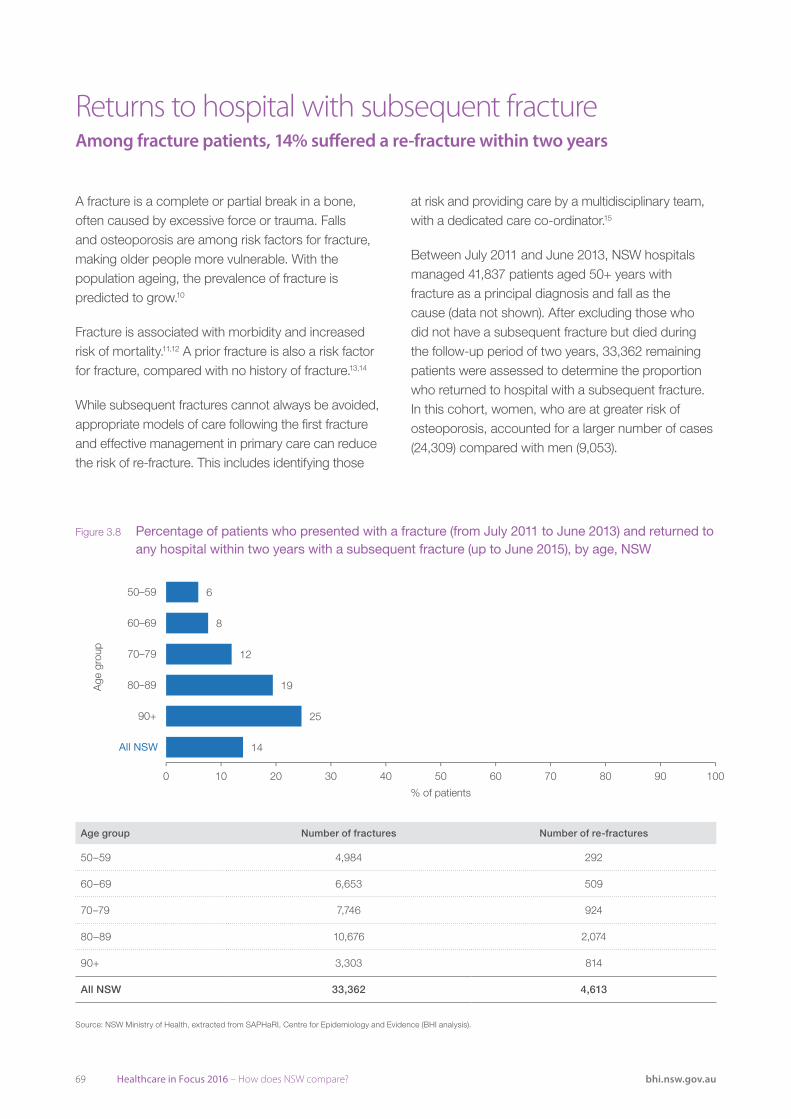
69 Healthcare in Focus 2016 – How does NSW compare? bhi.nsw.gov.au
A fracture is a complete or partial break in a bone, often caused by excessive force or trauma. Falls and osteoporosis are among risk factors for fracture, making older people more vulnerable. With the population ageing, the prevalence of fracture is predicted to grow.10
Fracture is associated with morbidity and increased risk of mortality.11,12 A prior fracture is also a risk factor for fracture, compared with no history of fracture.13,14
While subsequent fractures cannot always be avoided, appropriate models of care following the first fracture and effective management in primary care can reduce the risk of re-fracture. This includes identifying those
Returns to hospital with subsequent fractureAmong fracture patients, 14% suffered a re-fracture within two years
at risk and providing care by a multidisciplinary team, with a dedicated care co-ordinator.15
Between July 2011 and June 2013, NSW hospitals managed 41,837 patients aged 50+ years with fracture as a principal diagnosis and fall as the cause (data not shown). After excluding those who did not have a subsequent fracture but died during the follow-up period of two years, 33,362 remaining patients were assessed to determine the proportion who returned to hospital with a subsequent fracture. In this cohort, women, who are at greater risk of osteoporosis, accounted for a larger number of cases (24,309) compared with men (9,053).
Source: NSW Ministry of Health, extracted from SAPHaRI, Centre for Epidemiology and Evidence (BHI analysis).
6
8
12
19
25
14
0 10 20 30 40 50 60 70 80 90 100
50–59
60–69
70–79
80–89
90+
% of patients
Age
gro
up
All NSW
Figure 3.8 Percentage of patients who presented with a fracture (from July 2011 to June 2013) and returned to any hospital within two years with a subsequent fracture (up to June 2015), by age, NSW
Source: NSW Ministry of Health, extracted from SAPHaRI, Centre for Epidemiology and Evidence (BHI analysis).
Age group Number of fractures Number of re-fractures
50–59 4,984 292
60–69 6,653 509
70–79 7,746 924
80–89 10,676 2,074
90+ 3,303 814
All NSW 33,362 4,613
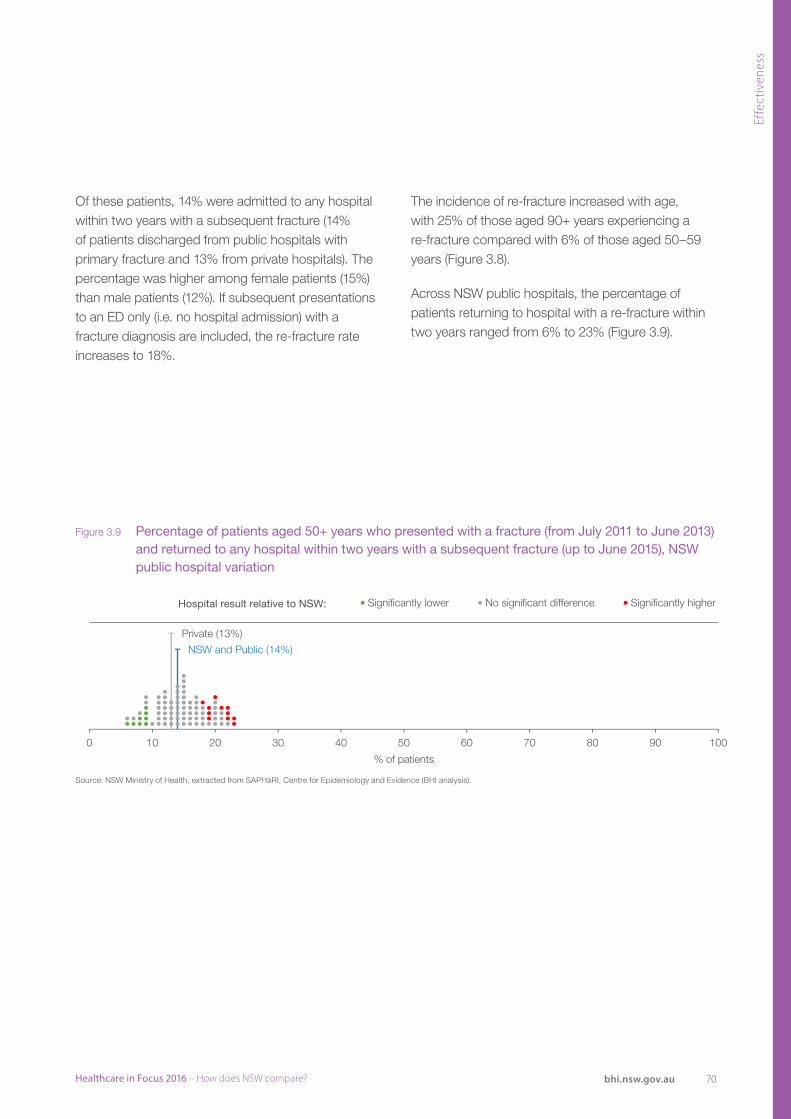
70Healthcare in Focus 2016 – How does NSW compare? bhi.nsw.gov.au
Effe
ctiv
enes
s
Hospital result relative to NSW:
Source: NSW Ministry of Health, extracted from SAPHaRI, Centre for Epidemiology and Evidence (BHI analysis).
Private (13%)
NSW and Public (14%)
0 10 20 30 40 50 60 70 80 90 100
% of patients
Significantly lower No significant difference Significantly higher
Figure 3.9 Percentage of patients aged 50+ years who presented with a fracture (from July 2011 to June 2013) and returned to any hospital within two years with a subsequent fracture (up to June 2015), NSW public hospital variation
Source: NSW Ministry of Health, extracted from SAPHaRI, Centre for Epidemiology and Evidence (BHI analysis).
Of these patients, 14% were admitted to any hospital within two years with a subsequent fracture (14% of patients discharged from public hospitals with primary fracture and 13% from private hospitals). The percentage was higher among female patients (15%) than male patients (12%). If subsequent presentations to an ED only (i.e. no hospital admission) with a fracture diagnosis are included, the re-fracture rate increases to 18%.
The incidence of re-fracture increased with age, with 25% of those aged 90+ years experiencing a re-fracture compared with 6% of those aged 50–59 years (Figure 3.8).
Across NSW public hospitals, the percentage of patients returning to hospital with a re-fracture within two years ranged from 6% to 23% (Figure 3.9).
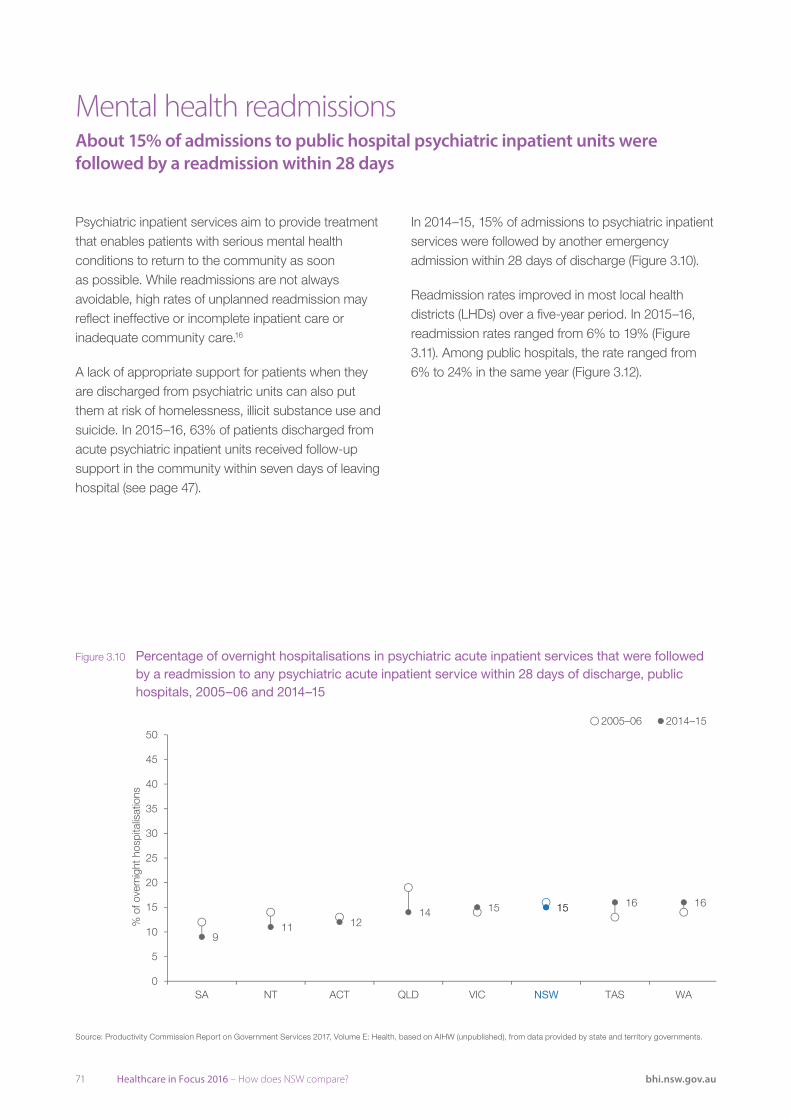
71 Healthcare in Focus 2016 – How does NSW compare? bhi.nsw.gov.au
Psychiatric inpatient services aim to provide treatment that enables patients with serious mental health conditions to return to the community as soon as possible. While readmissions are not always avoidable, high rates of unplanned readmission may reflect ineffective or incomplete inpatient care or inadequate community care.16
A lack of appropriate support for patients when they are discharged from psychiatric units can also put them at risk of homelessness, illicit substance use and suicide. In 2015–16, 63% of patients discharged from acute psychiatric inpatient units received follow-up support in the community within seven days of leaving hospital (see page 47).
Mental health readmissions About 15% of admissions to public hospital psychiatric inpatient units were followed by a readmission within 28 days
In 2014–15, 15% of admissions to psychiatric inpatient services were followed by another emergency admission within 28 days of discharge (Figure 3.10).
Readmission rates improved in most local health districts (LHDs) over a five-year period. In 2015–16, readmission rates ranged from 6% to 19% (Figure 3.11). Among public hospitals, the rate ranged from 6% to 24% in the same year (Figure 3.12).
Source: Productivity Commission Report on Government Services 2017, Volume E: Health, based on AIHW (unpublished), from data provided by state and territory governments.
2005–06 2014–15
16 16
911 12
14 15 1515
0
5
10
15
20
25
30
35
40
45
50
SA NT ACT QLD VIC TAS WA
% o
f ove
rnig
ht hos
pitalisations
NSW
Figure 3.10 Percentage of overnight hospitalisations in psychiatric acute inpatient services that were followed by a readmission to any psychiatric acute inpatient service within 28 days of discharge, public hospitals, 2005–06 and 2014–15
Source: Productivity Commission Report on Government Services 2017, Volume E: Health, based on AIHW (unpublished), from data provided by state and territory governments.
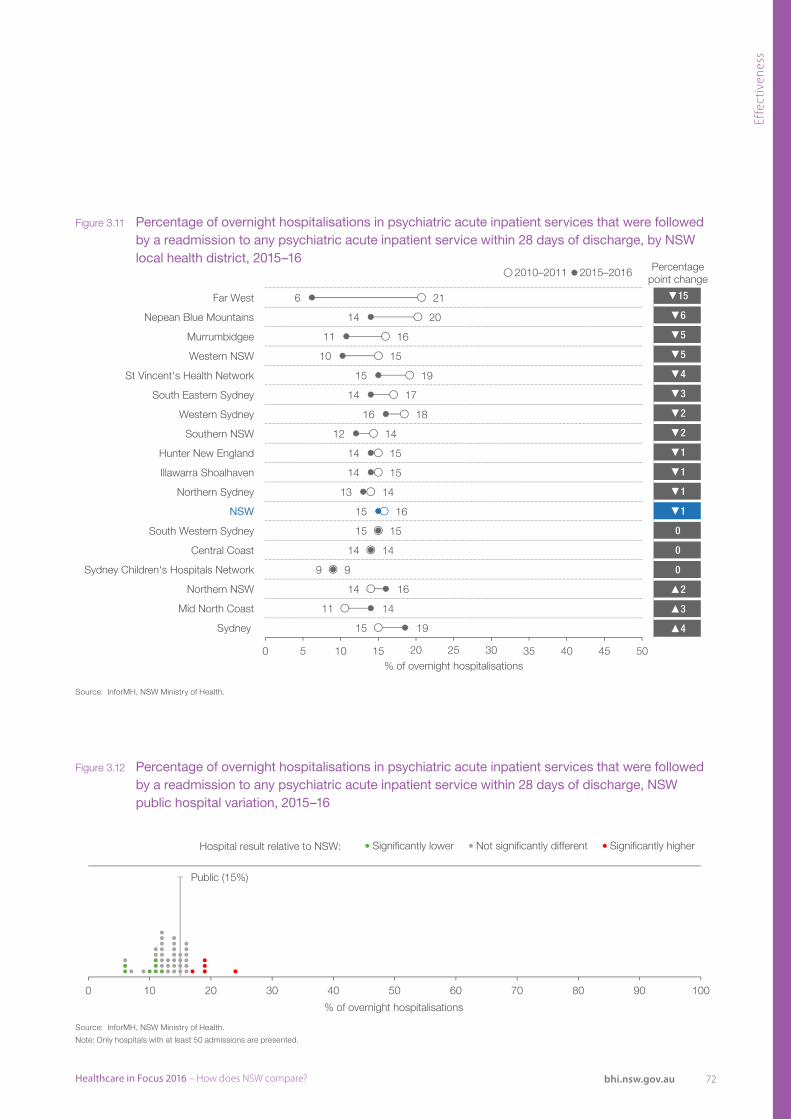
72Healthcare in Focus 2016 – How does NSW compare? bhi.nsw.gov.au
Effe
ctiv
enes
s
▼15
▼6
▼5
▼5
▼4
▼3
▼2
▼2
▼1
▼1
▼1
▼1
0
0
0
▲2
▲3
▲4
Far West
Nepean Blue Mountains
Murrumbidgee
Western NSW
St Vincent's Health Network
South Eastern Sydney
Western Sydney
Southern NSW
Hunter New England
Illawarra Shoalhaven
Northern Sydney
NSW
South Western Sydney
Central Coast
Sydney Children's Hospitals Network
Northern NSW
Mid North Coast
Sydney
6
14
11
10
15
14
16
12
14
14
13
15
15
14
9
14
11
15
21
20
16
15
19
17
18
14
15
15
14
16
15
14
9
16
14
19
0 5 10 15 35 40 45 5020 25 30
% of overnight hospitalisations
Percentage point change
2010–2011 2015–2016
Source: NSW Ministry of Health, extracted from SAPHaRI, Centre for Epidemiology and Evidence (BHI analysis).
Note: Only hospitals with at least 50 admissions are included.
Public (15%)
0 10 20 30 40 50 60 70 80 90 100
% of overnight hospitalisations
Significantly lower Not significantly different Significantly higherHospital result relative to NSW:
Figure 3.11 Percentage of overnight hospitalisations in psychiatric acute inpatient services that were followed by a readmission to any psychiatric acute inpatient service within 28 days of discharge, by NSW local health district, 2015–16
Figure 3.12 Percentage of overnight hospitalisations in psychiatric acute inpatient services that were followed by a readmission to any psychiatric acute inpatient service within 28 days of discharge, NSW public hospital variation, 2015–16
Source: InforMH, NSW Ministry of Health.
Source: InforMH, NSW Ministry of Health.
Note: Only hospitals with at least 50 admissions are presented.
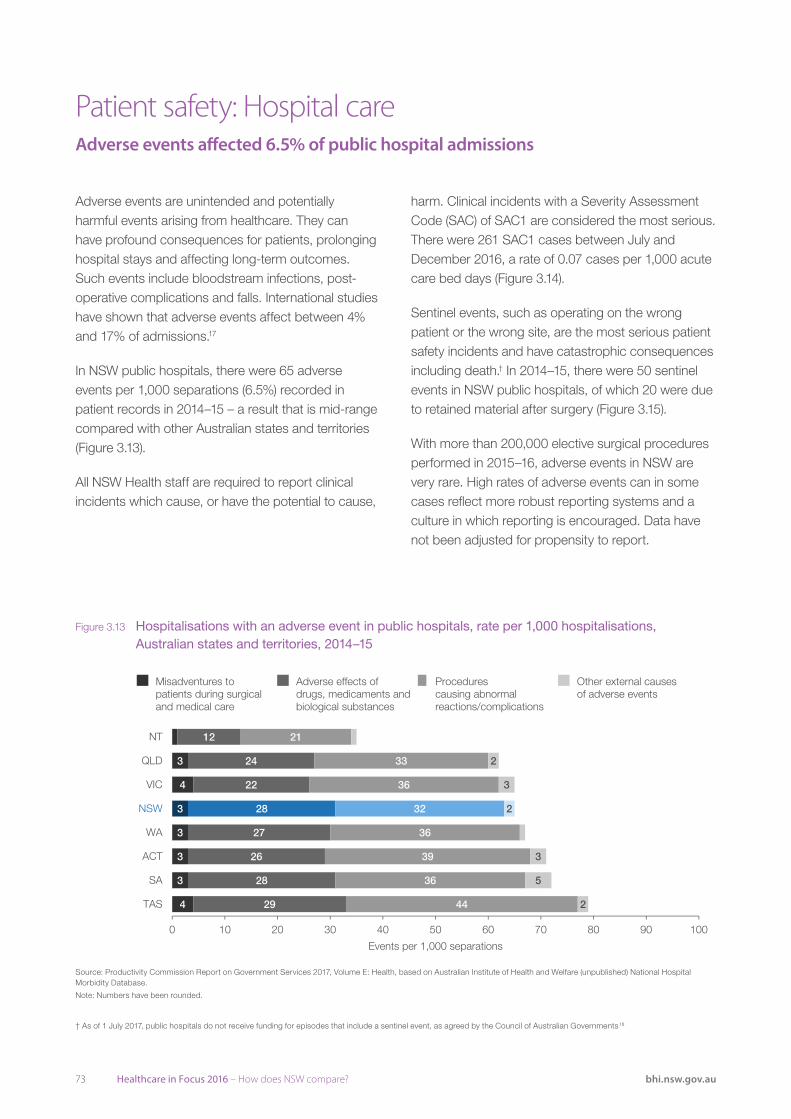
73 Healthcare in Focus 2016 – How does NSW compare? bhi.nsw.gov.au
Adverse events are unintended and potentially harmful events arising from healthcare. They can have profound consequences for patients, prolonging hospital stays and affecting long-term outcomes. Such events include bloodstream infections, post-operative complications and falls. International studies have shown that adverse events affect between 4% and 17% of admissions.17
In NSW public hospitals, there were 65 adverse events per 1,000 separations (6.5%) recorded in patient records in 2014–15 – a result that is mid-range compared with other Australian states and territories (Figure 3.13).
All NSW Health staff are required to report clinical incidents which cause, or have the potential to cause,
Patient safety: Hospital careAdverse events affected 6.5% of public hospital admissions
harm. Clinical incidents with a Severity Assessment Code (SAC) of SAC1 are considered the most serious. There were 261 SAC1 cases between July and December 2016, a rate of 0.07 cases per 1,000 acute care bed days (Figure 3.14).
Sentinel events, such as operating on the wrong patient or the wrong site, are the most serious patient safety incidents and have catastrophic consequences including death.† In 2014–15, there were 50 sentinel events in NSW public hospitals, of which 20 were due to retained material after surgery (Figure 3.15).
With more than 200,000 elective surgical procedures performed in 2015–16, adverse events in NSW are very rare. High rates of adverse events can in some cases reflect more robust reporting systems and a culture in which reporting is encouraged. Data have not been adjusted for propensity to report.
Source: Productivity Commission Report on Government Services 2017, Volume E: Health, based on AIHW (unpublished) National Hospital Morbidity Database.
4
3
3
3
3
4
3
29
28
26
27
28
22
24
12
44
36
39
36
32
36
33
21
2
5
3
2
3
2
0 10 20 30 40 50 60 70 80 90 100
TAS
SA
ACT
WA
VIC
QLD
NT
Events per 1,000 separations
Misadventures topatients during surgicaland medical care
Adverse effects ofdrugs, medicaments andbiological substances
Procedurescausing abnormalreactions/complications
Other external causesof adverse events
NSW
Figure 3.13 Hospitalisations with an adverse event in public hospitals, rate per 1,000 hospitalisations, Australian states and territories, 2014–15
Source: Productivity Commission Report on Government Services 2017, Volume E: Health, based on Australian Institute of Health and Welfare (unpublished) National Hospital Morbidity Database.
Note: Numbers have been rounded.
† As of 1 July 2017, public hospitals do not receive funding for episodes that include a sentinel event, as agreed by the Council of Australian Governments.18
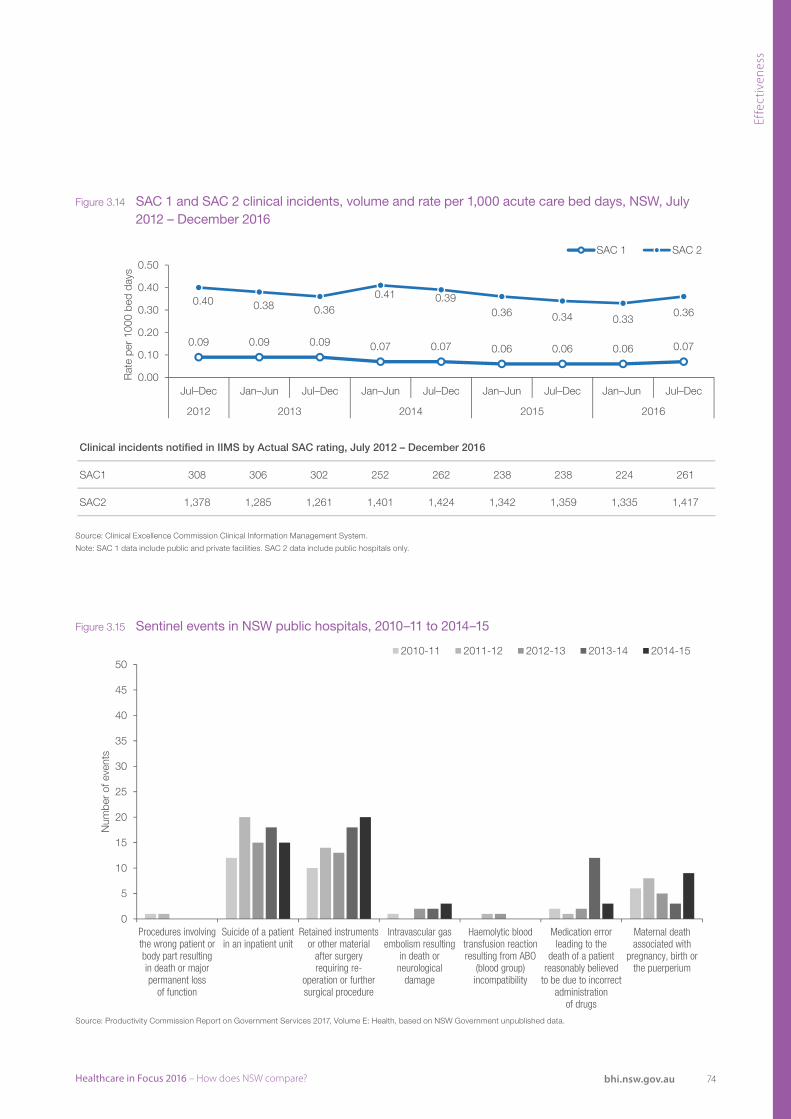
74Healthcare in Focus 2016 – How does NSW compare? bhi.nsw.gov.au
Effe
ctiv
enes
s
Clinical incidents notified in IIMS by Actual SAC rating, July 2012 – December 2016
SAC1 308 306 302 252 262 238 238 224 261
SAC2 1,378 1,285 1,261 1,401 1,424 1,342 1,359 1,335 1,417
Source: Clinical Excellence Commission Clinical Information Management System.
0.09 0.09 0.09 0.07 0.07 0.06 0.06 0.06 0.07
0.40 0.38 0.360.41 0.39
0.36 0.34 0.330.36
0.00
0.10
0.20
0.30
0.40
0.50
Jul–Dec Jan–Jun Jul–Dec Jan–Jun Jul–Dec Jan–Jun Jul–Dec Jan–Jun Jul–Dec
2012 2013 2014 2015 2016
Rat
e pe
r 10
00 b
ed d
ays
SAC 1 SAC 2
0
5
10
15
20
25
30
35
40
45
50
Procedures involvingthe wrong patient orbody part resultingin death or majorpermanent loss
of function
Suicide of a patientin an inpatient unit
Retained instrumentsor other material
after surgeryrequiring re-
operation or furthersurgical procedure
Intravascular gasembolism resulting
in death orneurological
damage
Haemolytic bloodtransfusion reactionresulting from ABO
(blood group)incompatibility
Medication errorleading to the
death of a patientreasonably believed
to be due to incorrectadministration
of drugs
Maternal deathassociated with
pregnancy, birth orthe puerperium
Num
ber
of e
vent
s
2010-11 2011-12 2012-13 2013-14 2014-15
Figure 3.14 SAC 1 and SAC 2 clinical incidents, volume and rate per 1,000 acute care bed days, NSW, July 2012 – December 2016
Figure 3.15 Sentinel events in NSW public hospitals, 2010–11 to 2014–15
Source: Clinical Excellence Commission Clinical Information Management System.
Note: SAC 1 data include public and private facilities. SAC 2 data include public hospitals only.
Source: Productivity Commission Report on Government Services 2017, Volume E: Health, based on NSW Government unpublished data.
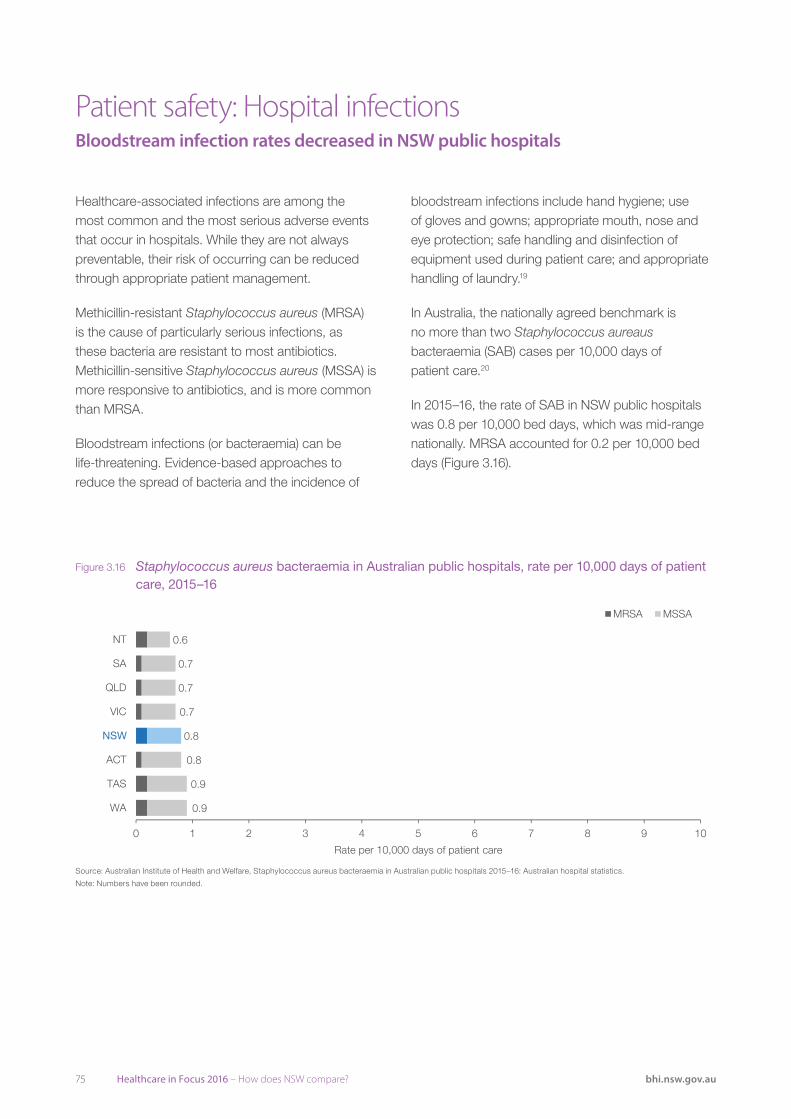
75 Healthcare in Focus 2016 – How does NSW compare? bhi.nsw.gov.au
Healthcare-associated infections are among the most common and the most serious adverse events that occur in hospitals. While they are not always preventable, their risk of occurring can be reduced through appropriate patient management.
Methicillin-resistant Staphylococcus aureus (MRSA) is the cause of particularly serious infections, as these bacteria are resistant to most antibiotics. Methicillin-sensitive Staphylococcus aureus (MSSA) is more responsive to antibiotics, and is more common than MRSA.
Bloodstream infections (or bacteraemia) can be life-threatening. Evidence-based approaches to reduce the spread of bacteria and the incidence of
Patient safety: Hospital infectionsBloodstream infection rates decreased in NSW public hospitals
bloodstream infections include hand hygiene; use of gloves and gowns; appropriate mouth, nose and eye protection; safe handling and disinfection of equipment used during patient care; and appropriate handling of laundry.19
In Australia, the nationally agreed benchmark is no more than two Staphylococcus aureaus bacteraemia (SAB) cases per 10,000 days of patient care.20
In 2015–16, the rate of SAB in NSW public hospitals was 0.8 per 10,000 bed days, which was mid-range nationally. MRSA accounted for 0.2 per 10,000 bed days (Figure 3.16).
Source: Australian Institute of Health and Welfare, Staphylococcus aureus bacteraemia in Australian public hospitals 2015–16: Australian hospital statistics
Note: Numbers have been rounded.
0.9
0.9
0.8
0.8
0.7
0.7
0.7
0.6
0 1 2 3 4 5 6 7 8 9 10
WA
TAS
ACT
VIC
QLD
SA
NT
Rate per 10,000 days of patient care
MRSA MSSA
NSW
Figure 3.16 Staphylococcus aureus bacteraemia in Australian public hospitals, rate per 10,000 days of patient care, 2015–16
Source: Australian Institute of Health and Welfare, Staphylococcus aureus bacteraemia in Australian public hospitals 2015–16: Australian hospital statistics.
Note: Numbers have been rounded.
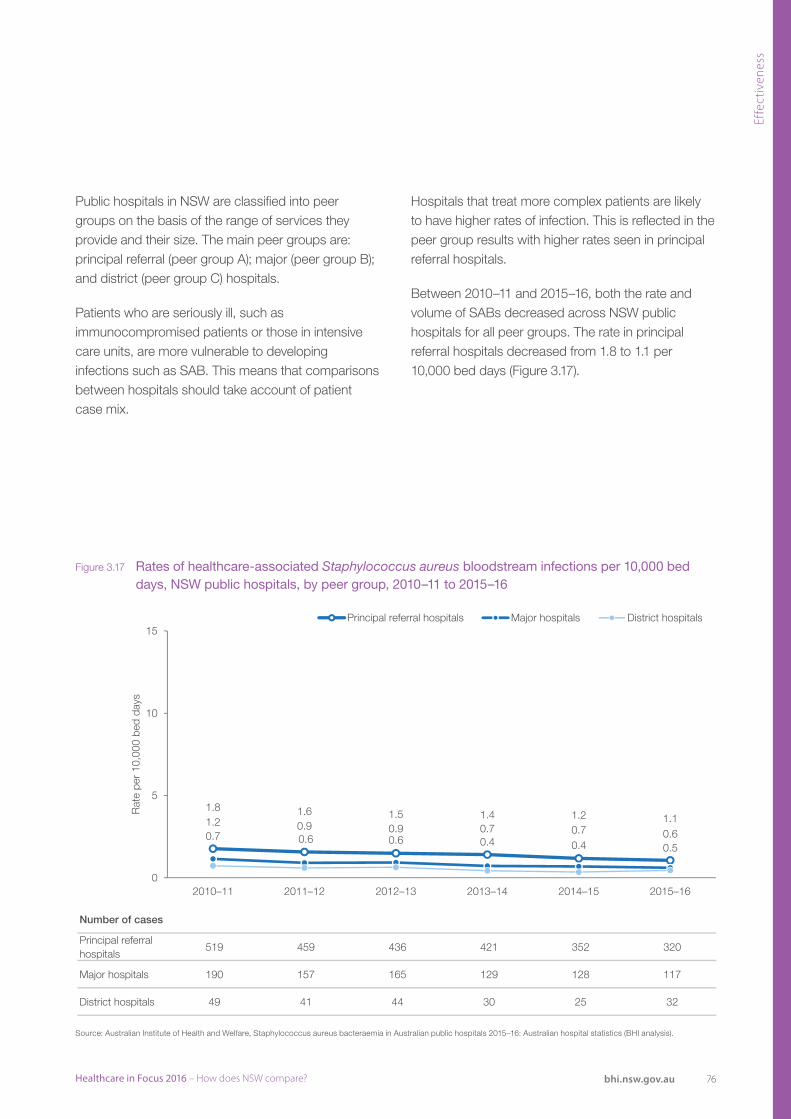
76Healthcare in Focus 2016 – How does NSW compare? bhi.nsw.gov.au
Effe
ctiv
enes
s
Number of cases
Principal referral hospitals
519 459 436 421 352 320
Major hospitals 190 157 165 129 128 117
District hospitals 49 41 44 30 25 32
Source: Australian Institute of Health and Welfare, Staphylococcus aureus bacteraemia in Australian public hospitals 2015–16: Australian hospital statistics (BHI analysis).
1.8 1.6 1.5 1.4 1.2 1.11.2 0.9 0.9 0.7 0.7 0.60.7 0.6 0.6 0.4 0.4 0.5
0
5
10
15
2010–11 2011–12 2012–13 2013–14 2014–15 2015–16
Rat
e pe
r 10
,000
bed
day
s
Principal referral hospitals Major hospitals District hospitals
Figure 3.17 Rates of healthcare-associated Staphylococcus aureus bloodstream infections per 10,000 bed days, NSW public hospitals, by peer group, 2010–11 to 2015–16
Source: Australian Institute of Health and Welfare, Staphylococcus aureus bacteraemia in Australian public hospitals 2015–16: Australian hospital statistics (BHI analysis).
Public hospitals in NSW are classified into peer groups on the basis of the range of services they provide and their size. The main peer groups are: principal referral (peer group A); major (peer group B); and district (peer group C) hospitals.
Patients who are seriously ill, such as immunocompromised patients or those in intensive care units, are more vulnerable to developing infections such as SAB. This means that comparisons between hospitals should take account of patient case mix.
Hospitals that treat more complex patients are likely to have higher rates of infection. This is reflected in the peer group results with higher rates seen in principal referral hospitals.
Between 2010–11 and 2015–16, both the rate and volume of SABs decreased across NSW public hospitals for all peer groups. The rate in principal referral hospitals decreased from 1.8 to 1.1 per 10,000 bed days (Figure 3.17).
77 Healthcare in Focus 2016 – How does NSW compare? bhi.nsw.gov.au
A venous thromboembolism (VTE), or blood clot, occurs when blood pools and thickens inside veins – blocking the flow of blood through the body. When the clot forms in a deep vein, which most often occurs in the leg or pelvis, it is known as a deep vein thrombosis (DVT), and this causes swelling, pain and other complications. If the clot breaks loose and lodges in the lung, it causes a pulmonary embolism (PE) and often results in serious morbidity or death.
Patients are at risk of VTE after surgical procedures, including hip and knee surgery.21 Effective prevention of VTE among hospitalised patients is achieved through assessment of risk factors and the provision of appropriate prophylaxis.22
In NSW in 2014, the rates of DVT and PE following hip and knee surgery were 1,927 and 562 cases per 100,000 surgical discharges, respectively – higher than recorded in comparator countries (Figure 3.18).
Sepsis is caused by the body’s severe reaction to an infection, and can lead to organ dysfunction and death. Post-operative infections that trigger sepsis can be prevented through the use of antibiotics before surgery, ensuring patients are in the best condition possible before elective surgery, and the use of antiseptic solution around surgical incisions, sterile equipment and clean scrubs and masks among surgical staff.23
Patient safety: Complications post-surgeryNSW had higher recorded rates of blood clots and sepsis than comparator countries
In NSW in 2014, among patients who underwent an abdominal surgical procedure, there were 2,516 cases of sepsis per 100,000 surgical discharges – the highest of all comparator jurisdictions (Figure 3.19).
In most healthcare systems, a retained foreign object is regarded as a sentinel event – one where a rate of zero is both a feasible and fundamental objective. NSW had a rate of 10 per 100,000 surgical discharges – similar to comparator countries with available data (Figure 3.20).
International variation in adverse events may be influenced by coding practices. Higher adverse event rates may result from more complete patient safety monitoring systems rather than worse care. Measurement of VTE is complex due to disconnected hospital and community care, differences in coding practices and inadequate detection. Other countries may identify and manage these complications in the community. All adverse events are based on episode-level data. Hospitalisations of less than two days for VTE and less than three days for sepsis are excluded. See the Technical Supplement for more information.
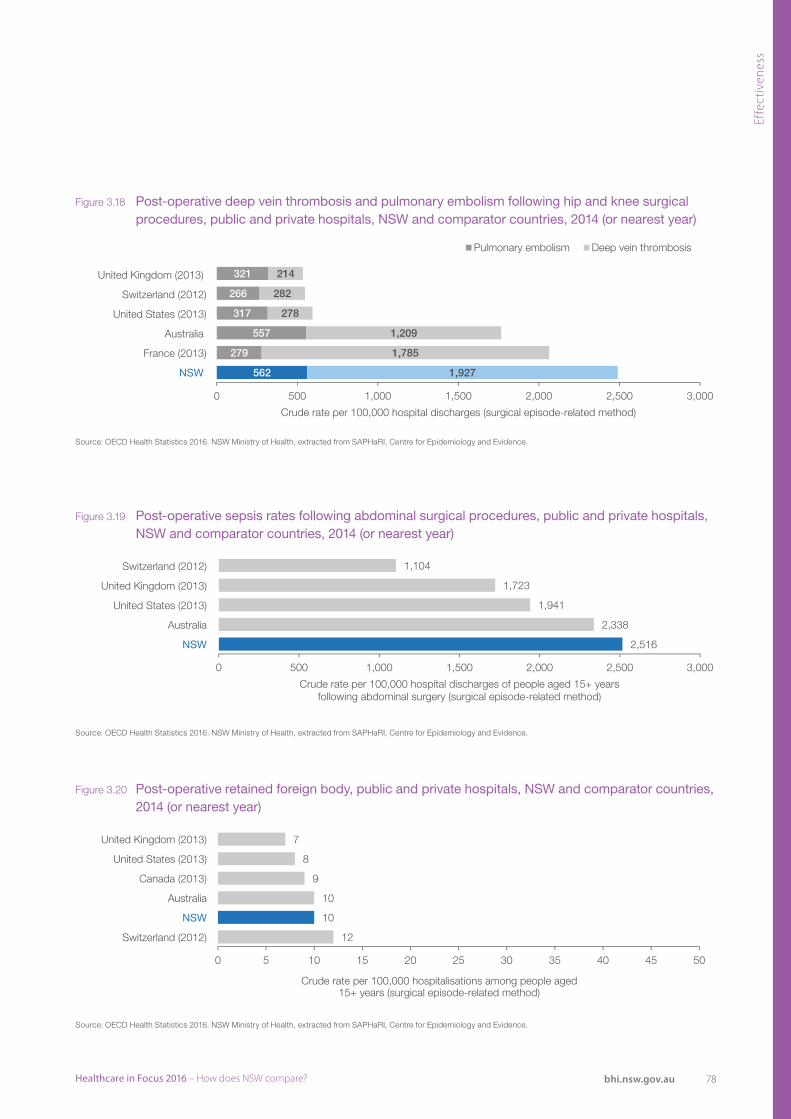
78Healthcare in Focus 2016 – How does NSW compare? bhi.nsw.gov.au
Effe
ctiv
enes
s
Switzerland (2012)
United Kingdom (2013)
United States (2013)
Australia
NSW
Source: NSW Ministry of Health, extracted from SAPHaRI, Centre for Epidemiology and Evidence. OECD Health Statistics 2016.
1,104
1,723
1,941
2,338
2,516
0 500 1,000 1,500 2,000 2,500 3,000
Crude rate per 100,000 hospital discharges of people aged 15+ yearsfollowing abdominal surgery (surgical episode-related method)
United Kingdom (2013)
Switzerland (2012)
United States (2013)
Australia
France (2013)
NSW
Source: NSW Ministry of Health, extracted from SAPHaRI, Centre for Epidemiology and Evidence. OECD Health Statistics 2016.
321
266
317
557
279
562
214
282
278
1,209
1,785
1,927
0 500 1,000 1,500 2,000 2,500 3,000
Crude rate per 100,000 hospital discharges (surgical episode-related method)
Pulmonary embolism Deep vein thrombosis
United Kingdom (2013)
United States (2013)
Canada (2013)
Australia
NSW
Switzerland (2012)
Source: NSW Ministry of Health, extracted from SAPHaRI, Centre for Epidemiology and Evidence. OECD Health Statistics 2016.
7
8
9
10
12
10
0 5 10 15 20 25 30 35 40 45 50
Crude rate per 100,000 hospitalisations among people aged 15+ years (surgical episode-related method)
Figure 3.18 Post-operative deep vein thrombosis and pulmonary embolism following hip and knee surgical procedures, public and private hospitals, NSW and comparator countries, 2014 (or nearest year)
Figure 3.19 Post-operative sepsis rates following abdominal surgical procedures, public and private hospitals, NSW and comparator countries, 2014 (or nearest year)
Figure 3.20 Post-operative retained foreign body, public and private hospitals, NSW and comparator countries, 2014 (or nearest year)
Source: OECD Health Statistics 2016. NSW Ministry of Health, extracted from SAPHaRI, Centre for Epidemiology and Evidence.
Source: OECD Health Statistics 2016. NSW Ministry of Health, extracted from SAPHaRI, Centre for Epidemiology and Evidence.
Source: OECD Health Statistics 2016. NSW Ministry of Health, extracted from SAPHaRI, Centre for Epidemiology and Evidence.
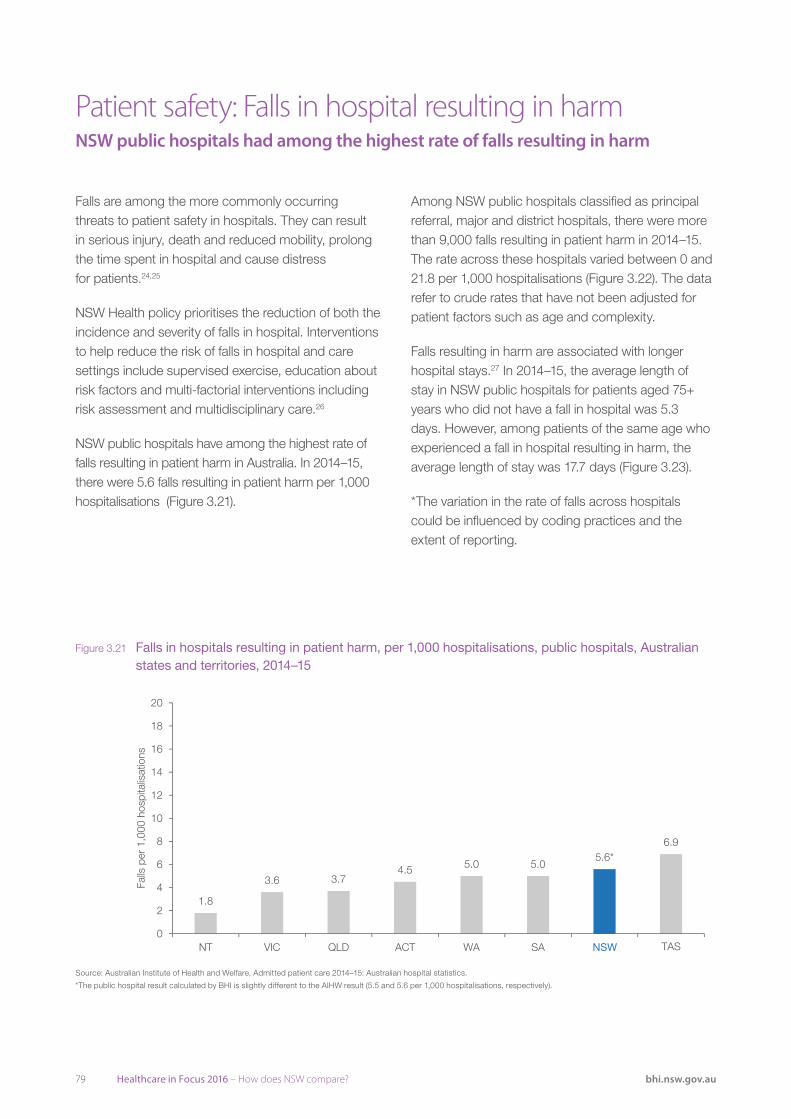
79 Healthcare in Focus 2016 – How does NSW compare? bhi.nsw.gov.au
Falls are among the more commonly occurring threats to patient safety in hospitals. They can result in serious injury, death and reduced mobility, prolong the time spent in hospital and cause distress for patients.24,25
NSW Health policy prioritises the reduction of both the incidence and severity of falls in hospital. Interventions to help reduce the risk of falls in hospital and care settings include supervised exercise, education about risk factors and multi-factorial interventions including risk assessment and multidisciplinary care.26
NSW public hospitals have among the highest rate of falls resulting in patient harm in Australia. In 2014–15, there were 5.6 falls resulting in patient harm per 1,000 hospitalisations (Figure 3.21).
Patient safety: Falls in hospital resulting in harmNSW public hospitals had among the highest rate of falls resulting in harm
Among NSW public hospitals classified as principal referral, major and district hospitals, there were more than 9,000 falls resulting in patient harm in 2014–15. The rate across these hospitals varied between 0 and 21.8 per 1,000 hospitalisations (Figure 3.22). The data refer to crude rates that have not been adjusted for patient factors such as age and complexity.
Falls resulting in harm are associated with longer hospital stays.27 In 2014–15, the average length of stay in NSW public hospitals for patients aged 75+ years who did not have a fall in hospital was 5.3 days. However, among patients of the same age who experienced a fall in hospital resulting in harm, the average length of stay was 17.7 days (Figure 3.23).
*The variation in the rate of falls across hospitals could be influenced by coding practices and the extent of reporting.
Source: AIHW, Admitted patient care 2014–15: Australian hospital statistics.
1.8
3.6 3.74.5 5.0 5.0
5.6*6.9
0
2
4
6
8
10
12
14
16
18
20
NT VIC QLD ACT WA SA TAS
Falls
per
1,0
00 hos
pitalisations
NSW
Figure 3.21 Falls in hospitals resulting in patient harm, per 1,000 hospitalisations, public hospitals, Australian states and territories, 2014–15
Source: Australian Institute of Health and Welfare, Admitted patient care 2014–15: Australian hospital statistics.
*The public hospital result calculated by BHI is slightly different to the AIHW result (5.5 and 5.6 per 1,000 hospitalisations, respectively).
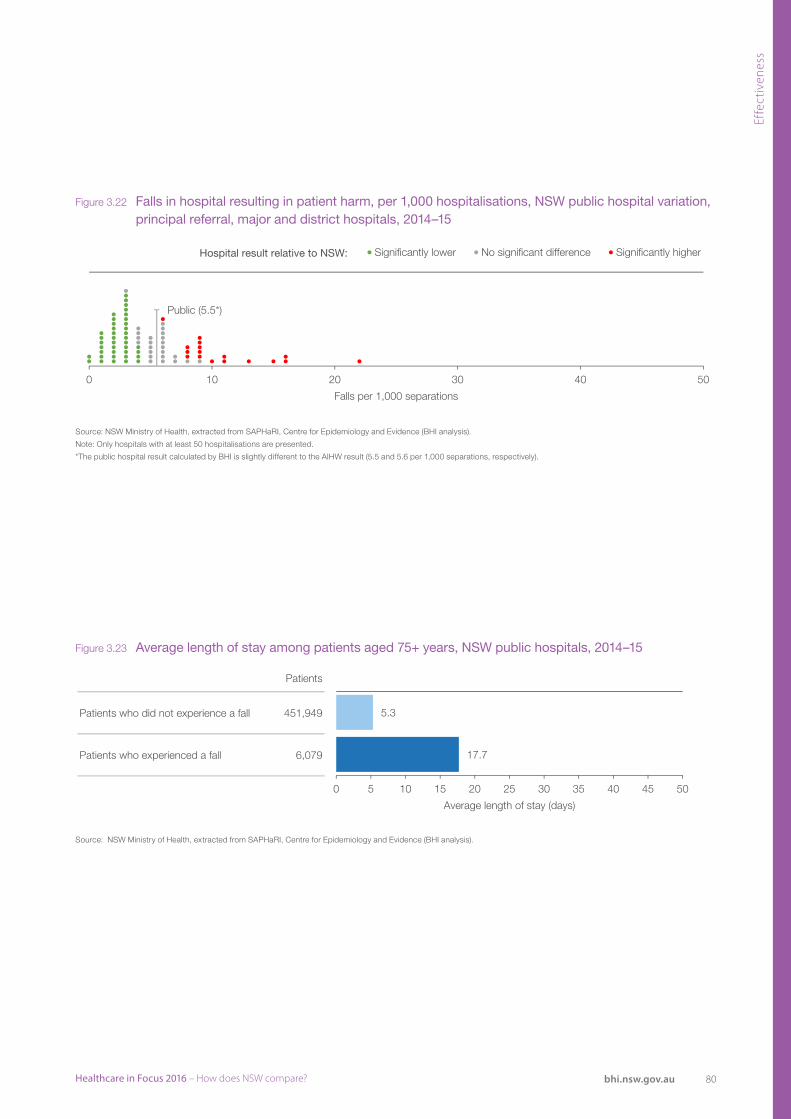
80Healthcare in Focus 2016 – How does NSW compare? bhi.nsw.gov.au
Effe
ctiv
enes
s
Hospital result relative to NSW:
Source: NSW Ministry of Health, extracted from SAPHaRI, Centre for Epidemiology and Evidence, NSW (BHI analysis).
Note: Only hospitals with at least 50 separations are included. For this indicator, since the public and private hospital fall rates are very different, the significance test for public hospitals was based on the
overall public hospital rate rather than the NSW rate. The public hospital result calculated by BHI is slightly different to the AIHW result.
Public (5.5*)
0 10 20 30 40 50
Falls per 1,000 separations
Significantly lower No significant difference Significantly higher
Patients
Patients who did not experience a fall 451,949
Patients who experienced a fall 6,079
Source: NSW Ministry of Health, extracted from SAPHaRI, Centre for Epidemiology and Evidence (BHI analysis).
5.3
17.7
0 5 10 15 20 25 30 35 40 45 50
Average length of stay (days)
Figure 3.22 Falls in hospital resulting in patient harm, per 1,000 hospitalisations, NSW public hospital variation, principal referral, major and district hospitals, 2014–15
Figure 3.23 Average length of stay among patients aged 75+ years, NSW public hospitals, 2014–15
Source: NSW Ministry of Health, extracted from SAPHaRI, Centre for Epidemiology and Evidence (BHI analysis).
Source: NSW Ministry of Health, extracted from SAPHaRI, Centre for Epidemiology and Evidence (BHI analysis).
Note: Only hospitals with at least 50 hospitalisations are presented.
*The public hospital result calculated by BHI is slightly different to the AIHW result (5.5 and 5.6 per 1,000 separations, respectively).
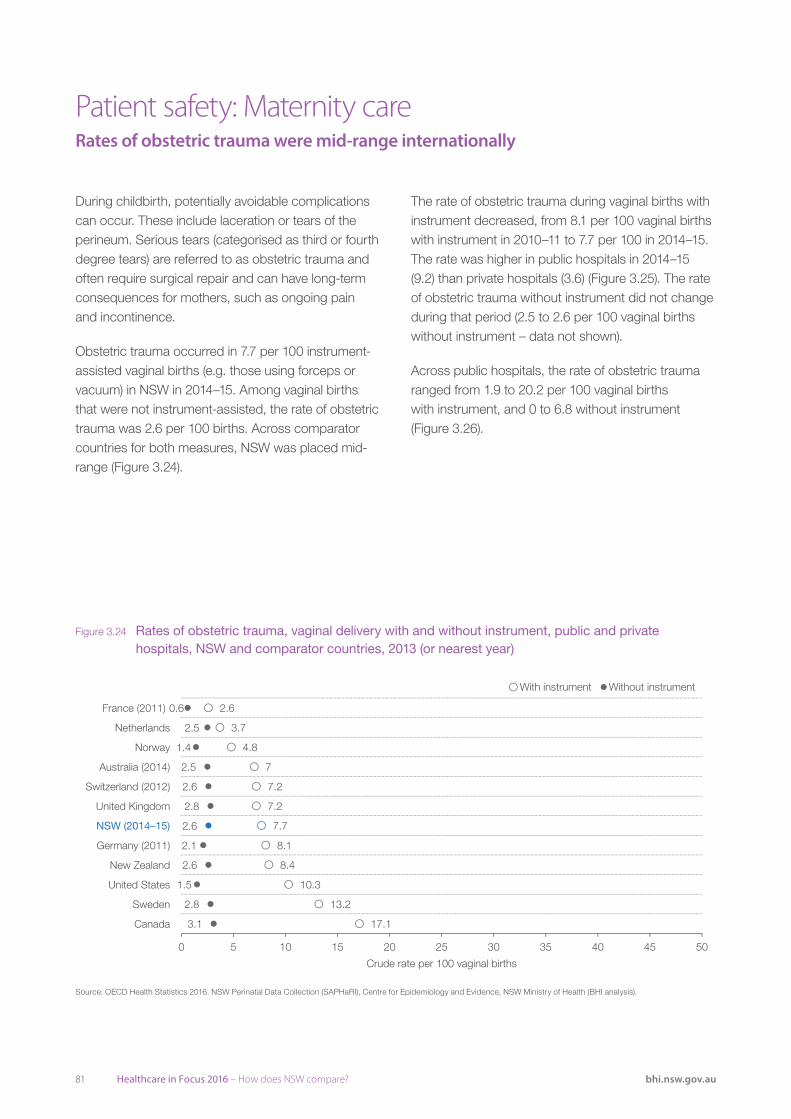
81 Healthcare in Focus 2016 – How does NSW compare? bhi.nsw.gov.au
During childbirth, potentially avoidable complications can occur. These include laceration or tears of the perineum. Serious tears (categorised as third or fourth degree tears) are referred to as obstetric trauma and often require surgical repair and can have long-term consequences for mothers, such as ongoing pain and incontinence.
Obstetric trauma occurred in 7.7 per 100 instrument-assisted vaginal births (e.g. those using forceps or vacuum) in NSW in 2014–15. Among vaginal births that were not instrument-assisted, the rate of obstetric trauma was 2.6 per 100 births. Across comparator countries for both measures, NSW was placed mid-range (Figure 3.24).
Patient safety: Maternity careRates of obstetric trauma were mid-range internationally
The rate of obstetric trauma during vaginal births with instrument decreased, from 8.1 per 100 vaginal births with instrument in 2010–11 to 7.7 per 100 in 2014–15. The rate was higher in public hospitals in 2014–15 (9.2) than private hospitals (3.6) (Figure 3.25). The rate of obstetric trauma without instrument did not change during that period (2.5 to 2.6 per 100 vaginal births without instrument – data not shown).
Across public hospitals, the rate of obstetric trauma ranged from 1.9 to 20.2 per 100 vaginal births with instrument, and 0 to 6.8 without instrument (Figure 3.26).
France (2011)
Netherlands
Norway
Australia (2014)
Switzerland (2012)
United Kingdom
NSW (2014–15)
Germany (2011)
New Zealand
United States
Sweden
Canada
0.6
2.5
1.4
2.5
2.6
2.8
2.6
2.1
2.6
1.5
2.8
3.1
2.6
3.7
4.8
7
7.2
7.2
7.7
8.1
8.4
10.3
13.2
17.1
0 5 10 15 20 25 30 35 40 45 50
Crude rate per 100 vaginal births
With instrument Without instrument
Figure 3.24 Rates of obstetric trauma, vaginal delivery with and without instrument, public and private hospitals, NSW and comparator countries, 2013 (or nearest year)
Source: OECD Health Statistics 2016. NSW Perinatal Data Collection (SAPHaRI), Centre for Epidemiology and Evidence, NSW Ministry of Health (BHI analysis).
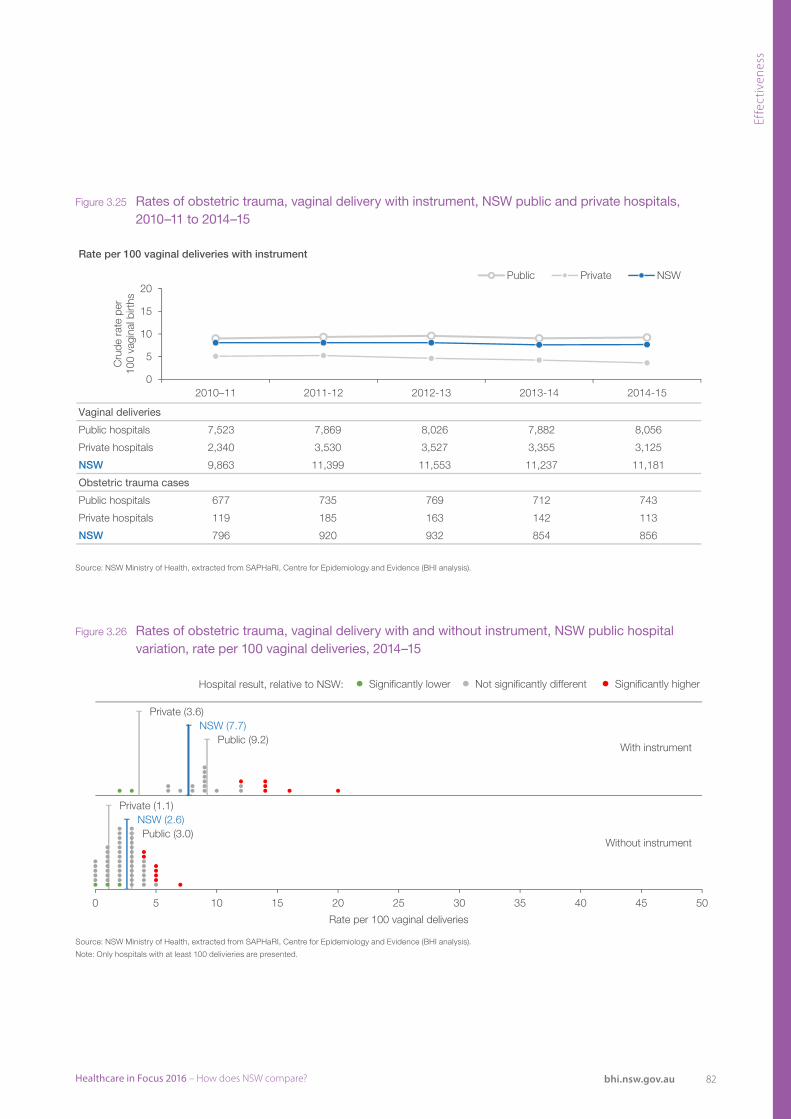
82Healthcare in Focus 2016 – How does NSW compare? bhi.nsw.gov.au
Effe
ctiv
enes
s
Rate per 100 vaginal deliveries with instrument
Vaginal deliveries
Public hospitals 7,523 7,869 8,026 7,882 8,056
Private hospitals 2,340 3,530 3,527 3,355 3,125
NSW 9,863 11,399 11,553 11,237 11,181
Obstetric trauma cases
Public hospitals 677 735 769 712 743
Private hospitals 119 185 163 142 113
NSW 796 920 932 854 856
Rate per 100 vaginal deliveries without instrument
Deliveries
Public hospitals 43,284 42,827 43,218 42,368 41,448
Private hospitals 5,961 10,389 10,770 9,965 9,382
NSW 49,245 53,216 53,988 52,333 50,830
Obstetric trauma cases
Public hospitals 1,163 1,198 1,266 1,205 1,232
Private hospitals 63 112 125 89 101
NSW 1,226 1,310 1,391 1,294 1,333
Source: NSW Ministry of Health, extracted from SAPHaRI, Centre for Epidemiology and Evidence (BHI analysis).
0
5
10
15
20
2010–11 2011-12 2012-13 2013-14 2014-15
Cru
de r
ate
per
100
vagi
nal b
irths
Public Private NSW
0
5
10
15
20
2010–11 2011–12 2012–13 2013–14 2014–15
Cru
de r
ate
per
100
vagi
nal b
irths
Public Private NSW
Private (3.6)
Public (9.2)NSW (7.7)
Significantly lower Not significantly different Significantly higherHospital result, relative to NSW:
With instrument
Without instrument
Private (1.1)
Public (3.0)NSW (2.6)
0 5 10 15 20 25 30 35 40 45 50
Rate per 100 vaginal deliveries
Figure 3.25 Rates of obstetric trauma, vaginal delivery with instrument, NSW public and private hospitals, 2010–11 to 2014–15
Figure 3.26 Rates of obstetric trauma, vaginal delivery with and without instrument, NSW public hospital variation, rate per 100 vaginal deliveries, 2014–15
Source: NSW Ministry of Health, extracted from SAPHaRI, Centre for Epidemiology and Evidence (BHI analysis).
Note: Only hospitals with at least 100 delivieries are presented.
Source: NSW Ministry of Health, extracted from SAPHaRI, Centre for Epidemiology and Evidence (BHI analysis).
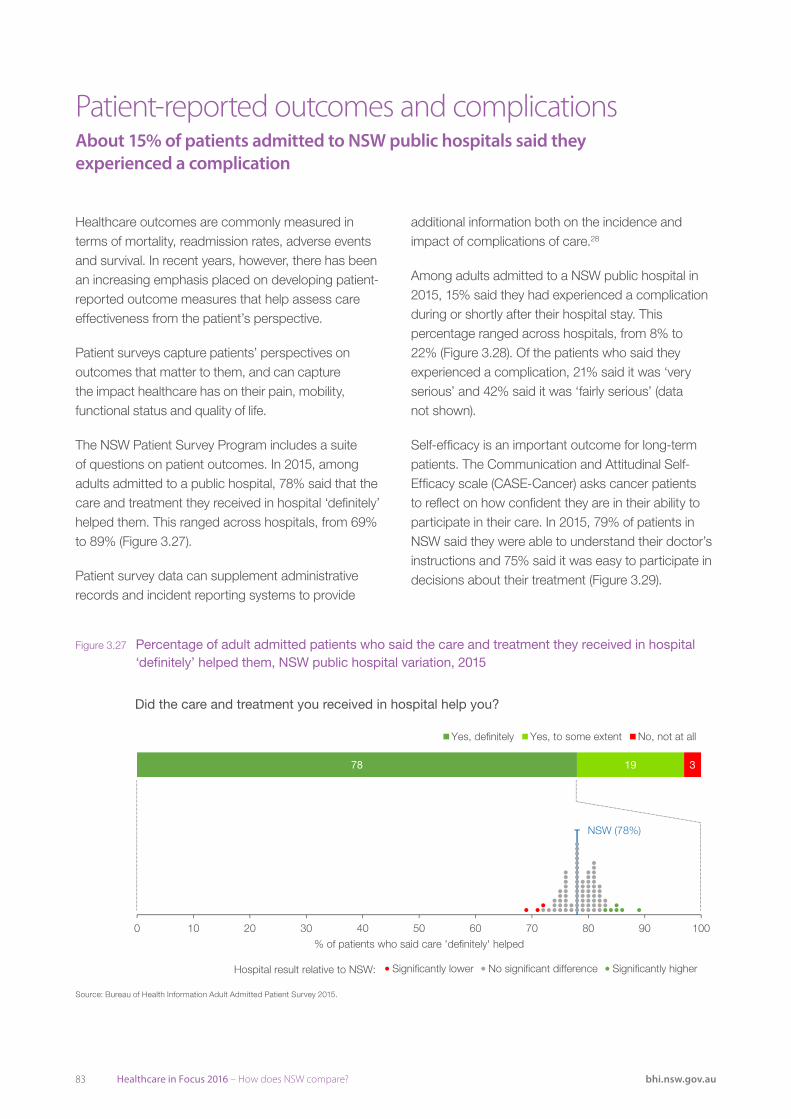
83 Healthcare in Focus 2016 – How does NSW compare? bhi.nsw.gov.au
Healthcare outcomes are commonly measured in terms of mortality, readmission rates, adverse events and survival. In recent years, however, there has been an increasing emphasis placed on developing patient-reported outcome measures that help assess care effectiveness from the patient’s perspective.
Patient surveys capture patients’ perspectives on outcomes that matter to them, and can capture the impact healthcare has on their pain, mobility, functional status and quality of life.
The NSW Patient Survey Program includes a suite of questions on patient outcomes. In 2015, among adults admitted to a public hospital, 78% said that the care and treatment they received in hospital ‘definitely’ helped them. This ranged across hospitals, from 69% to 89% (Figure 3.27).
Patient survey data can supplement administrative records and incident reporting systems to provide
Patient-reported outcomes and complicationsAbout 15% of patients admitted to NSW public hospitals said they experienced a complication
additional information both on the incidence and impact of complications of care.28
Among adults admitted to a NSW public hospital in 2015, 15% said they had experienced a complication during or shortly after their hospital stay. This percentage ranged across hospitals, from 8% to 22% (Figure 3.28). Of the patients who said they experienced a complication, 21% said it was ‘very serious’ and 42% said it was ‘fairly serious’ (data not shown).
Self-efficacy is an important outcome for long-term patients. The Communication and Attitudinal Self-Efficacy scale (CASE-Cancer) asks cancer patients to reflect on how confident they are in their ability to participate in their care. In 2015, 79% of patients in NSW said they were able to understand their doctor’s instructions and 75% said it was easy to participate in decisions about their treatment (Figure 3.29).
NSW (78%)
0 10 20 30 70 80 90 10040 50 60
% of patients who said care 'definitely' helped
Significantly lower No significant difference Significantly higher
78 19 3
Yes, definitely Yes, to some extent No, not at all
Hospital result relative to NSW:
Figure 3.27 Percentage of adult admitted patients who said the care and treatment they received in hospital ‘definitely’ helped them, NSW public hospital variation, 2015
Source: Bureau of Health Information Adult Admitted Patient Survey 2015.
Did the care and treatment you received in hospital help you?

84Healthcare in Focus 2016 – How does NSW compare? bhi.nsw.gov.au
Effe
ctiv
enes
s
%4%97
%3%57
%6%27
%5%86
%97
%5%96
%6%56
%5%8%24
%7%36
%9%35
%01%25
%01%05
%51
%81
%02
%52
%81
%52
%52
%54
%62
%53
%53
%73
Questions Responses
Un
der
stan
din
g a
nd
p
arti
cip
atin
g in
car
e
I am confident in my ability to understand my doctor’s instructions
It is easy for me to actively participate in decisions about my treatment
I am confident in my ability to understand written information about cancer
I know that I will be able to deal with any unexpected health problems
See
kin
g a
nd
o
bta
inin
g in
form
atio
n It is easy for me to ask my doctor questions
It is easy for me to ask nurses questions
If I don’t understand something, it is easy for me to ask for help
It is easy for me to get information about cancer
Mai
nta
inin
g a
po
siti
ve
atti
tud
e
I won’t let cancer get me down
It is easy for me to maintain a sense of humour
It is easy for me to keep a positive attitude
I am confident that I can control my negative feelings about cancer
Source: Bureau of Health Information Adult Admitted Patient Survey 2015.
NSW (15%)
0 10 20 30 40 50 60 70 80 90 100
% of patients who experienced a complication
Significantly lower No significant difference Significantly higher
15 85
Experienced complication None reported
Hospital result relative to NSW:
Figure 3.28 Percentage of adult admitted patients who experienced a complication or problem during or shortly after their hospital stay, NSW public hospital variation, 2015
Source: Bureau of Health Information Adult Admitted Patient Survey 2015.
Did you experience a complication or problem during or shortly after your hospital stay?
79% 15% 4%
Strongly agree Slightly agree Slightly disagree Strongly disagree
75% 18% 3%
Strongly agree Slightly agree Slightly disagree Strongly disagree
72% 20% 6%
Strongly agree Slightly agree Slightly disagree Strongly disagree
68% 25% 5%
Strongly agree Slightly agree Slightly disagree Strongly disagree
79% 18%
Strongly agree Slightly agree Slightly disagree Strongly disagree
69% 25% 5%
Strongly agree Slightly agree Slightly disagree Strongly disagree
65% 25% 6%4%
Strongly agree Slightly agree Slightly disagree Strongly disagree
42% 45% 8% 5%
Strongly agree Slightly agree Slightly disagree Strongly disagree
63% 26% 7%
Strongly agree Slightly agree Slightly disagree Strongly disagree
53% 35% 9%
Strongly agree Slightly agree Slightly disagree Strongly disagree
52% 35% 10% 4%
Strongly agree Slightly agree Slightly disagree Strongly disagree
50% 37% 10%
Strongly agree Slightly agree Slightly disagree Strongly disagree
Figure 3.29 CASE-Cancer questions, patients in active treatment phase at time of survey completion, all response categories, NSW, 2015
Source: Bureau of Health Information Outpatient Cancer Clinics Survey 2015.

85 Healthcare in Focus 2016 – How does NSW compare? bhi.nsw.gov.au
EfficiencyValue for money
86Healthcare in Focus 2016 – How does NSW compare? bhi.nsw.gov.au
Effic
ienc
y
EfficiencyValue for money
Efficiency refers to the extent to which healthcare makes the best use of available resources. It also relates to productivity, which is a measure of goods and services delivered per unit of resource. This acknowledges that a system or organisation that achieves more valued outcomes for each dollar or human resource invested is performing better, but that more services in isolation are not necessarily desirable.
Efficiency can be assessed by measuring volumes of outputs or services delivered, relative to the resources invested. It can also be captured by measures of duplication or waste. At a system level, efficiency reflects health outcomes by the resources invested.
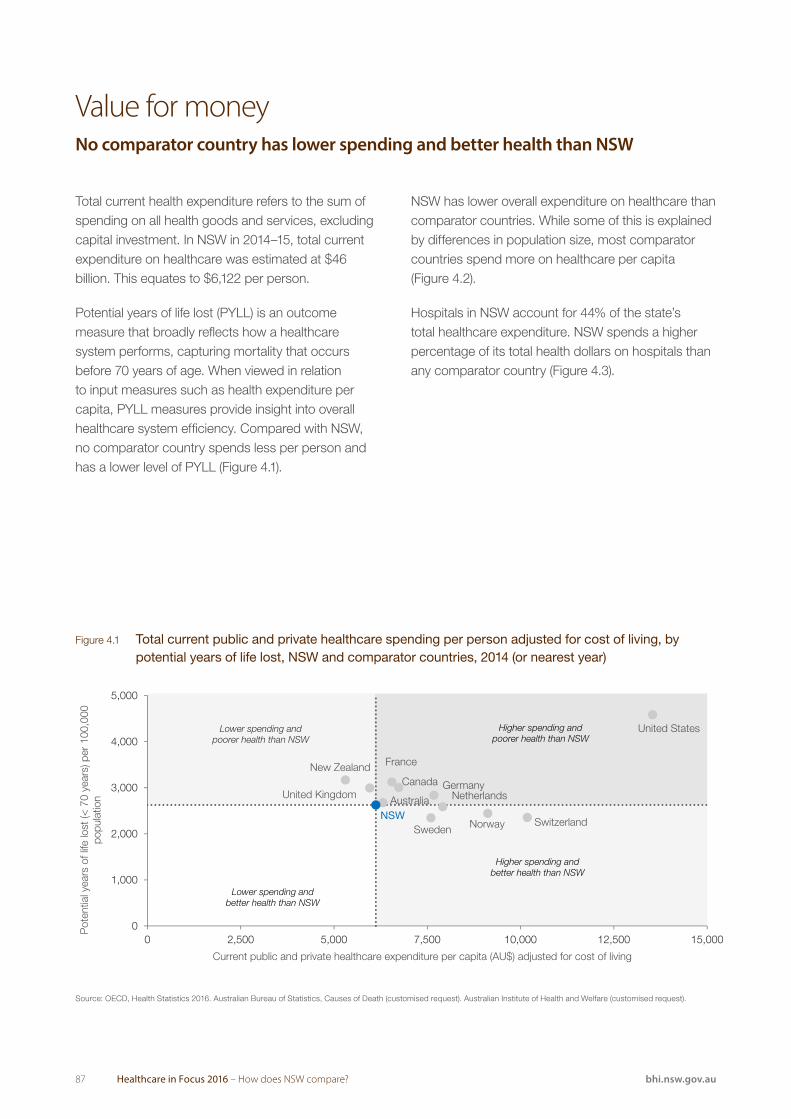
87 Healthcare in Focus 2016 – How does NSW compare? bhi.nsw.gov.au
Total current health expenditure refers to the sum of spending on all health goods and services, excluding capital investment. In NSW in 2014–15, total current expenditure on healthcare was estimated at $46 billion. This equates to $6,122 per person.
Potential years of life lost (PYLL) is an outcome measure that broadly reflects how a healthcare system performs, capturing mortality that occurs before 70 years of age. When viewed in relation to input measures such as health expenditure per capita, PYLL measures provide insight into overall healthcare system efficiency. Compared with NSW, no comparator country spends less per person and has a lower level of PYLL (Figure 4.1).
Value for moneyNo comparator country has lower spending and better health than NSW
NSW has lower overall expenditure on healthcare than comparator countries. While some of this is explained by differences in population size, most comparator countries spend more on healthcare per capita (Figure 4.2).
Hospitals in NSW account for 44% of the state’s total healthcare expenditure. NSW spends a higher percentage of its total health dollars on hospitals than any comparator country (Figure 4.3).
Australia
Canada
France
GermanyNetherlands
New Zealand
NorwayNSW
SwedenSwitzerland
United Kingdom
United States
0
1,000
2,000
3,000
4,000
5,000
0 2,500 5,000 7,500 10,000 12,500 15,000
Lower spending andpoorer health than NSW
Higher spending and better health than NSW
Pot
entia
l yea
rs o
f life
lost
(< 7
0 ye
ars)
per
100
,000
po
pula
tion
Current public and private healthcare expenditure per capita (AU$) adjusted for cost of living
Lower spending andbetter health than NSW
Higher spending and poorer health than NSW
Figure 4.1 Total current public and private healthcare spending per person adjusted for cost of living, by potential years of life lost, NSW and comparator countries, 2014 (or nearest year)
Source: OECD, Health Statistics 2016. Australian Bureau of Statistics, Causes of Death (customised request). Australian Institute of Health and Welfare (customised request).
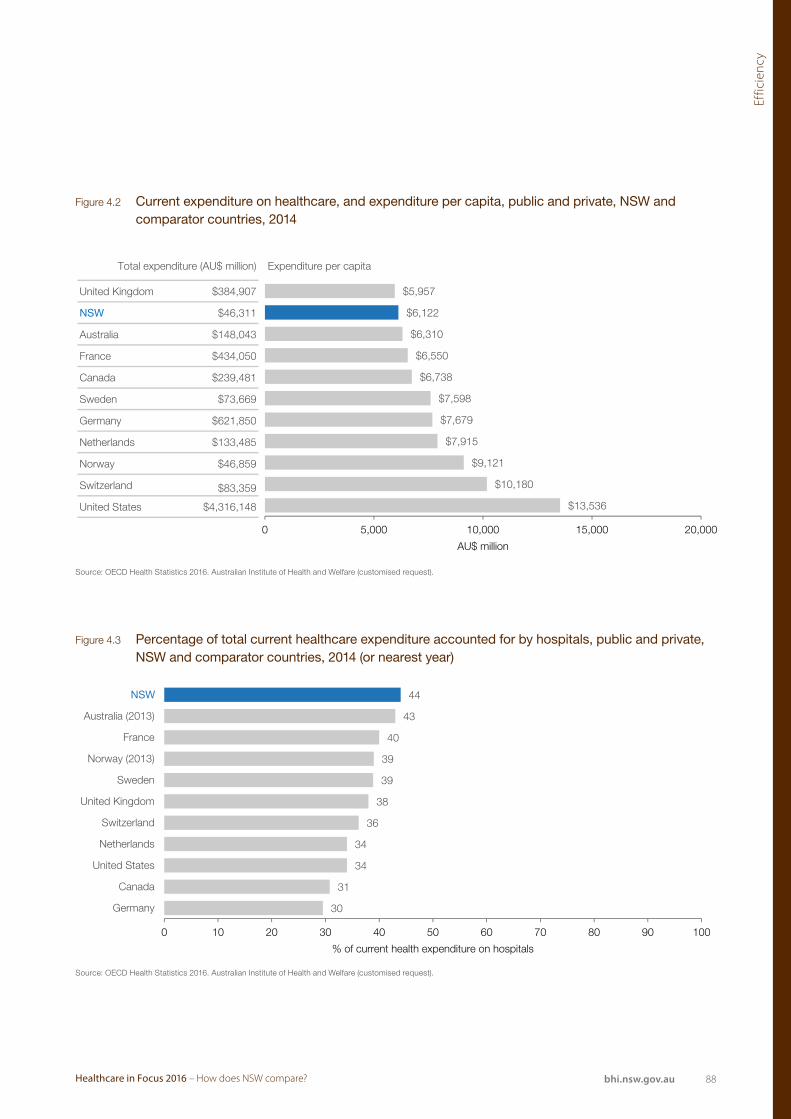
88Healthcare in Focus 2016 – How does NSW compare? bhi.nsw.gov.au
Effic
ienc
y
Total expenditure (AU$ million) Expenditure per capita
United Kingdom $384,907
NSW $46,311
Australia $148,043
France $434,050
Canada $239,481
Sweden $73,669
Germany $621,850
Netherlands $133,485
Norway $46,859
Switzerland $83,359
United States $4,316,148
Source: OECD Health Statistics 2016. AIHW health expenditure 2014–15 (customised request).
$13,536
$10,180
$9,121
$7,915
$7,679
$7,598
$6,738
$6,550
$6,310
$5,957
$6,122
0 5,000 10,000 15,000 20,000
AU$ million
Source: OECD Health Statistics 2016. AIHW health expenditure 2014–15 (customised request).
30
31
34
34
36
38
39
39
40
43
44
0 10 20 30 40 50 60 70 80 90 100
Germany
Canada
United States
Netherlands
Switzerland
United Kingdom
Sweden
Norway (2013)
France
Australia (2013)
% of current health expenditure on hospitals
NSW
Figure 4.2 Current expenditure on healthcare, and expenditure per capita, public and private, NSW and comparator countries, 2014
Figure 4.3 Percentage of total current healthcare expenditure accounted for by hospitals, public and private, NSW and comparator countries, 2014 (or nearest year)
Source: OECD Health Statistics 2016. Australian Institute of Health and Welfare (customised request).
Source: OECD Health Statistics 2016. Australian Institute of Health and Welfare (customised request).
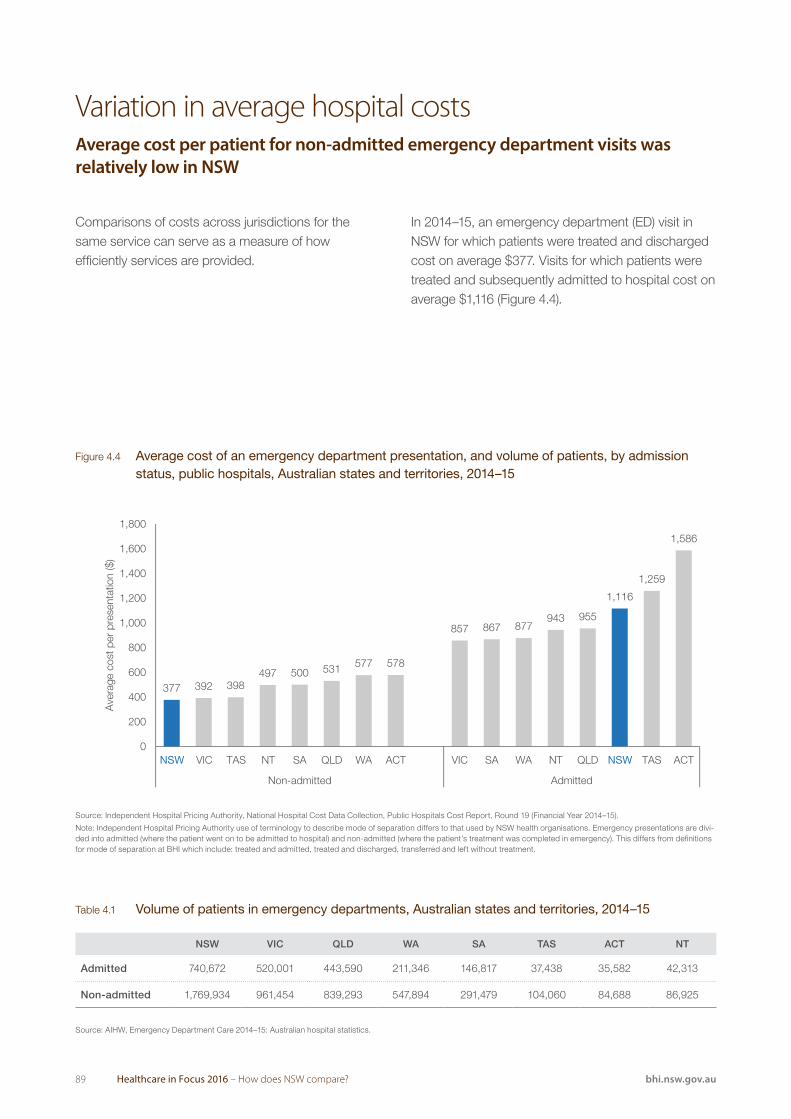
89 Healthcare in Focus 2016 – How does NSW compare? bhi.nsw.gov.au
Comparisons of costs across jurisdictions for the same service can serve as a measure of how efficiently services are provided.
Variation in average hospital costs Average cost per patient for non-admitted emergency department visits was relatively low in NSW
In 2014–15, an emergency department (ED) visit in NSW for which patients were treated and discharged cost on average $377. Visits for which patients were treated and subsequently admitted to hospital cost on average $1,116 (Figure 4.4).
Source: Independent Hospital Pricing Authority, National Hospital Cost Data Collection, Public Hospitals Cost Report, Round 19 (Financial Year 2014–15).
Note: Independent Hospitals Pricing Authority use of terminology to describe mode of separation differs to that used by NSW health organisations. Emergency presentations are divided into adm
(where the patient went on to be admitted to hospital) and non-admitted (where the patient’s treatment was completed in emergency). This differs from definitions for mode of separation at BHI which
include: treated and admitted, treated and discharged, transferred and left without treatment.
392 398497 500 531 577 578
857 867 877943 955
1,259
1,586
377
1,116
0
200
400
600
800
1,000
1,200
1,400
1,600
1,800
SA QLD WA ACT
Non-admitted
Ave
rage
cos
t per
pre
sent
atio
n ($
)
NSW VIC TAS NT VIC SA WA NT QLD NSW TAS ACT
Admitted
Figure 4.4 Average cost of an emergency department presentation, and volume of patients, by admission status, public hospitals, Australian states and territories, 2014–15
Table 4.1 Volume of patients in emergency departments, Australian states and territories, 2014–15
Source: Independent Hospital Pricing Authority, National Hospital Cost Data Collection, Public Hospitals Cost Report, Round 19 (Financial Year 2014–15).
Note: Independent Hospital Pricing Authority use of terminology to describe mode of separation differs to that used by NSW health organisations. Emergency presentations are divi-ded into admitted (where the patient went on to be admitted to hospital) and non-admitted (where the patient’s treatment was completed in emergency). This differs from definitions for mode of separation at BHI which include: treated and admitted, treated and discharged, transferred and left without treatment.
Source: AIHW, Emergency Department Care 2014–15: Australian hospital statistics.
NSW VIC QLD WA SA TAS ACT NT
Admitted 740,672 520,001 443,590 211,346 146,817 37,438 35,582 42,313
Non-admitted 1,769,934 961,454 839,293 547,894 291,479 104,060 84,688 86,925
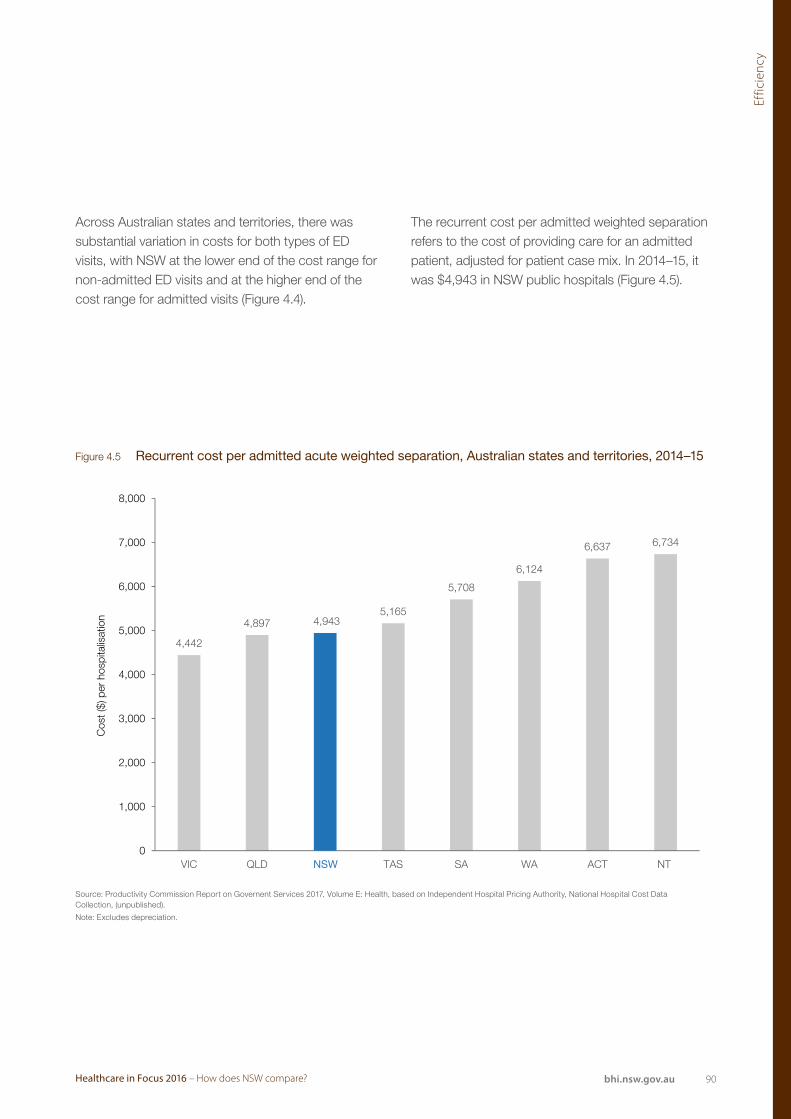
90Healthcare in Focus 2016 – How does NSW compare? bhi.nsw.gov.au
Effic
ienc
y
Source: Productivity Commission Report on Governent Services 2017, Volume E: Health, based on IHPA, National Hospital Cost Data Collection, (unpublished).
Note: Excludes depreciation.
4,442
4,8975,165
5,708
6,124
6,637 6,734
4,943
0
1,000
2,000
3,000
4,000
5,000
6,000
7,000
8,000
VIC QLD TAS SA WA ACT NT
Cos
t ($)
per
hos
pita
lisat
ion
NSW
Figure 4.5 Recurrent cost per admitted acute weighted separation, Australian states and territories, 2014–15
Source: Productivity Commission Report on Governent Services 2017, Volume E: Health, based on Independent Hospital Pricing Authority, National Hospital Cost Data Collection, (unpublished).
Note: Excludes depreciation.
Across Australian states and territories, there was substantial variation in costs for both types of ED visits, with NSW at the lower end of the cost range for non-admitted ED visits and at the higher end of the cost range for admitted visits (Figure 4.4).
The recurrent cost per admitted weighted separation refers to the cost of providing care for an admitted patient, adjusted for patient case mix. In 2014–15, it was $4,943 in NSW public hospitals (Figure 4.5).
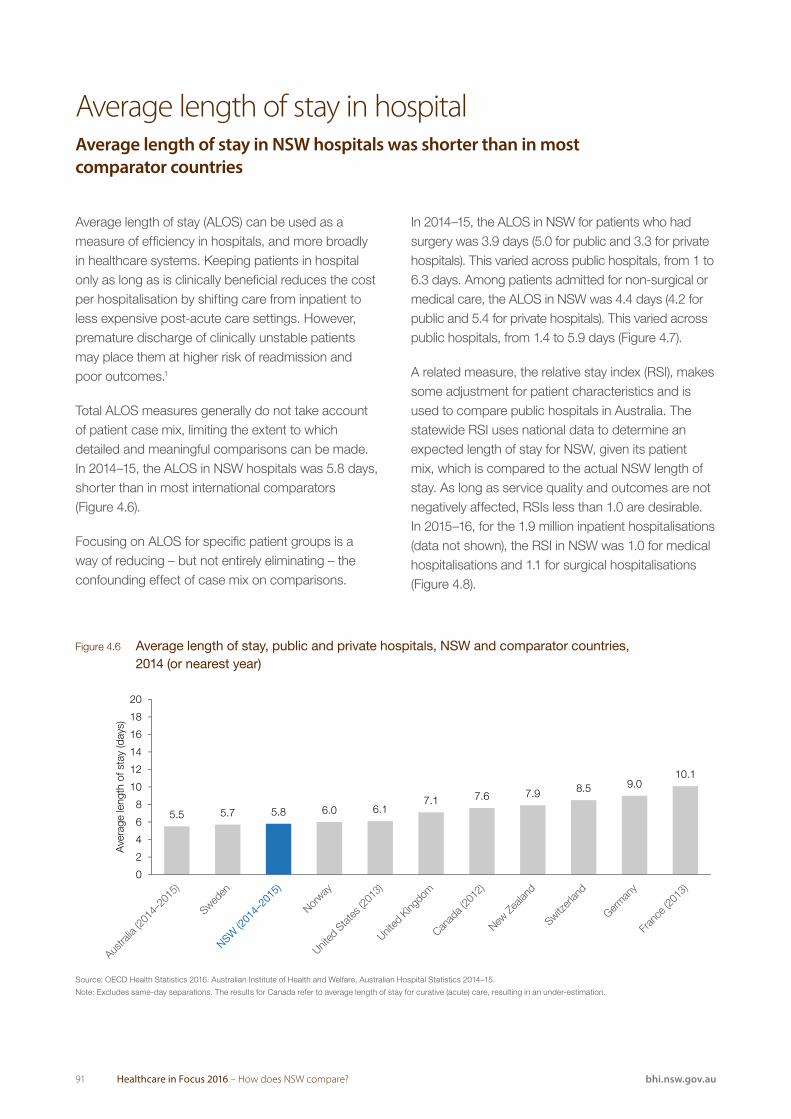
91 Healthcare in Focus 2016 – How does NSW compare? bhi.nsw.gov.au
Average length of stay (ALOS) can be used as a measure of efficiency in hospitals, and more broadly in healthcare systems. Keeping patients in hospital only as long as is clinically beneficial reduces the cost per hospitalisation by shifting care from inpatient to less expensive post-acute care settings. However, premature discharge of clinically unstable patients may place them at higher risk of readmission and poor outcomes.1
Total ALOS measures generally do not take account of patient case mix, limiting the extent to which detailed and meaningful comparisons can be made. In 2014–15, the ALOS in NSW hospitals was 5.8 days, shorter than in most international comparators (Figure 4.6).
Focusing on ALOS for specific patient groups is a way of reducing – but not entirely eliminating – the confounding effect of case mix on comparisons.
Average length of stay in hospitalAverage length of stay in NSW hospitals was shorter than in most comparator countries
In 2014–15, the ALOS in NSW for patients who had surgery was 3.9 days (5.0 for public and 3.3 for private hospitals). This varied across public hospitals, from 1 to 6.3 days. Among patients admitted for non-surgical or medical care, the ALOS in NSW was 4.4 days (4.2 for public and 5.4 for private hospitals). This varied across public hospitals, from 1.4 to 5.9 days (Figure 4.7).
A related measure, the relative stay index (RSI), makes some adjustment for patient characteristics and is used to compare public hospitals in Australia. The statewide RSI uses national data to determine an expected length of stay for NSW, given its patient mix, which is compared to the actual NSW length of stay. As long as service quality and outcomes are not negatively affected, RSIs less than 1.0 are desirable. In 2015–16, for the 1.9 million inpatient hospitalisations (data not shown), the RSI in NSW was 1.0 for medical hospitalisations and 1.1 for surgical hospitalisations (Figure 4.8).
Source: OECD Health Statistics 2016. AIHW Australian Hospital Statistics 2014–15.Note: Excludes same-day separations. The results for Canada refer to average length of stay for curative (acute) care, resulting in an under-estimation.
5.5 5.7 6.0 6.17.1 7.6 7.9 8.5 9.0
10.1
5.8
0
2
4
6
8
10
12
14
16
18
20
Austra
lia (2
014–
2015
)
NSW (2
014–
2015
)
Ave
rage
leng
th o
f sta
y (d
ays)
Figure 4.6 Average length of stay, public and private hospitals, NSW and comparator countries, 2014 (or nearest year)
Source: OECD Health Statistics 2016. Australian Institute of Health and Welfare, Australian Hospital Statistics 2014–15.
Note: Excludes same-day separations. The results for Canada refer to average length of stay for curative (acute) care, resulting in an under-estimation.
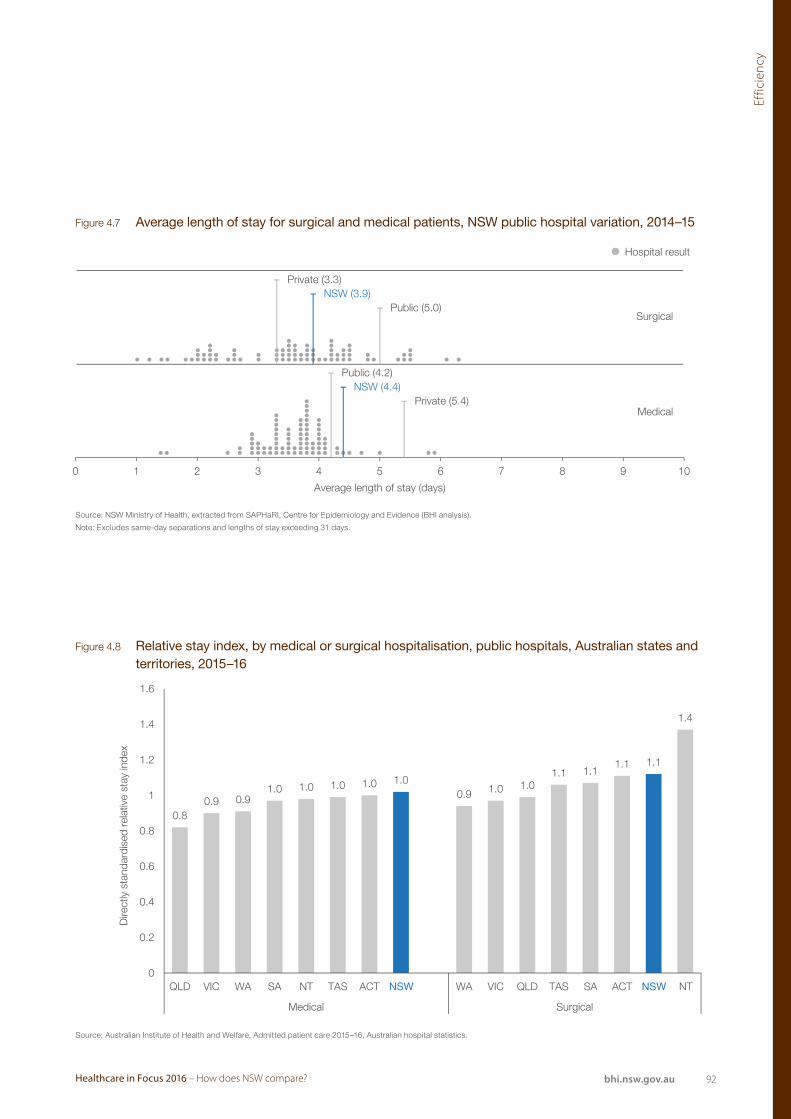
92Healthcare in Focus 2016 – How does NSW compare? bhi.nsw.gov.au
Effic
ienc
y
0 1 2 3 4 5 6 7 8 9 10
Average length of stay (days)
Hospital result
Surgical
Medical
Private (3.3)NSW (3.9)
Public (5.0)
Public (4.2)NSW (4.4)
Private (5.4)
0.80.9 0.9
1.0 1.0 1.0 1.00.9 1.0 1.0
1.1 1.11.1
1.4
1.0
1.1
0
0.2
0.4
0.6
0.8
1
1.2
1.4
1.6
QLD VIC WA SA
Dire
ctly
sta
ndar
dise
d re
lativ
e st
ay in
dex
NT TAS ACT NSW
Medical
WA VIC QLD TAS SA ACT NSW NT
Surgical
Figure 4.7 Average length of stay for surgical and medical patients, NSW public hospital variation, 2014–15
Figure 4.8 Relative stay index, by medical or surgical hospitalisation, public hospitals, Australian states and territories, 2015–16
Source: NSW Ministry of Health, extracted from SAPHaRI, Centre for Epidemiology and Evidence (BHI analysis).
Note: Excludes same-day separations and lengths of stay exceeding 31 days.
Source: Australian Institute of Health and Welfare, Admitted patient care 2015–16, Australian hospital statistics.
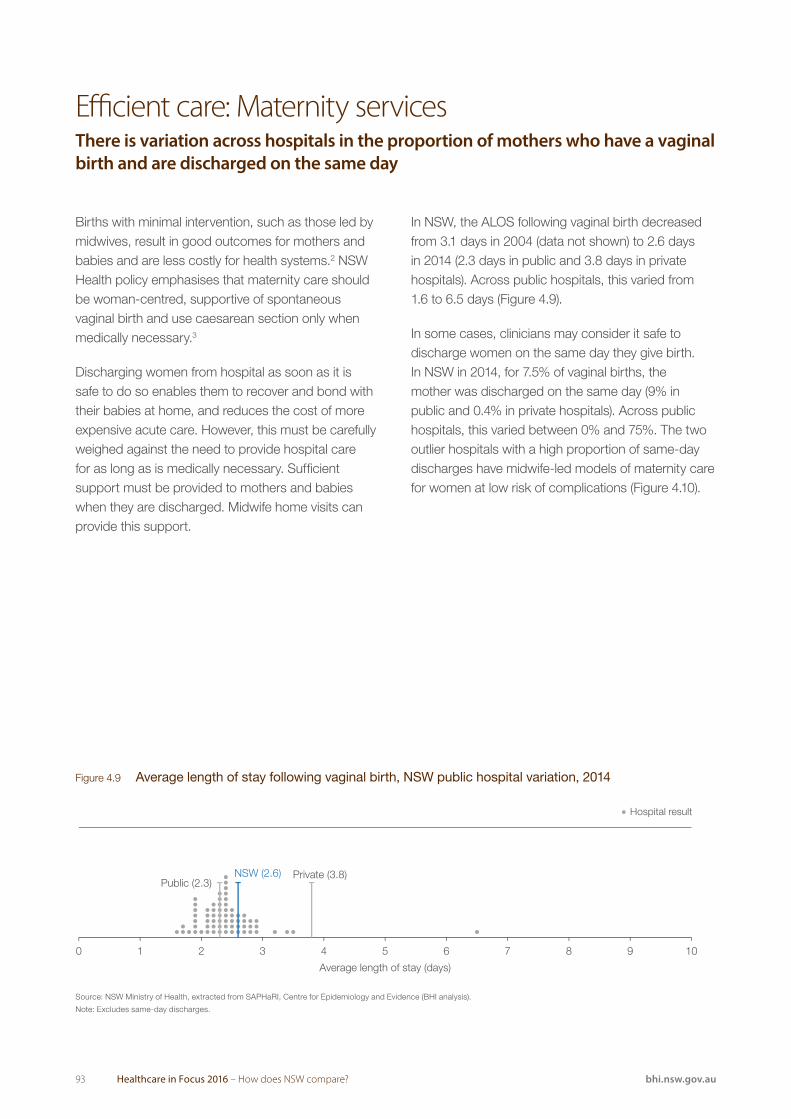
93 Healthcare in Focus 2016 – How does NSW compare? bhi.nsw.gov.au
Births with minimal intervention, such as those led by midwives, result in good outcomes for mothers and babies and are less costly for health systems.2 NSW Health policy emphasises that maternity care should be woman-centred, supportive of spontaneous vaginal birth and use caesarean section only when medically necessary.3
Discharging women from hospital as soon as it is safe to do so enables them to recover and bond with their babies at home, and reduces the cost of more expensive acute care. However, this must be carefully weighed against the need to provide hospital care for as long as is medically necessary. Sufficient support must be provided to mothers and babies when they are discharged. Midwife home visits can provide this support.
Efficient care: Maternity servicesThere is variation across hospitals in the proportion of mothers who have a vaginal birth and are discharged on the same day
In NSW, the ALOS following vaginal birth decreased from 3.1 days in 2004 (data not shown) to 2.6 days in 2014 (2.3 days in public and 3.8 days in private hospitals). Across public hospitals, this varied from 1.6 to 6.5 days (Figure 4.9).
In some cases, clinicians may consider it safe to discharge women on the same day they give birth. In NSW in 2014, for 7.5% of vaginal births, the mother was discharged on the same day (9% in public and 0.4% in private hospitals). Across public hospitals, this varied between 0% and 75%. The two outlier hospitals with a high proportion of same-day discharges have midwife-led models of maternity care for women at low risk of complications (Figure 4.10).
Source: NSW Ministry of Health, extracted from SaPHaRI, Centre for Epidemiology and Evidence (BHI analysis).
Note: Excludes same-day discharges.
0 1 2 3 4 5 6 7 8 9 10
Average length of stay (days)
Hospital value
Private (3.8)Public (2.3)
NSW (2.6)
Figure 4.9 Average length of stay following vaginal birth, NSW public hospital variation, 2014
Source: NSW Ministry of Health, extracted from SAPHaRI, Centre for Epidemiology and Evidence (BHI analysis).
Note: Excludes same-day discharges.
Hospital result
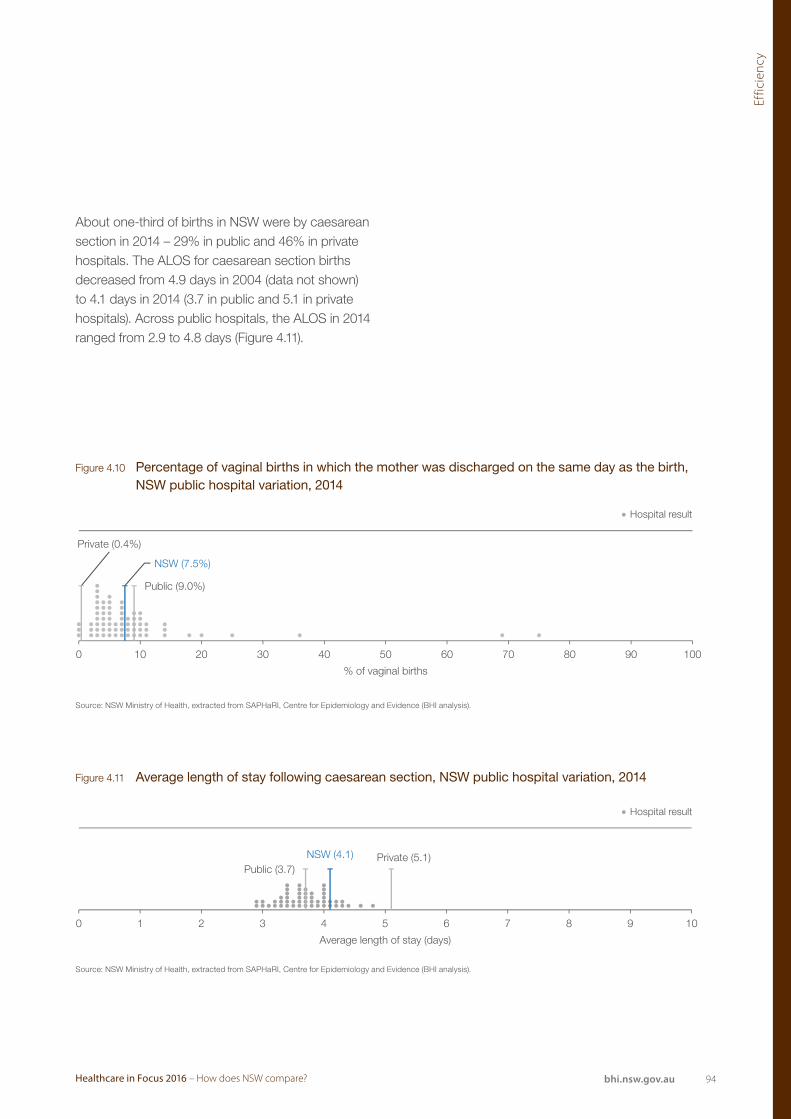
94Healthcare in Focus 2016 – How does NSW compare? bhi.nsw.gov.au
Effic
ienc
y
Source: NSW Ministry of Health, extracted from SAPHaRI, Centre for Epidemiology and Evidence (BHI analysis).
Private (0.4%)
NSW (7.5%)
Public (9.0%)
0 10 20 30 40 50 60 70 80 90 100
% of vaginal births
Hospital value
Source: NSW Ministry of Health, extracted from SAPHaRI, Centre for Epidemiology and Evidence (BHI analysis).
NSW (4.1) Private (5.1)Public (3.7)
0 1 2 3 4 5 6 7 8 9 10
Average length of stay (days)
Hospital value
Figure 4.10 Percentage of vaginal births in which the mother was discharged on the same day as the birth, NSW public hospital variation, 2014
Figure 4.11 Average length of stay following caesarean section, NSW public hospital variation, 2014
Source: NSW Ministry of Health, extracted from SAPHaRI, Centre for Epidemiology and Evidence (BHI analysis).
Source: NSW Ministry of Health, extracted from SAPHaRI, Centre for Epidemiology and Evidence (BHI analysis).
About one-third of births in NSW were by caesarean section in 2014 – 29% in public and 46% in private hospitals. The ALOS for caesarean section births decreased from 4.9 days in 2004 (data not shown) to 4.1 days in 2014 (3.7 in public and 5.1 in private hospitals). Across public hospitals, the ALOS in 2014 ranged from 2.9 to 4.8 days (Figure 4.11).
Hospital result
Hospital result
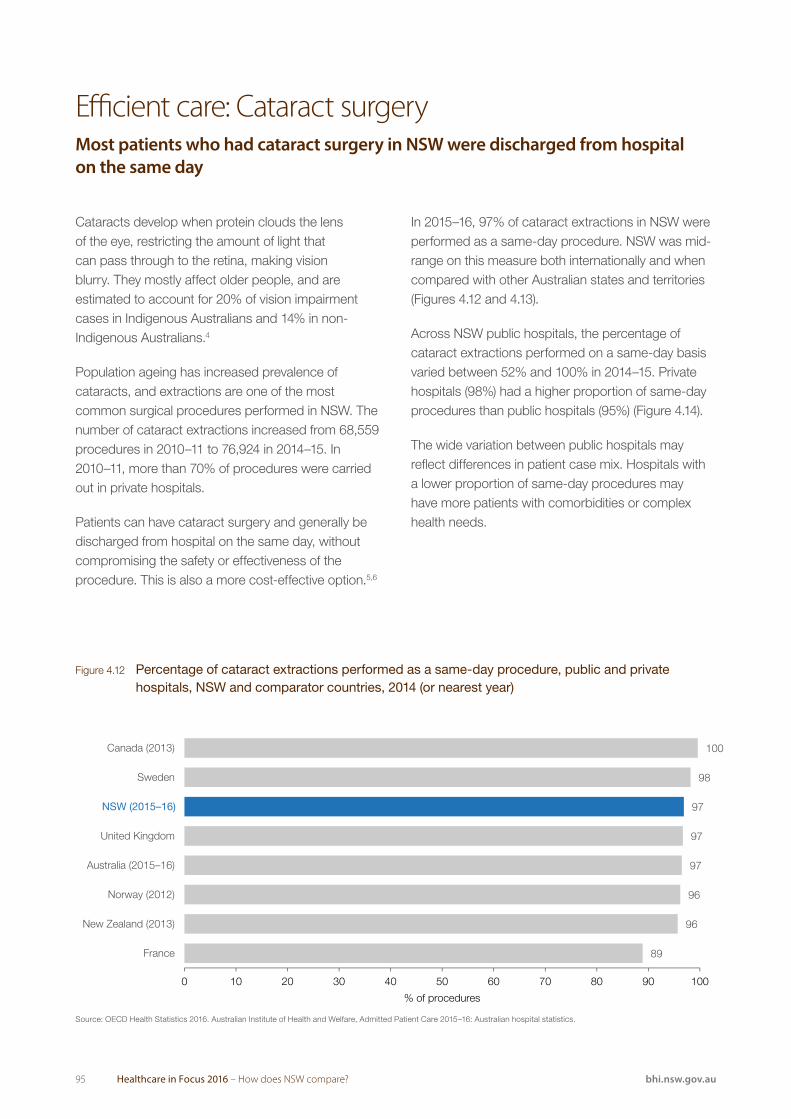
95 Healthcare in Focus 2016 – How does NSW compare? bhi.nsw.gov.au
Cataracts develop when protein clouds the lens of the eye, restricting the amount of light that can pass through to the retina, making vision blurry. They mostly affect older people, and are estimated to account for 20% of vision impairment cases in Indigenous Australians and 14% in non-Indigenous Australians.4
Population ageing has increased prevalence of cataracts, and extractions are one of the most common surgical procedures performed in NSW. The number of cataract extractions increased from 68,559 procedures in 2010–11 to 76,924 in 2014–15. In 2010–11, more than 70% of procedures were carried out in private hospitals.
Patients can have cataract surgery and generally be discharged from hospital on the same day, without compromising the safety or effectiveness of the procedure. This is also a more cost-effective option.5,6
Efficient care: Cataract surgeryMost patients who had cataract surgery in NSW were discharged from hospital on the same day
In 2015–16, 97% of cataract extractions in NSW were performed as a same-day procedure. NSW was mid-range on this measure both internationally and when compared with other Australian states and territories (Figures 4.12 and 4.13).
Across NSW public hospitals, the percentage of cataract extractions performed on a same-day basis varied between 52% and 100% in 2014–15. Private hospitals (98%) had a higher proportion of same-day procedures than public hospitals (95%) (Figure 4.14).
The wide variation between public hospitals may reflect differences in patient case mix. Hospitals with a lower proportion of same-day procedures may have more patients with comorbidities or complex health needs.
89
96
96
97
97
98
100
97
0 10 20 30 40 50 60 70 80 90 100
% of procedures
Canada (2013)
Sweden
NSW (2015–16)
United Kingdom
Australia (2015–16)
Norway (2012)
New Zealand (2013)
France
Figure 4.12 Percentage of cataract extractions performed as a same-day procedure, public and private hospitals, NSW and comparator countries, 2014 (or nearest year)
Source: OECD Health Statistics 2016. Australian Institute of Health and Welfare, Admitted Patient Care 2015–16: Australian hospital statistics.
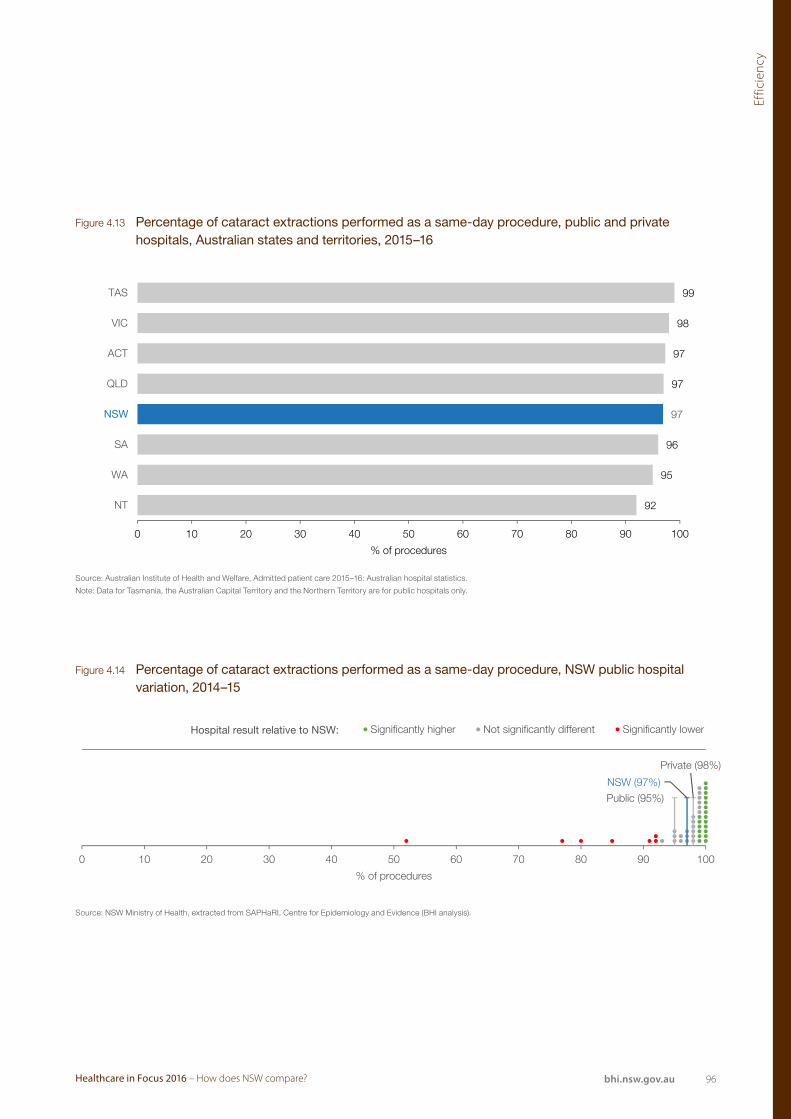
96Healthcare in Focus 2016 – How does NSW compare? bhi.nsw.gov.au
Effic
ienc
y
Source: AIHW, Admitted patient care 2015–16: Australian hospital statistics.Note: Data for Tasmania, the Australian Capital Territory and the Northern Territory are for public hospitals only.
92
95
96
97
97
98
99
97
0 10 20 30 40 50 60 70 80 90 100
NT
WA
SA
QLD
ACT
VIC
TAS
% of procedures
NSW
Hospital result relative to NSW:
Source: NSW Ministry of Health, extracted from SAPHaRI, Centre for Epidemiology and Evidence (BHI analysis).
Private (98%)
NSW (97%)
Public (95%)
0 10 20 30 40 50 60 70 80 90 100
% of procedures
Significantly higher Not significantly different Significantly lower
Figure 4.13 Percentage of cataract extractions performed as a same-day procedure, public and private hospitals, Australian states and territories, 2015–16
Figure 4.14 Percentage of cataract extractions performed as a same-day procedure, NSW public hospital variation, 2014–15
Source: Australian Institute of Health and Welfare, Admitted patient care 2015–16: Australian hospital statistics.
Note: Data for Tasmania, the Australian Capital Territory and the Northern Territory are for public hospitals only.
Source: NSW Ministry of Health, extracted from SAPHaRI, Centre for Epidemiology and Evidence (BHI analysis).

97 Healthcare in Focus 2016 – How does NSW compare? bhi.nsw.gov.au
EquityHealth for all, healthcare that’s fair
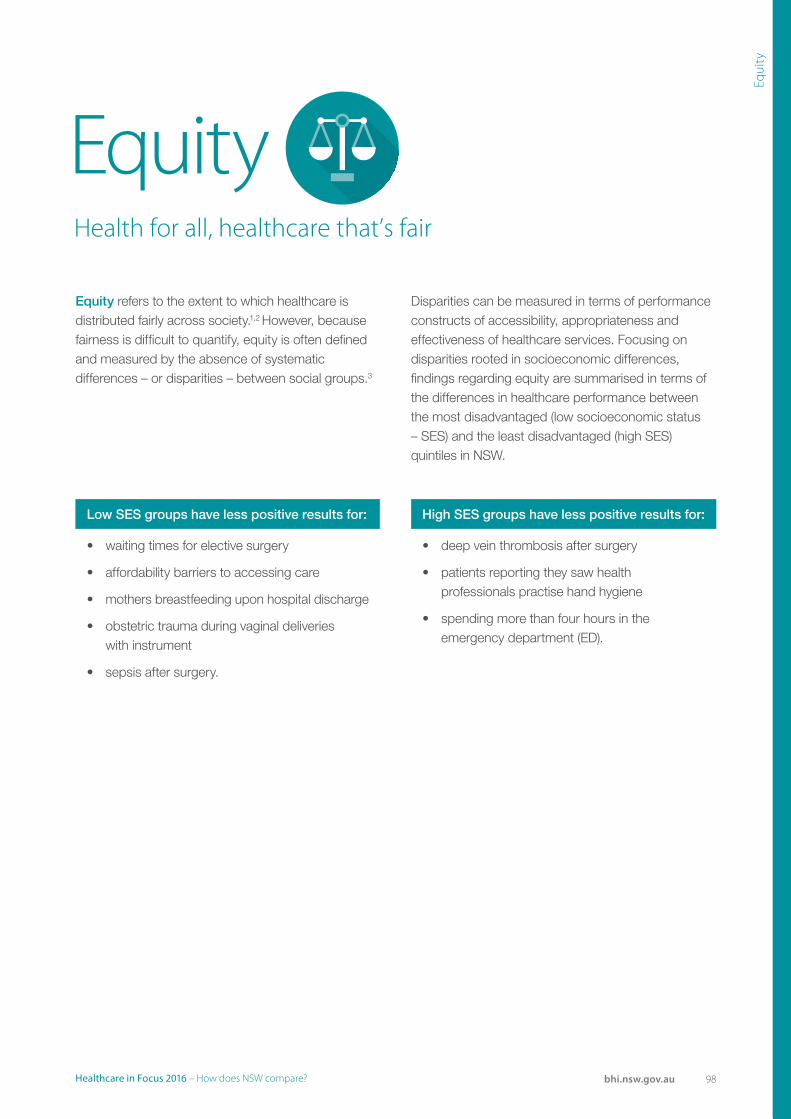
98Healthcare in Focus 2016 – How does NSW compare? bhi.nsw.gov.au
Equi
ty
EquityHealth for all, healthcare that’s fair
Equity refers to the extent to which healthcare is distributed fairly across society.1,2 However, because fairness is difficult to quantify, equity is often defined and measured by the absence of systematic differences – or disparities – between social groups.3
Disparities can be measured in terms of performance constructs of accessibility, appropriateness and effectiveness of healthcare services. Focusing on disparities rooted in socioeconomic differences, findings regarding equity are summarised in terms of the differences in healthcare performance between the most disadvantaged (low socioeconomic status – SES) and the least disadvantaged (high SES) quintiles in NSW.
Low SES groups have less positive results for: High SES groups have less positive results for:
• waiting times for elective surgery
• affordability barriers to accessing care
• mothers breastfeeding upon hospital discharge
• obstetric trauma during vaginal deliveries with instrument
• sepsis after surgery.
• deep vein thrombosis after surgery
• patients reporting they saw health professionals practise hand hygiene
• spending more than four hours in the emergency department (ED).
99 Healthcare in Focus 2016 – How does NSW compare? bhi.nsw.gov.au
The Australian Bureau of Statistics (ABS) defines socioeconomic disadvantage in terms of people’s access to material and social resources as well as their ability to participate in society.4
This chapter compares healthcare performance across five groups based on the Index of Relative Socioeconomic Disadvantage (IRSD) of residence at a postcode level. Each postcode in NSW is ranked by the IRSD score. Then five quintile groups are created so that each includes 20% of the NSW population – sorted from the most disadvantaged to the least disadvantaged areas. For ease of interpretation in this chapter, low SES refers to the most disadvantaged quintile and high SES refers to the least disadvantaged quintile.
Figure 5.1 shows the ratio of results for low to high SES group results, by the performance dimensions of accessibility, appropriateness and effectiveness, with high SES or above-average income as the reference group. A ratio greater than one indicates people living in the lowest SES areas have less positive results. A ratio less than one indicates people living in the lowest SES areas have more positive results.
For measures drawn from the 2016 Commonwealth Fund International Health Policy Survey (marked with )̂, the ratio is based on people who identified as
having below-average income compared with above-average income.
EquityAbout Socioeconomic Status Quintiles
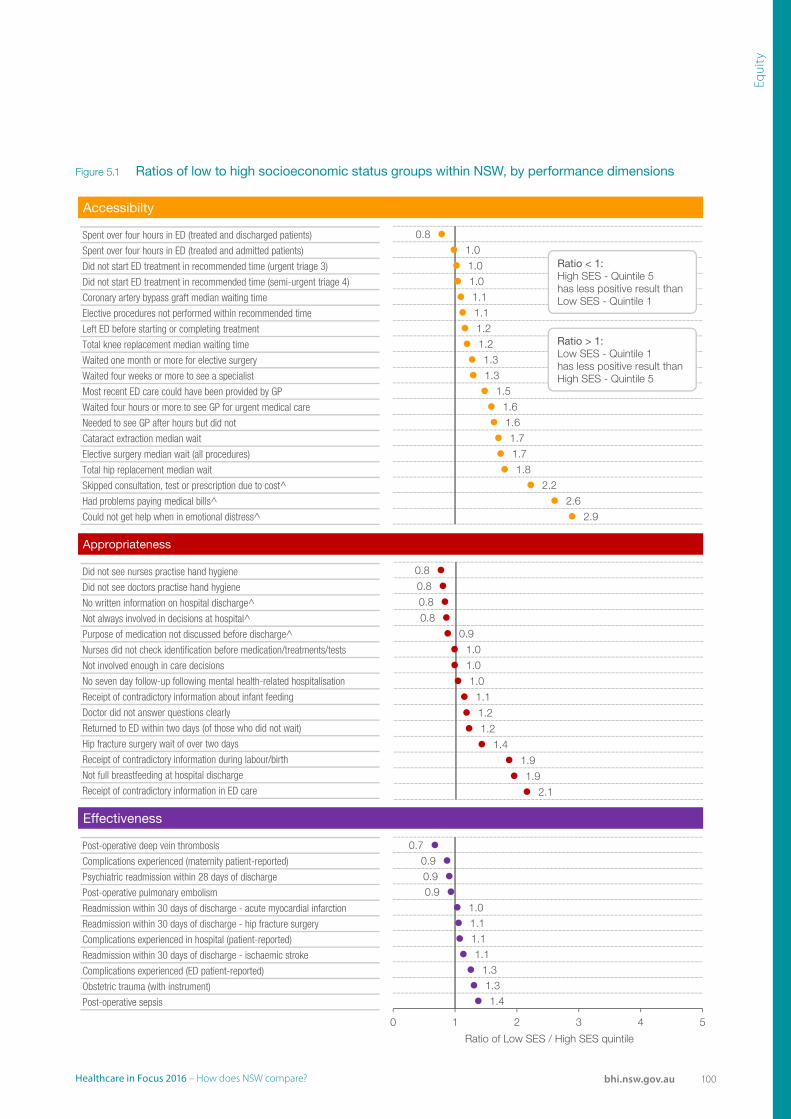
100Healthcare in Focus 2016 – How does NSW compare? bhi.nsw.gov.au
Equi
ty
Accessibilty
Spent over four hours in ED (treated and discharged patients)
Spent over four hours in ED (treated and admitted patients)
Did not start ED treatment in recommended time (urgent triage 3)
Did not start ED treatment in recommended time (semi-urgent triage 4)
Coronary artery bypass graft median waiting time
Elective procedures not performed within recommended time
Left ED before starting or completing treatment
Total knee replacement median waiting time
Waited one month or more for elective surgery
Waited four weeks or more to see a specialist
Most recent ED care could have been provided by GP
Waited four hours or more to see GP for urgent medical care
Needed to see GP after hours but did not
Cataract extraction median wait
Elective surgery median wait (all procedures)
Total hip replacement median wait
Skipped consultation, test or prescription due to cost^
Had problems paying medical bills^
Could not get help when in emotional distress^
Appropriateness
Did not see nurses practise hand hygiene
Did not see doctors practise hand hygiene
No written information on hospital discharge^
Not always involved in decisions at hospital^
Purpose of medication not discussed before discharge^
Nurses did not check identification before medication/treatments/tests
Not involved enough in care decisions
No seven day follow-up following mental health-related hospitalisation
Receipt of contradictory information about infant feeding
Doctor did not answer questions clearly
Returned to ED within two days (of those who did not wait)
Hip fracture surgery wait of over two days
Receipt of contradictory information during labour/birth
Not full breastfeeding at hospital discharge
Receipt of contradictory information in ED care
Effectiveness
Post-operative deep vein thrombosis
Complications experienced (maternity patient-reported)
Psychiatric readmission within 28 days of discharge
Post-operative pulmonary embolism
Readmission within 30 days of discharge - acute myocardial infarction
Readmission within 30 days of discharge - hip fracture surgery
Complications experienced in hospital (patient-reported)
Readmission within 30 days of discharge - ischaemic stroke
Complications experienced (ED patient-reported)
Obstetric trauma (with instrument)
Post-operative sepsis
0.81.01.01.01.11.11.21.21.31.3
1.51.61.61.71.71.8
2.22.6
2.9
0.8
0.8
0.8
0.8
0.9
1.0
1.0
1.0
1.1
1.2
1.2
1.4
1.9
1.9
2.1
0.70.90.90.9
1.01.11.11.1
1.31.31.4
0 1 2 3 4 5
Ratio of Low SES / High SES quintile
Ratio < 1:High SES - Quintile 5 has less positive result than Low SES - Quintile 1
Ratio > 1:Low SES - Quintile 1 has less positive result than High SES - Quintile 5
Figure 5.1 Ratios of low to high socioeconomic status groups within NSW, by performance dimensions
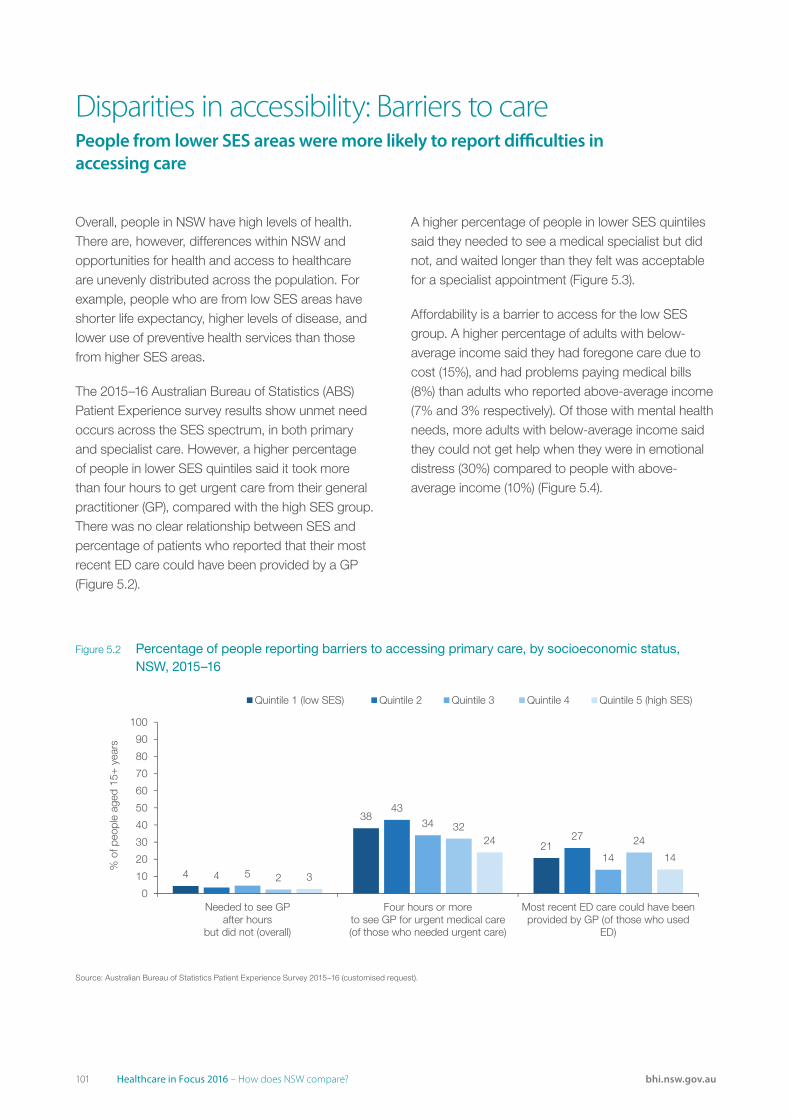
101 Healthcare in Focus 2016 – How does NSW compare? bhi.nsw.gov.au
Overall, people in NSW have high levels of health. There are, however, differences within NSW and opportunities for health and access to healthcare are unevenly distributed across the population. For example, people who are from low SES areas have shorter life expectancy, higher levels of disease, and lower use of preventive health services than those from higher SES areas.
The 2015–16 Australian Bureau of Statistics (ABS) Patient Experience survey results show unmet need occurs across the SES spectrum, in both primary and specialist care. However, a higher percentage of people in lower SES quintiles said it took more than four hours to get urgent care from their general practitioner (GP), compared with the high SES group. There was no clear relationship between SES and percentage of patients who reported that their most recent ED care could have been provided by a GP (Figure 5.2).
Disparities in accessibility: Barriers to carePeople from lower SES areas were more likely to report difficulties in accessing care
A higher percentage of people in lower SES quintiles said they needed to see a medical specialist but did not, and waited longer than they felt was acceptable for a specialist appointment (Figure 5.3).
Affordability is a barrier to access for the low SES group. A higher percentage of adults with below-average income said they had foregone care due to cost (15%), and had problems paying medical bills (8%) than adults who reported above-average income (7% and 3% respectively). Of those with mental health needs, more adults with below-average income said they could not get help when they were in emotional distress (30%) compared to people with above-average income (10%) (Figure 5.4).
Source: ABS, Patient Experience Survey 2015–16 (customised request).
4
38
21
4
43
27
5
34
14
2
3224
3
24
14
0
10
20
30
40
50
60
70
80
90
100
Needed to see GPafter hours
but did not (overall)
Four hours or moreto see GP for urgent medical care(of those who needed urgent care)
Most recent ED care could have beenprovided by GP (of those who used
ED)
% o
f peo
ple
aged
15+
yea
rs
Quintile 1 (low SES) Quintile 2 Quintile 3 Quintile 4 Quintile 5 (high SES)
Figure 5.2 Percentage of people reporting barriers to accessing primary care, by socioeconomic status, NSW, 2015–16
Source: Australian Bureau of Statistics Patient Experience Survey 2015–16 (customised request).
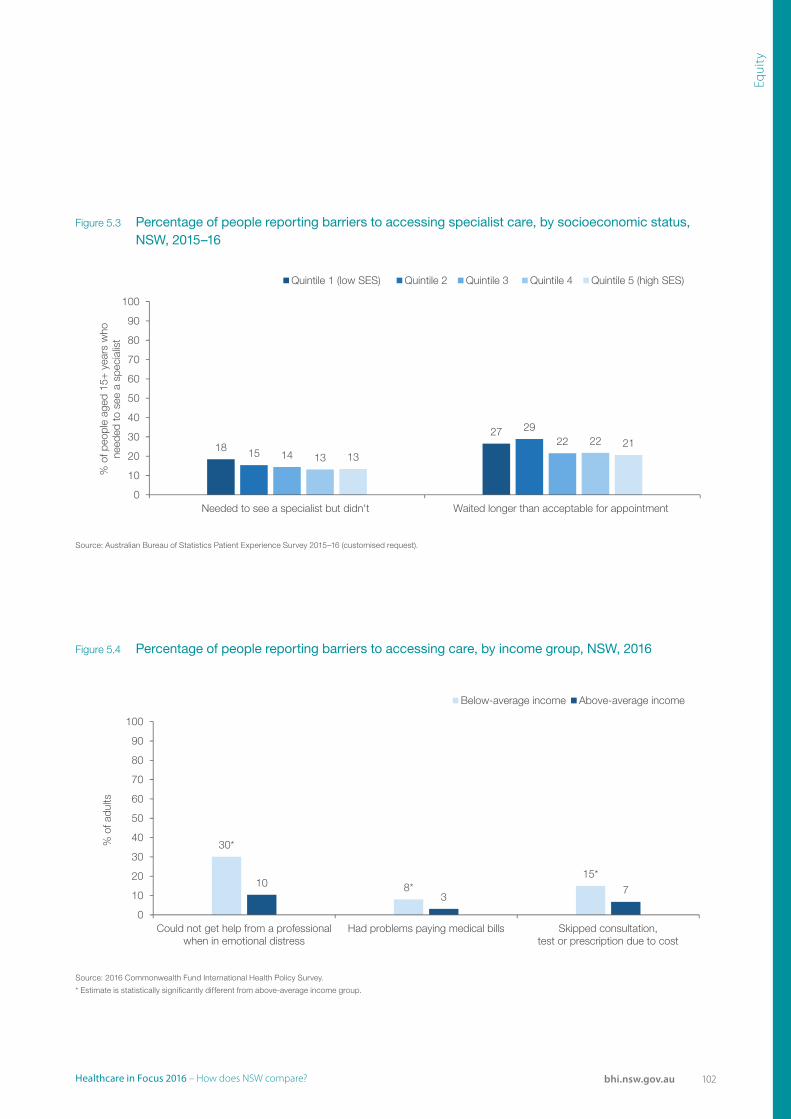
102Healthcare in Focus 2016 – How does NSW compare? bhi.nsw.gov.au
Equi
ty
Source: ABS, Patient Experience Survey 2015–16 (customised request).
1827
15
29
1422
13
22
1321
0
10
20
30
40
50
60
70
80
90
100
Needed to see a specialist but didn't Waited longer than acceptable for appointment
% o
f peo
ple
aged
15+
yea
rs w
hone
eded
to s
ee a
spe
cial
ist
Quintile 1 (low SES) Quintile 2 Quintile 3 Quintile 4 Quintile 5 (high SES)
Source: 2016 Commonwealth Fund International Health Policy Survey.
30*
8*15*
103
7
0
10
20
30
40
50
60
70
80
90
100
Could not get help from a professionalwhen in emotional distress
Had problems paying medical bills Skipped consultation,test or prescription due to cost
% o
f adu
lts
Below-average income Above-average income
Figure 5.3 Percentage of people reporting barriers to accessing specialist care, by socioeconomic status, NSW, 2015–16
Figure 5.4 Percentage of people reporting barriers to accessing care, by income group, NSW, 2016
Source: Australian Bureau of Statistics Patient Experience Survey 2015–16 (customised request).
Source: 2016 Commonwealth Fund International Health Policy Survey.
* Estimate is statistically significantly different from above-average income group.
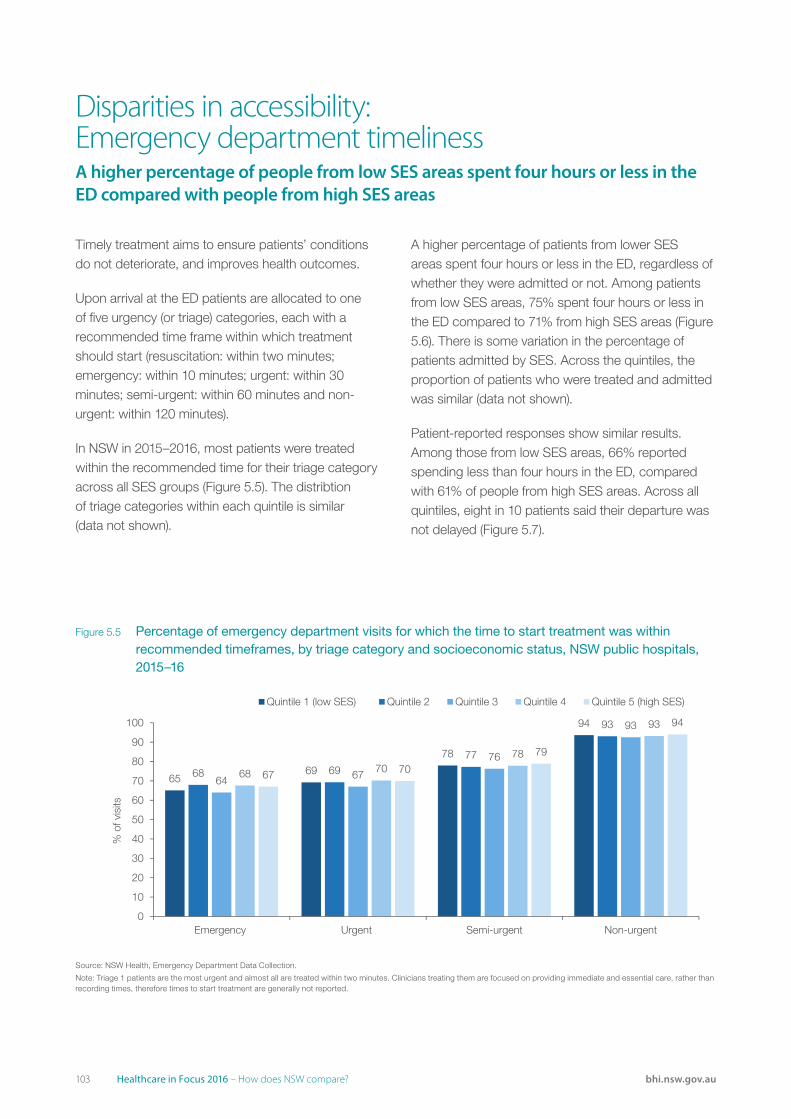
103 Healthcare in Focus 2016 – How does NSW compare? bhi.nsw.gov.au
Timely treatment aims to ensure patients’ conditions do not deteriorate, and improves health outcomes.
Upon arrival at the ED patients are allocated to one of five urgency (or triage) categories, each with a recommended time frame within which treatment should start (resuscitation: within two minutes; emergency: within 10 minutes; urgent: within 30 minutes; semi-urgent: within 60 minutes and non-urgent: within 120 minutes).
In NSW in 2015–2016, most patients were treated within the recommended time for their triage category across all SES groups (Figure 5.5). The distribtion of triage categories within each quintile is similar (data not shown).
Disparities in accessibility: Emergency department timelinessA higher percentage of people from low SES areas spent four hours or less in the ED compared with people from high SES areas
A higher percentage of patients from lower SES areas spent four hours or less in the ED, regardless of whether they were admitted or not. Among patients from low SES areas, 75% spent four hours or less in the ED compared to 71% from high SES areas (Figure 5.6). There is some variation in the percentage of patients admitted by SES. Across the quintiles, the proportion of patients who were treated and admitted was similar (data not shown).
Patient-reported responses show similar results. Among those from low SES areas, 66% reported spending less than four hours in the ED, compared with 61% of people from high SES areas. Across all quintiles, eight in 10 patients said their departure was not delayed (Figure 5.7).
Source: NSW Health, Emergency Department Data Collection.
6569
78
68 6977
64 67
76
68 7067 70
0
10
20
30
40
50
60
70
80
90
100
Emergency Urgent Semi-urgent Non-urgent
% o
f vis
its
Quintile 1 (low SES) Quintile 2 Quintile 3 Quintile 4 Quintile 5 (high SES)
94 93 93 93 94
78 79
Figure 5.5 Percentage of emergency department visits for which the time to start treatment was within recommended timeframes, by triage category and socioeconomic status, NSW public hospitals, 2015–16
Source: NSW Health, Emergency Department Data Collection.
Note: Triage 1 patients are the most urgent and almost all are treated within two minutes. Clinicians treating them are focused on providing immediate and essential care, rather than recording times, therefore times to start treatment are generally not reported.
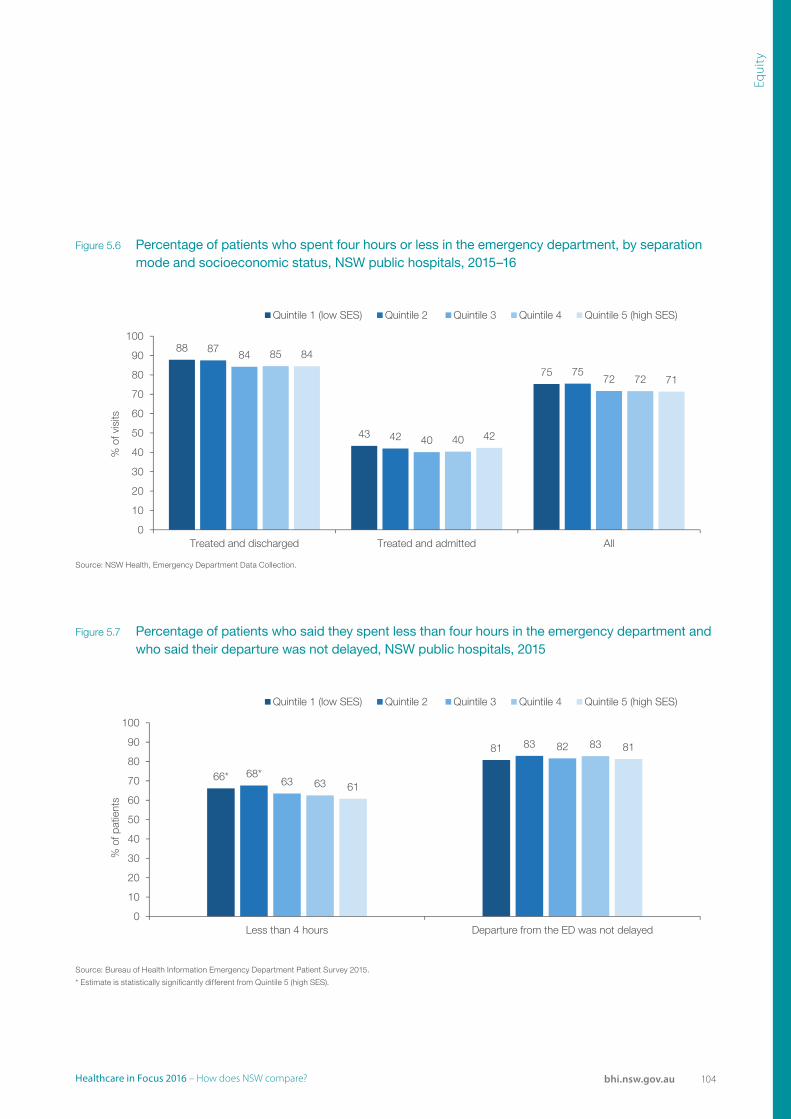
104Healthcare in Focus 2016 – How does NSW compare? bhi.nsw.gov.au
Equi
ty
Source: NSW Health, Emergency Department Data Collection.
88
43
75
87
42
75
84
40
72
85
40
72
84
42
71
0
10
20
30
40
50
60
70
80
90
100
Treated and discharged Treated and admitted All
% o
f vis
its
Quintile 1 (low SES) Quintile 2 Quintile 3 Quintile 4 Quintile 5 (high SES)
Source: BHI, Emergency Department Patient Survey 2015–16.
* Estimate is statistically significantly different from quintile 5 (high SES).
66*
81
68*
83
63
82
63
83
61
81
0
10
20
30
40
50
60
70
80
90
100
Less than 4 hours Departure from the ED was not delayed
% o
f pat
ient
s
Quintile 1 (low SES) Quintile 2 Quintile 3 Quintile 4 Quintile 5 (high SES)
Figure 5.6 Percentage of patients who spent four hours or less in the emergency department, by separation mode and socioeconomic status, NSW public hospitals, 2015–16
Figure 5.7 Percentage of patients who said they spent less than four hours in the emergency department and who said their departure was not delayed, NSW public hospitals, 2015
Source: NSW Health, Emergency Department Data Collection.
Source: Bureau of Health Information Emergency Department Patient Survey 2015.
* Estimate is statistically significantly different from Quintile 5 (high SES).
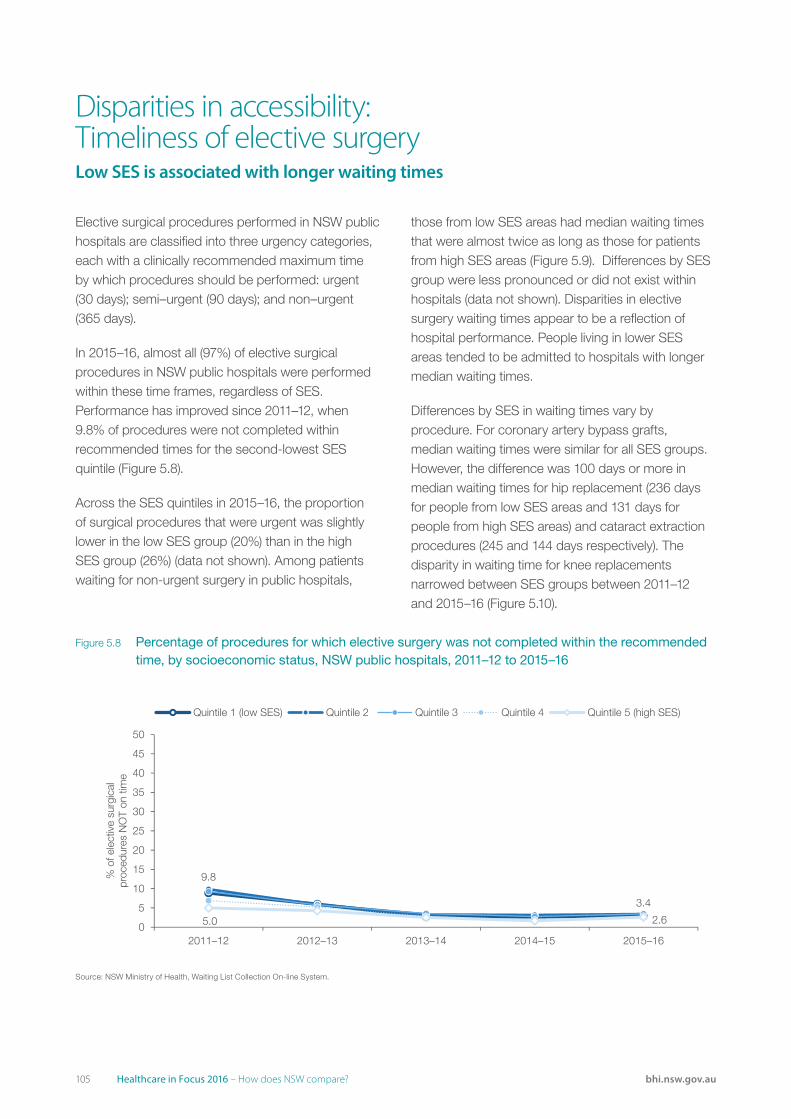
105 Healthcare in Focus 2016 – How does NSW compare? bhi.nsw.gov.au
Elective surgical procedures performed in NSW public hospitals are classified into three urgency categories, each with a clinically recommended maximum time by which procedures should be performed: urgent (30 days); semi–urgent (90 days); and non–urgent (365 days).
In 2015–16, almost all (97%) of elective surgical procedures in NSW public hospitals were performed within these time frames, regardless of SES. Performance has improved since 2011–12, when 9.8% of procedures were not completed within recommended times for the second-lowest SES quintile (Figure 5.8).
Across the SES quintiles in 2015–16, the proportion of surgical procedures that were urgent was slightly lower in the low SES group (20%) than in the high SES group (26%) (data not shown). Among patients waiting for non-urgent surgery in public hospitals,
Disparities in accessibility: Timeliness of elective surgeryLow SES is associated with longer waiting times
those from low SES areas had median waiting times that were almost twice as long as those for patients from high SES areas (Figure 5.9). Differences by SES group were less pronounced or did not exist within hospitals (data not shown). Disparities in elective surgery waiting times appear to be a reflection of hospital performance. People living in lower SES areas tended to be admitted to hospitals with longer median waiting times.
Differences by SES in waiting times vary by procedure. For coronary artery bypass grafts, median waiting times were similar for all SES groups. However, the difference was 100 days or more in median waiting times for hip replacement (236 days for people from low SES areas and 131 days for people from high SES areas) and cataract extraction procedures (245 and 144 days respectively). The disparity in waiting time for knee replacements narrowed between SES groups between 2011–12 and 2015–16 (Figure 5.10).
Source: NSW Ministry of Health, Waiting List Collection On-line System (extracted 15 January 2017)
5.0 2.6
9.8
3.4
0
5
10
15
20
25
30
35
40
45
50
2011–12 2012–13 2013–14 2014–15 2015–16
% o
f ele
ctiv
e su
rgic
alpr
oced
ures
NO
T on
tim
e
Quintile 1 (low SES) Quintile 2 Quintile 3 Quintile 4 Quintile 5 (high SES)
Figure 5.8 Percentage of procedures for which elective surgery was not completed within the recommended time, by socioeconomic status, NSW public hospitals, 2011–12 to 2015–16
Source: NSW Ministry of Health, Waiting List Collection On-line System.
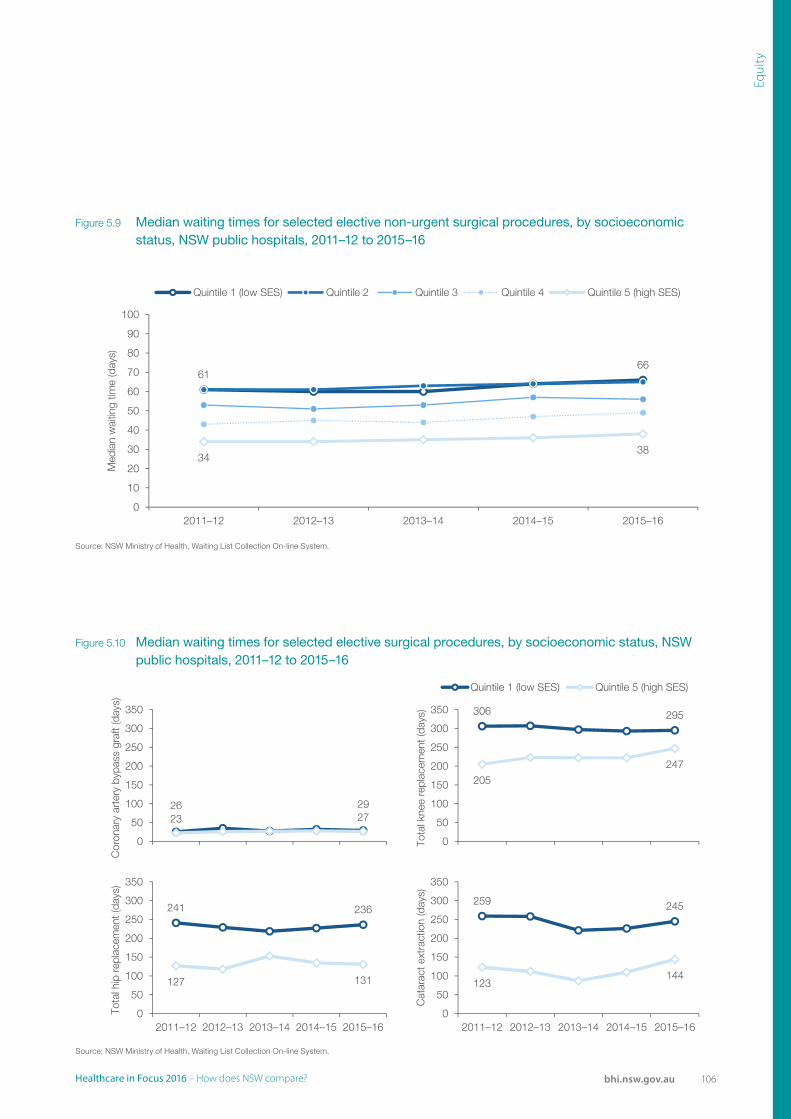
106Healthcare in Focus 2016 – How does NSW compare? bhi.nsw.gov.au
Equi
ty
Source: NSW Ministry of Health, Waiting List Collection On-line System.
3438
6166
0
10
20
30
40
50
60
70
80
90
100
2011–12 2012–13 2013–14 2014–15 2015–16
Med
ian
wai
ting
time
(day
s)
Quintile 1 (low SES) Quintile 2 Quintile 3 Quintile 4 Quintile 5 (high SES)
Source: NSW Ministry of Health, Waiting List Collection On-line System.
23 2726 29
0
50
100
150
200
250
300
350
Cor
onar
y ar
tery
byp
ass
graf
t (da
ys)
205
247
306 295
0
50
100
150
200
250
300
350
Tota
l kne
e re
plac
emen
t(da
ys)
Quintile 1 (low SES) Quintile 5 (high SES)
127 131
241 236
0
50
100
150
200
250
300
350
2011–12 2012–13 2013–14 2014–15 2015–16
Tota
l hip
rep
lace
men
t(da
ys)
123144
259 245
0
50
100
150
200
250
300
350
2011–12 2012–13 2013–14 2014–15 2015–16
Cat
arac
t ext
ract
ion
(day
s)
Figure 5.9 Median waiting times for selected elective non-urgent surgical procedures, by socioeconomic status, NSW public hospitals, 2011–12 to 2015–16
Figure 5.10 Median waiting times for selected elective surgical procedures, by socioeconomic status, NSW public hospitals, 2011–12 to 2015–16
Source: NSW Ministry of Health, Waiting List Collection On-line System.
Source: NSW Ministry of Health, Waiting List Collection On-line System.
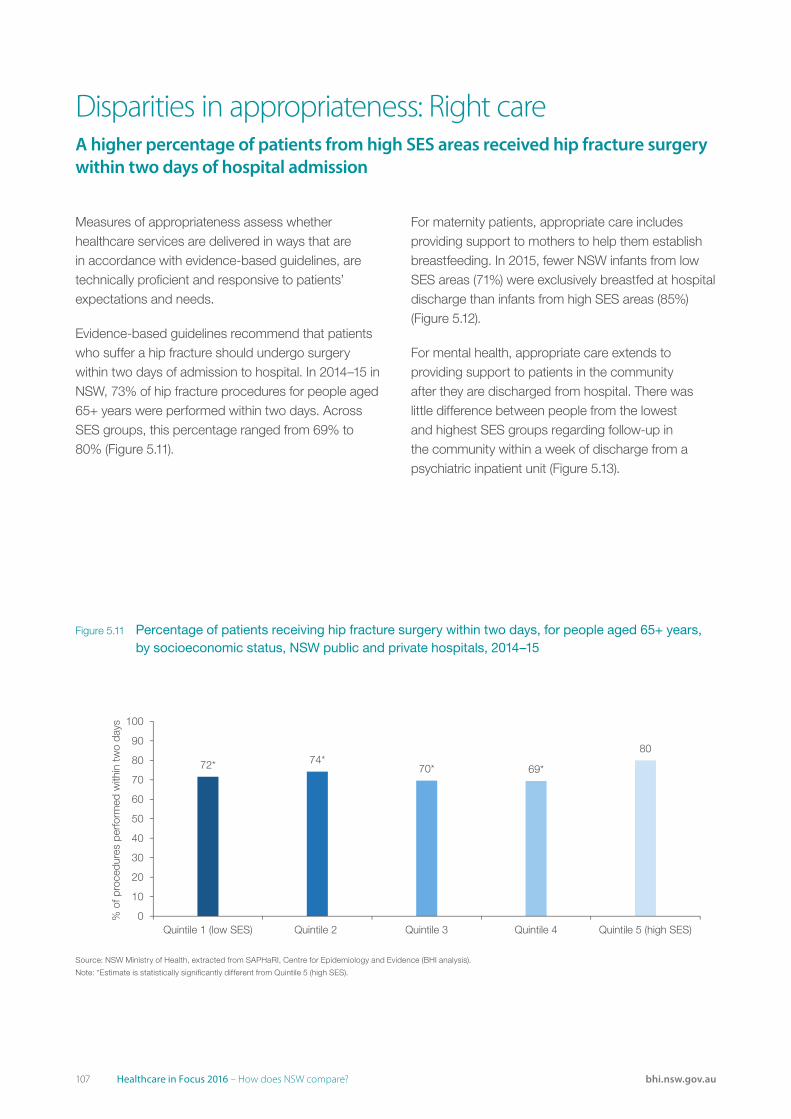
107 Healthcare in Focus 2016 – How does NSW compare? bhi.nsw.gov.au
Measures of appropriateness assess whether healthcare services are delivered in ways that are in accordance with evidence-based guidelines, are technically proficient and responsive to patients’ expectations and needs.
Evidence-based guidelines recommend that patients who suffer a hip fracture should undergo surgery within two days of admission to hospital. In 2014–15 in NSW, 73% of hip fracture procedures for people aged 65+ years were performed within two days. Across SES groups, this percentage ranged from 69% to 80% (Figure 5.11).
Disparities in appropriateness: Right careA higher percentage of patients from high SES areas received hip fracture surgery within two days of hospital admission
For maternity patients, appropriate care includes providing support to mothers to help them establish breastfeeding. In 2015, fewer NSW infants from low SES areas (71%) were exclusively breastfed at hospital discharge than infants from high SES areas (85%) (Figure 5.12).
For mental health, appropriate care extends to providing support to patients in the community after they are discharged from hospital. There was little difference between people from the lowest and highest SES groups regarding follow-up in the community within a week of discharge from a psychiatric inpatient unit (Figure 5.13).
Source: NSW Ministry of health, extracted from SAPHaRI, Centre for Epidemiology and Evidence, NSW (BHI Analysis).
72* 74*70* 69*
80
0
10
20
30
40
50
60
70
80
90
100
Quintile 1 (low SES) Quintile 2 Quintile 3 Quintile 4 Quintile 5 (high SES)
% o
f pro
cedu
res
perfo
rmed
with
in tw
o da
ys
Figure 5.11 Percentage of patients receiving hip fracture surgery within two days, for people aged 65+ years, by socioeconomic status, NSW public and private hospitals, 2014–15
Source: NSW Ministry of Health, extracted from SAPHaRI, Centre for Epidemiology and Evidence (BHI analysis).
Note: *Estimate is statistically significantly different from Quintile 5 (high SES).
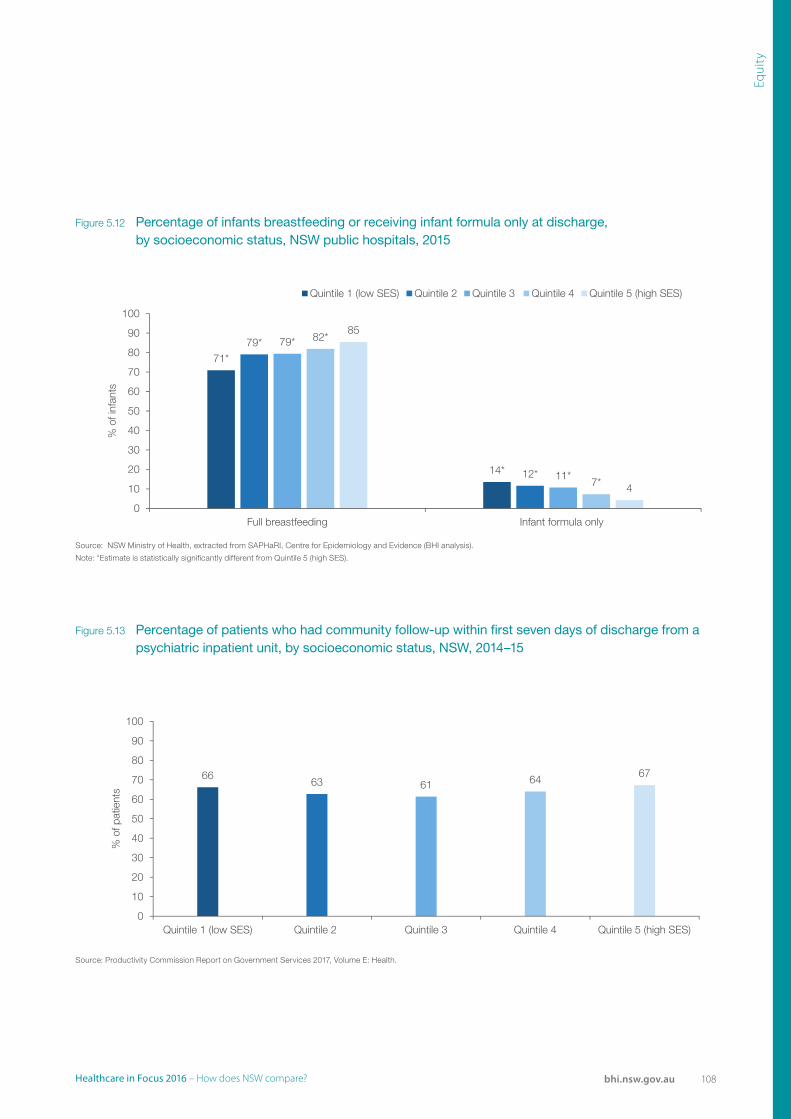
108Healthcare in Focus 2016 – How does NSW compare? bhi.nsw.gov.au
Equi
ty
Source: NSW Ministry of health, extracted from SAPHaRI, Centre for Epidemiology and Evidence, NSW (BHI Analysis).
Note: *estimate is statistically significantly different from quintile 5 (high SES).
14* 12* 11*7* 4
0
10
20
30
40
50
60
70
80
90
100
Full breastfeeding Infant formula only
% o
f inf
ants
Quintile 1 (low SES)
85
Quintile 2 Quintile 3 Quintile 4 Quintile 5 (high SES)
82*79* 79*
71*
Source: Australian Productivity Commission, report of Government Services 2016, Volume E: Health.
6663 61 64
67
0
10
20
30
40
50
60
70
80
90
100
Quintile 1 (low SES) Quintile 2 Quintile 3 Quintile 4 Quintile 5 (high SES)
% o
f pat
ient
s
Figure 5.12 Percentage of infants breastfeeding or receiving infant formula only at discharge, by socioeconomic status, NSW public hospitals, 2015
Figure 5.13 Percentage of patients who had community follow-up within first seven days of discharge from a psychiatric inpatient unit, by socioeconomic status, NSW, 2014–15
Source: NSW Ministry of Health, extracted from SAPHaRI, Centre for Epidemiology and Evidence (BHI analysis).
Note: *Estimate is statistically significantly different from Quintile 5 (high SES).
Source: Productivity Commission Report on Government Services 2017, Volume E: Health.
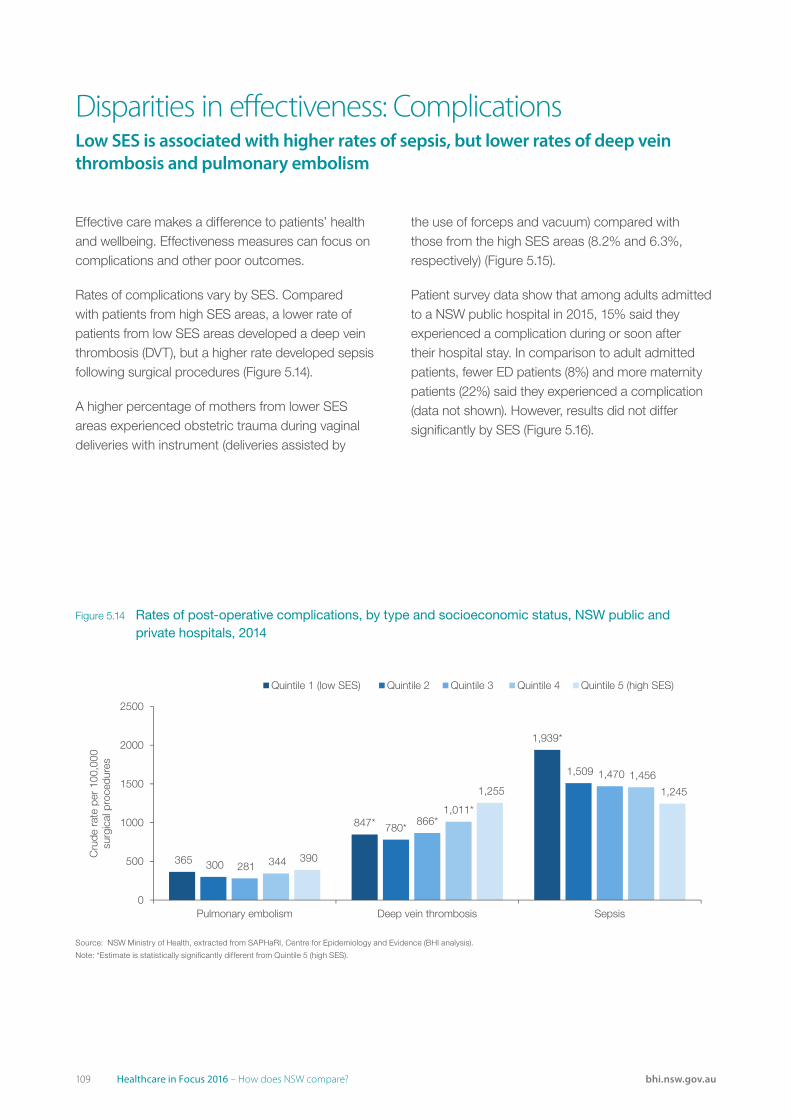
109 Healthcare in Focus 2016 – How does NSW compare? bhi.nsw.gov.au
Effective care makes a difference to patients’ health and wellbeing. Effectiveness measures can focus on complications and other poor outcomes.
Rates of complications vary by SES. Compared with patients from high SES areas, a lower rate of patients from low SES areas developed a deep vein thrombosis (DVT), but a higher rate developed sepsis following surgical procedures (Figure 5.14).
A higher percentage of mothers from lower SES areas experienced obstetric trauma during vaginal deliveries with instrument (deliveries assisted by
Disparities in effectiveness: Complications Low SES is associated with higher rates of sepsis, but lower rates of deep vein thrombosis and pulmonary embolism
the use of forceps and vacuum) compared with those from the high SES areas (8.2% and 6.3%, respectively) (Figure 5.15).
Patient survey data show that among adults admitted to a NSW public hospital in 2015, 15% said they experienced a complication during or soon after their hospital stay. In comparison to adult admitted patients, fewer ED patients (8%) and more maternity patients (22%) said they experienced a complication (data not shown). However, results did not differ significantly by SES (Figure 5.16).
Source: NSW Ministry of health, extracted from SAPHaRI, Centre for Epidemiology and Evidence, NSW (BHI Analysis).
365
847*
1,939*
300
780*
1,509
281
866*
1,470
344
1,011*
1,456
390
1,255 1,245
0
500
1000
1500
2000
2500
Pulmonary embolism Deep vein thrombosis Sepsis
Cru
de r
ate
per
100,
000
surg
ical
pro
cedu
res
Quintile 1 (low SES) Quintile 2 Quintile 3 Quintile 4 Quintile 5 (high SES)
Figure 5.14 Rates of post-operative complications, by type and socioeconomic status, NSW public and private hospitals, 2014
Source: NSW Ministry of Health, extracted from SAPHaRI, Centre for Epidemiology and Evidence (BHI analysis).
Note: *Estimate is statistically significantly different from Quintile 5 (high SES).
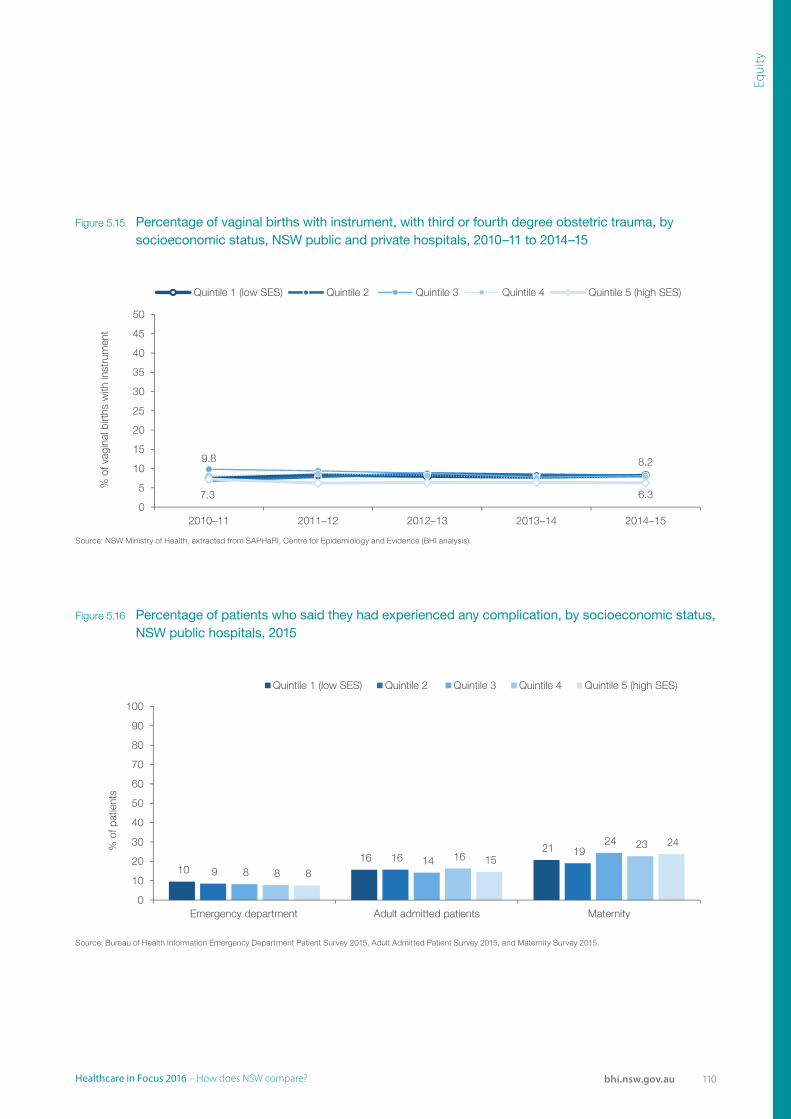
110Healthcare in Focus 2016 – How does NSW compare? bhi.nsw.gov.au
Equi
ty
Source: NSW Ministry of health, extracted from SAPHaRI, Centre for Epidemiology and Evidence, NSW (BHI Analysis).
7.3 6.3
9.8 8.2
0
5
10
15
20
25
30
35
40
45
50
2010–11 2011–12 2012–13 2013–14 2014–15
% o
f vag
inal
birt
hs w
ith in
stru
men
t
Quintile 1 (low SES) Quintile 2 Quintile 3 Quintile 4 Quintile 5 (high SES)
Sources: BHI, Emergency Department Patient Survey 2015–16. Adult Admitted Patient Survey 2015, and Maternity Survey 2015.
10 16
21
9 16 19
8 14
24
8
16 23
8 15
24
0
10
20
30
40
50
60
70
80
90
100
Emergency department Adult admitted patients Maternity
% o
f pat
ient
s
Quintile 1 (low SES) Quintile 2 Quintile 3 Quintile 4 Quintile 5 (high SES)
Figure 5.15 Percentage of vaginal births with instrument, with third or fourth degree obstetric trauma, by socioeconomic status, NSW public and private hospitals, 2010–11 to 2014–15
Figure 5.16 Percentage of patients who said they had experienced any complication, by socioeconomic status, NSW public hospitals, 2015
Source: NSW Ministry of Health, extracted from SAPHaRI, Centre for Epidemiology and Evidence (BHI analysis).
Source: Bureau of Health Information Emergency Department Patient Survey 2015, Adult Admitted Patient Survey 2015, and Maternity Survey 2015.
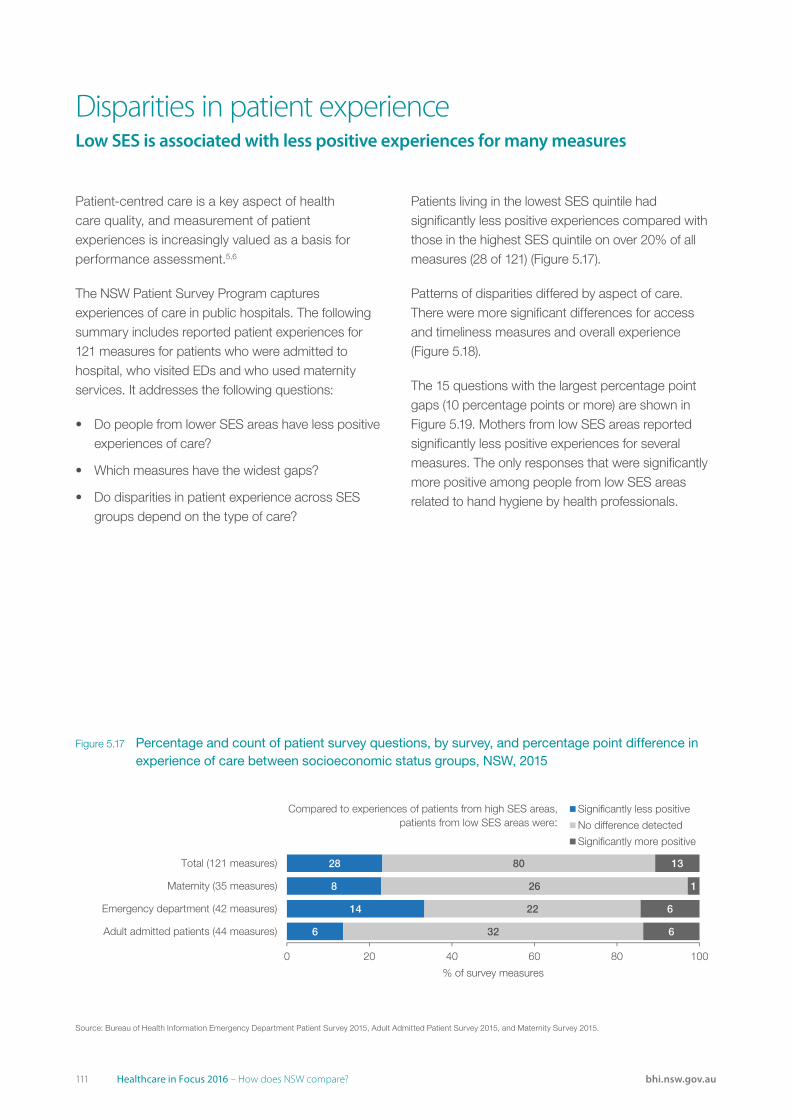
111 Healthcare in Focus 2016 – How does NSW compare? bhi.nsw.gov.au
Patient-centred care is a key aspect of health care quality, and measurement of patient experiences is increasingly valued as a basis for performance assessment.5,6
The NSW Patient Survey Program captures experiences of care in public hospitals. The following summary includes reported patient experiences for 121 measures for patients who were admitted to hospital, who visited EDs and who used maternity services. It addresses the following questions:
• Do people from lower SES areas have less positive experiences of care?
• Which measures have the widest gaps?
• Do disparities in patient experience across SES groups depend on the type of care?
Disparities in patient experienceLow SES is associated with less positive experiences for many measures
Patients living in the lowest SES quintile had significantly less positive experiences compared with those in the highest SES quintile on over 20% of all measures (28 of 121) (Figure 5.17).
Patterns of disparities differed by aspect of care. There were more significant differences for access and timeliness measures and overall experience (Figure 5.18).
The 15 questions with the largest percentage point gaps (10 percentage points or more) are shown in Figure 5.19. Mothers from low SES areas reported significantly less positive experiences for several measures. The only responses that were significantly more positive among people from low SES areas related to hand hygiene by health professionals.
Source: NSW Health, Emergency Department Data Collection.
Sources: BHI, Emergency Department Patient Survey 2015–16. Adult Admitted Patient Survey 2015, and Maternity Survey 2015.
6
14
8
28
32
22
26
80
6
6
1
13
0 20 40 60 80 100
Adult admitted patients (44 measures)
Emergency department (42 measures)
Maternity (35 measures)
Total (121 measures)
% of survey measures
Significantly less positive
No difference detected
Significantly more positive
Compared to experiences of patients from high SES areas, patients from low SES areas were:
Figure 5.17 Percentage and count of patient survey questions, by survey, and percentage point difference in experience of care between socioeconomic status groups, NSW, 2015
Source: Bureau of Health Information Emergency Department Patient Survey 2015, Adult Admitted Patient Survey 2015, and Maternity Survey 2015.
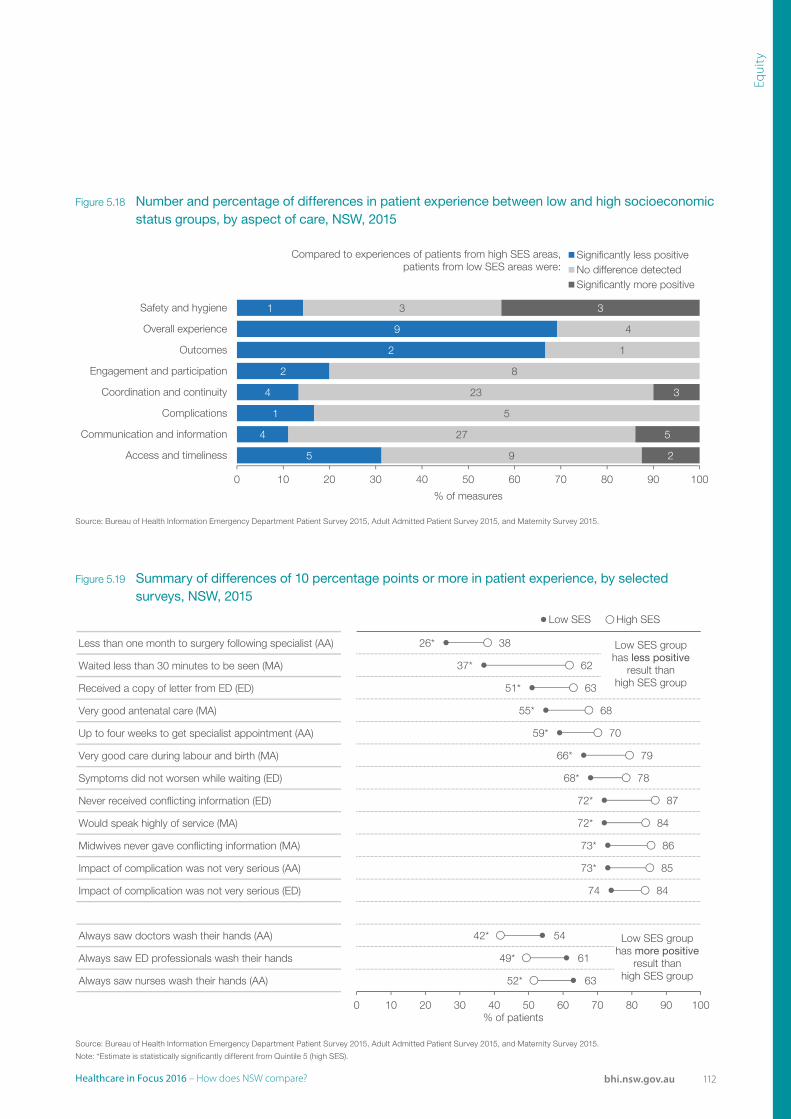
112Healthcare in Focus 2016 – How does NSW compare? bhi.nsw.gov.au
Equi
ty
Sources: BHI, Emergency Department Patient Survey 2015–16. Adult Admitted Patient Survey 2015, and Maternity Survey 2015.
5
4
1
4
2
2
9
1
9
27
5
23
8
1
4
3
2
5
3
3
0 10 20 30 40 50 60 70 80 90 100
Access and timeliness
Communication and information
Complications
Coordination and continuity
Engagement and participation
Outcomes
Overall experience
Safety and hygiene
% of measures
Significantly less positiveNo difference detectedSignificantly more positive
Compared to experiences of patients from high SES areas, patients from low SES areas were:
Less than one month to surgery following specialist (AA)
Waited less than 30 minutes to be seen (MA)
Received a copy of letter from ED (ED)
Very good antenatal care (MA)
Up to four weeks to get specialist appointment (AA)
Very good care during labour and birth (MA)
Symptoms did not worsen while waiting (ED)
Never received conflicting information (ED)
Would speak highly of service (MA)
Midwives never gave conflicting information (MA)
Impact of complication was not very serious (AA)
Impact of complication was not very serious (ED)
Always saw doctors wash their hands (AA)
Always saw ED professionals wash their hands
Always saw nurses wash their hands (AA)
Sources: BHI, Emergency Department Patient Survey 2015–16. Adult Admitted Patient Survey 2015, and Maternity Survey 2015.
*Estimate is statistically signiifcantly different from quitile 5 (high SES)
26*
37*
51*
55*
59*
66*
68*
72*
72*
73*
73*
74
42*
49*
52*
38
62
63
70
79
78
87
84
86
85
84
54
61
63
0 10 20 30 40 50 60 70 80 90 100% of patients
Low SES High SES
Low SES group has less positive
result thanhigh SES group
68
Low SES group has more positive
result thanhigh SES group
Figure 5.18 Number and percentage of differences in patient experience between low and high socioeconomic status groups, by aspect of care, NSW, 2015
Figure 5.19 Summary of differences of 10 percentage points or more in patient experience, by selected surveys, NSW, 2015
Source: Bureau of Health Information Emergency Department Patient Survey 2015, Adult Admitted Patient Survey 2015, and Maternity Survey 2015.
Source: Bureau of Health Information Emergency Department Patient Survey 2015, Adult Admitted Patient Survey 2015, and Maternity Survey 2015.
Note: *Estimate is statistically significantly different from Quintile 5 (high SES).

113 Healthcare in Focus 2016 – How does NSW compare? bhi.nsw.gov.au
SustainabilityCaring for the future
114Healthcare in Focus 2016 – How does NSW compare? bhi.nsw.gov.au
Sust
aina
bili
ty
SustainabilityCaring for the future
Sustainability refers to the extent to which healthcare systems function in ways that meet patients’ current health and healthcare needs without compromising the ability to meet needs in the future.1 Sustainable systems adapt to changing circumstances, constraints, opportunities and demands.
There are very few direct measures of sustainability, and so assessment often focuses on utilisation of processes and interventions that have been proven to improve efficiency, impact and productivity.
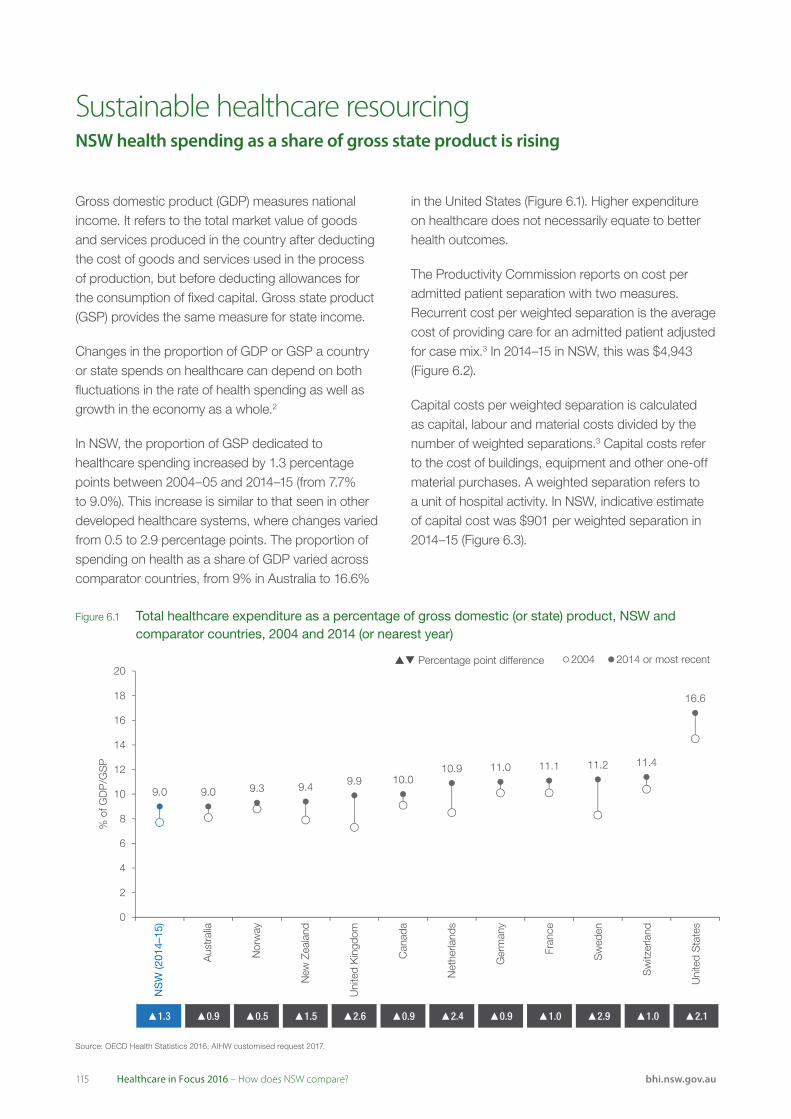
115 Healthcare in Focus 2016 – How does NSW compare? bhi.nsw.gov.au
Gross domestic product (GDP) measures national income. It refers to the total market value of goods and services produced in the country after deducting the cost of goods and services used in the process of production, but before deducting allowances for the consumption of fixed capital. Gross state product (GSP) provides the same measure for state income.
Changes in the proportion of GDP or GSP a country or state spends on healthcare can depend on both fluctuations in the rate of health spending as well as growth in the economy as a whole.2
In NSW, the proportion of GSP dedicated to healthcare spending increased by 1.3 percentage points between 2004–05 and 2014–15 (from 7.7% to 9.0%). This increase is similar to that seen in other developed healthcare systems, where changes varied from 0.5 to 2.9 percentage points. The proportion of spending on health as a share of GDP varied across comparator countries, from 9% in Australia to 16.6%
Sustainable healthcare resourcingNSW health spending as a share of gross state product is rising
in the United States (Figure 6.1). Higher expenditure on healthcare does not necessarily equate to better health outcomes.
The Productivity Commission reports on cost per admitted patient separation with two measures. Recurrent cost per weighted separation is the average cost of providing care for an admitted patient adjusted for case mix.3 In 2014–15 in NSW, this was $4,943 (Figure 6.2).
Capital costs per weighted separation is calculated as capital, labour and material costs divided by the number of weighted separations.3 Capital costs refer to the cost of buildings, equipment and other one-off material purchases. A weighted separation refers to a unit of hospital activity. In NSW, indicative estimate of capital cost was $901 per weighted separation in 2014–15 (Figure 6.3).
▲1.3 ▲0.9 ▲0.5 ▲1.5 ▲2.6 ▲0.9 ▲2.4 ▲0.9 ▲1.0 ▲2.9 ▲1.0 ▲2.1
Source: OECD Health Statistics 2016, AIHW customised request 2017.
Net
herla
nds
Ger
man
y
Fran
ce
Sw
eden
Sw
itzer
land
Uni
ted
Sta
tes
NS
W (2
014–
15)
Aus
tral
ia
Nor
way
New
Zea
land
Uni
ted
Kin
gdom
Can
ada
9.0 9.3 9.4 9.9 10.010.9 11.0 11.1 11.2 11.4
16.6
9.0
0
2
4
6
8
10
12
14
16
18
20
% o
f GD
P/G
SP
2004 2014 or most recent Percentage point difference
Figure 6.1 Total healthcare expenditure as a percentage of gross domestic (or state) product, NSW and comparator countries, 2004 and 2014 (or nearest year)
Source: OECD Health Statistics 2016, AIHW customised request 2017.
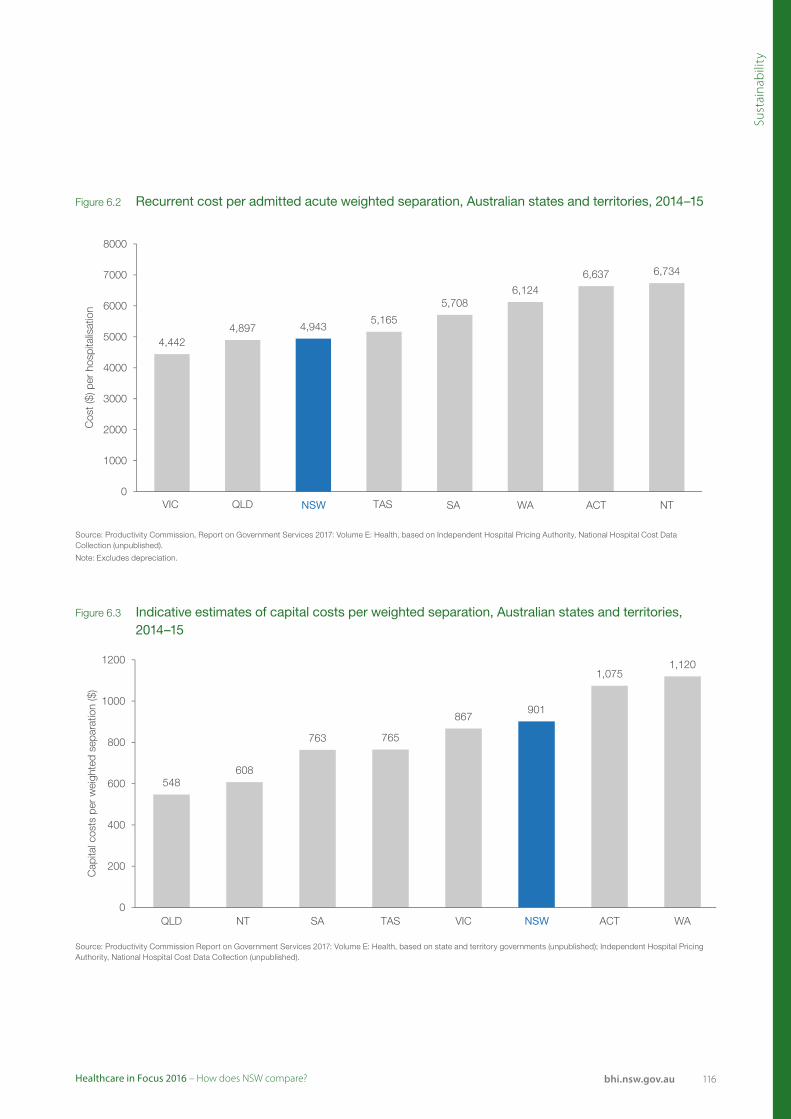
116Healthcare in Focus 2016 – How does NSW compare? bhi.nsw.gov.au
Sust
aina
bili
ty
Source: Productivity Commission, Report on Government Services 2017: Volume E: Health, based on State and Territory governments (unpublished); IHPA, National Hospital Cost Data Collection, (unpublished).
548608
763 765
867
1,0751,120
901
0
200
400
600
800
1000
1200
QLD NT SA TAS VIC ACT WA
Cap
ital c
osts
per
wei
ghte
d se
para
tion
($)
NSW
Source: Productivity Commission, Report on Government Services 2017: Volume E: Health, based on Independent Hospital Pricing Authority, National Hospital Cost Data Collection (unpublished).
4,4424,897
5,165
5,7086,124
6,637 6,734
4,943
0
1000
2000
3000
4000
5000
6000
7000
8000
VIC QLD TAS SA WA ACT NT
Cos
t ($)
per
hos
pita
lisat
ion
NSW
Figure 6.3 Indicative estimates of capital costs per weighted separation, Australian states and territories, 2014–15
Source: Productivity Commission Report on Government Services 2017: Volume E: Health, based on state and territory governments (unpublished); Independent Hospital Pricing Authority, National Hospital Cost Data Collection (unpublished).
Figure 6.2 Recurrent cost per admitted acute weighted separation, Australian states and territories, 2014–15
Source: Productivity Commission, Report on Government Services 2017: Volume E: Health, based on Independent Hospital Pricing Authority, National Hospital Cost Data Collection (unpublished).
Note: Excludes depreciation.
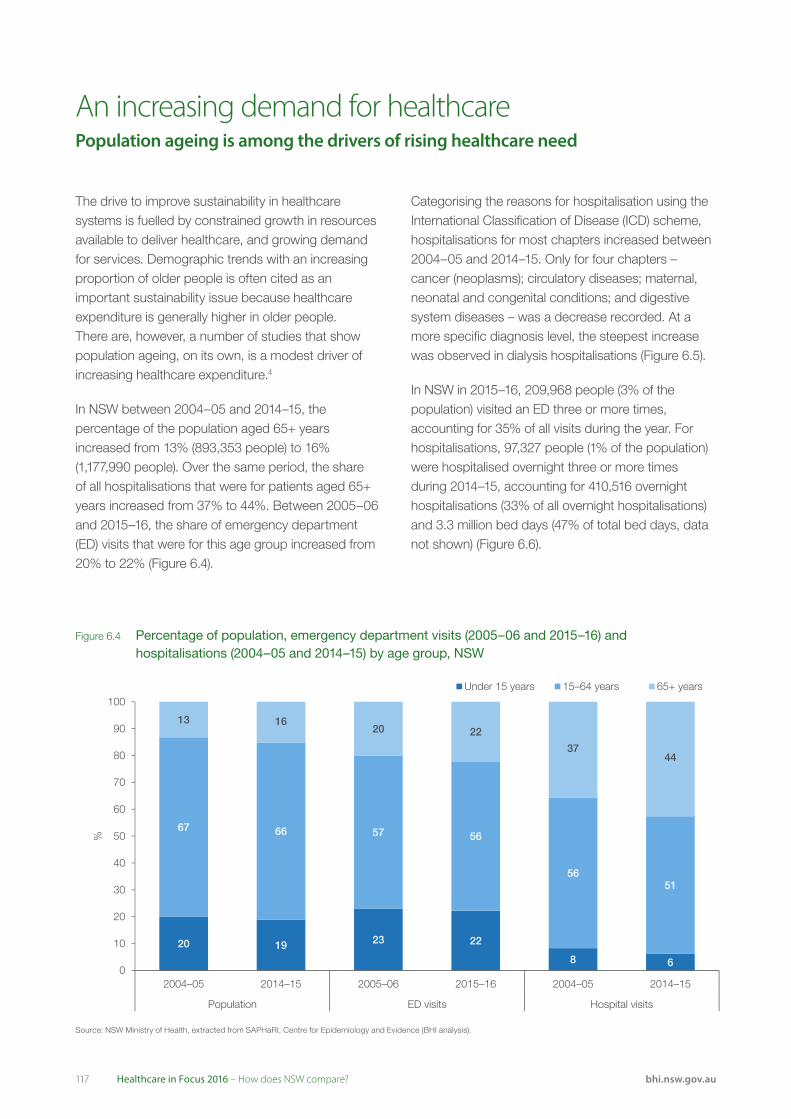
117 Healthcare in Focus 2016 – How does NSW compare? bhi.nsw.gov.au
The drive to improve sustainability in healthcare systems is fuelled by constrained growth in resources available to deliver healthcare, and growing demand for services. Demographic trends with an increasing proportion of older people is often cited as an important sustainability issue because healthcare expenditure is generally higher in older people. There are, however, a number of studies that show population ageing, on its own, is a modest driver of increasing healthcare expenditure.4
In NSW between 2004–05 and 2014–15, the percentage of the population aged 65+ years increased from 13% (893,353 people) to 16% (1,177,990 people). Over the same period, the share of all hospitalisations that were for patients aged 65+ years increased from 37% to 44%. Between 2005–06 and 2015–16, the share of emergency department (ED) visits that were for this age group increased from 20% to 22% (Figure 6.4).
An increasing demand for healthcarePopulation ageing is among the drivers of rising healthcare need
Categorising the reasons for hospitalisation using the International Classification of Disease (ICD) scheme, hospitalisations for most chapters increased between 2004–05 and 2014–15. Only for four chapters – cancer (neoplasms); circulatory diseases; maternal, neonatal and congenital conditions; and digestive system diseases – was a decrease recorded. At a more specific diagnosis level, the steepest increase was observed in dialysis hospitalisations (Figure 6.5).
In NSW in 2015–16, 209,968 people (3% of the population) visited an ED three or more times, accounting for 35% of all visits during the year. For hospitalisations, 97,327 people (1% of the population) were hospitalised overnight three or more times during 2014–15, accounting for 410,516 overnight hospitalisations (33% of all overnight hospitalisations) and 3.3 million bed days (47% of total bed days, data not shown) (Figure 6.6).
20 19 23 22
8 6
67 66 57 56
5651
13 1620 22
3744
0
10
20
30
40
50
60
70
80
90
100
2004–05 2014–15 2005–06 2015–16 2004–05 2014–15
Population ED visits Hospital visits
%
Under 15 years 65+ years15–64 years
Figure 6.4 Percentage of population, emergency department visits (2005–06 and 2015–16) and hospitalisations (2004–05 and 2014–15) by age group, NSW
Source: NSW Ministry of Health, extracted from SAPHaRI, Centre for Epidemiology and Evidence (BHI analysis).
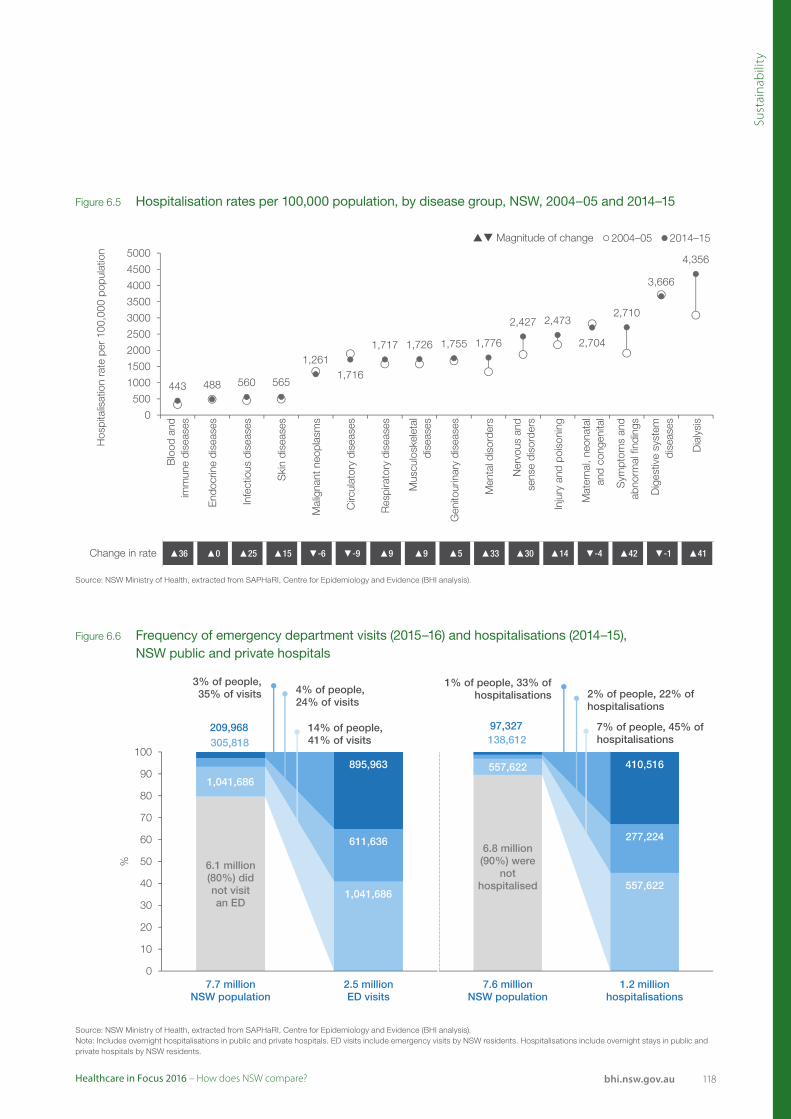
118Healthcare in Focus 2016 – How does NSW compare? bhi.nsw.gov.au
Sust
aina
bili
ty
Change in rate ▲36 ▲0 ▲25 ▲15 ▼-6 ▼-9 ▲9 ▲9 ▲5 ▲33 ▲30 ▲14 ▼-4 ▲42 ▼-1 ▲41
Hos
pita
lisat
ion
rate
per
100
,000
pop
ulat
ion
Mat
erna
l, ne
onat
alan
d co
ngen
ital
Circ
ulat
ory
dise
ases
Res
pira
tory
dis
ease
s
Mus
culo
skel
etal
dise
ases
Source: NSW Combined Admitted Patient Epidemiology Data and ABS population estimates (SAPHaRI). Centre for Epidemiology and Evidence, NSW Ministry of Health.
Blo
od a
ndim
mun
e di
seas
es
End
ocrin
e di
seas
es
Infe
ctio
us d
isea
ses
Ski
n di
seas
es
Mal
igna
nt n
eopl
asm
s
Sym
ptom
s an
dab
norm
al fi
ndin
gs
Dig
estiv
e sy
stem
dise
ases
Dia
lysi
s
Gen
itour
inar
y di
seas
es
Men
tal d
isor
ders
Ner
vous
and
sens
e di
sord
ers
Inju
ry a
nd p
oiso
ning
443 488 560 565
1,2611,716
1,717 1,726 1,755 1,776
2,427 2,473
2,704
2,710
3,666
4,356
0
500
1000
1500
2000
2500
3000
3500
4000
4500
50002004–05 2014–15 Magnitude of change
Sources: NSW Ministry of Health, extracted from SAPHaRI, Centre for Epidemiology and Evidence (BHI analysis). Note: Includes overnight hospitalisations in public and private hospitals.Note: ED visits include emergency visits by NSW residents. Hospitalisations include overnight stays in public and private hospitals by NSW residents.
6.1 million (80%) didnot visitan ED
1,041,686
1,041,686
305,818
611,636
209,968
895,963
0
10
20
30
40
50
60
70
80
90
100
7.7 millionNSW population
2.5 millionED visits
%
0 ED visits 1 ED visit
2 ED visits 3+ ED visits
3% of people, 35% of visits 4% of people,
24% of visits
14% of people, 41% of visits
6.8 million (90%) were
nothospitalised
557,622
557,622
138,612
277,224
97,327
410,516
7.6 millionNSW population
1.2 millionhospitalisations
0 hospitalisations1 hospitalisation2 hospitalisations
1% of people, 33% of hospitalisations 2% of people, 22% of
hospitalisations
7% of people, 45% of hospitalisations
Figure 6.5 Hospitalisation rates per 100,000 population, by disease group, NSW, 2004–05 and 2014–15
Figure 6.6 Frequency of emergency department visits (2015–16) and hospitalisations (2014–15), NSW public and private hospitals
Source: NSW Ministry of Health, extracted from SAPHaRI, Centre for Epidemiology and Evidence (BHI analysis).
Source: NSW Ministry of Health, extracted from SAPHaRI, Centre for Epidemiology and Evidence (BHI analysis). Note: Includes overnight hospitalisations in public and private hospitals. ED visits include emergency visits by NSW residents. Hospitalisations include overnight stays in public and private hospitals by NSW residents.
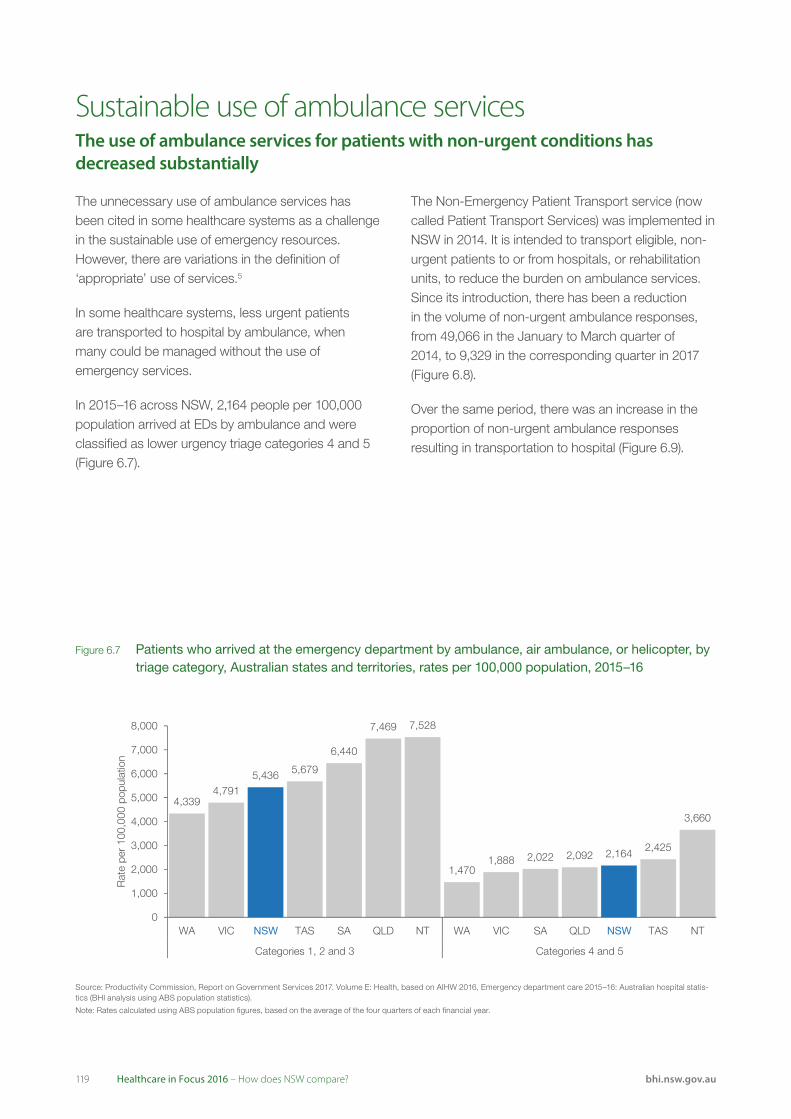
119 Healthcare in Focus 2016 – How does NSW compare? bhi.nsw.gov.au
The unnecessary use of ambulance services has been cited in some healthcare systems as a challenge in the sustainable use of emergency resources. However, there are variations in the definition of ‘appropriate’ use of services.5
In some healthcare systems, less urgent patients are transported to hospital by ambulance, when many could be managed without the use of emergency services.
In 2015–16 across NSW, 2,164 people per 100,000 population arrived at EDs by ambulance and were classified as lower urgency triage categories 4 and 5 (Figure 6.7).
Sustainable use of ambulance servicesThe use of ambulance services for patients with non-urgent conditions has decreased substantially
The Non-Emergency Patient Transport service (now called Patient Transport Services) was implemented in NSW in 2014. It is intended to transport eligible, non-urgent patients to or from hospitals, or rehabilitation units, to reduce the burden on ambulance services. Since its introduction, there has been a reduction in the volume of non-urgent ambulance responses, from 49,066 in the January to March quarter of 2014, to 9,329 in the corresponding quarter in 2017 (Figure 6.8).
Over the same period, there was an increase in the proportion of non-urgent ambulance responses resulting in transportation to hospital (Figure 6.9).
Note: Rates calculated using ABS population figures, based on the average of the four quarters of each financial year.
Source: Productivity Commission, Report on Government Services 2017. Volume E: Health, based on AIHW 2016, Emergency department care 2015–16: Australian hospital statistics (BHI analysis using ABS population statistics).
4,3394,791
5,679
6,440
7,469 7,528
1,4701,888 2,022 2,092
2,425
3,660
5,436
2,164
0
1,000
2,000
3,000
4,000
5,000
6,000
7,000
8,000
WA VIC QLD NT WA VIC SA TAS NT
Categories 4 and 5
Rat
e pe
r 10
0,00
0 po
pula
tion
NSW TAS SA
Categories 1, 2 and 3
QLD NSW
Figure 6.7 Patients who arrived at the emergency department by ambulance, air ambulance, or helicopter, by triage category, Australian states and territories, rates per 100,000 population, 2015–16
Source: Productivity Commission, Report on Government Services 2017. Volume E: Health, based on AIHW 2016, Emergency department care 2015–16: Australian hospital statis-tics (BHI analysis using ABS population statistics).
Note: Rates calculated using ABS population figures, based on the average of the four quarters of each financial year.
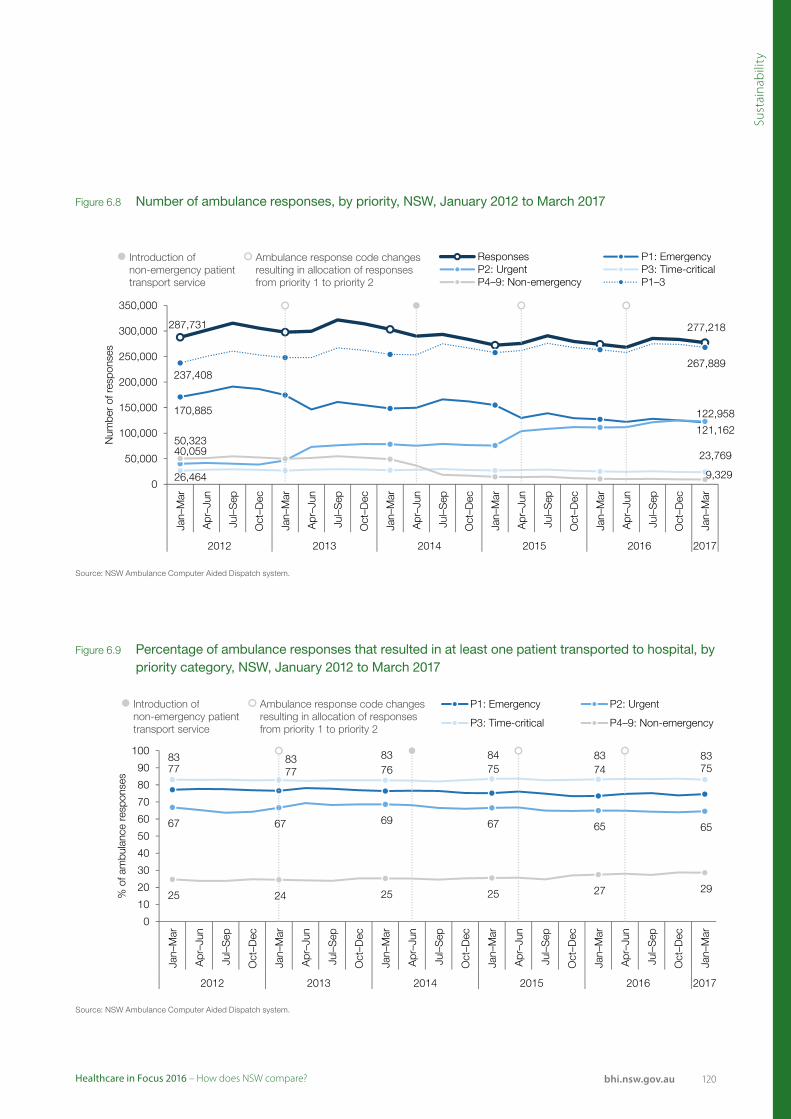
120Healthcare in Focus 2016 – How does NSW compare? bhi.nsw.gov.au
Sust
aina
bili
ty
Source: NSW Ambulance Computer Aided Dispatch system.
287,731 277,218
170,885
121,162
40,059
122,958
26,464
23,769 50,323
9,329
237,408 267,889
0
50,000
100,000
150,000
200,000
250,000
300,000
350,000
Jan–
Mar
Apr
–Jun
Jul–
Sep
Oct
–Dec
Jan–
Mar
Apr
–Jun
Jul–
Sep
Oct
–Dec
Jan–
Mar
Apr
–Jun
Jul–
Sep
Oct
–Dec
Jan–
Mar
Apr
–Jun
Jul–
Sep
Oct
–Dec
Jan–
Mar
Apr
–Jun
Jul–
Sep
Oct
–Dec
Jan–
Mar
2012 2013 2014 2015 2016 2017
Num
ber
of r
espo
nses
Responses P1: EmergencyP2: Urgent P3: Time-criticalP4–9: Non-emergency P1–3
Introduction ofnon-emergency patienttransport service
Ambulance response code changesresulting in allocation of responsesfrom priority 1 to priority 2
Source:NSW Ambulance Computer Aided Dispatch system.
77 77 76 75 74 75
67 67 69 67 65 65
83 83 83 84 83 83
25 24 25 25 27 29
0
10
20
30
40
50
60
70
80
90
100
Jan–
Mar
Apr
–Jun
Jul–
Sep
Oct
–Dec
Jan–
Mar
Apr
–Jun
Jul–
Sep
Oct
–Dec
Jan–
Mar
Apr
–Jun
Jul–
Sep
Oct
–Dec
Jan–
Mar
Apr
–Jun
Jul–
Sep
Oct
–Dec
Jan–
Mar
Apr
–Jun
Jul–
Sep
Oct
–Dec
Jan–
Mar
2012 2013 2014 2015 2016 2017
% o
f am
bula
nce
resp
onse
s
P1: Emergency P2: Urgent
P3: Time-critical P4–9: Non-emergency
Introduction ofnon-emergency patienttransport service
Ambulance response code changesresulting in allocation of responsesfrom priority 1 to priority 2
Figure 6.8 Number of ambulance responses, by priority, NSW, January 2012 to March 2017
Figure 6.9 Percentage of ambulance responses that resulted in at least one patient transported to hospital, by priority category, NSW, January 2012 to March 2017
Source: NSW Ambulance Computer Aided Dispatch system.
Source: NSW Ambulance Computer Aided Dispatch system.
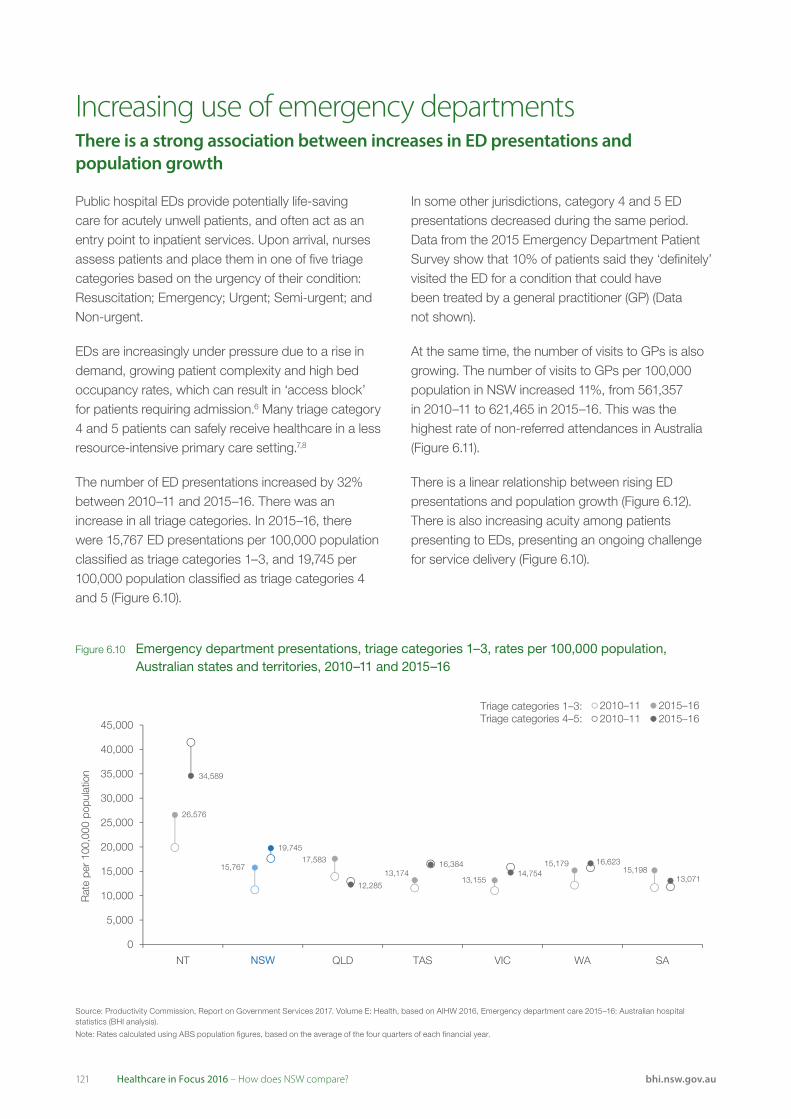
121 Healthcare in Focus 2016 – How does NSW compare? bhi.nsw.gov.au
Public hospital EDs provide potentially life-saving care for acutely unwell patients, and often act as an entry point to inpatient services. Upon arrival, nurses assess patients and place them in one of five triage categories based on the urgency of their condition: Resuscitation; Emergency; Urgent; Semi-urgent; and Non-urgent.
EDs are increasingly under pressure due to a rise in demand, growing patient complexity and high bed occupancy rates, which can result in ‘access block’ for patients requiring admission.6 Many triage category 4 and 5 patients can safely receive healthcare in a less resource-intensive primary care setting.7,8
The number of ED presentations increased by 32% between 2010–11 and 2015–16. There was an increase in all triage categories. In 2015–16, there were 15,767 ED presentations per 100,000 population classified as triage categories 1–3, and 19,745 per 100,000 population classified as triage categories 4 and 5 (Figure 6.10).
Increasing use of emergency departments There is a strong association between increases in ED presentations and population growth
In some other jurisdictions, category 4 and 5 ED presentations decreased during the same period. Data from the 2015 Emergency Department Patient Survey show that 10% of patients said they ‘definitely’ visited the ED for a condition that could have been treated by a general practitioner (GP) (Data not shown).
At the same time, the number of visits to GPs is also growing. The number of visits to GPs per 100,000 population in NSW increased 11%, from 561,357 in 2010–11 to 621,465 in 2015–16. This was the highest rate of non-referred attendances in Australia (Figure 6.11).
There is a linear relationship between rising ED presentations and population growth (Figure 6.12). There is also increasing acuity among patients presenting to EDs, presenting an ongoing challenge for service delivery (Figure 6.10).
Note: Rates calculated using ABS population figures, based on the average of the four quarters of each financial year.
Source: Productivity Commission, Report on Government Services 2017. Volume E: Health, based on AIHW 2016, Emergency department care 2015–16: Australian hospital statistics (BHI analysis).
26,576
15,76717,583
13,17413,155
15,17915,198
34,589
19,745
12,285
16,38414,754
16,623
13,071
NT NSW QLD TAS VIC WA SA
0
5,000
10,000
15,000
20,000
25,000
30,000
35,000
40,000
45,000
Rat
e pe
r 10
0,00
0 po
pula
tion
Triage categories 1–3:Triage categories 4–5:
2010–11 2015–162010–11 2015–16
Figure 6.10 Emergency department presentations, triage categories 1–3, rates per 100,000 population, Australian states and territories, 2010–11 and 2015–16
Source: Productivity Commission, Report on Government Services 2017. Volume E: Health, based on AIHW 2016, Emergency department care 2015–16: Australian hospital statistics (BHI analysis).
Note: Rates calculated using ABS population figures, based on the average of the four quarters of each financial year.
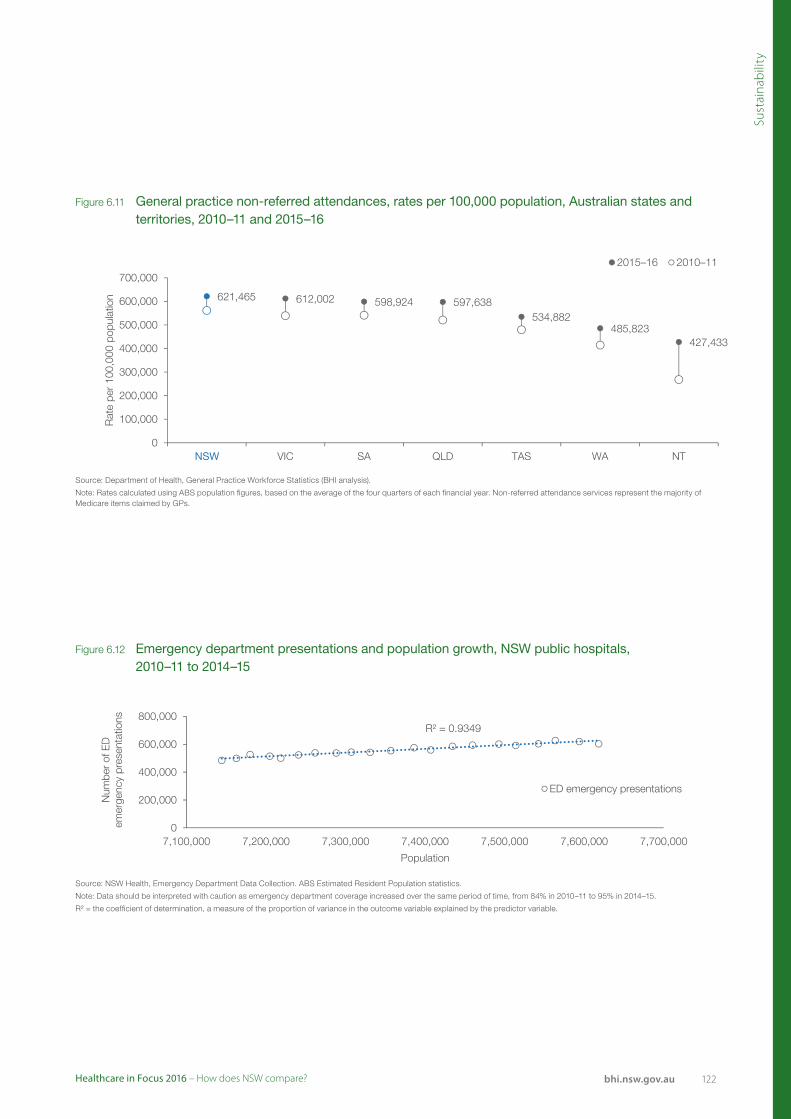
122Healthcare in Focus 2016 – How does NSW compare? bhi.nsw.gov.au
Sust
aina
bili
ty
Source: Department of Health, General Practice Workforce Statistics (BHI analysis).
Note: Rates calculated using ABS population figures, based on the average of the four quarters of each financial year. Non-referred attendance services represent the majority of Medicare
items claimed by GPs.
621,465 612,002 598,924 597,638534,882
485,823427,433
0
100,000
200,000
300,000
400,000
500,000
600,000
700,000
VIC SA QLD TAS WA NT
Rat
e pe
r 10
0,00
0 po
pula
tion
2015–16 2010–11
NSW
Source: NSW Health, Emergency Department Data Collection. ABS Estimated Resident Population statistics.
Note: Data should be interpreted with caution as emergency department coverage increased over the same period of time, from 84% in 2010–11 to 95% in 2014–15.
R² = the coefficient of determination, a measure of the proportion of variance in the outcome variable explained by the predictor variable (0.93 represents a strong linear relationship).
R² = 0.9349
0
200,000
400,000
600,000
800,000
7,100,000 7,200,000 7,300,000 7,400,000 7,500,000 7,600,000 7,700,000
Num
ber
of E
D
emer
genc
y pr
esen
tatio
ns
Population
ED emergency presentations
Figure 6.11 General practice non-referred attendances, rates per 100,000 population, Australian states and territories, 2010–11 and 2015–16
Figure 6.12 Emergency department presentations and population growth, NSW public hospitals, 2010–11 to 2014–15
Source: Department of Health, General Practice Workforce Statistics (BHI analysis).
Note: Rates calculated using ABS population figures, based on the average of the four quarters of each financial year. Non-referred attendance services represent the majority of Medicare items claimed by GPs.
Source: NSW Health, Emergency Department Data Collection. ABS Estimated Resident Population statistics.
Note: Data should be interpreted with caution as emergency department coverage increased over the same period of time, from 84% in 2010–11 to 95% in 2014–15.
R² = the coefficient of determination, a measure of the proportion of variance in the outcome variable explained by the predictor variable.
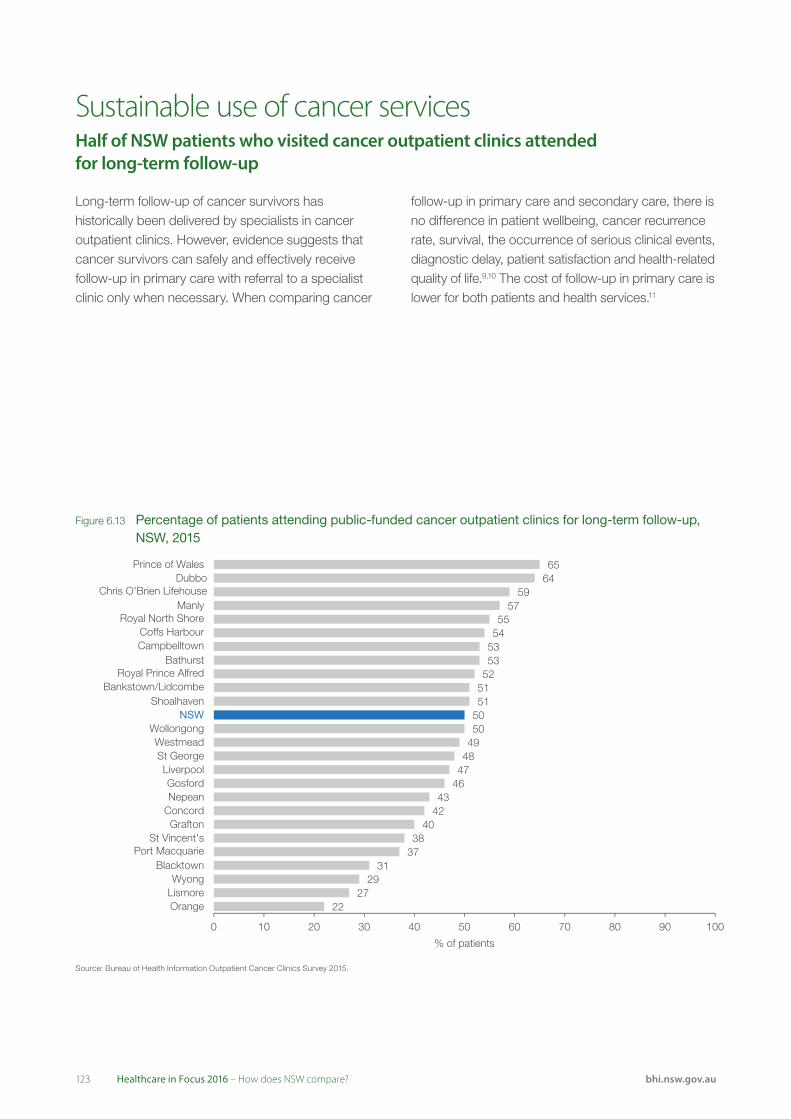
123 Healthcare in Focus 2016 – How does NSW compare? bhi.nsw.gov.au
Long-term follow-up of cancer survivors has historically been delivered by specialists in cancer outpatient clinics. However, evidence suggests that cancer survivors can safely and effectively receive follow-up in primary care with referral to a specialist clinic only when necessary. When comparing cancer
Sustainable use of cancer servicesHalf of NSW patients who visited cancer outpatient clinics attended for long-term follow-up
follow-up in primary care and secondary care, there is no difference in patient wellbeing, cancer recurrence rate, survival, the occurrence of serious clinical events, diagnostic delay, patient satisfaction and health-related quality of life.9,10 The cost of follow-up in primary care is lower for both patients and health services.11
6564
5957
5554
5353
525151
5049
4847
4643
4240
3837
3129
2722
50
0 10 20 30 40 50 60 70 80 90 100
% of patients
Prince of WalesDubbo
Chris O'Brien Lifehouse Manly
Royal North Shore Coffs Harbour Campbelltown
Bathurst Royal Prince Alfred
Bankstown/Lidcombe Shoalhaven
NSWWollongongWestmeadSt GeorgeLiverpoolGosfordNepean
ConcordGrafton
St Vincent's Port Macquarie
BlacktownWyong
LismoreOrange
Figure 6.13 Percentage of patients attending public-funded cancer outpatient clinics for long-term follow-up, NSW, 2015
Source: Bureau of Health Information Outpatient Cancer Clinics Survey 2015.
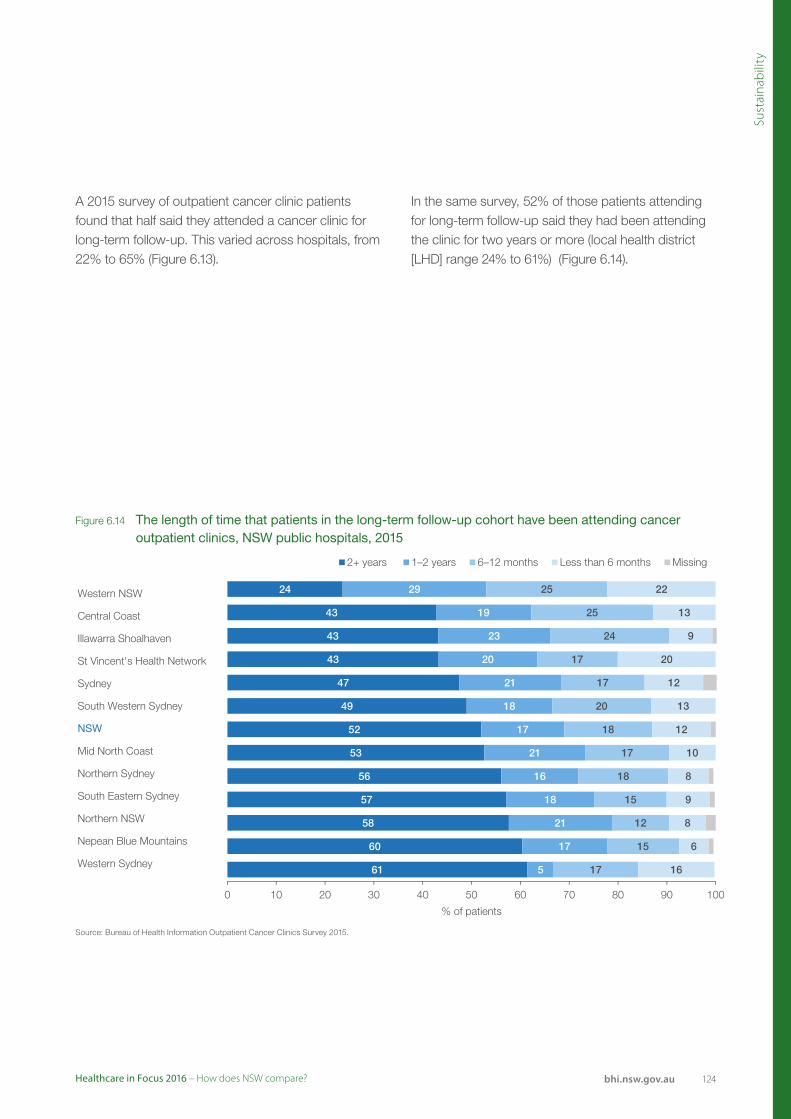
124Healthcare in Focus 2016 – How does NSW compare? bhi.nsw.gov.au
Sust
aina
bili
ty
24
43
43
43
47
49
52
53
56
57
58
60
61
29
19
23
20
21
18
17
21
16
18
21
17
5
25
25
24
17
17
20
18
17
18
15
12
15
17
22
13
9
20
12
13
12
10
8
9
8
6
16
0 10 20 30 40 50 60 70 80 90 100
% of patients
2+ years 1–2 years 6–12 months Less than 6 months Missing
Western NSW
Central Coast
Illawarra Shoalhaven
St Vincent's Health Network
Sydney
South Western Sydney
NSW
Mid North Coast
Northern Sydney
South Eastern Sydney
Northern NSW
Nepean Blue Mountains
Western Sydney
Figure 6.14 The length of time that patients in the long-term follow-up cohort have been attending cancer outpatient clinics, NSW public hospitals, 2015
Source: Bureau of Health Information Outpatient Cancer Clinics Survey 2015.
A 2015 survey of outpatient cancer clinic patients found that half said they attended a cancer clinic for long-term follow-up. This varied across hospitals, from 22% to 65% (Figure 6.13).
In the same survey, 52% of those patients attending for long-term follow-up said they had been attending the clinic for two years or more (local health district [LHD] range 24% to 61%) (Figure 6.14).
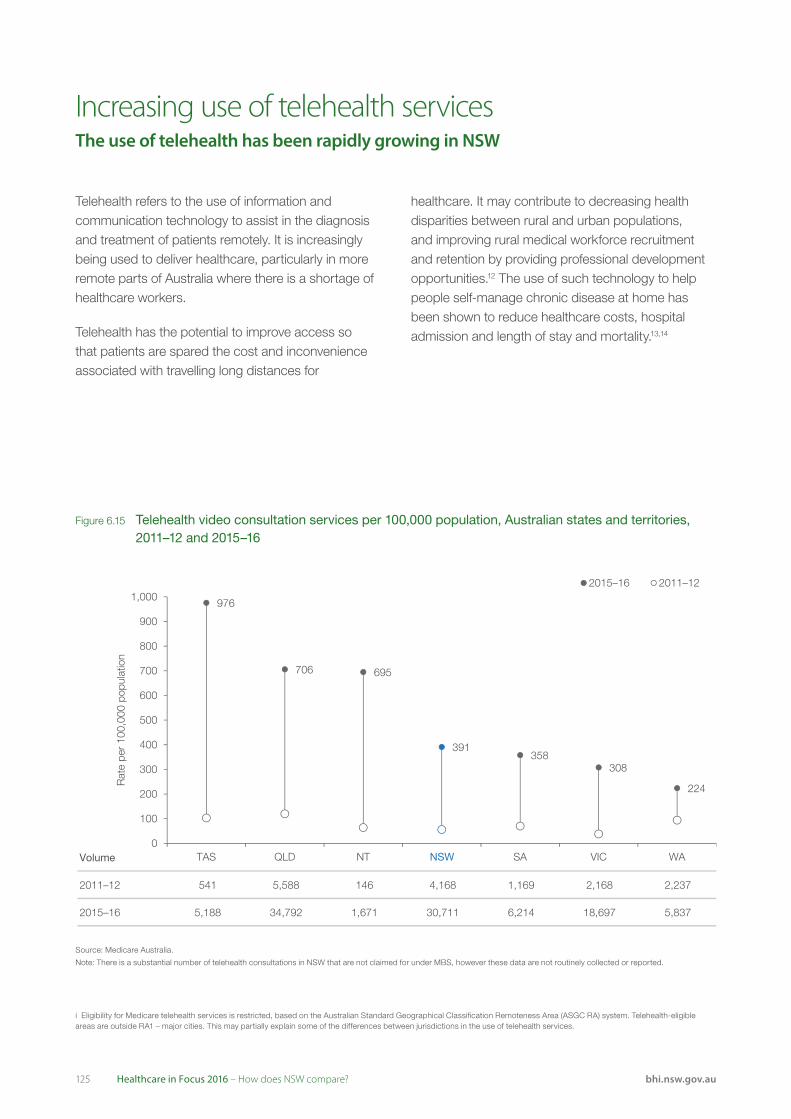
125 Healthcare in Focus 2016 – How does NSW compare? bhi.nsw.gov.au
Telehealth refers to the use of information and communication technology to assist in the diagnosis and treatment of patients remotely. It is increasingly being used to deliver healthcare, particularly in more remote parts of Australia where there is a shortage of healthcare workers.
Telehealth has the potential to improve access so that patients are spared the cost and inconvenience associated with travelling long distances for
Increasing use of telehealth services The use of telehealth has been rapidly growing in NSW
healthcare. It may contribute to decreasing health disparities between rural and urban populations, and improving rural medical workforce recruitment and retention by providing professional development opportunities.12 The use of such technology to help people self-manage chronic disease at home has been shown to reduce healthcare costs, hospital admission and length of stay and mortality.13,14
Volume
2011–12 541 5,588 146 4,168 1,169 2,168 2,237
2015–16 5,188 34,792 1,671 30,711 6,214 18,697 5,837
Source: Medicare Australia.
391
976
706 695
358308
224
0
100
200
300
400
500
600
700
800
900
1,000
TAS QLD NT SA VIC WA
Rat
e pe
r 10
0,00
0 po
pula
tion
2015–16 2011–12
NSW
Figure 6.15 Telehealth video consultation services per 100,000 population, Australian states and territories, 2011–12 and 2015–16
i Eligibility for Medicare telehealth services is restricted, based on the Australian Standard Geographical Classification Remoteness Area (ASGC RA) system. Telehealth-eligible areas are outside RA1 – major cities. This may partially explain some of the differences between jurisdictions in the use of telehealth services.
Source: Medicare Australia.
Note: There is a substantial number of telehealth consultations in NSW that are not claimed for under MBS, however these data are not routinely collected or reported.
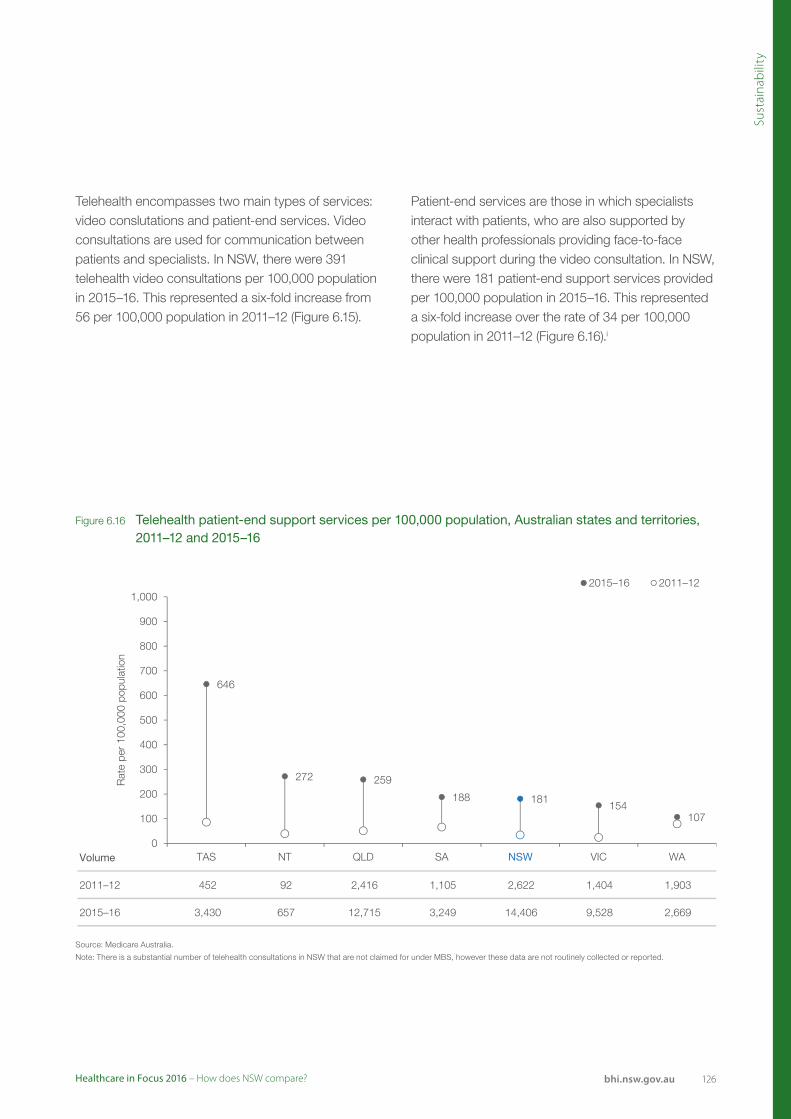
126Healthcare in Focus 2016 – How does NSW compare? bhi.nsw.gov.au
Sust
aina
bili
ty
Volume
2011–12 452 92 2,416 1,105 2,622 1,404 1,903
2015–16 3,430 657 12,715 3,249 14,406 9,528 2,669
Source: Medicare Australia.
181
646
272 259
188154
107
0
100
200
300
400
500
600
700
800
900
1,000
TAS NT QLD SA VIC WA
Rat
e pe
r 10
0,00
0 po
pula
tion
2015–16 2011–12
NSW
Figure 6.16 Telehealth patient-end support services per 100,000 population, Australian states and territories, 2011–12 and 2015–16
Source: Medicare Australia.
Note: There is a substantial number of telehealth consultations in NSW that are not claimed for under MBS, however these data are not routinely collected or reported.
Telehealth encompasses two main types of services: video conslutations and patient-end services. Video consultations are used for communication between patients and specialists. In NSW, there were 391 telehealth video consultations per 100,000 population in 2015–16. This represented a six-fold increase from 56 per 100,000 population in 2011–12 (Figure 6.15).
Patient-end services are those in which specialists interact with patients, who are also supported by other health professionals providing face-to-face clinical support during the video consultation. In NSW, there were 181 patient-end support services provided per 100,000 population in 2015–16. This represented a six-fold increase over the rate of 34 per 100,000 population in 2011–12 (Figure 6.16).i
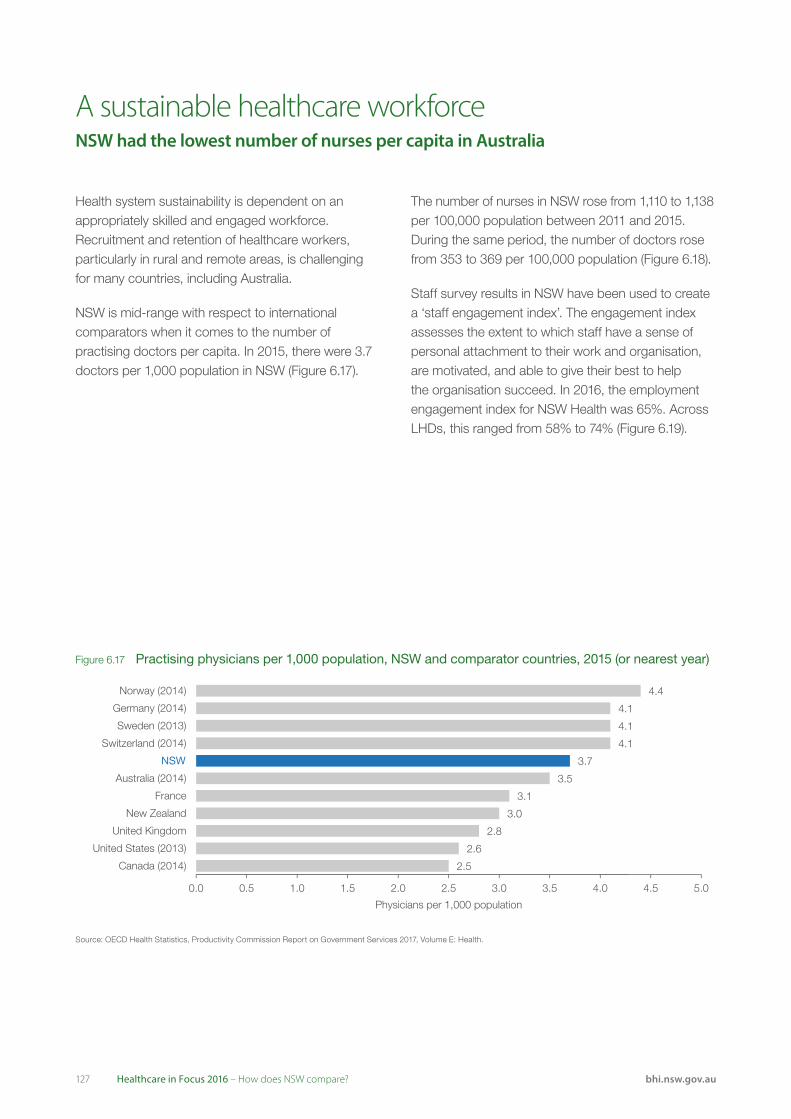
127 Healthcare in Focus 2016 – How does NSW compare? bhi.nsw.gov.au
Health system sustainability is dependent on an appropriately skilled and engaged workforce. Recruitment and retention of healthcare workers, particularly in rural and remote areas, is challenging for many countries, including Australia.
NSW is mid-range with respect to international comparators when it comes to the number of practising doctors per capita. In 2015, there were 3.7 doctors per 1,000 population in NSW (Figure 6.17).
A sustainable healthcare workforceNSW had the lowest number of nurses per capita in Australia
The number of nurses in NSW rose from 1,110 to 1,138 per 100,000 population between 2011 and 2015. During the same period, the number of doctors rose from 353 to 369 per 100,000 population (Figure 6.18).
Staff survey results in NSW have been used to create a ‘staff engagement index’. The engagement index assesses the extent to which staff have a sense of personal attachment to their work and organisation, are motivated, and able to give their best to help the organisation succeed. In 2016, the employment engagement index for NSW Health was 65%. Across LHDs, this ranged from 58% to 74% (Figure 6.19).
Source: OECD Health Statistics, Productivity Commission Report on Government Services 2017, Volume E: Health.
4.4
4.1
4.1
4.1
3.5
3.1
3.0
2.8
2.6
2.5
3.7
0.0 0.5 1.0 1.5 2.0 2.5 3.0 3.5 4.0 4.5 5.0
Physicians per 1,000 population
Norway (2014)
Germany ( 2014)
Sweden ( 2013)
Switzerland ( 2014)
NSW
Australia (2014)
France
New Zealand
United Kingdom
United States (2013)
Canada (2014)
Figure 6.17 Practising physicians per 1,000 population, NSW and comparator countries, 2015 (or nearest year)
Source: OECD Health Statistics, Productivity Commission Report on Government Services 2017, Volume E: Health.
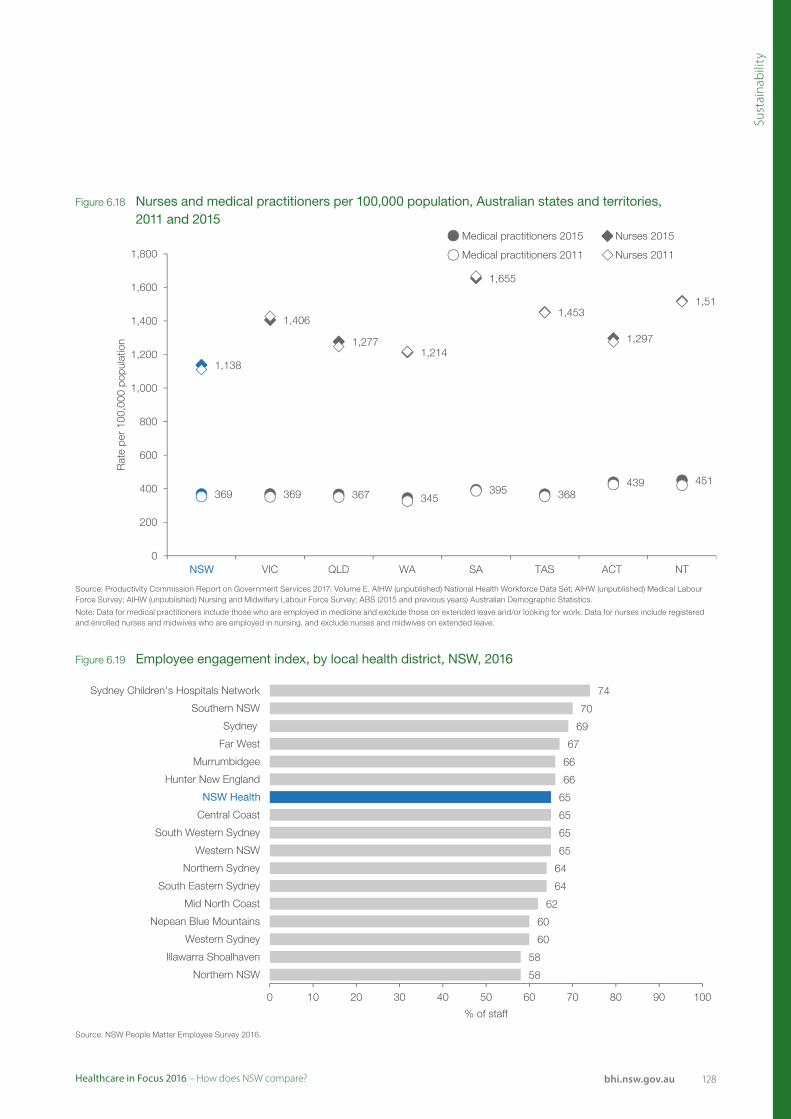
128Healthcare in Focus 2016 – How does NSW compare? bhi.nsw.gov.au
Sust
aina
bili
ty
Medical practitioners 2015
Medical practitioners 2011
Nurses 2015
1,800 Nurses 2011
1,6551,600
1,5191,453
1,400 1,406
1,277 1,297
1,200 1,2141,138
1,000
800
600
439 451400 369 369 367 395
345 368
200
0NSW VIC QLD WA SA TAS ACT NT
Source: Productivity Commission Report on Government Services 2017: Volume E. AIHW (unpublished) National Health Workforce Data Set; AIHW (unpublished) Medical Labour Force Survey; AIHW (unpublished) Nursing and Midwifery Labour Force Survey; ABS (2015 and previous years) Australian Demographic Statistics.
Rat
e pe
r 10
0,00
0 po
pula
tion
Source: NSW People Matter Employee Survey 2016.
74
70
69
67
66
66
65
65
65
65
64
64
62
60
60
58
58
0 10 20 30 40 50 60 70 80 90 100
Sydney Children's Hospitals Network
Southern NSW
Sydney
% of staff
Far West
Murrumbidgee
Hunter New England
NSW Health
Central Coast
South Western Sydney
Western NSW
Northern Sydney
South Eastern Sydney
Mid North Coast
Nepean Blue Mountains
Western Sydney
Illawarra Shoalhaven
Northern NSW
Figure 6.18 Nurses and medical practitioners per 100,000 population, Australian states and territories, 2011 and 2015
Figure 6.19 Employee engagement index, by local health district, NSW, 2016
Source: Productivity Commission Report on Government Services 2017: Volume E. AIHW (unpublished) National Health Workforce Data Set; AIHW (unpublished) Medical Labour Force Survey; AIHW (unpublished) Nursing and Midwifery Labour Force Survey; ABS (2015 and previous years) Australian Demographic Statistics.
Note: Data for medical practitioners include those who are employed in medicine and exclude those on extended leave and/or looking for work. Data for nurses include registered and enrolled nurses and midwives who are employed in nursing, and exclude nurses and midwives on extended leave.
Source: NSW People Matter Employee Survey 2016.

129 Healthcare in Focus 2016 – How does NSW compare? bhi.nsw.gov.au
130Healthcare in Focus 2016 – How does NSW compare? bhi.nsw.gov.au
Appendices
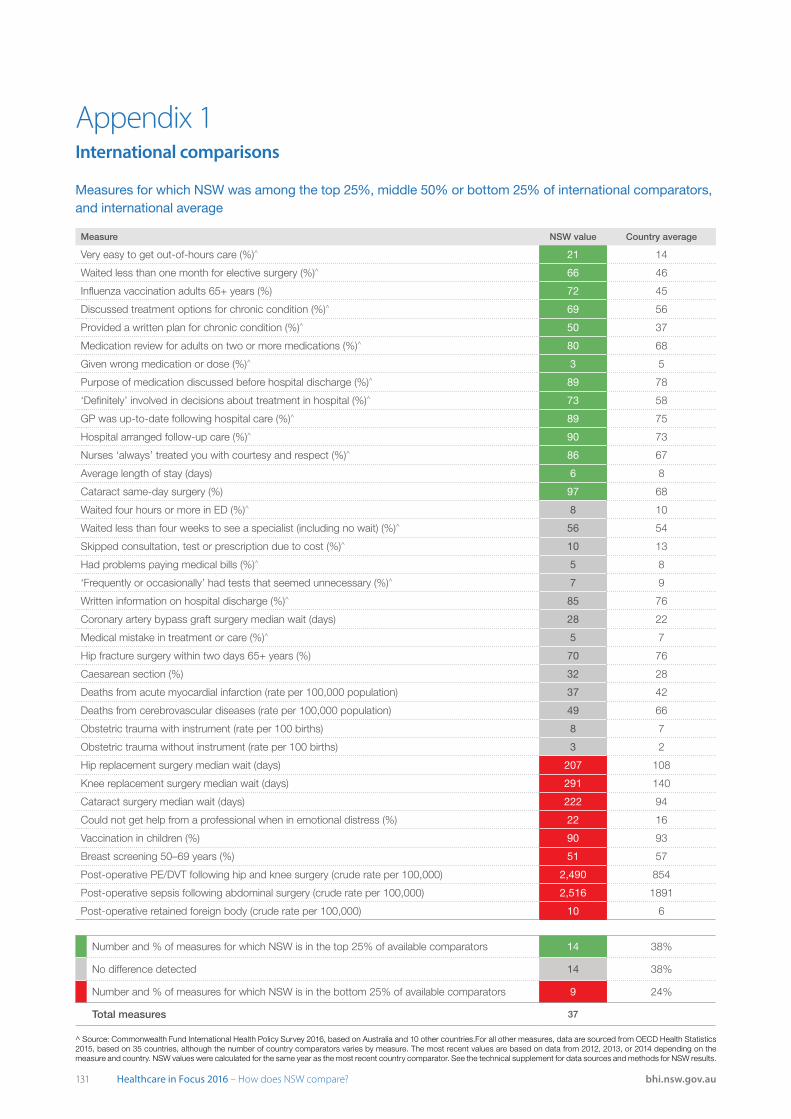
131 Healthcare in Focus 2016 – How does NSW compare? bhi.nsw.gov.au
Appendix 1International comparisons
Measures for which NSW was among the top 25%, middle 50% or bottom 25% of international comparators, and international average
Measure NSW value Country average
Very easy to get out-of-hours care (%)^ 21 14
Waited less than one month for elective surgery (%)^ 66 46
Influenza vaccination adults 65+ years (%) 72 45
Discussed treatment options for chronic condition (%)^ 69 56
Provided a written plan for chronic condition (%)^ 50 37
Medication review for adults on two or more medications (%)^ 80 68
Given wrong medication or dose (%)^ 3 5
Purpose of medication discussed before hospital discharge (%)^ 89 78
‘Definitely’ involved in decisions about treatment in hospital (%)^ 73 58
GP was up-to-date following hospital care (%)^ 89 75
Hospital arranged follow-up care (%)^ 90 73
Nurses ‘always’ treated you with courtesy and respect (%)^ 86 67
Average length of stay (days) 6 8
Cataract same-day surgery (%) 97 68
Waited four hours or more in ED (%)^ 8 10
Waited less than four weeks to see a specialist (including no wait) (%)^ 56 54
Skipped consultation, test or prescription due to cost (%)^ 10 13
Had problems paying medical bills (%)^ 5 8
‘Frequently or occasionally’ had tests that seemed unnecessary (%)^ 7 9
Written information on hospital discharge (%)^ 85 76
Coronary artery bypass graft surgery median wait (days) 28 22
Medical mistake in treatment or care (%)^ 5 7
Hip fracture surgery within two days 65+ years (%) 70 76
Caesarean section (%) 32 28
Deaths from acute myocardial infarction (rate per 100,000 population) 37 42
Deaths from cerebrovascular diseases (rate per 100,000 population) 49 66
Obstetric trauma with instrument (rate per 100 births) 8 7
Obstetric trauma without instrument (rate per 100 births) 3 2
Hip replacement surgery median wait (days) 207 108
Knee replacement surgery median wait (days) 291 140
Cataract surgery median wait (days) 222 94
Could not get help from a professional when in emotional distress (%) 22 16
Vaccination in children (%) 90 93
Breast screening 50–69 years (%) 51 57
Post-operative PE/DVT following hip and knee surgery (crude rate per 100,000) 2,490 854
Post-operative sepsis following abdominal surgery (crude rate per 100,000) 2,516 1891
Post-operative retained foreign body (crude rate per 100,000) 10 6
Number and % of measures for which NSW is in the top 25% of available comparators 14 38%
No difference detected 14 38%
Number and % of measures for which NSW is in the bottom 25% of available comparators 9 24%
Total measures 37
^ Source: Commonwealth Fund International Health Policy Survey 2016, based on Australia and 10 other countries.For all other measures, data are sourced from OECD Health Statistics 2015, based on 35 countries, although the number of country comparators varies by measure. The most recent values are based on data from 2012, 2013, or 2014 depending on the measure and country. NSW values were calculated for the same year as the most recent country comparator. See the technical supplement for data sources and methods for NSW results.

133 Healthcare in Focus 2016 – How does NSW compare? bhi.nsw.gov.au
134Healthcare in Focus 2016 – How does NSW compare? bhi.nsw.gov.au
References
135 Healthcare in Focus 2016 – How does NSW compare? bhi.nsw.gov.au
Setting the Scene
1. Mackenbach JP, Stirbu I, Roskam AJR, Schaap MM, Menvielle G, Leinsalu M, Kunst AE, for the European Union Working Group on Socioeconomic Inequalities in Health. Socioeconomic Inequalities in Health in 22 European Countries. N Engl J Med 2008; 358:2468–2481.
2. Singh GK, Siahpush M. Widening socioeconomic inequalities in US life expectancy, 1980–2000. Int J Epidemiol 2006; 35(4): 969–979.
3. The Organisation for Economic Co-operation and Development. OECD Health Statistics 2017 [online] [cited 4 July 2017]. Available from: http://www.oecd.org/els/health-systems/health-data.htm .
4. The Commonwealth Fund. Mirror, Mirror on the Wall, 2014 Update: How the U.S. Health Care System Compares Internationally [online] [cited 21 April 2016]. Available from: http://www.commonwealthfund.org/publications/fundreports/2014/jun/mirror-mirror.
5. The Health Foundation and The Nuffield Trust. QualityWatch [online] [cited 4 July 2017]. Available from: http://www.qualitywatch.org.uk/.
6. Papanicolas I, Smith P C. Health system performance comparison: an agenda for policy information and research. Maidenhead: Open University Press, 2013.
7. Canadian Institute for Health Information. Performance Measurement Framework for the Canadian Health System. Toronto: CIHI, 2013.
8. Veillard J, Garcia-Armesto S, Kadandale S, Klazinga N. International health system comparisons: from measurement challenge to management tool. In Smith P, Mossialos E, Papanicolas I, Leatherman S, eds. Performance measurement for health system improvement: Experiences, challenges and prospects. Cambridge: Cambridge University Press, 2009.
9. Bureau of Health Information. Healthcare in Focus 2013: Spotlight on Measurement. Sydney: BHI, 2014.
Accessibility
1. Levesque JF, Harris MF, Russell G. Patient centred access to health care: conceptualising access at the interface of health systems and populations. Int J Equity Health 2013;12:18.
2. Kreindler SA, Cui Y, Metge CJ, Raynard M. Patient characteristics associated with longer emergency department stay: a rapid review, Emerg Med J 2016;33:194-199.
3. Allin S, Masseria. Unmet need as an indicator of health care access. Eurohealth 2009; 15(3): 7-9.
4. Duckett S, Breadon P, Farmer J. Out of Pocket costs: Hitting the most vulnerable hardest, Grattan Institute, 2014.
Appropriateness
1. Agency for Clinical Innovation. Minimum Standards for the Management of Hip Fracture in the Older Person. 2014
2. National Clinical Guideline Centre. The management of hip fracture in adults: methods, evidence and guidance. London. 2011.
3. Moseley JB, et al. A controlled trial of arthroscopic surgery for osteoarthritis of the knee. N Engl J Med 2002; 347:81-88.
4. Laupattarakasem W, Laopaiboon M, Laupattarakasem P, Sumananont C. Arthroscopic debridement for knee osteoarthritis. Cochrane Database of Systematic Reviews 2008; Jan 23;(1):CD005118.
5. Kirkley A, Birmingham TB, Litchfield RB, Giffin JR, Willits KR, Wong CJ, Feagan BG, Donner A, Griffin SH, D’Ascanio LM, Pope JE, Fowler PJ. A randomized trial of arthroscopic surgery for osteoarthritis of the knee. N Engl J Med 2008; 359(11):1097-1107.
6. Thorlund JB, Juhl CB, Roos EM, Lohmander LS. Arthroscopic surgery for degenerative knee: systematic review and meta-analysis of benefits and harms. BMJ 2015;350:h2747.
7. World Health Organization 2015. WHO Statement on Caesarean Section Rates, Available at: http://apps.who.int/iris/bitstream/10665/161442/1/WHO_RHR_15.02_eng.pdf (accessed 17/2/2017).
8. Mazzoni A, Althabe F, Liu NH, Bonotti AM, Gibbons L, Sánchez AJ, Belizán JM. Women’s preference for caesarean section: a systematic review and meta-analysis of observational studies. BJOG 2011; 118(4):391–399.
9. Roberts CL, Algert CS, Ford JB, Todd AL, Morris JM. Pathways to a rising caesarean section rate: a population-based cohort study. BMJ Open 2012; 2:e001725.
10. Taylor R. Caesarean section rates in New South Wales, 1977. Community Health Studies 1982; 6(1):30-38.
11. Health Stats NSW, Type of birth (vaginal, caesarean, forceps etc.) Available at: http://www.healthstats.nsw.gov.au/Indicator/mab_bth_cat/mab_bth_cat_lhd_trend
12. NSW Health. Policy Directive: Aggression, Seclusion & Restraint in Mental Health Facilities in NSW, 2012, available at: http://www1.health.nsw.gov.au/pds/ActivePDSDocuments/PD2012_035.pdf, (accessed 24/4/2017).
References
136Healthcare in Focus 2016 – How does NSW compare? bhi.nsw.gov.au
13. Appleby L, Shaw J, Amos T, McDonnell R, Harris C, McCann K, Kiernan K, Davies S, Bickley H, Parsons R. Suicide within 12 months of contact with mental health services: national clinical survey. BMJ 1999;318:1235.
14. Geddes JR and Juszczak E. Period trends in rate of suicide in first 28 days after discharge from psychiatric hospital in Scotland, 1968-92. BMJ 1995;311:357.
15. Loch AA. Discharged from a mental health admission ward: Is it safe to go home? A review on the negative outcomes of psychiatric hospitalization. Psychol Res Behav Manag 2014; 7:137-145.
16. Nelson EA, Maruish ME, Axler JL. Effects of Discharge Planning and Compliance With Outpatient Appointments on Readmission Rates. Psychiatr Serv 2000; 51(7):885-889.
17. Roughead L, Semple S, Rosenfeld E. Literature Review: Medication Safety in Australia, Australian Commission on Safety and Quality in Health Care. Sydney. 2013.
18. Tong EY, Roman CP, Mitra B, Yip GS, Gibbs H, Newnham HH, Smit DV, Galbraith K, Dooley MJ. Reducing medication errors in hospital discharge summaries: a randomised controlled trial. Med J Aust 2017; 206(1):36-39.
19. Schwappach DL. Risk factors for patient-reported medical errors in eleven countries. Health Expect 2014; 17(3):321-331.
20. World Health Organization. WHO Guidelines on Hand Hygiene in Health Care: First Global Patient Safety Challenge: Clean Care is Safer Care. World Alliance for Patient Safety, Geneva. 2009.
21. Ip S, Chung M, Raman G, Chew P, Magula N, DeVine D, Trikalinos T, Lau J. Breastfeeding and maternal and infant health outcomes in developed countries. Evid Rep Technol Assess (Full Rep) 2007; Apr;(153):1-186.
22. World Health Organization. Infant and young child feeding, Available at: http://www.who.int/mediacentre/factsheets/fs342/en/ (accessed 16/2/2017). Geneva. 2016.
23. McFadden A, Gavine A, Renfrew MJ, Wade A, Buchanan P, Taylor JL, Veitch E, Rennie AM, Crowther SA, Neiman S, MacGillivray S. Support for healthy breastfeeding mothers with healthy term babies. Cochrane Database Syst Rev 2017; Feb 28:2:CD001141.
24. Osborn R, Squires D. International perspectives on patient engagement: results from the 2011 Commonwealth Fund Survey. JACM 2012; 35(2):118-128.
25. Epstein RM, Fiscella K, Lesser CS, Stange KC. Why the nation needs a policy push on patient-centred health care. Health Affairs 2010; 29(8):1489-1495.
26. Glickman SW, Mehrotra A, Shea CM, Mayer C, Strickler J, Pabers S, Larson J, Goldstein B, Mandelkehr L, Cairns CB, Pines JM, Schulman KA. A Patient Reported Approach to Identify Medical Errors and Improve Patient Safety in the Emergency Department, J Patient Saf 2016; Nov 2.
27. Khan A, Coffey M, Litterer KP, et al. Families as Partners in Hospital Error and Adverse Event Surveillance. JAMA Pediatr 2017; 171(4):372-381.
28. Australian Institute of Health and Welfare. Admitted Patient Care 2015-16: Australian hospital statistics, Health services series no.75. Cat. no. HSE 185. Canberra. 2017.
Effectiveness
1. Timmins N. Tackling variations in clinical care: Assessing the Getting it Right First Time (GIRFT) programme. The King’s Fund, London, 2017.
2. Yusuf S, Hawken S, Ounpuu S, Dans T, Avezum A, Lanas F, McQueen M, Budaj A, Pais P, Varigos J, Lisheng L; INTERHEART Study Investigators. Effect of potentially modifiable risk factors associated with myocardial infarction in 52 countries (the INTERHEART study): case-control study. Lancet 2004; 364(9438):937-952.
3. Jousilahti P, Laatikainen T, Peltonen M, Borodulin K, Männistö S, Jula A, Salomaa V, Harald K, Puska P, Vartiainen E. Primary prevention and risk factor reduction in coronary heart disease mortality among working aged men and women in eastern Finland over 40 years: population based observational study. BMJ 2016;352:i721.
4. Buttar HS, Li T. Prevention of cardiovascular diseases: Role of exercise, dietary interventions, obesity and smoking cessation. Exp Clin Cardiol 2005; 10(4):229-249.
5. Wardlaw JM, Murray V, Berge E, del Zoppo GJ. Thrombolysis for acute ischaemic stroke. Cochrane Database Syst Rev 2014, Issue 7. Art. No.: CD000213.
6. O’Rourke K, Berge E, Walsh CD, Kelly PJ. Percutaneous vascular interventions for acute ischaemic stroke. Cochrane Database Syst Rev 2010, Issue 10. Art. No.: CD007574.
7. Lyon RM, Cobbe SM, Bradley JM, Grubb NR. Surviving out of hospital cardiac arrest at home: a postcode lottery? Emerg Med J 2004; 21:619-624.
137 Healthcare in Focus 2016 – How does NSW compare? bhi.nsw.gov.au
8. Mohsin M, Forero R, Ieraci S, Bauman AE, Young L, Santiano N. A population follow-up study of patients who left an emergency department without being seen by a medical officer. Emerg Med J 2007; 24(3):175-179.
9. Crilly J, Bost N, Gleeson H, Timms J. Patients Who Presented to an Australian Emergency Department and Did Not Wait or Left Against Medical Advice: A Prospective Cohort Follow-Up Study. Adv Emerg Nurs J. 2012; 34(4):357-368.
10. Cummings SR, Melton LJ. Epidemiology and outcomes of osteoporotic fractures. Lancet 2002; 359(9319): 1761-1767.
11. Huntjens KMB, Kosar S, van Geel TACM, Geusens PP, Willems P, Kessels A, Winkens B, Brink P, van Helden S. Risk of subsequent fracture and mortality within 5 years after a non-vertebral fracture. Osteoporos Int 2010; 21(12):2075-2082.
12. Bliuc D, Nguyen ND, Milch VE, Nguyen TV, Eisman JA, Center JR. Mortality Risk Associated With Low-Trauma Osteoporotic Fracture and Subsequent Fracture in Men and Women. JAMA 2009; 301(5):513-521.
13. Center JR, Bliuc D, Nguyen TV, Eisman JA. Risk of Subsequent Fracture After Low-Trauma Fracture in Men and Women. JAMA 2007; 297(4):387-394.
14. Klotzbuecher CM, Ross PD, Landsman PB, Abbott TA 3rd, Berger M. Patients with Prior Fractures Have an Increased Risk of Future Fractures: A Summary of the Literature and Statistical Synthesis. J Bone Miner Res 2000; 15(4):721-739.
15. Agency for Clinical Innovation. Musculoskeletal Network: NSW Model of Care for Osteoporotic Refracture Prevention. 2011.
16. Durbin J, Lin E, Layne C, Teed M. Is readmission a valid indicator of the quality of inpatient psychiatric care? J Behav Health Serv Res 2007; 34(2):137-150.
17. Organisation for Economic and Cooperative Development. Tackling Wasteful Spending on Health, OECD Publishing, Paris. 2017.
18. Independent Hospital Pricing Authority. The Pricing Framework for Australian Public Hospital Services 2017-18.
19. Centers for Disease Control and Prevention. Methicillin-resistant Staphylococcus aureus (MRSA): Precautions to Prevent Spread of MRSA, available at: https://www.cdc.gov/mrsa/healthcare/clinicians/precautions.html (accessed 19/06/2017).
20. Australian Institute of Health and Welfare. Staphylococcus aureus bacteraemia in Australian public hospitals 2015–16, Australian hospital statistics.
21. O’Reilly R, Burgess I, Zicat B. The prevalence of venous thromboembolism after hip and knee replacement surgery. Med J Aust 2005; 182(4):154-159.
22. NSW Health. Policy Directive: Prevention of Venous Thromboembolism, available at: http://www0.health.nsw.gov.au/policies/pd/2014/pdf/PD2014_032.pdf (accessed 24/05/2017).
23. Torpy JM, Burke AE, Glass RM. Postoperative Infections. JAMA 2010; 303(24):2544.
24. Bouldin ED. Falls among Adult Patients Hospitalized in the United States: Prevalence and Trends. J Patient Saf 2013; 9(1):13-17.
25. Hitcho EB, Krauss MJ, Birge S, Dunagan WC, Fischer I, Johnson S, Nast PA, Costantinou E, Fraser VJ. Characteristics and Circumstances of Falls in a Hospital Setting: A Prospective Analysis. J Gen Intern Med 2004; 19(7):732-739.
26. Cameron ID, Gillespie LD, Robertson MC, Murray GR, Hill KD, Cumming RG, Kerse N. Interventions for preventing falls in older people in care facilities and hospitals. Cochrane Database Syst Rev 2012;12:CD005465.
27. Morello R, Barker AL, Watts JJ, Haines T, Zavarsek SS, Hill KD, Brand C, Sherrington C, Wolfe R, Bohensky MA, Stoelwinder JU. The extra resource burden of in-hospital falls: a cost of falls study. Med J Aust 2015; 203(9):367.
28. Walton M, Smith-Merry J, Harrison R, Manias E, Iedema R, Kelly P. Using patients’ experiences of adverse events to improve health service delivery and practice: protocol of a data linkage study of Australian adults age 45 and above. BMJ Open 2014;4:e006599.
Efficiency
1. Halm EA, Fine MJ, Kapoor WN, Singer DE, Marrie TJ, Siu AL. Instability on hospital discharge and the risk of adverse outcomes in patients with pneumonia. Arch Intern Med 2002; 162(11):1278-1284.
2. Tracy SK, Hartz DL, Tracy MB, Allen J, Forti A, Hall B, White J, Lainchbury A, Stapleton H, Beckmann M, Bisits A, Homer C, Foureur M, Welsh A, Kildea S. Caseload midwifery care versus standard maternity care for women of any risk: M@NGO, a randomised controlled trial”, Lancet 2013; 382(9906):1723-32.
3. NSW Health. Maternity – Towards Normal Birth in NSW, available at: http://www1.health.nsw.gov.au/pds/ActivePDSDocuments/PD2010_045.pdf (accessed 26/05/2017).
References
138Healthcare in Focus 2016 – How does NSW compare? bhi.nsw.gov.au
4. Foreman J, Keel S, Xie J, van Wijngaarden P, Crowston J, Taylor HR, Dirani M. National Eye Health Survey 2016, Centre for Eye Research Australia and Vision 2020 Australia.
5. Lawrence D, Fedorowicz Z, van Zuuren EJ. Day care versus in-patient surgery for age-related cataract. Cochrane Database Syst Rev 2015;11:CD004242.
6. Wang SY, Blachley TS, Andrews CA, Ayanian JZ, Lee PP, Stein JD. Hospitalization after cataract surgery in a nationwide managed-care population. PLoS One 2016;11(2):e0149819.
Equity
1. Whitehead M. The concepts and principles of equity in health. Int J Health Serv1992;22:429–445.
2. Evans T, Whitehead M, Diderichsen F, et al, eds. Challenging inequities in health: from ethics to action. New York: Oxford University Press, 2001.
3. Braveman P, Gruskin S. Defining equity in health. J Epidemiol Community Health2003;57:254-258.
4. Australian Bureau of Statistics. Socio-Economic Indexes for Areas (SEIFA) – Technical Paper 2006.ABS cat. no 2039.0.55.001 Canberra: ABS, 2008.
5. Berwick DM, Nolan TW, Whittington J. The triple aim: care, health, and cost. Health Affairs. 2008;27(3):759-69.
6. Wolf JA, Niederhauser V, Marshburn D, LaVela SL. Defining patient experience. Patient Experience Journal. 2014;1(1): 7-19.
Sustainability
1. Gabriela P, Grimes K, Sklokin I. Defining Health and Health Care Sustainability. Ottawa: The Conference Board of Canada. 2014.
2. Organisation for Economic and Cooperative Development. Health expenditure in relation to GDP”, in Health at a Glance 2015: OECD Indicators, OECD Publishing, Paris.
3. Steering Committee for the Review of Government Service Provision. Report on Government Services 2017, Volume E: Health. Productivity Commission, Canberra. 2017.
4. Canadian Institute for Health Information. Healthcare cost drivers: The Facts, Ottawa, Ontario. 2011.
5. Morgans A, Burgess S. Judging a patient’s decision to seek emergency healthcare: clues for managing increasing patient demand. Aust Health Rev 2012; 36(1):110-114.
6. He J, Hou X, Toloo S, Patrick JR, Fitz Gerald G. Demand for hospital emergency departments: a conceptual understanding. World J Emerg Med 2011; 2(4):253-261.
7. Freed G, Gafforini S, Carson N. Age-related variation in primary care-type presentations to emergency departments. Aust Fam Phys 2015; 44(8):584-588.
8. Nagree Y, Camarda VJ, Fatovich DM, Cameron PA, Dey I, Gosbell AD, McCarthy SM, Mountain D. Quantifying the proportion of general practice and low-acuity patients in the emergency department. Med J Aust 2013; 198(11):612-615.
9. Lewis RA, Neal RD, Williams NH, France B, Hendry M, Russell D, Hughes DA, Russell I, Stuart NS, Weller D, Wilkinson C. Follow-up of cancer in primary care versus secondary care: systematic review. Br J Gen Pract 2009; 59(564):e234-e247.
10. Grunfeld E, Levine MN, Julian JA, Coyle D, Szechtman B, Mirsky D, Verma S, Dent S, Sawka C, Pritchard KI, Ginsburg D, Wood M, Whelan T. Randomized Trial of Long-Term Follow-Up for Early-Stage Breast Cancer: A Comparison of Family Physician Versus Specialist Care. J Clin Oncol 2006; 24(6):848-855.
11. Grunfeld E, Gray A, Mant D, Yudkin P, Adewuyi-Dalton R, Coyle D, Cole D, Stewart J, Fitzpatrick R, Vessey M. Follow-up of breast cancer in primary care vs specialist care: results of an economic evaluation. Br J Cancer 1999; 79(7/8):1227-1233.
12. Moffatt JJ, Eley DS. The reported benefits of telehealth for rural Australians. Aust Health Rev 2010; 34(3):276-281.
13. Celler B, Varnfield M, Sparks R, Li J, Nepal S, Jang-Jaccard J, McBride S, Jayasena R. Home Monitoring of Chronic Disease for Aged Care, Australian e-Health Research Centre (AEHRC), CSIRO. 2016.
14. Steventon A, Bardsley M. The impact of telehealth on use of hospital care and mortality: A summary of the first findings from the While System Demonstrator trial, Nuffield Trust, London. 2012.
139 Healthcare in Focus 2016 – How does NSW compare? bhi.nsw.gov.au
ABS – Australian Bureau of Statistics
ACT – Australian Capital Territory
AIHW – Australian Institute of Health and Welfare
ALOS – Average Length of Stay
APDC – Admitted Patient Data Collection
BHI – Bureau of Health Information
CEC – Clinical Excellence Commission
DVT – Deep vein thrombosis
ED – Emergency department
EDDC – Emergency Department Data Collection
GP – General practitioner
GDP – Gross Domestic Product
GSP – Gross State Product
ICD – International Classification of Disease
IIMS – Incident Information Management System
MBS– Medical Benefits Schedule
NSW – New South Wales
NT – Northern Territory
OECD – Organisation for Economic Cooperation and Development
PBS – Pharmaceutical Benefits Scheme
PE – Postoperative pulmonary embolism
PROM – Patient reported outcome measures
PYLL – Potential years of life lost
QLD – Queensland
SA – South Australia
SAC – Severity Assessment Code
SAPHaRI – Secure Analytics for Population Health Research and Intelligence
SES – Socioeconomic status
TAS – Tasmania
UK – United Kingdom
US – United States
VIC – Victoria
WA – Western Australia
WLCOS – Waiting List Collection On-line
Acronyms
140Healthcare in Focus 2016 – How does NSW compare? bhi.nsw.gov.au
Acknowledgements
The Bureau of Health Information (BHI) is the main source of information for the people of NSW about the performance of their public healthcare system. A board-governed organisation, BHI is led by Chairperson Professor Carol Pollock and Acting Chief Executive Dr Kim Sutherland.
We would like to thank our expert advisors, colleagues at the Ministry of Health and reviewers who contributed to the report.
We also acknowledge BHI’s dedicated teams of analytics, research, corporate, design and communications professionals whose expertise made this report possible.
External Advisors and Reviewers
Angela Beaton Centre for Health and Social Practice at Wintec, Hamilton, New Zealand
James Brown Westmead Hospital
Bruce Fried Department of Health Policy & Management, University of North Carolina at Chapel Hill, United States
Stephen Leeder Menzies Centre for Health Policy and School of Public Health, the University of Sydney
Hal Swerissen Grattan Institute
About the Bureau of Health Information
The Bureau of Health Information (BHI) is a board-governed organisation that provides independent information about the performance of the NSW public healthcare system.
BHI was established in 2009 to provide system-wide support through transparent reporting.
BHI supports the accountability of the healthcare system by providing regular and detailed information to the community, government and healthcare professionals. This in turn supports quality improvement by highlighting how well the healthcare system is functioning and where there are opportunities to improve.
BHI manages the NSW Patient Survey Program, gathering information from patients about their experiences in public hospitals and other healthcare facilities.
BHI publishes a range of reports and tools that provide relevant, accurate and impartial information about how the health system is measuring up in terms of:
• Accessibility – healthcare when and where needed
• Appropriateness – the right healthcare, the right way
• Effectiveness – making a difference for patients
• Efficiency – value for money
• Equity – health for all, healthcare that’s fair
• Sustainability – caring for the future
BHI’s work relies on the efforts of a wide range of healthcare, data and policy experts. All of our assessment efforts leverage the work of hospital coders, analysts, technicians and healthcare providers who gather, codify and report data. Our public reporting of performance information is enabled and enhanced by the infrastructure, expertise and stewardship provided by colleagues from NSW Health and its pillar organisations.
bhi.nsw.gov.au
0162
_ A
PR
2016