21
How extreme was the October 2015 precipitation event in South Carolina? Peng Gao, Greg Carbone, Junyu Lu Department of Geography University of South Carolina

How extreme was the October 2015
precipitation event in South Carolina?
Peng Gao, Greg Carbone, Junyu LuDepartment of Geography
University of South Carolina


How extreme?
• Intensity-Duration-Frequency (IDF) Curves
0
5
10
15
20
25
30
35
2 5
10 20 25 30 40 50 60 70 80 90
100
200
400
500
600
800
1000
De
pth
(in
)
Return Period (Years)
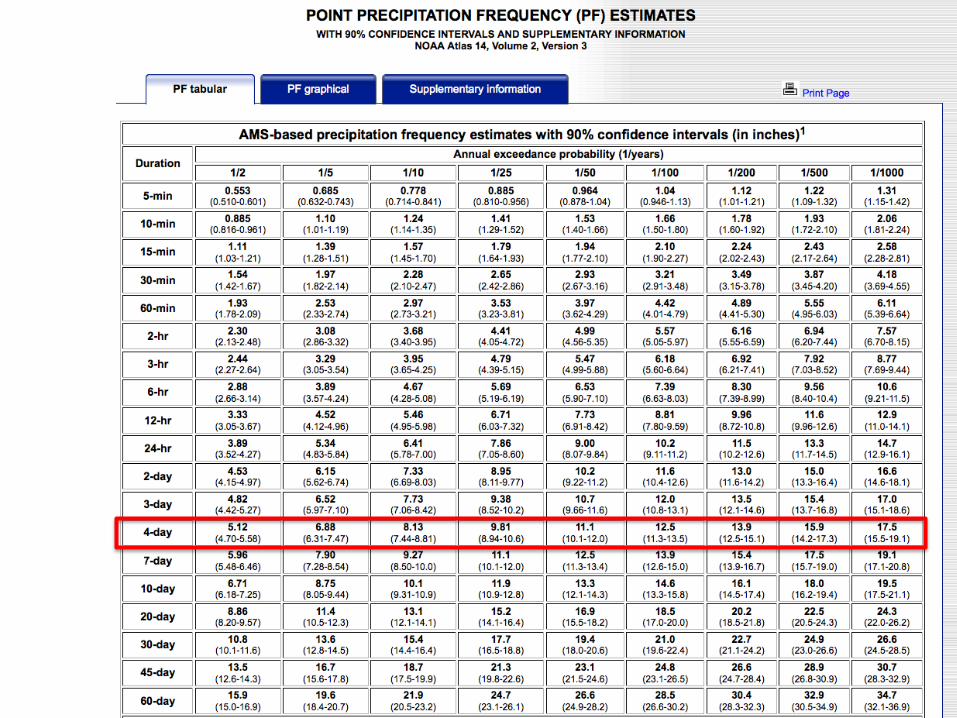
Four Day Total• A station received
18 inch rainfall in four consecutive days
• Duration: 4 days
• Probability: 1/400 –1/200
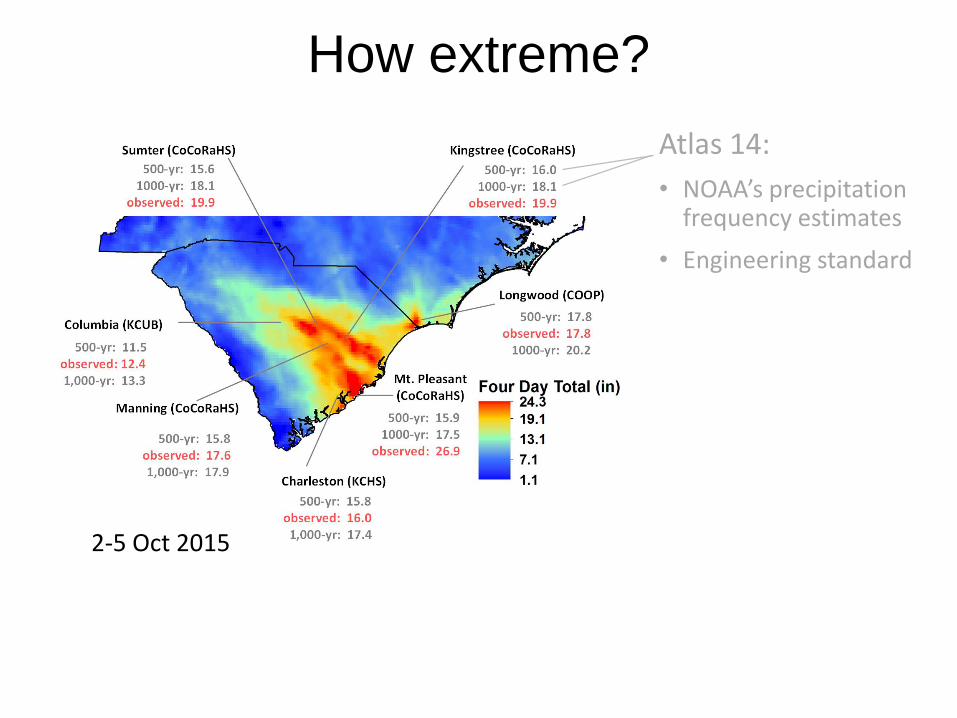
How extreme?
Atlas 14:
• NOAA’s precipitation frequency estimates
• Engineering standard
2-5 Oct 2015

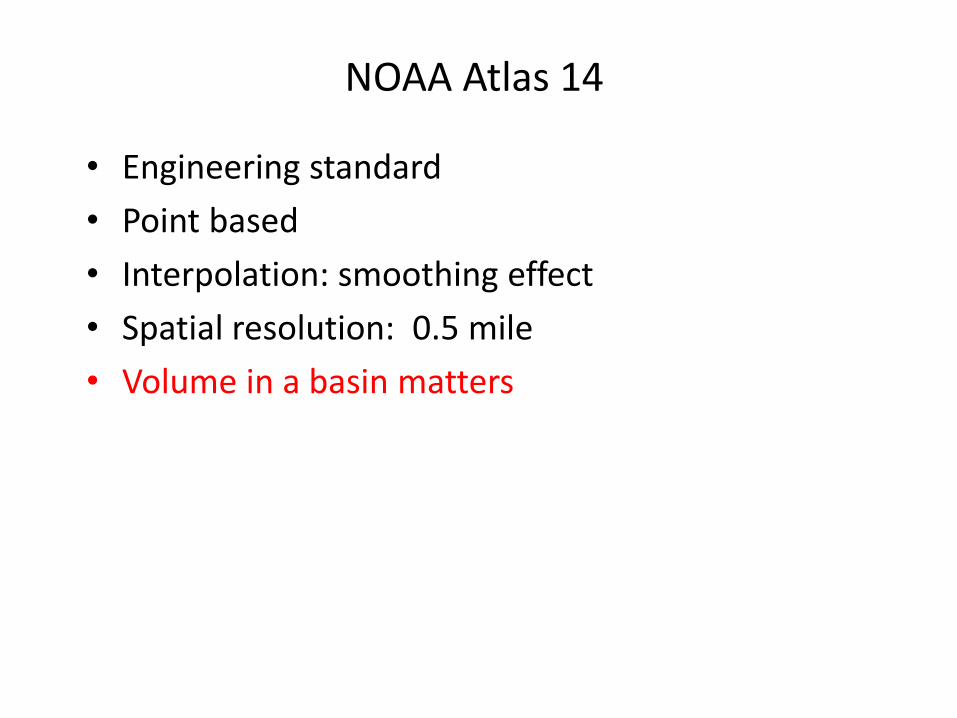
NOAA Atlas 14
• Engineering standard
• Point based
• Interpolation: smoothing effect
• Spatial resolution: 0.5 mile
• Volume in a basin matters

Do individual stations tell us enough?
KCHS (16.2)
Cooper (mean: 19.1)
Lower Santee/ Lower Pee
Dee (mean: 18.5)
Daily PRISM data: 4*4 km grids (Parameter-
elevation Relationships on Independent Slopes Model)

Historic extreme precipitation events in Cooper Basin
2-5 October 201510-13 October 1990
1265 sq. mi179 grids (4*4 km)

Comparing events in the Cooper Basin

Measuring extremes for an area
Generalized Extreme Value (GEV) distribution:
Intensity-Duration-Frequency (IDF) Curves
0
5
10
15
20
25
30
35
2 5
10 20 25 30 40 50 60 70 80 90
100
200
400
500
600
800
1000
De
pth
(in
)
Return Period (Years)
Four Day Total
Sample length too short (e.g., PRISM:1981 to 2015)

Bootstrap Sampling
• Substitute space for time by “borrowing” across the southeastern US
50 random samples * 35 years
repeat 10 times = 17500 samples
• 1-, 2-, and 4-day totals
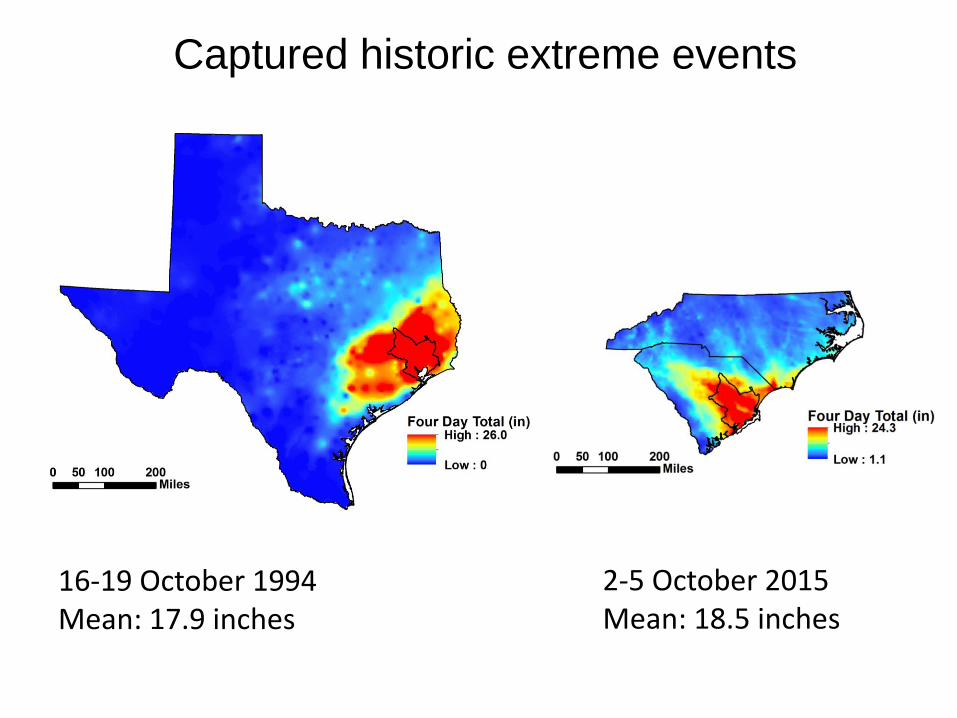
16-19 October 1994Mean: 17.9 inches
2-5 October 2015Mean: 18.5 inches
Captured historic extreme events

How extreme: a station vs. an area?
KCHS (16.2)
Cooper (mean: 19.1)
Lower Santee/ Lower Pee
Dee (mean: 18.5)

1-day annual max
Location 2015 Event 1/50 1/100 1/500 1/1000 Data Source
KCHS 9.3 9.07 10.3 13.4 14.9 Atlas 14
Area 2015 Event 1/100 1/500 1/800 1/1000 Approach
Cooper 9.9 7.1 9.8 10.3 15.3 Bootstrap
Lower Santee/
Lower Pee
Dee
8.6 6.1 8.1 8.5 12.0 Bootstrap

Location 2015 Event 1/100 1/500 1/1000 Data Source
KCHS 11.7 11.7 15.1 16.7 Atlas 14
Area 2015 Event 1/100 1/500 1/800 1/1000 Approach
Cooper 14.5 9.8 13.2 14.4 22.0 Bootstrap
Lower
Santee/
Lower Pee
Dee
13.0 8.5 11.2 12.0 17.4 Bootstrap
2-day annual max

Area 2015 Event 1/100 1/500 1/800 1/1000 Approach
Cooper 19.1 11.2 14.9 16.2 24.1 Bootstrap
Lower Santee/
Lower Pee Dee18.5 10.1 13.4 14.0 19.7 Bootstrap
4-day annual max
Location 2015 Event 1/100 1/500 1/1000 Data Source
KCHS 16.2 12.6 15.8 17.4 Atlas 14

Return period summary
Location/Area 1-day 2-day 4-day
KCHS 50 – 100 yr 100 500 - 1000
Cooper 500 – 800 800 - 1000 800 - 1000
Lower Santee/
Lower Pee Dee800 - 1000 800 - 1000 800 - 1000

Summary• By all measures, 2-5 October precipitation totals
represent a 500- to 1000-yr event (annual probability: 0.2-0.1%)
• Our areal-based approach (bootstrapping) shows several differences with (point-based) Atlas 14:
longer return periods for 1- and 2-day totalshigher values for 1000-yr events (0.1% annual probability)
• Atlas-14 is the engineering standard, but:volume (in a basin) matters
Optimal Solution: An areally-based metric with large sample sizes and long time series.


100 year 500 year 1000 year total number of samples for 10 sets
Cooper 1 day 160 17 0 17500Cooper 2 days 159 22 0Cooper 4 days 150 28 0
LS/LPD 1 day 93 11 0 10500LS/LPD 2 days 111 10 0LS/LPD 4 days 94 21 0


