How fair is the gendered land distribution? – Evidence from northern Ethiopia STEIN T. HOLDEN 1 and MESFIN TILAHUN 1,2 1 School of Economics and Business/Centre for Land Tenure Studies, Norwegian University of Life Sciences, P. O. Box 5003, 1432 Ås, Norway. 2 Mekelle University, Department of Economics, P.O.Box 451, Mekelle, Ethiopia. Emails: [email protected]; [email protected]; [email protected]Presented by: Mesfin Tilahun (PhD) The 16 th Nordic Conference in Development Economics Gothenburg, June 12, 2017
Transcript
How fair is the gendered land distribution? –Evidence from northern Ethiopia
STEIN T. HOLDEN1 and MESFIN TILAHUN1,2
1School of Economics and Business/Centre for Land Tenure Studies, Norwegian University of Life Sciences, P. O. Box 5003, 1432 Ås, Norway.
2Mekelle University, Department of Economics, P.O.Box 451, Mekelle, Ethiopia.
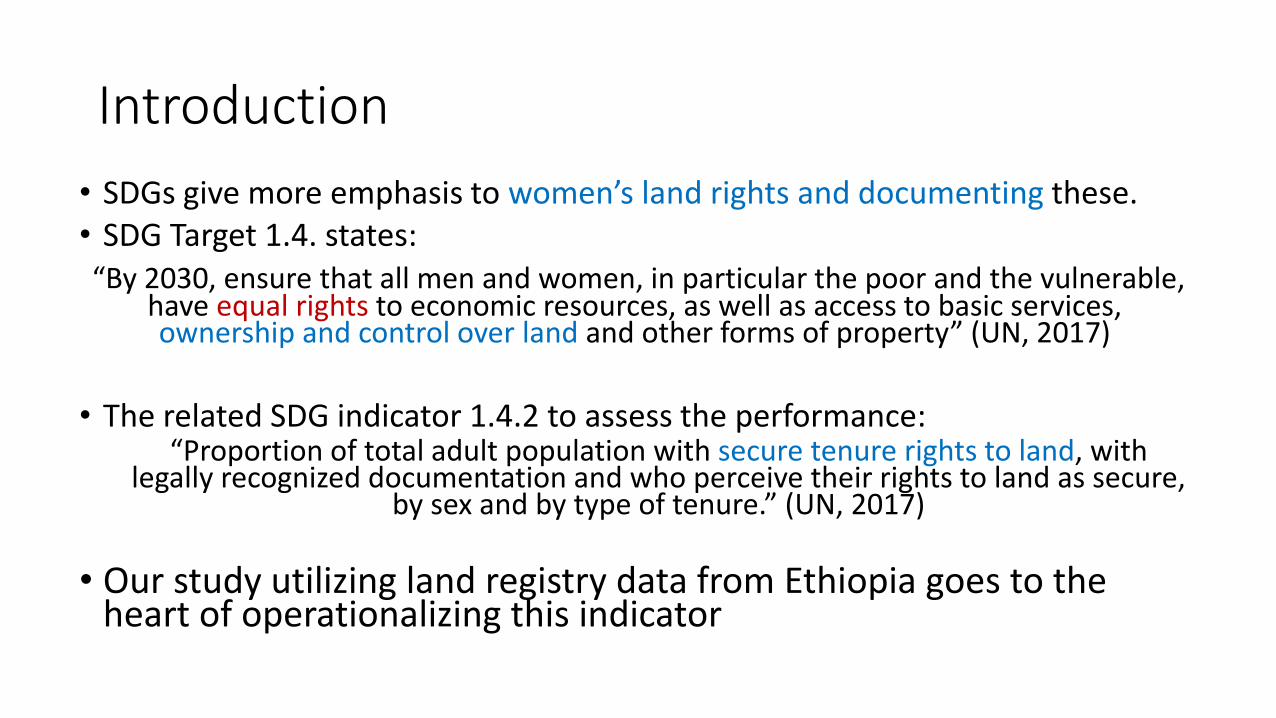
• SDGs give more emphasis to women’s land rights and documenting these. • SDG Target 1.4. states:“By 2030, ensure that all men and women, in particular the poor and the vulnerable,
have equal rights to economic resources, as well as access to basic services, ownership and control over land and other forms of property” (UN, 2017)
• The related SDG indicator 1.4.2 to assess the performance: “Proportion of total adult population with secure tenure rights to land, with
legally recognized documentation and who perceive their rights to land as secure, by sex and by type of tenure.” (UN, 2017)
• Our study utilizing land registry data from Ethiopia goes to the heart of operationalizing this indicator
Introduction…• Data on the gender distribution of land in Africa are weak and many
flawed narratives have existed on this (Doss et al. 2015).• There have been quite a few studies comparing land ownership of male- and
female-headed households (Dosse et al., 2015, Fisher & Naidoo, 2016)• There exist very few studies that have investigated the land ownership
distribution within male-headed and female-headed households.• Dokken (2015) based on farm household survey data from northern Ethiopia,
found that female-headed households have 23% smaller owned landholdingsthan male headed households
• No earlier studies in Africa have measured the share of land ownedby women (Doss et al. 2015) based on legally documented landregistry data.
Introduction…• Moreover, reliable gender-disaggregated data on land ownership in developing
countries is scarce.
• Most nationally representative surveys that collect such data are based onhouseholds’ stated land sizes.
• The quality of such collected data is poor and should be replaced by morereliable data, e.g. measured by GPS (Carletto et al., 2013).
• Formal land registration and titling programs, where they exist, provide morereliable information on farm sizes and parcel sizes.
• In our study, we provide a more comprehensive assessment by utilizing tworounds of land registry data of 11 municipalities in four districts of Tigray-northernEthiopia:
• First Stage Land Registration (FSLR) of 1998, and
• Second Stage Land Registration (SSLR) of 2016.
Objectives
• Based on the data from the sampled 11 communities in 4 districts in Tigray Region of Ethiopia, this study, therefore, has the following objectives.
1. To make a gender-disaggregated analysis of the documented land rights in SSLR data by assessing the across-household and within-household land ownership shares of women within and across communities; and
2. To compare land access of male-headed and female-headed households and how this has changed from 1998 to 2016.
Background:Ethiopia’s Rural Land Registration & Certification
• Ethiopia has implemented two successive rural land registration and certification (LR&C)reforms since the late 1990s in its 4 regional sates (Tigray, Amhara, Oromia, and SNNP)
• The FSLR&C is characterized as one of the largest, fastest and most cost-effective landregistration and certification reforms in Africa (Deininger et al., 2008).
• A number of studies also reported the postive impact of FSLR&C in enhancing tenuresecurity, which in turn contributed to:• a reduction in land-related disputes, increased investment on land, improved land productivity,
and enhanced land rental market activity (Deininger et al., 2011; Holden et al., 2011; Ghebru &Holden, 2015; Bezabih et al., 2016).
• But the FSLR&C had drawbacks as well in that:• The registration was done on registry books that were hand-written, making it difficult and
cumbersome to update records in the event of land inheritances, gifts or divisions due todivorce.
• Unique identification numbers were provided to households rather than plots and thecertificate did not include maps of the farm plots.
• Moreover, the data is paper-based and is not easily accessible for the purpose of landadministration and policy analysis
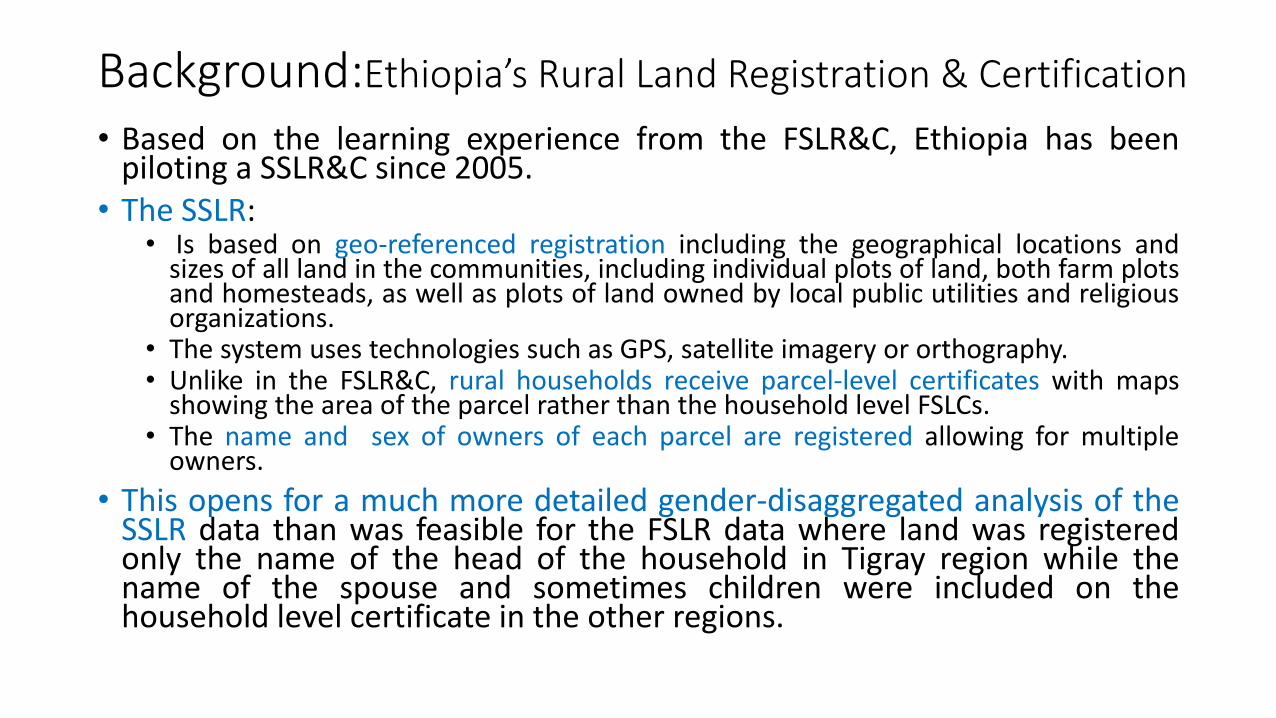
• Based on the learning experience from the FSLR&C, Ethiopia has beenpiloting a SSLR&C since 2005.
• The SSLR:• Is based on geo-referenced registration including the geographical locations and
sizes of all land in the communities, including individual plots of land, both farm plotsand homesteads, as well as plots of land owned by local public utilities and religiousorganizations.
• The system uses technologies such as GPS, satellite imagery or orthography.• Unlike in the FSLR&C, rural households receive parcel-level certificates with maps
showing the area of the parcel rather than the household level FSLCs.• The name and sex of owners of each parcel are registered allowing for multiple
owners.
• This opens for a much more detailed gender-disaggregated analysis of theSSLR data than was feasible for the FSLR data where land was registeredonly the name of the head of the household in Tigray region while thename of the spouse and sometimes children were included on thehousehold level certificate in the other regions.
Background:Ethiopia’s Rural Land Registration & Certification
Hypotheses• Based on the historical dominance of men in management and control over land in
Ethiopia, our hypotheses are:
• H1: Male land holding rights dominate after SSLR.
• H2: A large share of land owned by male-headed married households is in the nameof husbands only.
• Based on an earlier study by Dokken (2015) on the gender bias in the distribution of landin the same study region we proposed the hypothesis:
• H3: Female-headed households are more land-poor than male-headed householdsare and this remains the case after correcting for households size differences.
• The Family Law in Ethiopia (Articles 57 and 58 of Proclamation No. 213/2000) requireshusbands to share their land holding with their wives.
• If this law has been followed strictly in the implementation of SSLR&C we expect equalsharing of land in married male-headed households and put the hypothesis that:
• H4: In the SSLR, land is shared equally by gender in married male-headedhouseholds.
Hypotheses• We anticipated that that the Family Law has had stronger influence in some
communities and some households where the men are more open about sharing ofland with their wives. One implication of this lead us to our last hypothesis:
• H5: The land owned by women within households and across households withincommunities shows a more skewed distribution than that among men.
Data and Methods
• We sampled 4 districts with one to four municipalities torepresent the highlands of Tigray where smallholderagriculture dominates
• We obtained access to the FSLR and SSLR data of the 11manucipalities from the four districts’ LandAdministration Offices
• The data had to be sorted by the names of the ownersand into household types (male-headed and female-headed households) based on gender of owners.
• We also utilized the information on family size that isgiven for each parcel in the registry data.
• The names of owners were used to match households inthe FSLR and the SSLR data.
• Public land and non-agricultural land were excluded suchthat only agricultural land was included in the analyses offarm size distributions
Fig 1. Study area
Data and Methods• The female owned share of agricultural land is calculated for each parcel
based on the number of female owners over total owners times theparcel size.
• Further aggregation of female and male owned land to community,district and total sample is done to obtain the total shares of female andmale owned land.
• To assess the distribution of female and male owned land acrosshouseholds within communities, districts and the total sample as well asland distribution across male-headed and female headed householdswe used:• Gini-coefficients together with mean and median land sizes.
• Cumulative density functions (CDFs).
Results:SSLR-land distribution by gender and districts
14628
15375
30002
78687
0 40000 80000
Female land ha
Male land ha
Total area in ha
Parcel number
Female
land ha
Male land
ha
Total area
in ha
Parcel
number
Total 14628 15375 30002 78687
Kilite Awlalo 824 688 1512 7084
Degua Temben 2903 3262 6165 24384
Seharti Samire 5426 5666 11093 28985
Raya Azebo 5475 5758 11232 18234
48,76%51,25%
Female landha
Figure 1: SSLR Parcel based land registry data gender disaggregated. Source: Tigray Land Registry data from
District Land Administrations. Total land includes agricultural and non-agricultural land.
Reject: H1 & H2H1: Male land holding rights dominate after SSLR. H2: A large share of land owned by male-headed married households is in the name of husbands only.H4: In the SSLR, land is shared equally by gender in married male-headed households.
Average/Total N 0.897 0.625 31150 0.497 0.451 0.570
Tabe1 1: SSLR data aggregated to farm level: Farm size and farm size distribution by district
Reject: H4H4: In the SSLR, land is shared equally by gender in married male-headed households.
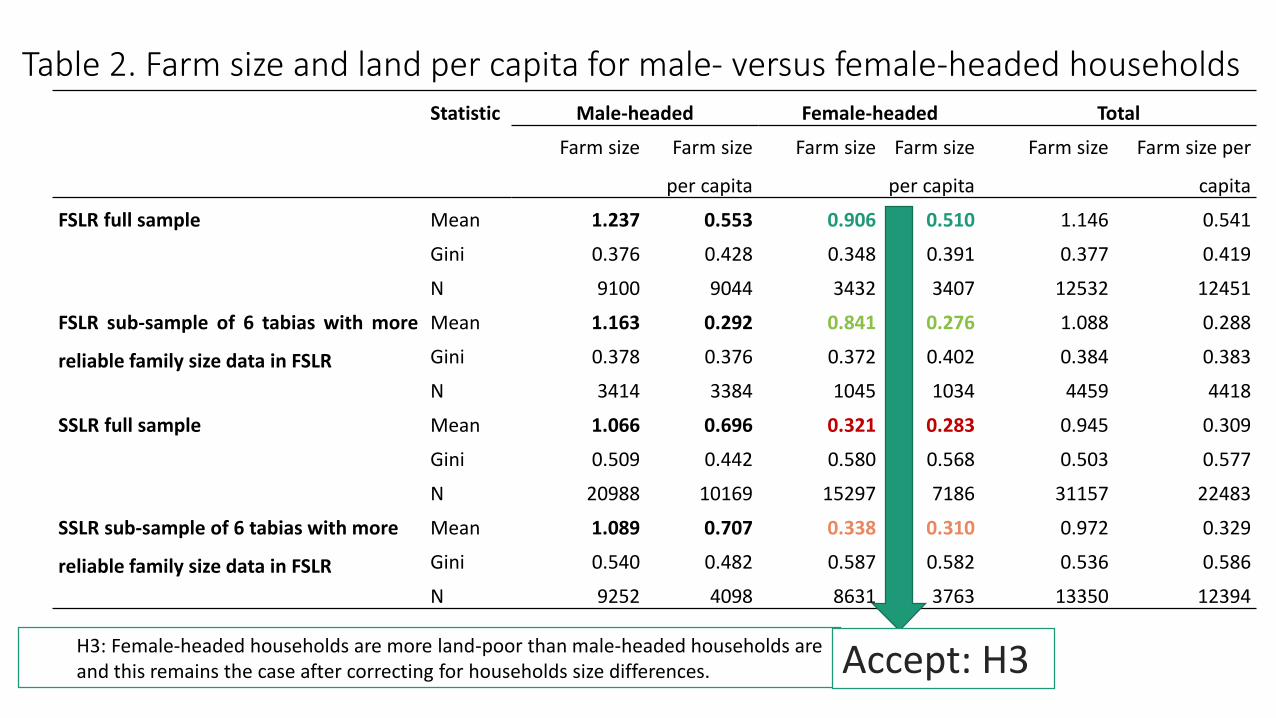
Table 2. Farm size and land per capita for male- versus female-headed households Statistic Male-headed Female-headed Total
Farm size Farm size
per capita
Farm size Farm size
per capita
Farm size Farm size per
capita
FSLR full sample Mean 1.237 0.553 0.906 0.510 1.146 0.541
Gini 0.376 0.428 0.348 0.391 0.377 0.419
N 9100 9044 3432 3407 12532 12451
FSLR sub-sample of 6 tabias with more
reliable family size data in FSLR
Mean 1.163 0.292 0.841 0.276 1.088 0.288
Gini 0.378 0.376 0.372 0.402 0.384 0.383
N 3414 3384 1045 1034 4459 4418
SSLR full sample Mean 1.066 0.696 0.321 0.283 0.945 0.309
Gini 0.509 0.442 0.580 0.568 0.503 0.577
N 20988 10169 15297 7186 31157 22483
SSLR sub-sample of 6 tabias with more
reliable family size data in FSLR
Mean 1.089 0.707 0.338 0.310 0.972 0.329
Gini 0.540 0.482 0.587 0.582 0.536 0.586
N 9252 4098 8631 3763 13350 12394
H3: Female-headed households are more land-poor than male-headed households are and this remains the case after correcting for households size differences. Accept: H3
Farm size in male- and female-headed households
Fig 2. Farm size distribution of male
and female-headed households in
SSLR, full sample (31150 farms)
Within-household variation in share of total land that is owned by females
• About 26% of the households have land purely owned by males.
• 30% of the farms have land purely owned by females.
• About 12% of the farms have a female share between zero and 50%
• Close to 27% have a 50-50 share between the genders,
• Only about 4% have a female share between 50 and 100%. Fig 2. Cumulative distribution function for females’
owned share of farms based on SSLR data from
31150 farms across four districts in Tigray
within-household variation in share of agricultural land owned by females
• Fig 4A shows: • About 60% of non-agricultural land is
split 50-50, • 20% is purely owned by male • 20% purely owned by female
• No overall gender bias among those having non-agricultural land
• Fig 4B shows: • 25% is 50-50 split• 33% purely owned by male• 30% purely owned by female
• Impying gender biase in thedistribution of agricultural land
Fig 4a & 4b. Cumulative distribution functions for female owned
share of non-agricultural and agricultural land
BA
within-household distributions across districts and communities
• No big variation across districtsbut somewhat strongervariations across communities.
• The share of females with noownership varies from 20 to40% across communities
• The share of males with noownership varies from 20 to35%.
• The share with 50-50 splitvaries from 20 to close to 50%.
Fig 5A and 5B. Cumulative distribution functions for females’ owned share of farms based on SSLR by district (A) and municipality(B)
BA
Distribution of land within male-headed and female-headed households
• For male-headed Households:
• Close to 45% of male-headed households have zero female land ownership
• Close to 35% have 50-50 sharing of land among the genders.
• Close to 15% have a female share between zero and 50%, and
• About 5% have a female share between 50 and 100%.
• For female-headed households:
• The female share is 100% for more than 90% of the households.
• We did similar analysis after dropping single person households from the sample and the result remain unaffected.
Fig 6. Gender distribution of agricultural land
within male-headed and female-headed
households, full sample
variation in gender distribution of land within male-headed households across communities
• share with zero female ownership varies from 25 to about 60%
• Share of households with 50-50split also varies from about 25 to 60%.
• Of the remaining 15%, most have between zero and 50% shares.
Fig 7. Within male headed households gender ownership
distribution of agricultural land by tabia.
Conclusions• We have carried out the first comprehensive comparative assessment of FSLR
and SSLR data in Ethiopia.
• It is also the first study in Africa to use land registry data to get gender-disaggregated areas of land owned based on formal registry data.
• Perhaps surprisingly, females owned as much as 48.8% of all privately held land in oursample areas. (Reject H1)
• The share of male-headed households with no female landowners varied from 25 to 60%across communities. (Partly Reject H2)
• Male-headed households had on average 27% more land than female-headed householdsin the FSLR data but was reduced to 5-8% in terms of land per capita. (Accept H3).
• Close to 45% of male-headed households have zero female land ownership (Reject H4)
• The Gini-coefficient for land distribution among women in the SSLR data was lower thanthat among men (0.45 versus 0.57). (Reject H5)
Conclusions• The distribution was less skewed among female-headed and among
male-headed households.• The Gini-coefficients among female-headed households increased from 0.35 in
the FSLR to 0.44 in the SSLR and from 0.38 to 0.51 among male-headedhouseholds.
• Overall, we find a gender bias in the distribution of land rights innorthern Ethiopia but the bias is lower than what we had expectedgiven the traditional patriarchal system and dominance of men inagriculture.
• Similar assessments should be made in other regions of Ethiopia andother African countries where households and persons have been givendocumented land rights such as through joint certification of husbandsand wives in order to monitor SDG 1.4.