How I learned to stop worrying and love the crisis Jan Fidrmuc a,c,d, *, Ariane Tichit b a Department of Economics and Finance, Brunel University, Uxbridge UB8 3PH, United Kingdom b CERDI, University of Auvergne, France c Institute of Economic Studies, Charles University, Czech Republic d CESifo Munich, Germany 1. Introduction Why do countries undertake systemic reforms of their economies? An important motivation is the desire and need to improve the wellbeing of their citizens. However, while the long-term outcome of economic reforms is uncertain, they are typically associated with substantial costs and economic hardship in the short run (Roland, 2000, chapters 2 and 3). As a result, efficiency-enhancing reforms may be rejected by the voters even if they are expected to benefit the majority of them (Fernandez and Economic Systems 37 (2013) 542–554 A R T I C L E I N F O Article history: Received 5 August 2012 Received in revised form 11 March 2013 Accepted 12 March 2013 JEL classification: O11 O47 P27 Keywords: Crisis Transition Growth Inflation Reform Institutions A B S T R A C T We investigate the effects of economic crises on the subsequent economic, performance, economic reform, democratization and institutional change. Our analysis is based on a sample of post- communist countries, most of which experienced severe economic, crises during the 1990s. We find that the severity of crisis has a positive impact on the subsequent pace of economic reform, economic growth and, with a delay, on investment and institutional change. Episodes of high inflation, moreover, translate into lower subsequent inflation. Crises thus serve as catalysts of reform and institutional change and lead to better long-term economic performance. ß 2013 Elsevier B.V. All rights reserved. * Corresponding author. Tel.: +44 1895 266 528; fax: +44 1895 269 786. E-mail addresses: [email protected], jan@fidrmuc.net (J. Fidrmuc). Contents lists available at ScienceDirect Economic Systems journal homepage: www.elsevier.com/locate/ecosys 0939-3625/$ – see front matter ß 2013 Elsevier B.V. All rights reserved. http://dx.doi.org/10.1016/j.ecosys.2013.03.002
Transcript
Economic Systems 37 (2013) 542–554
Contents lists available at ScienceDirect
Economic Systems
journal homepage: www.elsevier.com/locate/ecosys
How I learned to stop worrying and love the
crisis
Jan Fidrmuc a,c,d,*, Ariane Tichit b
a Department of Economics and Finance, Brunel University, Uxbridge UB8 3PH, United Kingdomb CERDI, University of Auvergne, Francec Institute of Economic Studies, Charles University, Czech Republicd CESifo Munich, Germany
A R T I C L E I N F O
Article history:
Received 5 August 2012
Received in revised form 11 March 2013
Accepted 12 March 2013
JEL classification:
O11
O47
P27
Keywords:
Crisis
Transition
Growth
Inflation
Reform
Institutions
A B S T R A C T
We investigate the effects of economic crises on the subsequent
economic, performance, economic reform, democratization and
institutional change. Our analysis is based on a sample of post-
communist countries, most of which experienced severe economic,
crises during the 1990s. We find that the severity of crisis has a
positive impact on the subsequent pace of economic reform,
economic growth and, with a delay, on investment and institutional
change. Episodes of high inflation, moreover, translate into lower
subsequent inflation. Crises thus serve as catalysts of reform and
institutional change and lead to better long-term economic
performance.
� 2013 Elsevier B.V. All rights reserved.
1. Introduction
Why do countries undertake systemic reforms of their economies? An important motivation is thedesire and need to improve the wellbeing of their citizens. However, while the long-term outcome ofeconomic reforms is uncertain, they are typically associated with substantial costs and economichardship in the short run (Roland, 2000, chapters 2 and 3). As a result, efficiency-enhancing reformsmay be rejected by the voters even if they are expected to benefit the majority of them (Fernandez and
J. Fidrmuc, A. Tichit / Economic Systems 37 (2013) 542–554 543
Rodrik, 1991; Rodrik, 1995). Alternatively, the required reforms may get postponed inefficiently long,thus prolonging the economic inefficiency that precedes them (Alesina and Drazen, 1991).
Alesina and Drazen (1991) make an intriguing proposition based on these stylized facts. They arguethat reforms are postponed because they are preceded by a war of attrition over the distribution oftheir costs. As long as the economic situation is bearable, the cost of reform could be imposed only onspecific segments of the society: a moderate fiscal stabilization, for example, can be achieved byincreasing taxes, lowering redistributive transfers, or laying off some civil servants. Each of thesegroups has much at stake and will therefore oppose the reform if it places the brunt of the cost on themand favor it otherwise. The economic situation then worsens progressively until, for one of the partiesconcerned, the cost of postponing the reform any further exceeds the cost of implementing it. Thatgroup then accepts to bear a disproportionate share of the burden and the reform can get underway.The authors observe, for example, that it is typically easier to drum up widespread political support fora stabilization program when inflation reaches hyperinflationary proportions but not during thepreceding (often long) period of moderately high inflation. In other words, reform only getsimplemented when the underlying situation reaches crisis proportions and becomes unsustainable;things have to get really bad before they can start getting better.
This ‘crises beget reforms’ hypothesis has received some empirical support. Bruno and Easterly(Bruno and Easterly, 1996, 1998) find that growth accelerates following high-inflation crises and thatcrisis-stricken countries tend to stabilize inflation, liberalize and open up their economies andprivatize public assets. Similarly, Drazen and Easterly (2001) find that extreme values of inflation andblack-market premiums tend to be followed by more dramatic improvements in subsequentperformance than moderate ones. Drazen and Easterly also consider the effect of growth crises but failto find any evidence that they foster subsequent improvements. In contrast, Pitlik and Wirth (2003),who consider both growth and inflation crises, find that deep crises of either type foster subsequenteconomic reform, whereas moderate crises have little or no effect. Lora and Olivera (2004) find thatcrises appear to make reforms more likely in Latin America. Finally, Cavallo and Cavallo (2010) arguethat the macroeconomic effect of crises depends on the prevailing institution: in democratic countries,the negative effect of crises on growth is less severe than in non-democratic countries.
Crises can also have important political repercussions. The economic and political changes inEastern Europe during the 1990s and the recent Arab Spring in the Middle East alike were, to a largeextent, precipitated by the failure of the incumbent regimes to maintain and improve the wellbeing oftheir citizens. Nevertheless, crises can also hinder reform. Studies of voting behavior in post-communist countries find that economic contractions undermine support for pro-reform parties andmay lead to such parties being voted out of office (Fidrmuc, 2000a,b; Jackson et al., 2001; Tucker,2002). Such political reversals, in turn, may allow the winners of partial reform to capture thegovernment and stall the reform momentum (Hellman, 1998). This suggests that there is indeed a thinline between vicious and virtuous crises (Krueger, 1993). Some crises generate political consensus infavor of reform while others lead to the reform being abandoned instead.
We contribute to this growing and exciting literature by exploring the effect of crises on a broad rangeof outcomes, both economic and political. One issue in this respect is that episodes of crises andfundamental reforms are relatively rare. Therefore, rather than address this question in a large datasetwith only relatively few observations of crises or reform, we focus on a sample that is rich both in reformand crisis episodes: the post-communist countries. These countries were all characterized by a highdegree of government interference in their economies, high to exclusive public ownership of productiveassets and high to complete central control over prices. All experienced deteriorating economicperformance in the course of the 1980s, which eventually lead to (attempted) systemic reforms in theearly 1990s. There was, however, substantial variation in terms of reforms implemented and theiroutcomes. Some countries implemented ambitious reforms early on and, in a space of a few years,managed to achieve Western-style democratic regimes and market economy systems. Others muddledthrough, reversed previously implemented reforms and/or suffered state capture by interest groups. Interms of growth, some countries experienced relatively mild recessions and started recovering after 2–5years (Poland, Czech Republic, but also Uzbekistan). Other post-communist countries saw their outputfalling by as much as two-thirds (Moldova, Tajikistan) or even three quarters (Georgia) of the pre-transition level, with the recession lasting as long as a decade in some cases. While most transition
J. Fidrmuc, A. Tichit / Economic Systems 37 (2013) 542–554544
economies experienced episodes of high inflation, some managed to bring inflation under controlquickly, whereas others suffered protracted periods of high inflation or hyperinflation.
We use this variation in the severity of transition-induced crises as well as in the economic andinstitutional outcomes to analyze the legacy of crises. The scope of our analysis is thus broader than inany of the previous contributions. We identify crises as both economic contractions and high inflation.In turn, we consider the effect of crises on the subsequent economic reform, democratization, multiplemeasures of economic performance and institutional change.
After briefly introducing the data in the following section, Section 3 presents the results of ouranalysis of the impact of crises on economic liberalization, growth, investments, inflation andinstitutional change. Section 4 summarizes our findings.
2. Data
Our analysis covers all post-communist countries for which data are available. Altogether, weconsider 29 countries1 that used to belong to the Soviet zone of influence, including the formerconstituent republics of the Soviet Union, Yugoslavia and Czechoslovakia, over the period from 1990to 2008. The starting point is limited by data availability, as little information is available on thesecountries for the earlier years. Furthermore, the reforms we consider were mostly initiated after 1990(the main exception is former Yugoslavia, which already experienced limited and partial reformsduring the 1980s). We include data until 2008 so as to eliminate the current economic crisis. Theaftermath of the current crisis is not revealed yet, so that including it could confound our results on theeffects of the earlier transition-induced crises.
To capture the progress in implementing market-oriented reforms, we use the average of the eightprogress-in-transition indicators compiled and published annually by the EBRD.2 We exploit theWorld Bank Development Indicators 2009 as the source of all macroeconomic variables except forunemployment rates, which we obtained from the EBRD Transition Report (various issues). We use theaverage Freedom House democracy index3 and Kaufmann et al.’s (2009) governance indicators to takeaccount of the progress in political and institutional transitions. Finally, we code whether countrieswere engaged in military conflict (external or internal) based on the Correlates of War Sarkees andWayman (2010) dataset.
The starting point of our analysis is to identify and measure the severity of the transition-inducedrecession in the post-communist countries. The immediate causes of the recession were multiple:disruption of trade with the Eastern Bloc countries that was only slowly counter-balanced by growingtrade with the West, price liberalization which translated repressed inflation to open inflation and theresulting fall in consumption, privatization of state-owned enterprises and the hardening of thebudget constraints, resulting in falling employment, disorganization due to disruption of traditionalbusiness ties between the formerly state-owned firms, and so on (see Kornai, 1994, and Roland, 2000,and the references therein).
The transformational recession manifested itself most visibly in falling output and rapidly risingprices.4 We therefore base our crisis measures on the trajectories of output and inflation since theoutset of reform. Figs. 1 and 2 illustrate the outcomes experienced by the post-communist countries.Fig. 1 depicts the index of overall GDP in each year as a percentage of the 1989 value, while Fig. 2
Kazakhstan, Kyrgyzstan, Latvia, Lithuania, Macedonia, Moldova, Mongolia, Monte Negro, Poland, Romania, Russia, Serbia,
Slovakia, Slovenia, Tajikistan, Turkmenistan, Ukraine and Uzbekistan.2 These indicators measure each country’s progress in the following fields: price liberalization, foreign exchange and trade
liberalization, small scale privatization, large scale privatization, enterprise reform, competition policy, banking reform and
non-banking financial institutions. Each indicator ranges from 1 (unreformed centrally-planned economy) to 4+ (liberal market
economy). As is common in this literature, we replace plus and minus distinctions by adding and subtracting 0.33 (so that 4+
becomes 4.33, while 4� is 3.67). We do not use the more recently available EBRD indicators of infrastructure reform, only the
eight original indicators measuring progress in Washington-consensus reform (liberalization, stabilization and privatization).3 Specifically, this index is the average of the Freedom House measures of political freedoms and civil liberties, rescaled so
that higher values correspond to more democracy. It ranges between 1 (autocracy) to 7 (fully free).4 Unemployment could be a third manifestation of the crisis, but it is less reliable because countries often use different
definitions to measure it.
Fig. 1. Output fall. Notes: Output fall measured as index of overall GDP with the 1989 level equal to 100.
Fig. 2. Cumulative inflation. Notes: Cumulative inflation measured as multiple of the starting level (logarithmic scale).
J. Fidrmuc, A. Tichit / Economic Systems 37 (2013) 542–554 545
displays the cumulative price level increase, with each data point showing the multiple of the initialprice level (so that a value of 2 corresponds to 100% cumulative inflation). It is not possible to identifyindividual countries in either figure. Instead, they are intended to indicate the range of outcomesobserved in our data. Virtually all countries experienced an output fall along a J-shaped trajectory (seeFig. 1) where the initial contraction was followed by a recovery, however, in some cases after aconsiderable delay. The country with the deepest output fall is Bosnia–Herzegovina, whose output fellto 13.5% of the 1989 level by 1992, followed by Georgia (23.5% in 1994). Both countries were affectedby internal conflicts. The best outcome is reported by Turkmenistan (output rising to 226% by 2008),followed by Poland (201%). The initiation of economic reform was associated with an upsurge ofinflation in all post-communist countries (Fig. 2). The range of outcomes varies widely, however. Theaverage price level in the Czech Republic had increased 4.5 times by 2008, while it rose to 1.3 billiontimes the original level in Serbia.
To reflect this diversity of transformational recessions in our analysis, we construct measures of thecumulative output fall (in %) and cumulative price increase since 1989. For both measures, we areinterested only in the crisis part of the evolution of the output and price levels. Therefore, we onlyconsider the overall contraction of output and not the subsequent recovery. In other words, onceoutput reaches the bottom of its post-1989 trajectory, we keep the cumulative output fall at the levelattained at this lowest point.5 The cumulative inflation measure is constructed in a similar way; it is anindex of the overall cumulative price increase since 1989 (i.e., a value of 2 corresponds to a doubling ofthe price level, 10 implies a 10-fold increase in prices, etc.). Once inflation has been stabilized, theindex again stays at the level attained at the time of stabilization. We define stabilization as inflation of
5 In several cases, a country in question experienced a double-dip recession. One example is Russia, where output initially
started to recover in 1997 only to fall further in 1998 following its economic and financial crisis. In that case, we consider the
deeper dip of the two as the bottom of the transformational recession (the second dip in 1998 in the Russian case).
Table 1Output fall and progress in market-oriented reform.
Dependent variable EBRD index (first difference)
(1) (2) (3) (4) (5)
Lagged EBRD index �0.278 �0.185 �0.302 �0.277 �0.297
(0.014)** (0.012)** (0.017)** (0.019)** (0.022)**
Lagged democracy 0.079 0.059 0.077 0.065 0.063
(0.008)** (0.008)** (0.008)** (0.009)** (0.009)**
War �0.085 �0.108 �0.064 �0.104 �0.087
(0.027)** (0.032)** (0.030)* (0.031)** (0.032)**
Lagged output fall 0.006 0.007 0.006 0.005
(0.001)** (0.001)** (0.001)** (0.001)**
Lagged GDP p.c. �0.013 0.005 0.008 �0.006
(thousands) (0.004)** (0.004) (0.004)* (0.006)
Lagged inflation 0.013 0.019
(0.004)** (0.005)**
Output fall� time 0.0001
(0.0002)
Output fall� time2 �5.96e�06
(1.68e�05)
Time after crisis 0.004
(0.011)
Time after crisis2 0.000
(0.001)
Constant 0.265 0.421 0.241 0.23 0.358
(0.031)** (0.038)** (0.040)** (0.049)** (0.064)**
Observations 550 524 524 495 495
Number of Countries 29 29 29 29 29
R-squared 0.45 0.39 0.48 0.5 0.52
All regressions include country-specific fixed effects. Standard errors in parentheses.* Significant at 5%.** Significant at 1%.
J. Fidrmuc, A. Tichit / Economic Systems 37 (2013) 542–554546
80% p.a. or lower. Most countries in our dataset succeed in controlling inflation after it has beenbrought down to two-digit levels.
Our objective is to see whether the severity of transition-induced recession has had a lasting impacton the subsequent pace of market-oriented reform, economic performance and other outcomes ofinterest. The cumulative inflation variable similarly captures the legacy of high inflation in the past evenafter runaway inflation has been stopped. Once the crisis is over, these variables no longer vary over time.Therefore, we construct a ‘‘time after crisis’’ variable which takes the value 0 during the crisis andbecomes a time trend thereafter. We interact this time variable with the output fall and cumulativeinflation variables to test whether the effect of the crisis diminishes or strengthens over time.
3. Long-term effect of crises
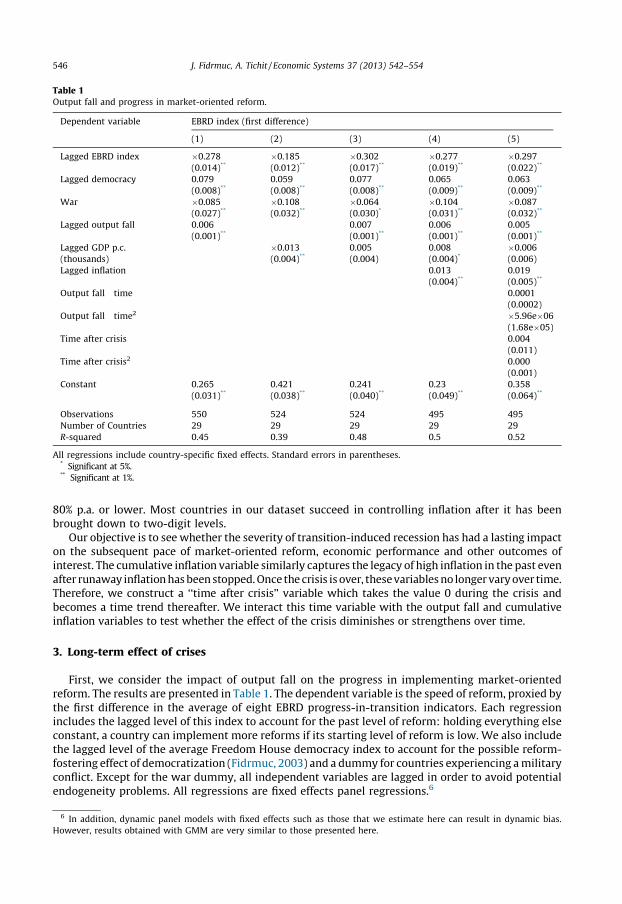
First, we consider the impact of output fall on the progress in implementing market-orientedreform. The results are presented in Table 1. The dependent variable is the speed of reform, proxied bythe first difference in the average of eight EBRD progress-in-transition indicators. Each regressionincludes the lagged level of this index to account for the past level of reform: holding everything elseconstant, a country can implement more reforms if its starting level of reform is low. We also includethe lagged level of the average Freedom House democracy index to account for the possible reform-fostering effect of democratization (Fidrmuc, 2003) and a dummy for countries experiencing a militaryconflict. Except for the war dummy, all independent variables are lagged in order to avoid potentialendogeneity problems. All regressions are fixed effects panel regressions.6
6 In addition, dynamic panel models with fixed effects such as those that we estimate here can result in dynamic bias.
However, results obtained with GMM are very similar to those presented here.
Table 2Output fall and sub-indexes of progress in market-oriented reform.
All regressions include country-specific fixed effects. Standard errors in parentheses. Lagged EBRD sub-index is the same index
as that denoted in the column heading.* Significant at 5%.** Significant at 1%.
J. Fidrmuc, A. Tichit / Economic Systems 37 (2013) 542–554 547
Column (1) presents the most parsimonious specification. We find that the lagged reform index hasa negative influence on reform: this is not surprising given that the reform index is bound from above.The past level of democracy, on the other hand, fosters economic reform. Countries that undertakepolitical liberalization also tend to engage in more ambitious economic reform. Not surprisingly,countries affected by war make less progress with respect to reform. Finally, the primary variable ofinterest, output fall, is positive and highly significant. Countries that experienced a deeper contractionceteris paribus respond to this by accelerating economic reform. It is possible, however, that this effectis found only because output fall is correlated with some other influential variable. In column (2), wetherefore replace output fall with lagged per-capita GDP (in thousands of PPP US dollars) to capturethe effect of the level of economic development on the progress in reform. Its effect is negative andsignificant; richer countries implement less reform. However, when we include both output fall andGDP per person side by side in column (3), only the output fall remains significant while GDP percapita now has no effect on reform. In column (4), we add lagged inflation (in logs to reduce theinfluence of episodes of extremely high inflation). Its effect is positive and significant; a recentexperience of high inflation helps accelerate reforms. However, the effect of output fall remainsstrongly significant and essentially unchanged. Finally, the last column introduces the quadraticpolynomial of time since the end of crisis both on its own and interacted with the output fall.7 Thequadratic time trend can potentially capture the time-specific profile of reform while the interactionterm between time and output fall will show whether the effect of crises on subsequent reformstrengthens or diminishes over time. None of these variables are significant, however. The effect ofcrises on reform does not appear to vary over time.
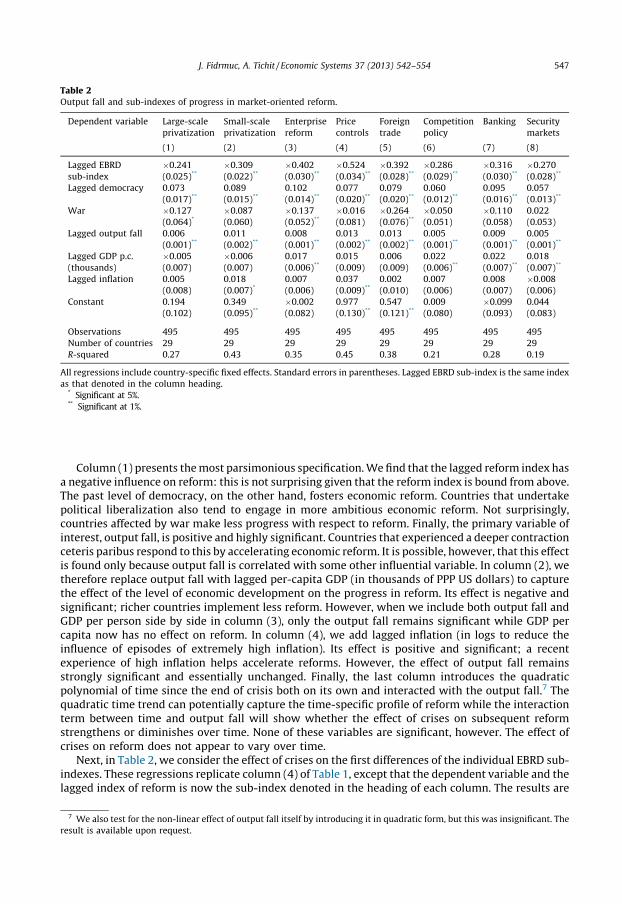
Next, in Table 2, we consider the effect of crises on the first differences of the individual EBRD sub-indexes. These regressions replicate column (4) of Table 1, except that the dependent variable and thelagged index of reform is now the sub-index denoted in the heading of each column. The results are
7 We also test for the non-linear effect of output fall itself by introducing it in quadratic form, but this was insignificant. The
result is available upon request.
J. Fidrmuc, A. Tichit / Economic Systems 37 (2013) 542–554548
remarkably consistent across the eight sub-indexes and similar to those obtained with the averageindex. Lagged sub-index of reform has a negative effect, lagged democracy has a positive effect, andoutput fall again displays a positive and strongly significant effect on subsequent progress in reform.Hence, having experienced a crisis in the past stimulates progress across all aspects of the reformprogram. While the coefficients estimated for the various sub-indexes are quite similar to each other(and to the results reported in column 4 of Table 1), the crisis effect is particularly pronounced for theremoval of price controls, liberalization of foreign trade and small-scale privatization.
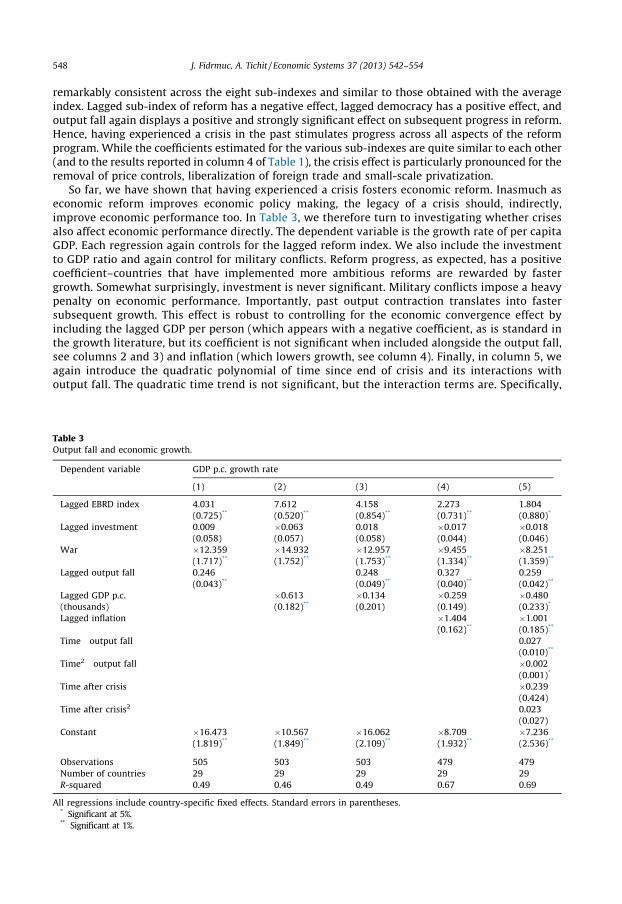
So far, we have shown that having experienced a crisis fosters economic reform. Inasmuch aseconomic reform improves economic policy making, the legacy of a crisis should, indirectly,improve economic performance too. In Table 3, we therefore turn to investigating whether crisesalso affect economic performance directly. The dependent variable is the growth rate of per capitaGDP. Each regression again controls for the lagged reform index. We also include the investmentto GDP ratio and again control for military conflicts. Reform progress, as expected, has a positivecoefficient–countries that have implemented more ambitious reforms are rewarded by fastergrowth. Somewhat surprisingly, investment is never significant. Military conflicts impose a heavypenalty on economic performance. Importantly, past output contraction translates into fastersubsequent growth. This effect is robust to controlling for the economic convergence effect byincluding the lagged GDP per person (which appears with a negative coefficient, as is standard inthe growth literature, but its coefficient is not significant when included alongside the output fall,see columns 2 and 3) and inflation (which lowers growth, see column 4). Finally, in column 5, weagain introduce the quadratic polynomial of time since end of crisis and its interactions withoutput fall. The quadratic time trend is not significant, but the interaction terms are. Specifically,
All regressions include country-specific fixed effects. Standard errors in parentheses.* Significant at 5%.** Significant at 1%.
Table 4Output fall and investment.
Dependent variable Investment
(1) (2) (3) (4) (5)
Lagged EBRD index 4.246 1.808 4.242 5.018 6.681
(0.516)** (0.401)** (0.643)** (0.752)** (0.852)**
War �4.086 �3.383 �4.386 �4.333 �1.949
(1.283)** (1.344)* (1.331)** (1.420)** (1.390)
Lagged output fall �0.171 �0.171 �0.182 �0.205
(0.028)** (0.036)** (0.041)** (0.042)**
Lagged GDP p.c. 0.562 0.148 0.115 0.021
(thousands) (0.142)** (0.164) (0.164) (0.243)
Lagged inflation 0.123 �0.025
(0.174) (0.190)
output fall� time 0.030
(0.010)**
output fall� time2 �0.001
(0.001)
Time after crisis �2.254
(0.430)**
Time after crisis2 0.102
(0.027)**
Constant 18.014 13.921 16.948 14.972 14.752
(0.981)** (1.271)** (1.396)** (1.909)** (2.492)**
Observations 520 508 508 481 481
Number of countries 29 29 29 29 29
R-squared 0.15 0.12 0.16 0.19 0.29
All regressions include country-specific fixed effects. Standard errors in parentheses.* Significant at 5%.** Significant at 1%.
J. Fidrmuc, A. Tichit / Economic Systems 37 (2013) 542–554 549
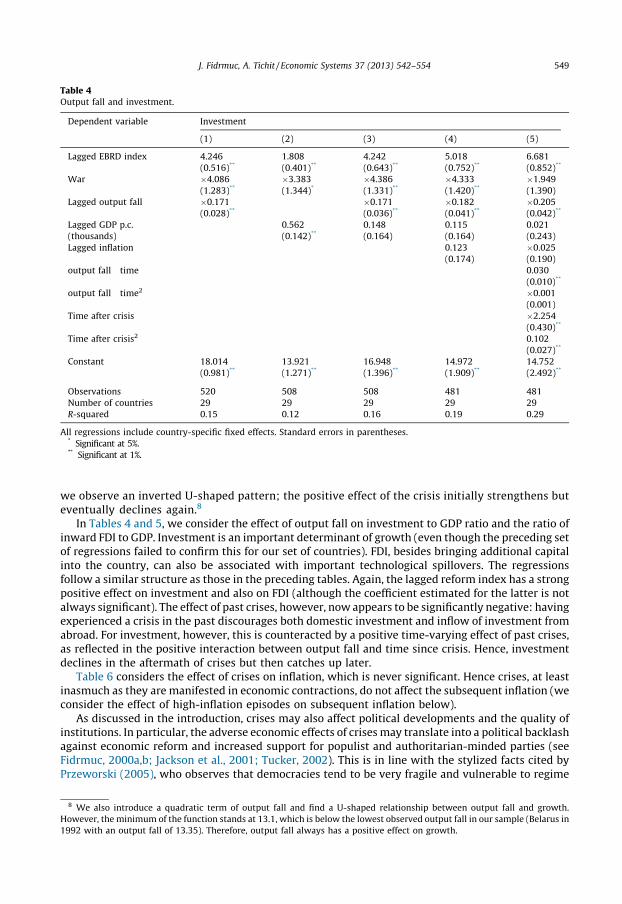
we observe an inverted U-shaped pattern; the positive effect of the crisis initially strengthens buteventually declines again.8
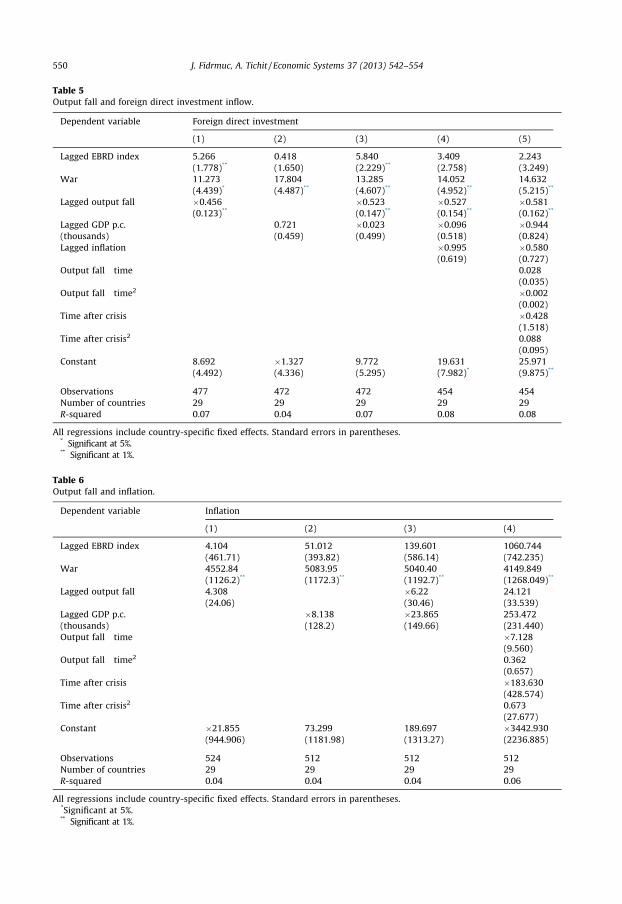
In Tables 4 and 5, we consider the effect of output fall on investment to GDP ratio and the ratio ofinward FDI to GDP. Investment is an important determinant of growth (even though the preceding setof regressions failed to confirm this for our set of countries). FDI, besides bringing additional capitalinto the country, can also be associated with important technological spillovers. The regressionsfollow a similar structure as those in the preceding tables. Again, the lagged reform index has a strongpositive effect on investment and also on FDI (although the coefficient estimated for the latter is notalways significant). The effect of past crises, however, now appears to be significantly negative: havingexperienced a crisis in the past discourages both domestic investment and inflow of investment fromabroad. For investment, however, this is counteracted by a positive time-varying effect of past crises,as reflected in the positive interaction between output fall and time since crisis. Hence, investmentdeclines in the aftermath of crises but then catches up later.
Table 6 considers the effect of crises on inflation, which is never significant. Hence crises, at leastinasmuch as they are manifested in economic contractions, do not affect the subsequent inflation (weconsider the effect of high-inflation episodes on subsequent inflation below).
As discussed in the introduction, crises may also affect political developments and the quality ofinstitutions. In particular, the adverse economic effects of crises may translate into a political backlashagainst economic reform and increased support for populist and authoritarian-minded parties (seeFidrmuc, 2000a,b; Jackson et al., 2001; Tucker, 2002). This is in line with the stylized facts cited byPrzeworski (2005), who observes that democracies tend to be very fragile and vulnerable to regime
8 We also introduce a quadratic term of output fall and find a U-shaped relationship between output fall and growth.
However, the minimum of the function stands at 13.1, which is below the lowest observed output fall in our sample (Belarus in
1992 with an output fall of 13.35). Therefore, output fall always has a positive effect on growth.
Table 5Output fall and foreign direct investment inflow.
Dependent variable Foreign direct investment
(1) (2) (3) (4) (5)
Lagged EBRD index 5.266 0.418 5.840 3.409 2.243
(1.778)** (1.650) (2.229)** (2.758) (3.249)
War 11.273 17.804 13.285 14.052 14.632
(4.439)* (4.487)** (4.607)** (4.952)** (5.215)**
Lagged output fall �0.456 �0.523 �0.527 �0.581
(0.123)** (0.147)** (0.154)** (0.162)**
Lagged GDP p.c. 0.721 �0.023 �0.096 �0.944
(thousands) (0.459) (0.499) (0.518) (0.824)
Lagged inflation �0.995 �0.580
(0.619) (0.727)
Output fall� time 0.028
(0.035)
Output fall� time2 �0.002
(0.002)
Time after crisis �0.428
(1.518)
Time after crisis2 0.088
(0.095)
Constant 8.692 �1.327 9.772 19.631 25.971
(4.492) (4.336) (5.295) (7.982)* (9.875)**
Observations 477 472 472 454 454
Number of countries 29 29 29 29 29
R-squared 0.07 0.04 0.07 0.08 0.08
All regressions include country-specific fixed effects. Standard errors in parentheses.* Significant at 5%.** Significant at 1%.
Table 6Output fall and inflation.
Dependent variable Inflation
(1) (2) (3) (4)
Lagged EBRD index 4.104 51.012 139.601 1060.744
(461.71) (393.82) (586.14) (742.235)
War 4552.84 5083.95 5040.40 4149.849
(1126.2)** (1172.3)** (1192.7)** (1268.049)**
Lagged output fall 4.308 �6.22 24.121
(24.06) (30.46) (33.539)
Lagged GDP p.c. �8.138 �23.865 253.472
(thousands) (128.2) (149.66) (231.440)
Output fall� time �7.128
(9.560)
Output fall� time2 0.362
(0.657)
Time after crisis �183.630
(428.574)
Time after crisis2 0.673
(27.677)
Constant �21.855 73.299 189.697 �3442.930
(944.906) (1181.98) (1313.27) (2236.885)
Observations 524 512 512 512
Number of countries 29 29 29 29
R-squared 0.04 0.04 0.04 0.06
All regressions include country-specific fixed effects. Standard errors in parentheses.*Significant at 5%.** Significant at 1%.
J. Fidrmuc, A. Tichit / Economic Systems 37 (2013) 542–554550
All regressions include country-specific fixed effects. Standard errors in parentheses.* Significant at 5%.** Significant at 1%.
J. Fidrmuc, A. Tichit / Economic Systems 37 (2013) 542–554 551
change in relatively poor countries (see also Hellman, 1998). Given that most post-communistcountries were relatively poor at the time they initiated their economic reforms, it is indeed possiblethat the severity of the crises they experienced could account for the (partial) reversals of politicalreform that some of them undertook. The most notable examples are Belarus and Turkmenistan;Russia likewise has reverted to (moderately) authoritarian rule during the Putin–Medvedev era.
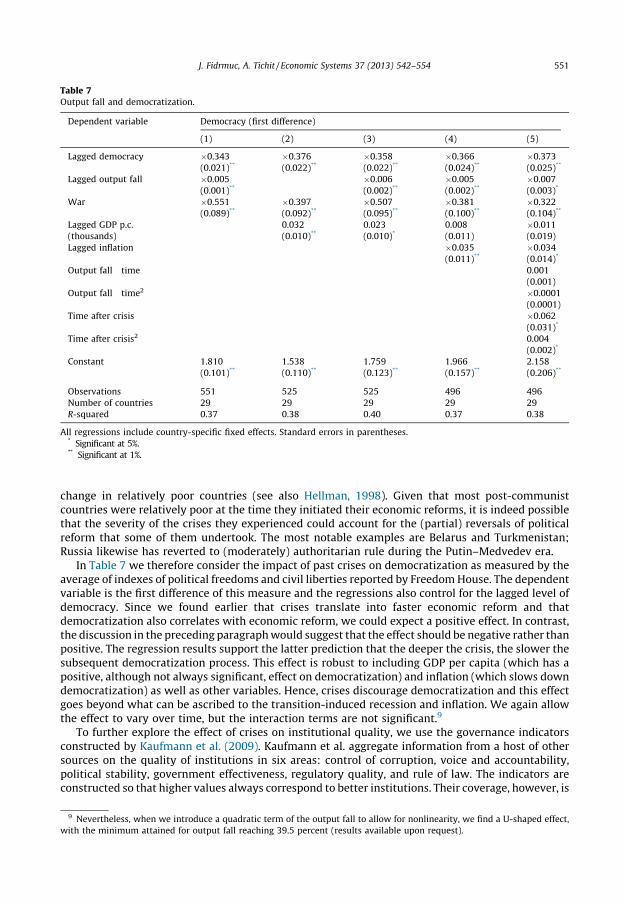
In Table 7 we therefore consider the impact of past crises on democratization as measured by theaverage of indexes of political freedoms and civil liberties reported by Freedom House. The dependentvariable is the first difference of this measure and the regressions also control for the lagged level ofdemocracy. Since we found earlier that crises translate into faster economic reform and thatdemocratization also correlates with economic reform, we could expect a positive effect. In contrast,the discussion in the preceding paragraph would suggest that the effect should be negative rather thanpositive. The regression results support the latter prediction that the deeper the crisis, the slower thesubsequent democratization process. This effect is robust to including GDP per capita (which has apositive, although not always significant, effect on democratization) and inflation (which slows downdemocratization) as well as other variables. Hence, crises discourage democratization and this effectgoes beyond what can be ascribed to the transition-induced recession and inflation. We again allowthe effect to vary over time, but the interaction terms are not significant.9
To further explore the effect of crises on institutional quality, we use the governance indicatorsconstructed by Kaufmann et al. (2009). Kaufmann et al. aggregate information from a host of othersources on the quality of institutions in six areas: control of corruption, voice and accountability,political stability, government effectiveness, regulatory quality, and rule of law. The indicators areconstructed so that higher values always correspond to better institutions. Their coverage, however, is
9 Nevertheless, when we introduce a quadratic term of the output fall to allow for nonlinearity, we find a U-shaped effect,
with the minimum attained for output fall reaching 39.5 percent (results available upon request).
Table 8Output fall and quality of institutions.
Dependent variable Control of
corruption
Voice and
accountability
Political
stability
Gov
effectiveness
Regulatory
quality
Rule
of law
(1) (2) (3) (4) (5) (6)
Lagged EBRD index 0.155 0.192 0.340 0.313 0.270 0.144
All regressions include country-specific fixed effects. Standard errors in parentheses.* Significant at 5%.** Significant at 1%.
J. Fidrmuc, A. Tichit / Economic Systems 37 (2013) 542–554552
limited; the indicators are available at semi-annual frequency from 1996 to 2000 and then annuallyfrom 2002. Because of this, we are unable to use lags of these variables. We therefore use lags of botheconomic reform (EBRD) and democracy (Freedom House) indexes instead (see Table 8).10 Both ofthese indexes are positive, with the effect of economic reform always being strongly significant whilethat of democracy is significantly positive in three regressions out of six. There are therefore importantspillovers from economic policy and democratization to institutional quality. The effect of past crises,however, is never significant. Yet, the time-varying effect is U-shaped, with the quadratic term alwayssignificant. This implies that although past crises may initially lead to a worsening of institutions inthe short term, this is followed by an improvement later on: when it comes to crises, good things cometo those who wait.
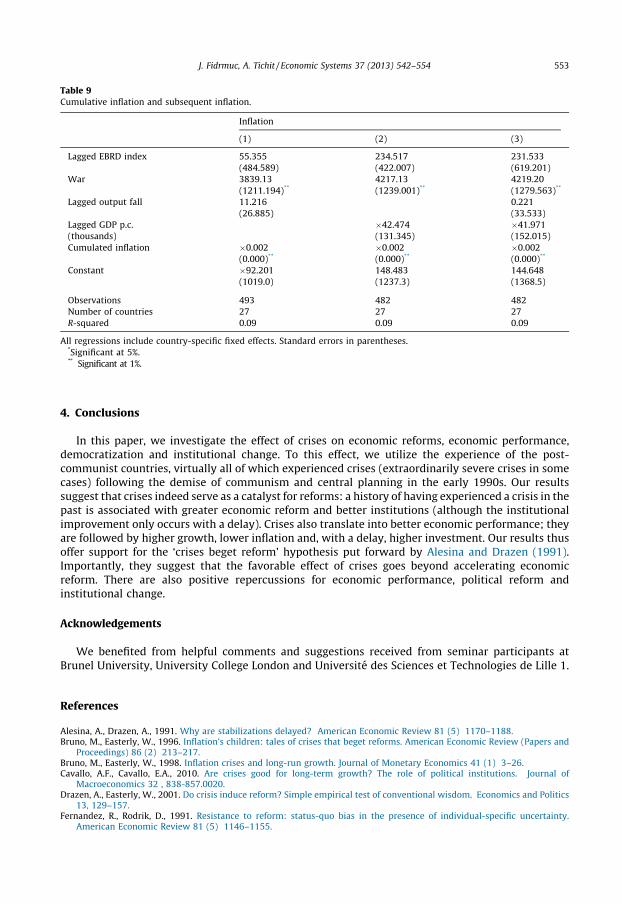
Finally, economic crises tend to be manifested not only in output contractions but also in highinflation. We therefore replace the output fall measure of crises with the cumulative inflation. Allregressions, reported in Table 9, again control for the level of the reform index (which is notconsistently significant) and for being involved in a military conflict (not surprisingly, wars areassociated with much higher inflation). We also include the output fall and GDP per capita, but neitherappears to be significant as a determinant of inflation. However, cumulative inflation is significantlynegative in every regression; having a legacy of high inflation in the past exerts a negative effect onsubsequent price growth. This stands in contrast with the insignificant effect of output fall – when itcomes to inflation, countries learn a lesson from past high-inflation episodes, but not from recessions.
10 Note that as the indicators are not available before 1996, the early transition period is dropped from the analysis.
Table 9Cumulative inflation and subsequent inflation.
Inflation
(1) (2) (3)
Lagged EBRD index 55.355 234.517 231.533
(484.589) (422.007) (619.201)
War 3839.13 4217.13 4219.20
(1211.194)** (1239.001)** (1279.563)**
Lagged output fall 11.216 0.221
(26.885) (33.533)
Lagged GDP p.c. �42.474 �41.971
(thousands) (131.345) (152.015)
Cumulated inflation �0.002 �0.002 �0.002
(0.000)** (0.000)** (0.000)**
Constant �92.201 148.483 144.648
(1019.0) (1237.3) (1368.5)
Observations 493 482 482
Number of countries 27 27 27
R-squared 0.09 0.09 0.09
All regressions include country-specific fixed effects. Standard errors in parentheses.*Significant at 5%.** Significant at 1%.
J. Fidrmuc, A. Tichit / Economic Systems 37 (2013) 542–554 553
4. Conclusions
In this paper, we investigate the effect of crises on economic reforms, economic performance,democratization and institutional change. To this effect, we utilize the experience of the post-communist countries, virtually all of which experienced crises (extraordinarily severe crises in somecases) following the demise of communism and central planning in the early 1990s. Our resultssuggest that crises indeed serve as a catalyst for reforms: a history of having experienced a crisis in thepast is associated with greater economic reform and better institutions (although the institutionalimprovement only occurs with a delay). Crises also translate into better economic performance; theyare followed by higher growth, lower inflation and, with a delay, higher investment. Our results thusoffer support for the ‘crises beget reform’ hypothesis put forward by Alesina and Drazen (1991).Importantly, they suggest that the favorable effect of crises goes beyond accelerating economicreform. There are also positive repercussions for economic performance, political reform andinstitutional change.
Acknowledgements
We benefited from helpful comments and suggestions received from seminar participants atBrunel University, University College London and Universite des Sciences et Technologies de Lille 1.
References
Alesina, A., Drazen, A., 1991. Why are stabilizations delayed? American Economic Review 81 (5) 1170–1188.Bruno, M., Easterly, W., 1996. Inflation’s children: tales of crises that beget reforms. American Economic Review (Papers and
Proceedings) 86 (2) 213–217.Bruno, M., Easterly, W., 1998. Inflation crises and long-run growth. Journal of Monetary Economics 41 (1) 3–26.Cavallo, A.F., Cavallo, E.A., 2010. Are crises good for long-term growth? The role of political institutions. Journal of
Macroeconomics 32 , 838-857.0020.Drazen, A., Easterly, W., 2001. Do crisis induce reform? Simple empirical test of conventional wisdom. Economics and Politics
13, 129–157.Fernandez, R., Rodrik, D., 1991. Resistance to reform: status-quo bias in the presence of individual-specific uncertainty.
J. Fidrmuc, A. Tichit / Economic Systems 37 (2013) 542–554554
Fidrmuc, J., 2000a. Political support for reforms: economics of voting in transition countries. European Economic Review 44 (8)1491–1513.
Fidrmuc, J., 2000b. Economics of voting in post-communist countries. Electoral Studies 19 (2–3) 199–217, Special issue:Economics and Elections, June/September 2000.
Fidrmuc, J., 2003. Economic reform, democracy and growth during post-communist transition. European Journal of PoliticalEconomy 19 (3) 583–604.
Hellman, J.S., 1998. Winners take all: the politics of partial reform in post-communist transitions. World Politics 50 (January)203–234.
Jackson, J.E., Klich, J., Poznanska, K., 2001. Economic transition and elections in Poland.In: William Davidson Working Paper No.391. .
Kaufmann, D., Kraay, A., Mastruzzi, M., 2009. Governance matters VIII: aggregate and individual governance indicators 1996–2008. In: Policy Research Working Paper 4978. The World Bank.
Kornai, J., 1994. Transformational recession: the main causes. Journal of Comparative Economics 19 (1) 39–63.Krueger, A.O., 1993. Virtuous and vicious circles in economic development. American Economic Review (Papers and Proceed-
ings) 83 (2) 351–355.Lora, E., Olivera, M., 2004. What makes reforms likely: political economy determinants of reforms in Latin America. Journal of
Applied Economics 7 (1) 99–135.Pitlik, H., Wirth, S., 2003. Do crises promote the extent of economic liberalization? An empirical test. European Journal of
Political Economy 19, 565–581.Przeworski, A., 2005. Democracy as an equilibrium. Public Choice 123, 253–273.Rodrik, D., 1995. The dynamics of political support for reforms in economies in transition. Journal of the Japanese and
International Economies 9 (4) 403–425.Roland, G., 2000. Transition and Economics: Politics, Markets, and Firms. MIT Press, Cambridge, MA.Sarkees, M.R., Wayman, F., 2010. Resort to War: 1816–2007. CQ Press.Tucker, J.A., 2002. The first decade of post-communist elections and voting: what have we studied, and how have we studied it?