How Important Is Human Capital for Development? Evidence from Immigrant Earnings By LUTZ HENDRICKS* This paper offers new evidence on the sources of cross-country income differences. It exploits the idea that observing immigrant workers from different countries in the same labor market provides an opportunity to estimate their human-capital endow- ments. These estimates suggest that human and physical capital account for only a fraction of cross-country income differences. For countries below 40 percent of U.S. output per worker, less than half of the output gap relative to the United States is attributed to human and physical capital. (JEL O15, O41, F22) Cross-country differences in per capita out- puts are far larger than standard neoclassical growth models predict. In response, some au- thors have proposed to abandon the neoclassical framework in favor of theories where countries differ in their total factor productivities, possi- bly due to technology gaps (e.g., Paul Romer, 1993; Edward C. Prescott, 1998). An alternative approach, pioneered by N. Gregory Mankiw et al. (1992), is to augment the neoclassical model by adding human capital. Since the two ap- proaches differ dramatically in their policy im- plications, it is important to determine the relative contributionsof human capital and total factor productivity (TFP) to cross-country in- come differences. Previous attempts at resolving this issue have encountered the problem of measuring coun- tries’ human-capital stocks. A common ap- proach is to assume that workers of given age and education have the same human-capital en- dowments in all countries (e.g., Robert E. Hall and Charles I. Jones, 1999). A dif culty with this approach is that possible differences in un- measured skills are not captured. Since mea- sured skills account for only a relatively small fraction of earnings variation within countries, this could be an important omission. An alter- native approach postulates a human-capital pro- duction function and constructs human-capital stocks based on a perpetual inventory method (e.g., Peter J. Klenow and Andre ´s Rodrõ ´guez- Clare, 1997a). A dif culty with this approach is that the implications may be sensitive to the human-capital production function chosen. Whether differences in human capital or in total factor productivity account for the bulk of cross-country income gaps remains therefore controversial (Robert Topel, 1998). This paper offers a new empirical strategy which avoids these measurement problems. The idea is to estimate the human capital of workers from different countries by observing their earn- ings in the same labor market. Speci cally, dif- ferences in labor earnings across U.S. immigrants with identical measured skills are used to infer their unmeasured human-capital endowments. 1 This approach has the bene t of capturing measured as well as unmeasured skill differences without having to impose a human- capital production function. In order to quantitatively explore this idea, I develop a neoclassical growth model that incor- porates both human capital and productivity gaps as sources of cross-country income differ- * Department of Economics, Arizona State University, P.O. Box 873806, Tempe, AZ 85287 (e-mail: [email protected]). For helpful comments I am grate- ful to Michele Boldrin, Boyan Jovanovic, Pete Klenow, John McDowell, and especially Lee Ohanian. Seminar par- ticipants at Arizona State University, the University of Arizona, the Midwest Macro Conference, and the NBER Growth Conference provided valuable suggestions. I am indebted to an anonymous referee for exceptionally detailed and helpful comments. 1 The idea of using international migration as a natural experiment has been proposed a number of times (Mancur Olson, Jr., 1996 p. 16; Klenow and Rodrõ ´guez-Clare, 1997b p. 612) but it has apparently never been studied in detail. 198
Transcript
How Important Is Human Capital for Development
Evidence from Immigrant Earnings
By LUTZ HENDRICKS
This paper offers new evidence on the sources of cross-country income differencesIt exploits the idea that observing immigrant workers from different countries in thesame labor market provides an opportunity to estimate their human-capital endow-ments These estimates suggest that human and physical capital account for only afraction of cross-country income differences For countries below 40 percent of USoutput per worker less than half of the output gap relative to the United States isattributed to human and physical capital (JEL O15 O41 F22)
Cross-country differences in per capita out-puts are far larger than standard neoclassicalgrowth models predict In response some au-thors have proposed to abandon the neoclassicalframework in favor of theories where countriesdiffer in their total factor productivities possi-bly due to technology gaps (eg Paul Romer1993 Edward C Prescott 1998) An alternativeapproach pioneered by N Gregory Mankiw etal (1992) is to augment the neoclassical modelby adding human capital Since the two ap-proaches differ dramatically in their policy im-plications it is important to determine therelative contributions of human capital and totalfactor productivity (TFP) to cross-country in-come differences
Previous attempts at resolving this issue haveencountered the problem of measuring coun-triesrsquo human-capital stocks A common ap-proach is to assume that workers of given ageand education have the same human-capital en-dowments in all countries (eg Robert E Halland Charles I Jones 1999) A dif culty withthis approach is that possible differences in un-measured skills are not captured Since mea-
sured skills account for only a relatively smallfraction of earnings variation within countriesthis could be an important omission An alter-native approach postulates a human-capital pro-duction function and constructs human-capitalstocks based on a perpetual inventory method(eg Peter J Klenow and Andres Rodrotilde guez-Clare 1997a) A dif culty with this approach isthat the implications may be sensitive to thehuman-capital production function chosenWhether differences in human capital or in totalfactor productivity account for the bulk ofcross-country income gaps remains thereforecontroversial (Robert Topel 1998)
This paper offers a new empirical strategywhich avoids these measurement problems Theidea is to estimate the human capital of workersfrom different countries by observing their earn-ings in the same labor market Speci cally dif-ferences in labor earnings across USimmigrants with identical measured skills areused to infer their unmeasured human-capitalendowments1 This approach has the bene t ofcapturing measured as well as unmeasured skilldifferences without having to impose a human-capital production function
In order to quantitatively explore this idea Idevelop a neoclassical growth model that incor-porates both human capital and productivitygaps as sources of cross-country income differ-
Department of Economics Arizona State UniversityPO Box 873806 Tempe AZ 85287 (e-mailhendrickslutzasuedu) For helpful comments I am grate-ful to Michele Boldrin Boyan Jovanovic Pete KlenowJohn McDowell and especially Lee Ohanian Seminar par-ticipants at Arizona State University the University ofArizona the Midwest Macro Conference and the NBERGrowth Conference provided valuable suggestions I amindebted to an anonymous referee for exceptionally detailedand helpful comments
1 The idea of using international migration as a naturalexperiment has been proposed a number of times (MancurOlson Jr 1996 p 16 Klenow and Rodrotilde guez-Clare 1997bp 612) but it has apparently never been studied in detail
198
ences The model decomposes these incomedifferences into the contributions of physicalcapital observed skills (such as education andexperience) unobserved skills as measured byrelative immigrant earnings and a total factorproductivity residual
Immigrant earnings are estimated from USCensus data (US Department of Commerce Bu-reau of the Census 1990) A key observation isthat the gap between immigrant and native earn-ings is less than 25 percent for most source coun-tries suggesting that cross-country differences inunobserved skills are much smaller than cross-country income gaps As a result human- andphysical-capital accumulation account for only afraction of cross-country income differences Fora sample of low-income countries which produceon average 18 percent of US output per workerhuman and physical capital account for a reduc-tion in output to 53 percent of the US levelleaving a factor of 3 unexplained For the poorest ve countries in the sample output per worker isoverpredicted by a factor of 8
A possible objection against this approach isthat immigrant self-selection could drive awedge between the unmeasured human-capitalendowments of immigrants and source countryworkers If immigrants are positively selectedthen relative immigrant earnings overstate thehuman-capital endowments of the source coun-tries However reasonable degrees of self-selection do not alter the qualitative ndingsFully accounting for observed cross-country in-come differences on the basis of human andphysical capital implies that immigrants frompoor source countries must possess severaltimes more human capital than source countryworkers Yet data on the earnings of emigrantsand return migrants suggest that self-selectionin unobserved skills is rather modest Even al-lowing for degrees of self-selection that arelarger than the data suggest implies that human-and physical-capital differences fail to accountfor large part of observed cross-country incomegaps For a sample of low-income countrieshuman and physical capital account for a reduc-tion of output per worker to 36 percent of theUS level compared with 18 percent in thedata For the poorest ve countries in the sam-ple output per worker is overpredicted by afactor of 5
The paper then considers whether skill
complementarities could increase the ability ofhuman capital to account for large cross-countryincome differences Scarcity of skilled labormay depress unskilled wages in poor countriesThis might help explain why migrants experi-ence large earnings gains even though un-skilled workers possess the same human-capitalendowments in all countries I nd that skillcomplementarities improve the ability of humanand physical capital to account for cross-country income differences but output perworker remains overpredicted by factors of 2 ormore for low-income countries
I conclude that data on immigrant earn-ings are dif cult to reconcile with the viewthat differences in human and physical capitalaccount for the bulk of the observed cross-country income dispersion The data are moreconsistent with Prescottrsquos (1998) conclusionthat accounting for large income differencesacross countries requires a theory of total factorproductivity
A number of other papers have recently of-fered empirical critiques of augmented neoclas-sical models (see Klenow and Rodrotilde guez-Clare1997a Prescott 1998 Mark Bils and Klenow2000) The main advantage of the approachtaken here is that it requires few assumptionsbeyond those maintained in virtually all ver-sions of neoclassical growth models (most im-portantly that factors are paid their marginalproducts) It therefore avoids issues related tothe measurement of human capital that underliethe current controversy about the importance ofhuman capital for cross-country incomedifferences
The rest of the paper is organized as followsSection I lays out the model and derives itsimplications for cross-country earnings differ-ences Section II describes the data and dis-cusses measurement issues The empirical ndings are presented in Section III Section IVconcludes
I The Model
This section develops a model that encom-passes the two competing hypotheses aboutcross-country income differences human-capitalgaps and productivity gaps Output per workerdepends on a countryrsquos stocks of human andphysical capital as for example in Mankiw et al
199VOL 92 NO 1 HENDRICKS HOW IMPORTANT IS HUMAN CAPITAL FOR DEVELOPMENT
(1992) But it also depends on a countryrsquos levelof total factor productivity as suggested by Pres-cott (1998) A parameterized version of themodel is used below to investigate to whatextent capital accumulation can account for thelarge cross-country income differences ob-served in the data
Each country indexed by c is inhabited bylarge numbers of workers indexed by i Aggre-gate output is produced from physical capital(Kc) and labor (Lc) using a Cobb-Douglas pro-duction function
(1) Yc 5 K cu~Ac Lc
1 2 u
Labor input is an aggregate of skilled and un-skilled labor inputs Lc 5 G(LcH LcL) Thisspeci cation allows for complementarity be-tween skilled and unskilled workers while re-taining a constant capital share in nationalincome All markets are competitive Firms rentphysical capital and labor services from house-holds so as to maximize period pro ts givenfactor prices From the rst-order condition therental price of labor of skill s is
(2) vc s 5 ~1 2 uA c1 2 u~K c Lc
uG s
where Gs denotes the derivative of G with re-spect to labor of skill s Competition in factormarkets ensures that effective capital-labor ra-tios (KcLc) and thus capital-output ratios(kc 5 KcYc) are equalized across workerswithin a country2 Hence the wage rates may bewritten as functions of labor inputs and thecapital-output ratio
vc s 5 vs ~kc Lc H Lc L Ac
5 ~1 2 uAckcu~1 2 uG s ~Lc H Lc L
Earnings per worker in country c are then givenby
(3) w c s 5 vs ~kc Lc H Lc L Ac Lc s Nc s
where Ncs denotes the number of workers withskill s in c Within a skill class individualearnings are thus proportional to workersrsquo en-dowments of labor ef ciency units In whatfollows I shall assume that the labor aggregatoris of the constant elasticity of substitution type
G~Lc H Lc L 5 ~rH Lc Hz 1 rL Lc L
z 1z
with elasticity of substitution a 5 (1 2 z)21The labor weights are normalized such that rH1 rL 5 1 I also consider the special casewhere the skill types are perfect substitutesG(LcH LcL) 5 LcH 1 LcL
In the empirical implementation the skill typeswill be identi ed with education levels In order toaccount for earnings differences within skillclasses for example by age education or sex thelabor force is further subdivided into J classesWorkers in classes j belonging to the set Js areendowed with hjhcj ef ciency units of labor ofskill type s The hj capture relative labor ef cien-cies across skill classes that are common acrosscountries while the hcj capture the ef ciency ofcountry c workers relative to a reference countrywithin a skill class This reference country will bethe United States for which I normalize hUSj 5 1If the number of class j workers in country c isdenoted by Ncj then country crsquos labor endow-ments are given by
Lc s 5 yen j [ Js N c j h jhc j
A number of reasons why observationally iden-tical workers may differ in human-capital levelsacross countries have been suggested in theliterature Examples include differences inschool quality or in the human capital of teach-ers (Bils and Klenow 2000) I shall refer todifferences in hc j as unmeasured skill differ-ences In the empirical implementation thesewill be estimated from immigrant earnings
The model nests the two competing hypoth-eses about cross-country income differences asspecial cases In order to capture their implica-tions clearly I de ne two versions of the modelmeant to represent the two hypotheses Thehuman-capital model assumes that total factor
2 A possible concern is that binding minimum-wage lawsmight drive a wedge between wage rates and marginalproducts for immigrants from poor source countries How-ever in the data the bulk of immigrants earns considerablymore than the minimum wage
200 THE AMERICAN ECONOMIC REVIEW MARCH 2002
productivity does not differ across countriesAc 5 A The total factor productivity (TFP)model assumes that unmeasured skills do notdiffer across countries (hc j 5 1)
A A Decomposition of Cross-CountryIncome Differences
This section presents an empirical frameworkfor quantifying the contributions of physicaland human capital to cross-country income dif-ferences The approach is to choose parametersof the production function such that US laborand capital inputs yield the earnings received byUS native-born workers The contributions ofphysical and human capital to cross-countryearnings differences are then quanti ed by se-quentially replacing the US estimates of thecapital-output ratio (kc) the populationweights(Nc j) and the unmeasured skill levels (hc j)with their source country counterparts in theproduction function The implied sequence ofearnings per worker calculated from (3) de-composes the gap between US and sourcecountry earnings per worker into the contribu-tions of physical capital measured and unmea-sured skills Speci cally I de ne the followingearnings per worker concepts
1 Earnings per worker of skill type s in theUnited States are given by
wUS s
5 vs ~kUS LUS H LUSL AUS LUSs NUS s
which can be estimated from US Censusdata
2 Replacing the US capital-labor ratio kUSwith its source country counterpart kc yields
wc sk
5 v s ~kc LUS H LUSL AUS LUSs NUS s
The ratio wcsk wUSs measures the contri-
bution of physical capital to cross-countryearnings differences
3 Using source country population weights tocalculate labor endowments yields
w c sN 5 v s ~kc Lc H
N Lc LN AUS Lc s
N Nc s
where LcsN 5 yen j [ Js
Nc jhj The ratio wcsN
wcsk measures the contribution of observed
skills (education and experience) to earn-ings differences
4 Using immigrantsrsquo unmeasured skills to cal-culate labor endowments yields
w c sh 5 v s ~kc Lc H
h Lc Lh AUS Lc s
h Nc s
where Lcsh 5 yenj [ Js
Nc jhjhc jsc Theunmeasured skills of immigrants differfrom source country ef ciencies (hc j) bya factor of sc re ecting self-selectionThe ratio wcs
h wcsN measures the contribu-
tion of unobserved skills to earnings dif-ferences before accounting for possibleself-selection of immigrants
5 Using source country unmeasured skills tocalculate labor endowments yields
wc sP 5 v s ~kc LcH Lc L AUS Lc s N c s
where Lcs 5 yen j [ JsNc jh jhc j are the
source country labor endowments wcsP is
the predicted level of earnings per workerin country c according to the human-capital model
6 Measured earnings per worker in country care denoted by wcs The ratio wcs
P wcs rep-resents the human-capital modelrsquos predictionerror One interpretation is that this residualis due to differences in total factor produc-tivities across countries Parameters of theproduction function are chosen such that forthe United States the predicted and the mea-sured earnings levels coincide wUSs
P 5 wUSsFor each earnings concept I also de ne anaverage over skill types For example meanearnings per worker in the United States aregiven by wUS 5 yens wUSsNUSsNUS
Strictly speaking the predictions of themodel apply only immediately after arrival inthe host country For earlier arrivals postmigra-tion human-capital investments could break therelationship between source country and immi-grant earnings However immigrant earningsgrowth does not differ suf ciently from nativeearnings growth to make a difference GeorgeJ Borjas (1988) and Darren Lubotsky (2000)
201VOL 92 NO 1 HENDRICKS HOW IMPORTANT IS HUMAN CAPITAL FOR DEVELOPMENT
estimate that immigrant earnings increase by10ndash13 percent relative to native earnings duringthe rst 20 years after migration While theseearnings changes are large in absolute termsthey are small compared with cross-country in-come differences of up to 30 It is thereforeunlikely that postmigration skill investments in-validate the predictions of the human-capitalmodel In order to verify this conjecture I re-strict the sample to immigrants who arrived atmost 10 years ago and con rm that this does notsigni cantly alter the ndings reported below
A related concern is that some skills may notbe fully transferable across borders (RachelFriedberg 1996) Immigrant earnings wouldthen underestimate source country human-capital endowments This would strengthen mymain conclusion that human capital accountsfor only moderate fractions of cross-countryearnings gaps
The TFP model matches cross-country earn-ings differences by construction the Ac can bechosen such that predicted and measured earn-ings coincide However it makes a testableprediction about immigrant earnings Immi-grants should earn the same as natives withidentical measured skills for all source and hostcountries
II Data and Empirical Implementation
This section provides an outline of the dataand empirical procedures Appendix B providesadditional details as well as data for all coun-tries contained in my sample (see Table B1)The full sample consists of 67 countries forwhich suf cient data are available I also reportresults for a low-income sample which contains37 countries with real per capita GDP perworker below 40 percent of the US level Theobjects to be estimated are the parameters of theproduction function (u Ac rH z) the capital-output ratios (kc) the relative labor ef cienciesof different skill classes (hj hc j) the degree ofimmigrant self-selection with respect to unmea-sured skills (sc) the population weights Nc j and source country mean earnings wcs
Labor Ef cienciesmdashThe relative labor ef -ciencies of workers from different countries areestimated from the earnings of US immigrantsA sample of native- and foreign-born workers is
drawn from the 1990 US Census of Populationand Housing 5-percent State Sample data lesResults for 1980 are similar All results arereported as averages over male and femaleworkers The sample is restricted to full-timeworkers between the ages of 20 and 69 whoreport positive earnings and who are not self-employed and do not live in group quartersOnly immigrants who arrived at age 20 or laterare included so as to ensure that most schoolingwas completed in the source countries3 Coun-tries with fewer than 150 observations for eachsex are dropped For the two skill case theminimum number of observations is 40 per sexand skill class The resulting sample consists of106263 immigrants
For each sex and country of birth workersare sorted into J 5 60 classes according to ageand education The labor ef ciency coef cientsare calculated as mean earnings per hour inclass j For US natives these represent hj while for immigrants they represent the prod-ucts hc jhjsc Small sample sizes make it dif -cult to estimate immigrant earnings preciselyfor all J classes I therefore assume that hc j isthe same for all classes within a given skill type( j [ Js) Labor ef ciencies are converted intoannual earnings per worker assuming that meanhours worked equal 2100 per year for allclasses A potential dif culty with the approachis self-selection The unmeasured skills of im-migrants may differ from those of source coun-try natives In terms of the model the sc factorscould be different from one This problem willbe addressed in Section III subsection B
Production Function ParametersmdashThe pro-ductivity parameter AUS is chosen to match USmean earnings per worker using (3) For thehuman-capital model Ac 5 AUS for all sourcecountries For the TFP model Ac is chosen tomatch predicted earnings per worker in thesource countries The labor weight rH matchesthe US ratio of aggregate skilled to unskilledearnings A normalization implies rL 5 1 2rH A number of alternative de nitions ofskilled versus unskilled labor and a range ofsubstitution elasticities are explored
3 Unfortunately the Census data do not identify when orwhere schooling was completed
202 THE AMERICAN ECONOMIC REVIEW MARCH 2002
The capital share parameter u is set to astandard value of 033 for all countries DouglasGollin (1997) nds that capital shares do notsystematically vary with per capita incomes Asa result the decomposition of cross-countryearnings gaps into the contributions of capitaland TFP presented below also holds for cross-country income gaps An alternative would beto assume that capital ows equalize rates ofreturn across countries in which case u wouldbe country speci c However the human-capital model would then imply that migrationhas no effect on earnings which is at variancewith evidence presented below
Source Country StatisticsmdashData on sourcecountry real GDP per worker are taken from thePenn World Table Mark 56 for 1990 For vecountries data for 1987 through 1989 are usedinstead Capital-output ratios are taken fromEllen R McGrattan and James A Schmitz Jr(1998) Lacking data on hours worked meanannual earnings per worker are calculated as(1ndashu) times real GDP per worker Mean earn-ings by skill class are the computed from theidentity wcLc 5 yens wcsLcs together with es-timates of the source country skill premia wcHwcL The latter are calculated from sourcecountry Mincer regressions described in theTechnical Appendix (available upon request)
Source country population weights are takenfrom Robert Barro and Jong-Wha Leersquos (2000)data on educational attainment together withdata on population age distributions from theUS Bureau of the Census International DataBase The joint distribution of age and educa-tional attainment is constructed from this datatogether with information on educational attain-ment by age taken from the Organization forEconomic Cooperation and Developmentrsquos(OECD) Education at a Glance 2001 databaseusing an algorithm described in Appendix BThe ndings change very little if it is assumedinstead that educational attainment is indepen-dent of age
One limitation of Barro and Leersquos data is thateducational attainment is available only for theentire population over age 25 whereas for esti-mating source country human-capital stocksdata on the educational composition of theworking population would be desirable For theUnited States this difference is small but it may
be larger for other countries Average years ofschooling estimated from worker survey datatypically exceed Barro and Leersquos estimates byseveral years even for rich countries (see TableB1) As a result the contributionof education tocross-country income differences would besmaller than reported below if educational at-tainment were taken from worker survey data
III Implications for Cross-CountryEarnings Differences
This section investigates to what extent hu-man- and physical-capital accumulation ac-count for observed cross-country earningsdifferences As a starting point I consider aversion of the human-capital model in which theskill types are perfect substitutes and in whichimmigrants do not differ from source countrynatives in their unmeasured skills (sc 5 1)Both assumption will be relaxed below
A One Skill TypemdashNo Self-Selection
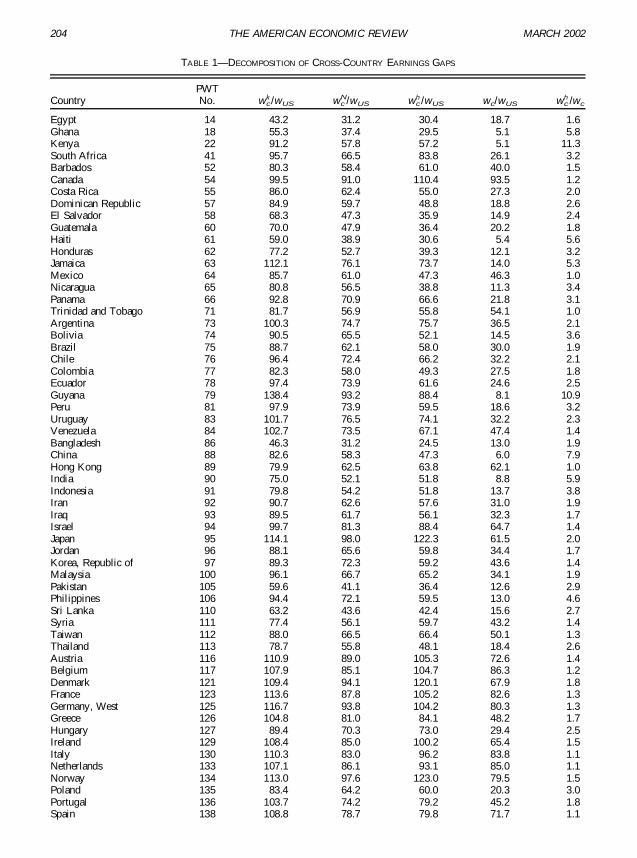
The modelrsquos implications for decomposingcross-country earnings differences into the con-tributions of physical capital measured and un-measured skills are shown in Table 1 whichshows the relative earnings concepts de ned inSection I for all countries in the sample Forexample mean earnings per worker in the Phil-ippines equal wcwUS 5 013 of the US levelThe lower Filipino capital-output ratio accountsfor an earnings reduction of 6 percent (wc
k wUS 5 094) The relative lack of measuredskills reduces earnings further to wc
NwUS 5072 The fact that Filipino immigrants earnabout 17 percent less than US natives impliesthat lower unmeasured skills reduce earnings inthe Philippines further to wc
h wUS 5 060 of theUS level leaving a factor of 46 unexplainedThe last rows of Table 1 show the geometricmeans of these relative earnings concepts forthe full sample the low-income sample and forthe poorest ve countries
Figure 1 illustrates the data by plotting theearnings concepts reported in Table 1 againstreal source country earnings per worker relativeto the United States (wcwUS) Panel (a) showsthe effect of capital-output ratios on sourcecountry earnings wc
k wUS For most countriesphysical capital accounts for only a small fraction
203VOL 92 NO 1 HENDRICKS HOW IMPORTANT IS HUMAN CAPITAL FOR DEVELOPMENT
TABLE 1mdashDECOMPOSITION OF CROSS-COUNTRY EARNINGS GAPS
of the observed earnings gap relative to theUnited States For example in the low-incomesample lack of physical capital reduces earn-ings by 17 percent whereas measured earningsare only 18 percent of the US level The reasonis that even low-income countries often havecapital-output ratios greater than one-half of theUS level According to (3) their earnings arereduced at most by a factor of wc
k wUS 5=05 This is of course precisely the reasonwhy a Solow growth model cannot account forlarge cross-country output differences
The effect of measured skills on earnings wcN
wck is shown in Panel (b) For all source countries
educational attainment in the Barro-Lee (2000)data is lower than in the United States This re-duces earnings per worker between 20 percent forthe richest and 40 percent for the poorest coun-tries The combined effect of physical capital andmeasured skills [wc
NwUS shown in Panel (c)] is toreduce earnings in the full sample to 67 percent ofthe US level For the poorest ve countries earn-ings are reduced to 54 percent
Panel (d) shows the effect of unmeasured skillswc
hwcN estimated by the earnings of immigrants
relative to US natives with identical measuredskills (hcsc) In the one skill model source countryearnings are proportional to unmeasured humancapital Hence the ratios plotted in Panel (d) equalthe hcsc factors The key insight from this data isthat the gap between the earnings of immigrantsand US natives with identical skills is less than25 percent for most source countries Immigrants
from richer source countries earn more but therelationship is weak A tenfold increase of sourcecountry earnings (or source country output perworker) is associated with an immigrant earningsimprovement of only around one-third4 Account-ing for this fact poses a challenge for modelswhere productivity is embodied in workers but itarises naturally if productivity is country speci cas in the TFP model
The human-capital modelrsquos predicted sourcecountry earnings per worker wc
hwUS areshown in Panel (e) They represent the jointeffect of physical capital measured and unmea-sured skills In the full sample human capitalaccounts for a 27-percent reduction in outputper worker The joint effect on human and phys-ical capital is to reduce relative earnings to 066leaving on average a factor of 22 unexplainedFigure 2 shows the ratio of predicted to mea-sured immigrant earnings [wc
h wc or the ratioof the data shown in Panel (e) of Figure 1 to the45-degree line] Consistent with theories thatattribute cross-country income differences tototal factor productivity the degree of overpre-diction is larger for poorer countries In thelow-income sample earnings per worker im-plied by the model (053) overpredict measuredearnings by a factor of 3 For the poorest vecountries predicted earnings of 046 exceedmeasured earnings by a factor of 8
Full sample 904 671 657 304 22Low-income sample 834 592 531 177 30Poorest ve countries 806 540 464 58 80
Notes PWT No denotes the Penn World Table 56 country number Columns 2ndash4 show the cumulative effects of KYmeasured and unmeasured skills on source country earnings per worker wcwUS denotes relative source country earnings inthe Penn World Tables wc
hwc is the ratio of predicted to measured source country earnings
205VOL 92 NO 1 HENDRICKS HOW IMPORTANT IS HUMAN CAPITAL FOR DEVELOPMENT
Other Host CountriesmdashThere are reasons tobelieve that similar ndings are valid for a va-riety of host countries not only for the UnitedStates In particular the observation that immi-grants earn within 25 percent of natives withidentical measured skills is common in the lit-erature For example Borjas (1988 Table61) reports that the typical immigrant with 12years of schooling at age 50 earns 9 percentmore than observationally similar natives in theUnited States 10 percent less in Canada and 5percent less in Australia [see also David EBloom and Morley Gunderson (1991 Table125) for Canada and see John J Beggs and
Bruce J Chapman (1991) for Australia] Simi-lar ndings hold for the United Kingdom (BrianD Bell 1997 especially Table 5) Italy (Ales-sandra Venturini and Claudia Villosio 1998Table 41) Denmark (Leif Husted et al 2000)Norway (John E Hayfron 1998) Sweden (Per-Anders Edin et al 2000) and Germany (Chris-toph M Schmidt 1997 Table 4)
Importantly the observation remains validfor poorer host countries as well For IsraelFriedberg (1996 Table 4) reports that control-ling for individual characteristics earnings ofimmigrants from all regions are very similar tothose of natives For example with 12 years of
FIGURE 1 DECOMPOSITION OF CROSS-COUNTRY EARNINGS DIFFERENCES ONE SKILL MODEL
206 THE AMERICAN ECONOMIC REVIEW MARCH 2002
schooling and 20 years of experience the ratioof immigrant to native earnings is 99 percent forWestern Europeans 96 percent for Eastern Eu-ropeans 101 percent for Soviets and 86 percentfor AsiansAfricans
DiscussionmdashIn order to understand why hu-man and physical capital fail to account forlarge parts of cross-country income differencesconsider the modelrsquos implications for migrantearnings gains If there is only one skill type andif countries share identical production func-tions migration affects earnings of a givenworker only by changing the capital-output ra-tio Speci cally moving from country c tocountry s increases earnings by a factor of (kskc)
u (12 u ) according to (3) For a capital shareof u 5 13 and a source country with one-halfthe US capital-output ratio migration in-creases earnings by 40 percent Hence the pre-dicted earnings gains from migration are muchsmaller than observed cross-country earningsdifferences for workers with identical measuredskills so that immigrants should earn much lessthan US natives By contrast in the data im-migrants typically receive at least 75 percent ofnative earnings Successfully accounting forcross-country income differences without ap-pealing to TFP gaps therefore either requireslarger earnings gains from migration or that
FIGURE 1mdashContinued
FIGURE 2 RATIO OF PREDICTED TO MEASURED SOURCE
COUNTRY EARNINGS
207VOL 92 NO 1 HENDRICKS HOW IMPORTANT IS HUMAN CAPITAL FOR DEVELOPMENT
migrants differ in their unmeasured skills fromnonmigrants
An additional challenge for the human-capital model is to account for the variation ofimmigrant earnings across host countries Thefact that immigrant earnings cluster around na-tive earnings in poor as well as in rich hostcountries arises naturally in the TFP model butposes a problem for models in which produc-tivity is embodied in workers For exampleIsraelrsquos capital-output ratio is close to that of theUnited States Hence the human-capital modeldoes not provide any reasons why the earningsof immigrants with identical measured skillsshould differ between Israel and the UnitedStates by a factor of 2
The following subsections examine whethertwo extensions help reconcile the model withthe data These extensions are self-selectionof emigrants in terms of unmeasured human-capital and skill complementarities5
B One Skill TypemdashNonrandomSelection of Migrants
A possible defense of the human-capitalmodel is that migrants are self-selected so thatthey possess more unmeasured human capitalthan nonmigrants The large earnings gap be-tween US immigrants and nonmigrants in poorsource countries (Figure 2) would then re ectstrong self-selection instead of large earningsgains In other words the reason why immi-grants earn several times more than predicted bythe human-capital model would then not be thatmigration leads to large earnings gains but thatimmigrants possess several times more unmea-sured human capital (sc) than nonmigrants withidentical characteristics However severalpieces of evidence suggest that unmeasuredself-selection is likely much smaller than nec-essary for reconciling the model with largecross-country earnings gaps6
Self-Selection Implied by the ModelmdashIt isinstructive to ask what degree of immigrantself-selection would be required to fully ac-count for cross-country income gaps based onhuman and physical capital alone First I cal-culate the predicted earnings of immigrants atsource country skill prices from (3)
w cIm 5 v~kc LcH Lc L AUS
3 Oj
Nc jUSh jhc j sc O
j
Nc jUS
Hence the predicted ratio of immigrant to meansource country native earnings is given by
(4) ERc 5wc
Im
wc5
yenj
Nc jUSh jhc j yen
j
Nc jUS
yenj
Nc j hjhc j yenj
Nc jsc
The interpretation is that immigrants shouldearn ERc times mean earnings if they returnedto their source countries The rst ratio re ectsmeasured skill differences It can be calculateddirectly from population weights in sourcecountries and of immigrants The factor sc re- ects self-selection in unmeasured skills If hu-man and physical capital fully account forcross-country earnings differences then sc 5wc
hwc In other words the self-selection factorssc equal the unexplained earnings gaps shownin Figure 2
These gures are easier to interpret whenexpressed as the implied positions of immi-grants in the source country earnings distribu-tion I assume that the distribution of earnings ineach country is lognormal with a standard de-viation that matches the quintile ratios reportedin Klaus Deininger and Lyn Squirersquos (1996)data set of inequality measures The lognormaldistribution approximates the earnings distribu-tions of several countries fairly closely exceptfor the very highest earnings levels (JohnCreedy 1985) Using Deininger and Squirersquosinequality measures likely understates the de-gree of migrant self-selection implied by themodel as their estimates represent income in-equality across the entire population which istypically larger than earnings dispersion amongthe labor force Figure 3 shows the implied
5 Given the limited evidence it is dif cult to quantify therole of possible human-capital spillovers See James ERauch (1993) and Daron Acemoglu and Joshua Angrist(2000) for attempts at measuring such spillovers
6 Section III subsection D builds on the evidence pre-sented here to quantify the contributions of human andphysical capital to cross-country income differences in thepresence of plausible degrees of self-selection
208 THE AMERICAN ECONOMIC REVIEW MARCH 2002
percentile positions of immigrants in the sourcecountry earnings distributions For several low-income countries the model predicts that thetypical immigrant should be drawn from the top1 percent of the observed earnings distribution(which does not include expatriates)
This strong degree of self-selection appearsespecially implausible for source countries withlarge emigrant populations The most strikingcase is Jamaica where 145 percent of the pop-ulation resided in the United States in 1990 yetthe mean immigrant must be drawn from the top01 percent of the earnings distribution Othercountries for which the fraction of the popula-tion residing in the United States exceeds thepredicted degree of self-selection include Guy-ana (152 percent vs 01 percent) Nicaragua(47 percent vs 44 percent) the Philippines(16 percent vs 06 percent) and Hungary (11percent vs 02 percent) Another case in whichstrong self-selection is unlikely is El SalvadorEdward Funkhouser (1992) estimates that 35percent of households have family membersliving abroad Furthermore he nds little self-selection of emigrants within households Yetthe human-capital model implies that the 91percent of the population residing in the UnitedStates in 1990 must be drawn from the top 111percent of the earnings distribution In thesecountries accounting for cross-country earningsdifferences based on human and physical capitalalone would require that the entire top of theearnings distribution (and only the top) has em-
igrated to the United States However otherevidence suggests that self-selection in unmea-sured skills is generally quite weak
Estimates of Emigrant Self-SelectionmdashThemost direct evidence suggesting weak self-selection in unmeasured skills comes from stud-ies that follow individual workers acrossborders Based on a sample of 490 recent USimmigrants Guillermina Jasso et al (1998) ndthat migrants on their last source country jobsearned 75 percent more than the mean sourcecountry worker However this gap is largelyaccounted for by differences in measured skillsImmigrants in their sample possess almost eightyears more schooling than nonmigrants With aMincerian return to schooling of 99 percent peryear which is the average in the 56-countrysample of George Psacharopoulos (1994) im-migrantsrsquo higher education accounts for morethan the entire earnings gap leaving little roomfor self-selection with respect to unmeasuredskills For Egypt Richard H Adams Jr (1993) nds that emigrants tend to be poorer thannonmigrants7
An indirect measure of self-selection can beobtained from return migrants If emigrantswere strongly self-selected return migrantsshould earn substantially more than never mi-grants However in the data the earnings ofboth groups are very similar suggesting thatself-selection is weak For Hungary CatherineY Co et al (1999) nd that female return mi-grants earn slightly more than never migrantswhereas the difference is insigni cant for maleworkers G M Arif (1998) estimates that Paki-stani return migrants earn less than those whonever migrated Alan Barrett and Philip JOrsquoConnell (2000) nd that male return migrantsin Ireland earn 10 percent more than nevermigrants although no wage premium is foundfor women For Puerto Rico Fernando ARamos (1992) nds that whether a worker is a
7 Earnings of political refugees provide another oppor-tunity for observing immigrant earnings where nonrandomselection appears unlikely For Cuban refugees arrivingduring the Mariel boatlift David Card (1990) nds thatafter controlling for measured skills their earnings differonly by 18 percent from those of previous Cuban immi-grants in Miami A more systematic investigation of refugeeearnings would be a useful task for future research
FIGURE 3 PREDICTED POSITION OF IMMIGRANTS IN SOURCE
COUNTRY EARNINGS DISTRIBUTION
209VOL 92 NO 1 HENDRICKS HOW IMPORTANT IS HUMAN CAPITAL FOR DEVELOPMENT
return migrant or even whether a person wasborn in the United States has little effect onearnings This pattern is precisely what the TFPmodel predicts earnings are determined bywhere a person works not by place of birth
Of course the fact that return migrants donot earn much more than those who neverleft the source countries could be due to the factthat return migrants are strongly negatively se-lected in terms of unmeasured skills Howeverrecent longitudinal studies of US immigrants nd that this is not the case Lubotsky (2000)estimates that return migrants earn around 15percent less than immigrants who stay in theUnited States
Additional evidence suggesting that self-selection is weak comes from estimates of mi-grant earnings gains Except for some very poorcountries with unusually low capital-output ra-tios the human-capital model predicts that im-migration should raise earnings by modestamounts or even not at all Yet empirical esti-mates of the earnings gains associated with mi-gration are typically large Jasso et al (1998) nd that controlling for purchasing power dif-ferences Chinese immigrants earn three timesmore in the United States than they did on theirlast home country job By contrast the modelpredicts earnings gains of only 21 percent Sim-ilarly Filipinos earn 25 times more in theUnited States while the model predicts an earn-ings improvement of only 6 percent The onlylow-income source country for which Jasso etal (1998) do not nd large earnings gains isMexico However their nding contrasts withother studies such as Richard W Cuthbert andJoe B Stevens (1981) or Douglas S Massey etal (1987) who nd that Mexican immigrantsearn around six times more in the United Statesthan in Mexico compared with a predicted gainof 17 percent For Puerto Ricans Ramos (1992) nds that controlling for migrant self-selectionworking in the United States doubles earningswhereas the model predicts an earnings gain ofonly 84 percent Large earnings gains due tomigration are also found for Pakistani workersin Saudi Arabia (around 800 percent Ha z APasha and Mir Anjum Altaf 1987) and in theMiddle East (Nadeem Ilahi and Saqib Jafarey1999) and for Egyptian emigrants (Adams1993) This evidence suggests that migratingfrom poor to rich countries results in earnings
gainsthatare considerablylarger thanthehuman-capital model predicts
One possible way of reconciling the human-capital model with large immigrant earningsgains is self-selection based on job matches8 Ifmigration occurs because workers have re-ceived attractive job offers then the earningsgap between immigrants and source countrynatives may in part re ect the high quality ofimmigrant job matches instead of differences inhuman capital Consistent with this hypothesisArnold De Silva (1997) nds that immigrantswho are admitted into Canada with prearrangedemployment enjoy higher earnings Howeverthe estimated earnings bene t of 17 percentaccounts for only a small fraction of the unex-plained gap between immigrant and sourcecountry earnings Moreover only around one in ve Canadian immigrants arrive with prear-ranged employment
A related concern is that skill-based ad-missions could induce strong immigrant self-selection This could be a problem for countriessuch as Canada which admits around 40percent of immigrants based on skill or em-ployment criteria However it is much lessof a concern for the United States where sincethe 1965 Immigration Act the bulk of immi-grants are admitted as relatives or familymembers of US residents The fraction ofskill-based admissions never exceeded 16 per-cent during the period 1988ndash1998 and most ofthese come from rich source countries (USImmigration and Naturalization Service 1998)Moreover while skill-based immigrants enjoyan initial earnings advantage over family mi-grants the gap vanishes after some years ofUS experience (Jasso and Mark R Rosenz-weig 1995 Harriet O Duleep and Mark CRegets 1996)
A nal reason to doubt the hypothesis ofstrong self-selection is that the earnings of im-migrants cluster around native earnings in allhost countries This arises naturally in a TFPmodel where the earnings of immigrants andnatives bene t equally from the country-speci c productivities of the host countries Bycontrast if productivity is embodied in workers
8 I am grateful to an anonymous referee for pointing outthis possibility
210 THE AMERICAN ECONOMIC REVIEW MARCH 2002
the fact that immigrant earnings are close tonative earnings requires a speci c pattern ofself-selection In particular immigrants frompoorer countries must be more positively se-lected (as measured in Figure 2) and immi-grants in poorer host countries must be lesspositively selected
Accounting for Cross-Country EarningsGaps with Stronger Migrant Self-SelectionmdashTaken together this evidence suggests that mi-grant self-selection in unmeasured skills islikely weak If this is the case then the esti-mates of Section III subsection A quantify thecontributions of human and physical capital tocross-country earnings gaps It is however use-ful to examine the robustness of these ndingsagainst the possibility of stronger self-selectionin unmeasured skills The evidence reviewedearlier indicates that unmeasured self-selectionis weaker than measured self-selection In termsof the model this means that the sc factors aresmaller than the ratio of measured skills ofimmigrants relative to source country natives[the rst term in equation (4)] Setting the scequal to these ratios should therefore overstateunmeasured selection It implies that immi-grants are drawn from the top 5 percent of thesource country earnings distribution for eightcountries in the sample and that immigrants inthe low-income sample possess 23 times morehuman capital than nonmigrants This degree ofself-selection is far greater than the evidencepresented earlier suggests Still large cross-country income gaps remain unaccounted forOutput per worker is overpredicted by a factorof 2 for the low-income sample and by a factorof 5 for the poorest ve countries I concludethat plausible degrees of unmeasured self-selection do not overturn the nding thatphysical- and human-capital accumulation failto account for a large part of cross-countryincome differences
C Multiple Skill Types
In neoclassical growth models it is typicallyassumed that workers of different skill levelsare perfect substitutes in production Relaxingthis assumption might help reconcile the modelwith the data If skilled and unskilled labor arepoor substitutes countries where skilled labor is
scarce may have low average earnings eventhough a typical unskilled worker possesses thesame amount of human capital in all countriesMigration then leads to large wage gains forunskilled workers because they bene t from thelarger supply of skilled labor in the hostcountry9
In order to empirically implement the modelwith two skill types it is necessary to de newhich education classes belong to each skillBarro and Leersquos (2000) data distinguish seveneducation classes for the source countries (noformal schooling primary secondary or higherschooling attained or completed) A commonapproach is to count only college graduates asskilled For this case Per Krusell et al (2000)estimate a substitution elasticity between skilledand unskilled labor of 167 However whenapplied across countries these parameters yieldskill premia in poor countries that are up to tentimes larger than in the United States Obtainingreasonable skill premia requires a broader def-inition of skill and a higher substitution elastic-ity In what follows I de ne workers with atleast completed secondary education as skilledThe substitution elasticity is set to 5 so that themodel matches the mean skill premium in thelow-income sample Experimentation with al-ternative skill de nitions or substitution elastic-ities either reduces the explanatory power of themodel or results in unreasonable skill premia10
The implications of the two skill model forsource country earnings are shown in Fig-ure 411 Comparing the ndings with those ofFigure 1 for the one skill model reveals thatimperfect substitutability of skills improves themodelrsquos ability to account for large cross-country income differences However the gapsbetween source country earnings in the data andthe model predictions shown in Figure 5 re-main large In the full sample physical andhuman capital account for a reduction in relativeearnings to 058 leaving an unexplained ratio of
9 I am grateful to Michele Boldrin for suggesting thisextension
10 The Technical Appendix (available upon request)shows that the qualitative conclusions reported here carryover to the case where skill types are not observed by theeconometrician
11 The Technical Appendix (available upon request) re-ports the underlying data
211VOL 92 NO 1 HENDRICKS HOW IMPORTANT IS HUMAN CAPITAL FOR DEVELOPMENT
19 As in the one skill case the unexplainedgaps are larger for poorer countries In the low-income sample predicted earnings are 26 timeslarger than measured earnings and for the poor-est ve countries the factor of overprediction is56
The reason for the limited improvement is thehigh substitution elasticity of skilled and un-skilled labor However the skill premia pre-dicted for poor countries are on average closeto those calculated from source country Mincerregressions This indicates that reducing thesubstitution elasticity substantially below 5would lead to unreasonable skill premia To
illustrate reducing the substitution elasticity to3 raises skill premia roughly 50 percent abovethose observed in the data
As in the one skill model it is useful to askwhether stronger migrant self-selection in-creases the ability of human and physical capitalto account for cross-country earnings gaps As aproxy for unmeasured self-selection I again setthe sc factors equal the ratios of measured skillsof immigrants relative to source country na-tives Consistent with the ndings for the oneskill case the implied ratios of predicted tomeasured earnings per worker remain large Forthe low-income sample output per worker is
FIGURE 4 DECOMPOSITION OF CROSS-COUNTRY EARNINGS DIFFERENCES TWO SKILL MODEL
212 THE AMERICAN ECONOMIC REVIEW MARCH 2002
overpredicted on average by a factor of 17while the corresponding factor for the poorest ve countries is 36 I conclude that while im-perfect skill substitution improves the explana-
tory power of the model large income gapsremain unaccounted for
D Comparison with Other Estimates
This subsection compares the decompositionof cross-country income gaps presented in thisarticle with estimates reported in the litera-ture12 My ndings are directly comparable tothose of Hall and Jones (1999) Except for themethod of measuring human capital their ac-counting framework is the same as the onedescribed in Section I As a result their esti-mates of the contribution of physical capital tocross-country output differences are close tomine Hall and Jones estimate human-capitalstocks based on Mincer regressions that arecommon to all countries together with meanyears of schooling taken from an earlier version
12 An interesting attempt at quantifying the role of hu-man capital in an environment with skill-speci c technolo-gies is presented in Acemoglu and Fabrizio Zilibotti (2001)
FIGURE 4mdashContinued
FIGURE 5 RATIO OF PREDICTED TO MEASURED SOURCE
COUNTRY EARNINGS IN THE TWO SKILL MODEL
213VOL 92 NO 1 HENDRICKS HOW IMPORTANT IS HUMAN CAPITAL FOR DEVELOPMENT
of Barro and Leersquos data Figure 6 plots theirestimates of human capital per worker relativeto the United States against those derived herefor the one skill model In spite of this verydifferent estimation method the two estimatesare highly correlated (the correlation coef cientis 082) For countries in the low-income sam-ple human capital accounts for a reduction inoutput per worker relative to the United Statesof 44 percent according to Hall and Jonesrsquosestimates compared with 36 percent based onthe one skill model It is easy to see why the twoestimates are close Hall and Jonesrsquos estimationframework assumes that the human-capital en-dowments of workers with identical schoolingare the same in all countries The approachpursued here estimates these human-capitalendowments from immigrant earnings butreaches a similar conclusion
My ndings are also consistent with those ofKlenow and Rodrotilde guez-Clare (1997a) who de-velop measures of country human-capital stocksbased on a Mincerian earnings function Thecontribution of human and physical capital tocross-country output differences is measured byregressing the logarithm of predicted output perworker on the logarithm of observed output perworker In my notation the regression equationis given by ln(wc
h ) 5 b0 1 b1ln(wc) 1 laquoc
where laquoc is a stochastic error term One inter-pretation is that the fraction b1 of the cross-country variance in log output is accounted forby physical and human capital Klenow andRodrotilde guez-Clare nd that b1 is likely less than05 with the exact gure depending on assump-tions about the production and measurement ofhuman capital Replicating this regression in myfull sample yields an estimate of b1 5 038(standard error 004) for the one skill model andof b1 5 045 (standard error 005) for the twoskill model Consistent with the nding that theunexplained output gaps are larger for poorercountries the low-income sample yields smallerestimates of b1 (027 in the one skill model and038 in the two skill model) The fact that myestimates are consistent with those of Hall andJones (1999) and Klenow and Rodrotilde guez-Clare(1997a) suggests that the implications for thesources of cross-country income gaps are robustagainst alternative methods of constructingcountry human-capital stocks
IV Conclusion
This paper offers new evidence on thesources of cross-country income differences Itexploits the idea that immigrant workers pro-vide an opportunity to estimate the human-capital endowments of workers from a varietyof source countries based on earnings attainedin a common labor market This approach cap-tures both observed and unobserved skill differ-ences without having to postulate a particularhuman-capital production function Immigrantearnings data suggest that cross-country differ-ences in unobserved skills are much smallerthan cross-country income gaps As a result myestimates strongly reject the hypothesis that hu-man and physical capital account for the bulk ofcross-country income differences
For a sample of low-income countries hu-man and physical capital account for a reductionin output per worker to one-half of the USlevel compared with one- fth in the data Al-lowing for skill complementarities and strongerimmigrant self-selection still leaves an averageincome gap of 17 unexplained For the poorest ve countries in the sample output per workerimplied by human- and physical-capital differ-ences is at least 36 times larger than in the dataThis evidence is consistent with Prescottrsquos
FIGURE 6 CONTRIBUTION OF HUMAN CAPITAL TO OUTPUT
PER WORKER DIFFERENCES
Notes The vertical axis shows source country output perworker relative to the United States implied by the human-capital stock estimates of Hall and Jones (1999) The hori-zontal axis shows the corresponding values predicted by theone skill model
214 THE AMERICAN ECONOMIC REVIEW MARCH 2002
(1998) conclusion that accounting for cross-country income differentials requires a theory oftotal factor productivity
APPENDIX A CENSUS DATA
Census data are taken from the 1990 PUMS5-percent State Sample data les Individuals areexcluded from the sample if they reside in groupquarters are younger than 20 years or older than69 years do not work at least 30 hours per weekand 40 weeks per year or are self-employed Inaddition observations are deleted if weekly hoursexceed 120 or annual earnings are less than $500Such cases are exceedingly rare and likely dueto measurement error Immigrants are alsodropped if they arrived in the United States beforeage 20 This excludes immigrants who attainedmost of their education in the United States In-creasing the lowest arrival age to 24 makes littledifference The resulting sample contains 22 mil-lion natives and 178000 immigrants When aver-aging over male and female workers xedweights of 06 and 04 are used This avoids count-ing differences in gender ratios as differences inhuman capital Observations are sorted into thefollowing classes
Years of schooling 0ndash4 5ndash8 9ndash11 12 13ndash14 151Age 20ndash24 25ndash29 30ndash34 35ndash39 40ndash4445ndash49 50ndash54 55ndash59 60ndash64 64ndash69Sex Male or femaleBirthplace According to Penn World Tablecountry codes
Annual work hours are calculated fromldquoweeks worked last yearrdquo and ldquohours usuallyworked per weekrdquo Labor earnings are calcu-lated from ldquowage and salary incomerdquo whichdoes not include self-employment income Thevariable ldquoeducational attainmentrdquo gives years ofschooling in an intervallic format Each personis assigned its interval midpoint as years ofschooling
APPENDIX B SOURCE COUNTRY DATA
Data on source country aggregates are gen-erally taken from the Penn World Table Mark56 Capital-output ratios are taken fromMcGrattan and Schmitz (1998) but results are
very similar if Penn World Table data are usedinstead For four countries capital stock data arenot available (Belize Dominica Hungary andPoland) In these cases I impute a capital-outputratio by regressing ln(capital stock per worker)on ln(real GDP per worker)
For the two skill model it is necessary tocalculate source country earnings by skill typeMincer regressions are used to calculate therelative earnings of skilled to unskilled workersin the source countries Psacharopoulos (1994)provides sources for a large number of coun-tries which are updated in Bils and Klenow(2000) Only earnings regressions that do notcontrol for additional variables which might becorrelated with educationexperience are usedMoreover the underlying samples must be rep-resentative for a signi cant fraction of thesource country workforce Additional detail isprovided in a Technical Appendix which isavailable from the author
Educational AttainmentmdashIn order to calcu-late the contribution of measured skills to cross-country income differences it is necessary toconstruct the joint distribution of age and edu-cational attainment for each country Data fromthree sources are used Barro and Lee (2000)report the population fractions pc in each ofc 5 1 7 educational attainment classesThe US Bureau of the Census InternationalData Base provides the population fraction main each of a 5 1 9 age classes Theobjective is to construct the joint distributionPr(c a) in such a way that the marginal dis-tributions pc and ma are respected
The algorithm draws on OECD data whichprovide conditional fractions Pr( jza) for a sub-set of 39 countries where j 5 1 3 indexeseducation classes Following Barro and Lee(2000) I map the c classes into the j classes asfollows Class j 5 1 captures persons with lessthan upper secondary education and is mappedinto Barro-Lee classes c 5 1 4 Class j 52 contains persons who completed upper sec-ondary education and corresponds to c 5 5Finally j 5 3 refers to tertiary education andcorresponds to c 5 6 7
The conditional fractions Pr( jza) are ex-tended to the ner c classes according toPr(cza) 5 Pr( jza)pcyenc [ Jj
pc where Jj de-notes the set of c classes that are mapped into
215VOL 92 NO 1 HENDRICKS HOW IMPORTANT IS HUMAN CAPITAL FOR DEVELOPMENT
class j This scales the marginal fractions pcsuch that the Pr( jza) are respected Constructingthe joint distribution according to Pr(c a) 5Pr(cza)ma would respect the age marginals mabut not the education marginals pc Therefore acorrection term Dpc 5 pc 2 yena Pr(c a) isadded to each column of Pr(c a) so that theresulting joint distribution respects both ma and
pc while capturing the observation that youngerpersons have higher educational attainmentcontained in the OECD data Countries not con-tained in the OECD data set are divided intothree classes based on whether real GDP perworker is below or above one-third of the USlevel Their Pr( jza) are replaced by the averagesacross countries in their income class
[Table B1 follows]
TABLE B1mdashSOURCE COUNTRY AND IMMIGRANT CHARACTERISTICS
Acemoglu Daron and Angrist Joshua ldquoHowLarge Are Human Capital Externalities Ev-idence from Compulsory Schooling Lawsrdquoin Ben S Bernanke and Kenneth Rogoffeds NBER macroeconomics annual 1997Cambridge MA MIT Press 2000 pp 5ndash59
Acemoglu Daron and Zilibotti Fabrizio ldquoPro-ductivity Differencesrdquo Quarterly Journal ofEconomics May 2001 116(2) pp 563ndash606
Adams Richard H Jr ldquoThe Economic and De-mographic Determinants of International Mi-gration in Rural Egyptrdquo Journal ofDevelopment Studies October 1993 30(1)pp 146ndash67
Notes PWT No is the Penn World Table 56 country number Relative RGDPW denotes real GDP per worker relative to theUnited States in 1990 Data for 1990 are not available for ve countries In four of these cases 1989 RGDPW is used insteadFor Iraq 1987 RGDPW is reported KY is the capital-output ratio taken from McGrattan and Schmitz (1998) Two de nitionsof relative immigrant earnings are shown Unadjusted relative earnings denote mean earnings per immigrant divided by meanearnings per native-born worker Adjusted relative earnings are de ned as the ratio of immigrant earnings per worker relativeto native-born workers with identical age education and sex Average years of schooling are taken from Barro and Lee (2000column BL) from a sample of source country Mincer regressions (column Mincer not available for all countries) and fromimmigrant data (Immigrant) The gures shown in column BL are calculated by assigning respectively the values 0 25 6510 12 13 and 17 years of schooling to the seven education categories reported in Barro and Lee (2000) N denotes thenumber of immigrants observed in the Census sample
217VOL 92 NO 1 HENDRICKS HOW IMPORTANT IS HUMAN CAPITAL FOR DEVELOPMENT
Arif G M ldquoReintegration of Pakistani ReturnMigrants from the Middle East in the Domes-tic Labour Marketrdquo Pakistan DevelopmentReview Summer 1998 37(2) pp 99ndash124
Barrett Alan and OrsquoConnell Philip J ldquoIs There aWage Premium for Returning Irish Mi-grantsrdquo IZA working paper Bonn 2000
Barro Robert and Lee Jong-Wha ldquoInternationalData on Educational Attainment Updatesand Implicationsrdquo National Bureau of Eco-nomic Research (Cambridge MA) WorkingPaper No 7911 2000
Beggs John J and Chapman Bruce J ldquoMaleImmigrant Wage and Unemployment Expe-rience in Australiardquo in John M Abowd andRichard B Freeman eds Immigrationtrade and the labor market Chicago Uni-versity of Chicago Press 1991 pp 369ndash84
Bell Brian D ldquoThe Performance of Immigrantsin the United Kingdom Evidence from theGHSrdquo Economic Journal March 1997107(441) pp 333ndash44
Bils Mark and Klenow Peter J ldquoDoes SchoolingCause Growthrdquo American Economic Re-view December 2000 90(5) pp 1160ndash83
Bloom David E and Gunderson Morley ldquoAnAnalysis of the Earnings of Canadian Immi-grantsrdquo in John M Abowd and Richard BFreeman eds Immigration trade and thelabor market Chicago University of Chi-cago Press 1991 pp 321ndash42
Borjas George J International differences in thelabor market performance of immigrantsKalamazoo MI W E Upjohn Institute ofEmployment Research 1988
Card David ldquoThe Impact of the Mariel Boatlifton the Miami Labor Marketrdquo Industrial andLabor Relations Review January 199043(2) pp 245ndash57
Co Catherine Y Gang Ira N and Yun Myeong-Su ldquoReturns to Returningrdquo Working paperRutgers University 1999
Creedy John Dynamics of income distributionOxford Blackwell 1985
Cuthbert Richard W and Stevens Joe B ldquoTheNet Economic Incentive for Illegal MexicanMigration A Case Studyrdquo International Mi-gration Review Fall 1981 15(3) pp 543ndash49
Deininger Klaus and Squire Lyn ldquoA New DataSet Measuring Income Inequalityrdquo World
Bank Economic Review September 199610(3) pp 565ndash91
De Silva Arnold ldquoEarnings of ImmigrantClasses in the Early 1980s in Canada AReexaminationrdquo Canadian Public PolicyJune 1997 23(2) pp 179ndash202
Duleep Harriet O and Regets Mark C ldquoAdmis-sion Criteria and Immigrant Earnings Pro- lesrdquo International Migration ReviewSummer 1996 30(2) pp 571ndash90
Edin Per-Anders LaLonde Robert J and Arings-lund Olof ldquoEmigration of Immigrants andMeasures of Immigrant Assimilation Evi-dence from Swedenrdquo Working paper Uni-versity of Chicago 2000
Friedberg Rachel ldquoYou Canrsquot Take It WithYou Immigrant Assimilation and the Porta-bility of Human Capitalrdquo National Bureau ofEconomic Research (Cambridge MA) Work-ing Paper No 5837 1996
Funkhouser Edward ldquoMass Emigration Remit-tances and Economic Adjustment The Caseof El Salvador in the 1980srdquo in George JBorjas and Richard B Freeman eds Immi-gration and the work force Economic con-sequences for the United States and sourceareas Chicago University of Chicago Press1992 pp 135ndash75
Gollin Douglas ldquoGetting Income SharesRight Self-Employment UnincorporatedEnterprise and the Cobb-Douglas Hypoth-esisrdquo Working paper Williams College1997
Hall Robert E and Jones Charles I ldquoWhy DoSome Countries Produce So Much More Out-put Per Worker Than Othersrdquo QuarterlyJournal of Economics February 1999114(1) pp 83ndash116
Hayfron John E ldquoThe Performance of Immi-grants in the Norwegian Labor MarketrdquoJournal of Population Economics May 199811(2) pp 293ndash303
Husted Leif Nielsen Helena S Rosholm Mi-chael and Smith Nina ldquoEmployment andWage Assimilation of Male First GenerationImmigrants in Denmarkrdquo IZA DiscussionPaper No 101 Bonn 2000
Ilahi Nadeem and Jafarey Saqib ldquoGuestworkerMigration Remittances and the ExtendedFamily Evidence from Pakistanrdquo Journal ofDevelopment Economics April 1999 58(2)pp 485ndash512
218 THE AMERICAN ECONOMIC REVIEW MARCH 2002
Jasso Guillermina and Rosenzweig Mark R ldquoDoImmigrants Screened for Skills Do Betterthan Family-Reuni cation Immigrantsrdquo In-ternational Migration Review Spring 199529(1) pp 85ndash111
Jasso Guillermina Rosenzweig Mark R andSmith James P ldquoDeterminants of Immi-grantsrsquo Economic Gains from ImmigrationrdquoWorking paper University of Pennsylvania1998
Klenow Peter J and Rodrotilde guez-Clare AndresldquoThe Neoclassical Revival in Growth Eco-nomics Has It Gone Too Farrdquo in Ben SBernanke and Julio J Rotemberg edsNBER macroeconomics annual 1997 Cam-bridge MA MIT Press 1997a pp 73ndash103
ldquoEconomic Growth A Review EssayrdquoJournal of Monetary Economics December1997b 40(3) pp 597ndash617
Krusell Per Ohanian Lee E R otilde os-Rull Jose-V otilde ctor and Violante Giovanni ldquoCapital-SkillComplementarity and Inequality A Macro-economic Analysisrdquo Econometrica Septem-ber 2000 68(5) pp 1029ndash53
Lubotsky Darren ldquoChutes or Ladders A Lon-gitudinal Analysis of Immigrant EarningsrdquoWorking paper Princeton University 2000
Mankiw N Gregory Romer David and WeilDavid N ldquoA Contribution to the Empirics ofEconomic Growthrdquo Quarterly Journal ofEconomics May 1992 107(2) pp 407ndash37
Massey Douglas S Alarcon Rafael DurandJorge and Gonzalez Humberto Return toAztlan The social process of internationalmigration from western Mexico BerkeleyCA University of California Press 1987
McGrattan Ellen R and Schmitz James A JrldquoExplaining Cross-Country Income Differ-encesrdquo Federal Reserve Bank of MinneapolisStaff Report No 250 July 1998
Olson Mancur Jr ldquoDistinguished Lecture onEconomics in Government Big Bills Left onthe Sidewalk Why Some Nations Are Richand Others Poorrdquo Journal of Economic Per-spectives Spring 1996 10(2) pp 3ndash24
Organization for Economic Cooperation and De-velopment Education at a glance OECD in-dicators Paris Centre for EducationalResearch and Innovation 2001
Pasha Ha z A and Altaf Mir Anjum ldquoReturnMigration in a Life-Cycle Setting An Ex-ploratory Study of Pakistani Migrants inSaudi Arabiardquo Pakistan Journal of AppliedEconomics Summer 1987 6(1) pp 1ndash21
Prescott Edward C ldquoNeeded A Theory of TotalFactor Productivityrdquo InternationalEconomicReview August 1998 39(3) pp 525ndash51
Psacharopoulos George ldquoReturns to Investmentin Education A Global Updaterdquo World De-velopment September 1994 22(9) pp 1325ndash43
Ramos Fernando A ldquoOut-Migration and ReturnMigration of Puerto Ricansrdquo in George JBorjas and Richard B Freeman eds Immi-gration and the work force Economic con-sequences for the United States and sourceareas Chicago University of Chicago Press1992 pp 49ndash66
Rauch James E ldquoProductivity Gains from Geo-graphic Concentration of Human Capital Ev-idence from the Citiesrdquo Journal of UrbanEconomics November 1993 34(3) pp 380ndash400
Romer Paul ldquoIdea Gaps and Object Gaps inEconomic Developmentrdquo Journal of Mone-tary Economics December 1993 32(3) pp543ndash73
Schmidt Christoph M ldquoImmigrant Performancein Germany Labor Earnings of Ethnic Ger-man Migrants and Foreign Guest-WorkersrdquoQuarterly Review of Economics and Finance1997 Spec Iss 37 pp 379ndash97
Topel Robert ldquoLabor Markets and EconomicGrowthrdquo Working paper University of Chi-cago 1998
US Department of Commerce Bureau of theCensus 1990 census of population and hous-ing Washington DC US GovernmentPrinting Of ce 1990
US Immigration and Naturalization Service1998 statistical yearbook Washington DCUS Government Printing Of ce 1998
Venturini Alessandra and Villosio ClaudialdquoForeign Workers in Italy Are They Assim-ilating to Natives Are They CompetingAgainst Natives An Analysis by the SSADatasetrdquo Working paper University of Ber-gamo 1998
219VOL 92 NO 1 HENDRICKS HOW IMPORTANT IS HUMAN CAPITAL FOR DEVELOPMENT
ences The model decomposes these incomedifferences into the contributions of physicalcapital observed skills (such as education andexperience) unobserved skills as measured byrelative immigrant earnings and a total factorproductivity residual
Immigrant earnings are estimated from USCensus data (US Department of Commerce Bu-reau of the Census 1990) A key observation isthat the gap between immigrant and native earn-ings is less than 25 percent for most source coun-tries suggesting that cross-country differences inunobserved skills are much smaller than cross-country income gaps As a result human- andphysical-capital accumulation account for only afraction of cross-country income differences Fora sample of low-income countries which produceon average 18 percent of US output per workerhuman and physical capital account for a reduc-tion in output to 53 percent of the US levelleaving a factor of 3 unexplained For the poorest ve countries in the sample output per worker isoverpredicted by a factor of 8
A possible objection against this approach isthat immigrant self-selection could drive awedge between the unmeasured human-capitalendowments of immigrants and source countryworkers If immigrants are positively selectedthen relative immigrant earnings overstate thehuman-capital endowments of the source coun-tries However reasonable degrees of self-selection do not alter the qualitative ndingsFully accounting for observed cross-country in-come differences on the basis of human andphysical capital implies that immigrants frompoor source countries must possess severaltimes more human capital than source countryworkers Yet data on the earnings of emigrantsand return migrants suggest that self-selectionin unobserved skills is rather modest Even al-lowing for degrees of self-selection that arelarger than the data suggest implies that human-and physical-capital differences fail to accountfor large part of observed cross-country incomegaps For a sample of low-income countrieshuman and physical capital account for a reduc-tion of output per worker to 36 percent of theUS level compared with 18 percent in thedata For the poorest ve countries in the sam-ple output per worker is overpredicted by afactor of 5
The paper then considers whether skill
complementarities could increase the ability ofhuman capital to account for large cross-countryincome differences Scarcity of skilled labormay depress unskilled wages in poor countriesThis might help explain why migrants experi-ence large earnings gains even though un-skilled workers possess the same human-capitalendowments in all countries I nd that skillcomplementarities improve the ability of humanand physical capital to account for cross-country income differences but output perworker remains overpredicted by factors of 2 ormore for low-income countries
I conclude that data on immigrant earn-ings are dif cult to reconcile with the viewthat differences in human and physical capitalaccount for the bulk of the observed cross-country income dispersion The data are moreconsistent with Prescottrsquos (1998) conclusionthat accounting for large income differencesacross countries requires a theory of total factorproductivity
A number of other papers have recently of-fered empirical critiques of augmented neoclas-sical models (see Klenow and Rodrotilde guez-Clare1997a Prescott 1998 Mark Bils and Klenow2000) The main advantage of the approachtaken here is that it requires few assumptionsbeyond those maintained in virtually all ver-sions of neoclassical growth models (most im-portantly that factors are paid their marginalproducts) It therefore avoids issues related tothe measurement of human capital that underliethe current controversy about the importance ofhuman capital for cross-country incomedifferences
The rest of the paper is organized as followsSection I lays out the model and derives itsimplications for cross-country earnings differ-ences Section II describes the data and dis-cusses measurement issues The empirical ndings are presented in Section III Section IVconcludes
I The Model
This section develops a model that encom-passes the two competing hypotheses aboutcross-country income differences human-capitalgaps and productivity gaps Output per workerdepends on a countryrsquos stocks of human andphysical capital as for example in Mankiw et al
199VOL 92 NO 1 HENDRICKS HOW IMPORTANT IS HUMAN CAPITAL FOR DEVELOPMENT
(1992) But it also depends on a countryrsquos levelof total factor productivity as suggested by Pres-cott (1998) A parameterized version of themodel is used below to investigate to whatextent capital accumulation can account for thelarge cross-country income differences ob-served in the data
Each country indexed by c is inhabited bylarge numbers of workers indexed by i Aggre-gate output is produced from physical capital(Kc) and labor (Lc) using a Cobb-Douglas pro-duction function
(1) Yc 5 K cu~Ac Lc
1 2 u
Labor input is an aggregate of skilled and un-skilled labor inputs Lc 5 G(LcH LcL) Thisspeci cation allows for complementarity be-tween skilled and unskilled workers while re-taining a constant capital share in nationalincome All markets are competitive Firms rentphysical capital and labor services from house-holds so as to maximize period pro ts givenfactor prices From the rst-order condition therental price of labor of skill s is
(2) vc s 5 ~1 2 uA c1 2 u~K c Lc
uG s
where Gs denotes the derivative of G with re-spect to labor of skill s Competition in factormarkets ensures that effective capital-labor ra-tios (KcLc) and thus capital-output ratios(kc 5 KcYc) are equalized across workerswithin a country2 Hence the wage rates may bewritten as functions of labor inputs and thecapital-output ratio
vc s 5 vs ~kc Lc H Lc L Ac
5 ~1 2 uAckcu~1 2 uG s ~Lc H Lc L
Earnings per worker in country c are then givenby
(3) w c s 5 vs ~kc Lc H Lc L Ac Lc s Nc s
where Ncs denotes the number of workers withskill s in c Within a skill class individualearnings are thus proportional to workersrsquo en-dowments of labor ef ciency units In whatfollows I shall assume that the labor aggregatoris of the constant elasticity of substitution type
G~Lc H Lc L 5 ~rH Lc Hz 1 rL Lc L
z 1z
with elasticity of substitution a 5 (1 2 z)21The labor weights are normalized such that rH1 rL 5 1 I also consider the special casewhere the skill types are perfect substitutesG(LcH LcL) 5 LcH 1 LcL
In the empirical implementation the skill typeswill be identi ed with education levels In order toaccount for earnings differences within skillclasses for example by age education or sex thelabor force is further subdivided into J classesWorkers in classes j belonging to the set Js areendowed with hjhcj ef ciency units of labor ofskill type s The hj capture relative labor ef cien-cies across skill classes that are common acrosscountries while the hcj capture the ef ciency ofcountry c workers relative to a reference countrywithin a skill class This reference country will bethe United States for which I normalize hUSj 5 1If the number of class j workers in country c isdenoted by Ncj then country crsquos labor endow-ments are given by
Lc s 5 yen j [ Js N c j h jhc j
A number of reasons why observationally iden-tical workers may differ in human-capital levelsacross countries have been suggested in theliterature Examples include differences inschool quality or in the human capital of teach-ers (Bils and Klenow 2000) I shall refer todifferences in hc j as unmeasured skill differ-ences In the empirical implementation thesewill be estimated from immigrant earnings
The model nests the two competing hypoth-eses about cross-country income differences asspecial cases In order to capture their implica-tions clearly I de ne two versions of the modelmeant to represent the two hypotheses Thehuman-capital model assumes that total factor
2 A possible concern is that binding minimum-wage lawsmight drive a wedge between wage rates and marginalproducts for immigrants from poor source countries How-ever in the data the bulk of immigrants earns considerablymore than the minimum wage
200 THE AMERICAN ECONOMIC REVIEW MARCH 2002
productivity does not differ across countriesAc 5 A The total factor productivity (TFP)model assumes that unmeasured skills do notdiffer across countries (hc j 5 1)
A A Decomposition of Cross-CountryIncome Differences
This section presents an empirical frameworkfor quantifying the contributions of physicaland human capital to cross-country income dif-ferences The approach is to choose parametersof the production function such that US laborand capital inputs yield the earnings received byUS native-born workers The contributions ofphysical and human capital to cross-countryearnings differences are then quanti ed by se-quentially replacing the US estimates of thecapital-output ratio (kc) the populationweights(Nc j) and the unmeasured skill levels (hc j)with their source country counterparts in theproduction function The implied sequence ofearnings per worker calculated from (3) de-composes the gap between US and sourcecountry earnings per worker into the contribu-tions of physical capital measured and unmea-sured skills Speci cally I de ne the followingearnings per worker concepts
1 Earnings per worker of skill type s in theUnited States are given by
wUS s
5 vs ~kUS LUS H LUSL AUS LUSs NUS s
which can be estimated from US Censusdata
2 Replacing the US capital-labor ratio kUSwith its source country counterpart kc yields
wc sk
5 v s ~kc LUS H LUSL AUS LUSs NUS s
The ratio wcsk wUSs measures the contri-
bution of physical capital to cross-countryearnings differences
3 Using source country population weights tocalculate labor endowments yields
w c sN 5 v s ~kc Lc H
N Lc LN AUS Lc s
N Nc s
where LcsN 5 yen j [ Js
Nc jhj The ratio wcsN
wcsk measures the contribution of observed
skills (education and experience) to earn-ings differences
4 Using immigrantsrsquo unmeasured skills to cal-culate labor endowments yields
w c sh 5 v s ~kc Lc H
h Lc Lh AUS Lc s
h Nc s
where Lcsh 5 yenj [ Js
Nc jhjhc jsc Theunmeasured skills of immigrants differfrom source country ef ciencies (hc j) bya factor of sc re ecting self-selectionThe ratio wcs
h wcsN measures the contribu-
tion of unobserved skills to earnings dif-ferences before accounting for possibleself-selection of immigrants
5 Using source country unmeasured skills tocalculate labor endowments yields
wc sP 5 v s ~kc LcH Lc L AUS Lc s N c s
where Lcs 5 yen j [ JsNc jh jhc j are the
source country labor endowments wcsP is
the predicted level of earnings per workerin country c according to the human-capital model
6 Measured earnings per worker in country care denoted by wcs The ratio wcs
P wcs rep-resents the human-capital modelrsquos predictionerror One interpretation is that this residualis due to differences in total factor produc-tivities across countries Parameters of theproduction function are chosen such that forthe United States the predicted and the mea-sured earnings levels coincide wUSs
P 5 wUSsFor each earnings concept I also de ne anaverage over skill types For example meanearnings per worker in the United States aregiven by wUS 5 yens wUSsNUSsNUS
Strictly speaking the predictions of themodel apply only immediately after arrival inthe host country For earlier arrivals postmigra-tion human-capital investments could break therelationship between source country and immi-grant earnings However immigrant earningsgrowth does not differ suf ciently from nativeearnings growth to make a difference GeorgeJ Borjas (1988) and Darren Lubotsky (2000)
201VOL 92 NO 1 HENDRICKS HOW IMPORTANT IS HUMAN CAPITAL FOR DEVELOPMENT
estimate that immigrant earnings increase by10ndash13 percent relative to native earnings duringthe rst 20 years after migration While theseearnings changes are large in absolute termsthey are small compared with cross-country in-come differences of up to 30 It is thereforeunlikely that postmigration skill investments in-validate the predictions of the human-capitalmodel In order to verify this conjecture I re-strict the sample to immigrants who arrived atmost 10 years ago and con rm that this does notsigni cantly alter the ndings reported below
A related concern is that some skills may notbe fully transferable across borders (RachelFriedberg 1996) Immigrant earnings wouldthen underestimate source country human-capital endowments This would strengthen mymain conclusion that human capital accountsfor only moderate fractions of cross-countryearnings gaps
The TFP model matches cross-country earn-ings differences by construction the Ac can bechosen such that predicted and measured earn-ings coincide However it makes a testableprediction about immigrant earnings Immi-grants should earn the same as natives withidentical measured skills for all source and hostcountries
II Data and Empirical Implementation
This section provides an outline of the dataand empirical procedures Appendix B providesadditional details as well as data for all coun-tries contained in my sample (see Table B1)The full sample consists of 67 countries forwhich suf cient data are available I also reportresults for a low-income sample which contains37 countries with real per capita GDP perworker below 40 percent of the US level Theobjects to be estimated are the parameters of theproduction function (u Ac rH z) the capital-output ratios (kc) the relative labor ef cienciesof different skill classes (hj hc j) the degree ofimmigrant self-selection with respect to unmea-sured skills (sc) the population weights Nc j and source country mean earnings wcs
Labor Ef cienciesmdashThe relative labor ef -ciencies of workers from different countries areestimated from the earnings of US immigrantsA sample of native- and foreign-born workers is
drawn from the 1990 US Census of Populationand Housing 5-percent State Sample data lesResults for 1980 are similar All results arereported as averages over male and femaleworkers The sample is restricted to full-timeworkers between the ages of 20 and 69 whoreport positive earnings and who are not self-employed and do not live in group quartersOnly immigrants who arrived at age 20 or laterare included so as to ensure that most schoolingwas completed in the source countries3 Coun-tries with fewer than 150 observations for eachsex are dropped For the two skill case theminimum number of observations is 40 per sexand skill class The resulting sample consists of106263 immigrants
For each sex and country of birth workersare sorted into J 5 60 classes according to ageand education The labor ef ciency coef cientsare calculated as mean earnings per hour inclass j For US natives these represent hj while for immigrants they represent the prod-ucts hc jhjsc Small sample sizes make it dif -cult to estimate immigrant earnings preciselyfor all J classes I therefore assume that hc j isthe same for all classes within a given skill type( j [ Js) Labor ef ciencies are converted intoannual earnings per worker assuming that meanhours worked equal 2100 per year for allclasses A potential dif culty with the approachis self-selection The unmeasured skills of im-migrants may differ from those of source coun-try natives In terms of the model the sc factorscould be different from one This problem willbe addressed in Section III subsection B
Production Function ParametersmdashThe pro-ductivity parameter AUS is chosen to match USmean earnings per worker using (3) For thehuman-capital model Ac 5 AUS for all sourcecountries For the TFP model Ac is chosen tomatch predicted earnings per worker in thesource countries The labor weight rH matchesthe US ratio of aggregate skilled to unskilledearnings A normalization implies rL 5 1 2rH A number of alternative de nitions ofskilled versus unskilled labor and a range ofsubstitution elasticities are explored
3 Unfortunately the Census data do not identify when orwhere schooling was completed
202 THE AMERICAN ECONOMIC REVIEW MARCH 2002
The capital share parameter u is set to astandard value of 033 for all countries DouglasGollin (1997) nds that capital shares do notsystematically vary with per capita incomes Asa result the decomposition of cross-countryearnings gaps into the contributions of capitaland TFP presented below also holds for cross-country income gaps An alternative would beto assume that capital ows equalize rates ofreturn across countries in which case u wouldbe country speci c However the human-capital model would then imply that migrationhas no effect on earnings which is at variancewith evidence presented below
Source Country StatisticsmdashData on sourcecountry real GDP per worker are taken from thePenn World Table Mark 56 for 1990 For vecountries data for 1987 through 1989 are usedinstead Capital-output ratios are taken fromEllen R McGrattan and James A Schmitz Jr(1998) Lacking data on hours worked meanannual earnings per worker are calculated as(1ndashu) times real GDP per worker Mean earn-ings by skill class are the computed from theidentity wcLc 5 yens wcsLcs together with es-timates of the source country skill premia wcHwcL The latter are calculated from sourcecountry Mincer regressions described in theTechnical Appendix (available upon request)
Source country population weights are takenfrom Robert Barro and Jong-Wha Leersquos (2000)data on educational attainment together withdata on population age distributions from theUS Bureau of the Census International DataBase The joint distribution of age and educa-tional attainment is constructed from this datatogether with information on educational attain-ment by age taken from the Organization forEconomic Cooperation and Developmentrsquos(OECD) Education at a Glance 2001 databaseusing an algorithm described in Appendix BThe ndings change very little if it is assumedinstead that educational attainment is indepen-dent of age
One limitation of Barro and Leersquos data is thateducational attainment is available only for theentire population over age 25 whereas for esti-mating source country human-capital stocksdata on the educational composition of theworking population would be desirable For theUnited States this difference is small but it may
be larger for other countries Average years ofschooling estimated from worker survey datatypically exceed Barro and Leersquos estimates byseveral years even for rich countries (see TableB1) As a result the contributionof education tocross-country income differences would besmaller than reported below if educational at-tainment were taken from worker survey data
III Implications for Cross-CountryEarnings Differences
This section investigates to what extent hu-man- and physical-capital accumulation ac-count for observed cross-country earningsdifferences As a starting point I consider aversion of the human-capital model in which theskill types are perfect substitutes and in whichimmigrants do not differ from source countrynatives in their unmeasured skills (sc 5 1)Both assumption will be relaxed below
A One Skill TypemdashNo Self-Selection
The modelrsquos implications for decomposingcross-country earnings differences into the con-tributions of physical capital measured and un-measured skills are shown in Table 1 whichshows the relative earnings concepts de ned inSection I for all countries in the sample Forexample mean earnings per worker in the Phil-ippines equal wcwUS 5 013 of the US levelThe lower Filipino capital-output ratio accountsfor an earnings reduction of 6 percent (wc
k wUS 5 094) The relative lack of measuredskills reduces earnings further to wc
NwUS 5072 The fact that Filipino immigrants earnabout 17 percent less than US natives impliesthat lower unmeasured skills reduce earnings inthe Philippines further to wc
h wUS 5 060 of theUS level leaving a factor of 46 unexplainedThe last rows of Table 1 show the geometricmeans of these relative earnings concepts forthe full sample the low-income sample and forthe poorest ve countries
Figure 1 illustrates the data by plotting theearnings concepts reported in Table 1 againstreal source country earnings per worker relativeto the United States (wcwUS) Panel (a) showsthe effect of capital-output ratios on sourcecountry earnings wc
k wUS For most countriesphysical capital accounts for only a small fraction
203VOL 92 NO 1 HENDRICKS HOW IMPORTANT IS HUMAN CAPITAL FOR DEVELOPMENT
TABLE 1mdashDECOMPOSITION OF CROSS-COUNTRY EARNINGS GAPS
of the observed earnings gap relative to theUnited States For example in the low-incomesample lack of physical capital reduces earn-ings by 17 percent whereas measured earningsare only 18 percent of the US level The reasonis that even low-income countries often havecapital-output ratios greater than one-half of theUS level According to (3) their earnings arereduced at most by a factor of wc
k wUS 5=05 This is of course precisely the reasonwhy a Solow growth model cannot account forlarge cross-country output differences
The effect of measured skills on earnings wcN
wck is shown in Panel (b) For all source countries
educational attainment in the Barro-Lee (2000)data is lower than in the United States This re-duces earnings per worker between 20 percent forthe richest and 40 percent for the poorest coun-tries The combined effect of physical capital andmeasured skills [wc
NwUS shown in Panel (c)] is toreduce earnings in the full sample to 67 percent ofthe US level For the poorest ve countries earn-ings are reduced to 54 percent
Panel (d) shows the effect of unmeasured skillswc
hwcN estimated by the earnings of immigrants
relative to US natives with identical measuredskills (hcsc) In the one skill model source countryearnings are proportional to unmeasured humancapital Hence the ratios plotted in Panel (d) equalthe hcsc factors The key insight from this data isthat the gap between the earnings of immigrantsand US natives with identical skills is less than25 percent for most source countries Immigrants
from richer source countries earn more but therelationship is weak A tenfold increase of sourcecountry earnings (or source country output perworker) is associated with an immigrant earningsimprovement of only around one-third4 Account-ing for this fact poses a challenge for modelswhere productivity is embodied in workers but itarises naturally if productivity is country speci cas in the TFP model
The human-capital modelrsquos predicted sourcecountry earnings per worker wc
hwUS areshown in Panel (e) They represent the jointeffect of physical capital measured and unmea-sured skills In the full sample human capitalaccounts for a 27-percent reduction in outputper worker The joint effect on human and phys-ical capital is to reduce relative earnings to 066leaving on average a factor of 22 unexplainedFigure 2 shows the ratio of predicted to mea-sured immigrant earnings [wc
h wc or the ratioof the data shown in Panel (e) of Figure 1 to the45-degree line] Consistent with theories thatattribute cross-country income differences tototal factor productivity the degree of overpre-diction is larger for poorer countries In thelow-income sample earnings per worker im-plied by the model (053) overpredict measuredearnings by a factor of 3 For the poorest vecountries predicted earnings of 046 exceedmeasured earnings by a factor of 8
Full sample 904 671 657 304 22Low-income sample 834 592 531 177 30Poorest ve countries 806 540 464 58 80
Notes PWT No denotes the Penn World Table 56 country number Columns 2ndash4 show the cumulative effects of KYmeasured and unmeasured skills on source country earnings per worker wcwUS denotes relative source country earnings inthe Penn World Tables wc
hwc is the ratio of predicted to measured source country earnings
205VOL 92 NO 1 HENDRICKS HOW IMPORTANT IS HUMAN CAPITAL FOR DEVELOPMENT
Other Host CountriesmdashThere are reasons tobelieve that similar ndings are valid for a va-riety of host countries not only for the UnitedStates In particular the observation that immi-grants earn within 25 percent of natives withidentical measured skills is common in the lit-erature For example Borjas (1988 Table61) reports that the typical immigrant with 12years of schooling at age 50 earns 9 percentmore than observationally similar natives in theUnited States 10 percent less in Canada and 5percent less in Australia [see also David EBloom and Morley Gunderson (1991 Table125) for Canada and see John J Beggs and
Bruce J Chapman (1991) for Australia] Simi-lar ndings hold for the United Kingdom (BrianD Bell 1997 especially Table 5) Italy (Ales-sandra Venturini and Claudia Villosio 1998Table 41) Denmark (Leif Husted et al 2000)Norway (John E Hayfron 1998) Sweden (Per-Anders Edin et al 2000) and Germany (Chris-toph M Schmidt 1997 Table 4)
Importantly the observation remains validfor poorer host countries as well For IsraelFriedberg (1996 Table 4) reports that control-ling for individual characteristics earnings ofimmigrants from all regions are very similar tothose of natives For example with 12 years of
FIGURE 1 DECOMPOSITION OF CROSS-COUNTRY EARNINGS DIFFERENCES ONE SKILL MODEL
206 THE AMERICAN ECONOMIC REVIEW MARCH 2002
schooling and 20 years of experience the ratioof immigrant to native earnings is 99 percent forWestern Europeans 96 percent for Eastern Eu-ropeans 101 percent for Soviets and 86 percentfor AsiansAfricans
DiscussionmdashIn order to understand why hu-man and physical capital fail to account forlarge parts of cross-country income differencesconsider the modelrsquos implications for migrantearnings gains If there is only one skill type andif countries share identical production func-tions migration affects earnings of a givenworker only by changing the capital-output ra-tio Speci cally moving from country c tocountry s increases earnings by a factor of (kskc)
u (12 u ) according to (3) For a capital shareof u 5 13 and a source country with one-halfthe US capital-output ratio migration in-creases earnings by 40 percent Hence the pre-dicted earnings gains from migration are muchsmaller than observed cross-country earningsdifferences for workers with identical measuredskills so that immigrants should earn much lessthan US natives By contrast in the data im-migrants typically receive at least 75 percent ofnative earnings Successfully accounting forcross-country income differences without ap-pealing to TFP gaps therefore either requireslarger earnings gains from migration or that
FIGURE 1mdashContinued
FIGURE 2 RATIO OF PREDICTED TO MEASURED SOURCE
COUNTRY EARNINGS
207VOL 92 NO 1 HENDRICKS HOW IMPORTANT IS HUMAN CAPITAL FOR DEVELOPMENT
migrants differ in their unmeasured skills fromnonmigrants
An additional challenge for the human-capital model is to account for the variation ofimmigrant earnings across host countries Thefact that immigrant earnings cluster around na-tive earnings in poor as well as in rich hostcountries arises naturally in the TFP model butposes a problem for models in which produc-tivity is embodied in workers For exampleIsraelrsquos capital-output ratio is close to that of theUnited States Hence the human-capital modeldoes not provide any reasons why the earningsof immigrants with identical measured skillsshould differ between Israel and the UnitedStates by a factor of 2
The following subsections examine whethertwo extensions help reconcile the model withthe data These extensions are self-selectionof emigrants in terms of unmeasured human-capital and skill complementarities5
B One Skill TypemdashNonrandomSelection of Migrants
A possible defense of the human-capitalmodel is that migrants are self-selected so thatthey possess more unmeasured human capitalthan nonmigrants The large earnings gap be-tween US immigrants and nonmigrants in poorsource countries (Figure 2) would then re ectstrong self-selection instead of large earningsgains In other words the reason why immi-grants earn several times more than predicted bythe human-capital model would then not be thatmigration leads to large earnings gains but thatimmigrants possess several times more unmea-sured human capital (sc) than nonmigrants withidentical characteristics However severalpieces of evidence suggest that unmeasuredself-selection is likely much smaller than nec-essary for reconciling the model with largecross-country earnings gaps6
Self-Selection Implied by the ModelmdashIt isinstructive to ask what degree of immigrantself-selection would be required to fully ac-count for cross-country income gaps based onhuman and physical capital alone First I cal-culate the predicted earnings of immigrants atsource country skill prices from (3)
w cIm 5 v~kc LcH Lc L AUS
3 Oj
Nc jUSh jhc j sc O
j
Nc jUS
Hence the predicted ratio of immigrant to meansource country native earnings is given by
(4) ERc 5wc
Im
wc5
yenj
Nc jUSh jhc j yen
j
Nc jUS
yenj
Nc j hjhc j yenj
Nc jsc
The interpretation is that immigrants shouldearn ERc times mean earnings if they returnedto their source countries The rst ratio re ectsmeasured skill differences It can be calculateddirectly from population weights in sourcecountries and of immigrants The factor sc re- ects self-selection in unmeasured skills If hu-man and physical capital fully account forcross-country earnings differences then sc 5wc
hwc In other words the self-selection factorssc equal the unexplained earnings gaps shownin Figure 2
These gures are easier to interpret whenexpressed as the implied positions of immi-grants in the source country earnings distribu-tion I assume that the distribution of earnings ineach country is lognormal with a standard de-viation that matches the quintile ratios reportedin Klaus Deininger and Lyn Squirersquos (1996)data set of inequality measures The lognormaldistribution approximates the earnings distribu-tions of several countries fairly closely exceptfor the very highest earnings levels (JohnCreedy 1985) Using Deininger and Squirersquosinequality measures likely understates the de-gree of migrant self-selection implied by themodel as their estimates represent income in-equality across the entire population which istypically larger than earnings dispersion amongthe labor force Figure 3 shows the implied
5 Given the limited evidence it is dif cult to quantify therole of possible human-capital spillovers See James ERauch (1993) and Daron Acemoglu and Joshua Angrist(2000) for attempts at measuring such spillovers
6 Section III subsection D builds on the evidence pre-sented here to quantify the contributions of human andphysical capital to cross-country income differences in thepresence of plausible degrees of self-selection
208 THE AMERICAN ECONOMIC REVIEW MARCH 2002
percentile positions of immigrants in the sourcecountry earnings distributions For several low-income countries the model predicts that thetypical immigrant should be drawn from the top1 percent of the observed earnings distribution(which does not include expatriates)
This strong degree of self-selection appearsespecially implausible for source countries withlarge emigrant populations The most strikingcase is Jamaica where 145 percent of the pop-ulation resided in the United States in 1990 yetthe mean immigrant must be drawn from the top01 percent of the earnings distribution Othercountries for which the fraction of the popula-tion residing in the United States exceeds thepredicted degree of self-selection include Guy-ana (152 percent vs 01 percent) Nicaragua(47 percent vs 44 percent) the Philippines(16 percent vs 06 percent) and Hungary (11percent vs 02 percent) Another case in whichstrong self-selection is unlikely is El SalvadorEdward Funkhouser (1992) estimates that 35percent of households have family membersliving abroad Furthermore he nds little self-selection of emigrants within households Yetthe human-capital model implies that the 91percent of the population residing in the UnitedStates in 1990 must be drawn from the top 111percent of the earnings distribution In thesecountries accounting for cross-country earningsdifferences based on human and physical capitalalone would require that the entire top of theearnings distribution (and only the top) has em-
igrated to the United States However otherevidence suggests that self-selection in unmea-sured skills is generally quite weak
Estimates of Emigrant Self-SelectionmdashThemost direct evidence suggesting weak self-selection in unmeasured skills comes from stud-ies that follow individual workers acrossborders Based on a sample of 490 recent USimmigrants Guillermina Jasso et al (1998) ndthat migrants on their last source country jobsearned 75 percent more than the mean sourcecountry worker However this gap is largelyaccounted for by differences in measured skillsImmigrants in their sample possess almost eightyears more schooling than nonmigrants With aMincerian return to schooling of 99 percent peryear which is the average in the 56-countrysample of George Psacharopoulos (1994) im-migrantsrsquo higher education accounts for morethan the entire earnings gap leaving little roomfor self-selection with respect to unmeasuredskills For Egypt Richard H Adams Jr (1993) nds that emigrants tend to be poorer thannonmigrants7
An indirect measure of self-selection can beobtained from return migrants If emigrantswere strongly self-selected return migrantsshould earn substantially more than never mi-grants However in the data the earnings ofboth groups are very similar suggesting thatself-selection is weak For Hungary CatherineY Co et al (1999) nd that female return mi-grants earn slightly more than never migrantswhereas the difference is insigni cant for maleworkers G M Arif (1998) estimates that Paki-stani return migrants earn less than those whonever migrated Alan Barrett and Philip JOrsquoConnell (2000) nd that male return migrantsin Ireland earn 10 percent more than nevermigrants although no wage premium is foundfor women For Puerto Rico Fernando ARamos (1992) nds that whether a worker is a
7 Earnings of political refugees provide another oppor-tunity for observing immigrant earnings where nonrandomselection appears unlikely For Cuban refugees arrivingduring the Mariel boatlift David Card (1990) nds thatafter controlling for measured skills their earnings differonly by 18 percent from those of previous Cuban immi-grants in Miami A more systematic investigation of refugeeearnings would be a useful task for future research
FIGURE 3 PREDICTED POSITION OF IMMIGRANTS IN SOURCE
COUNTRY EARNINGS DISTRIBUTION
209VOL 92 NO 1 HENDRICKS HOW IMPORTANT IS HUMAN CAPITAL FOR DEVELOPMENT
return migrant or even whether a person wasborn in the United States has little effect onearnings This pattern is precisely what the TFPmodel predicts earnings are determined bywhere a person works not by place of birth
Of course the fact that return migrants donot earn much more than those who neverleft the source countries could be due to the factthat return migrants are strongly negatively se-lected in terms of unmeasured skills Howeverrecent longitudinal studies of US immigrants nd that this is not the case Lubotsky (2000)estimates that return migrants earn around 15percent less than immigrants who stay in theUnited States
Additional evidence suggesting that self-selection is weak comes from estimates of mi-grant earnings gains Except for some very poorcountries with unusually low capital-output ra-tios the human-capital model predicts that im-migration should raise earnings by modestamounts or even not at all Yet empirical esti-mates of the earnings gains associated with mi-gration are typically large Jasso et al (1998) nd that controlling for purchasing power dif-ferences Chinese immigrants earn three timesmore in the United States than they did on theirlast home country job By contrast the modelpredicts earnings gains of only 21 percent Sim-ilarly Filipinos earn 25 times more in theUnited States while the model predicts an earn-ings improvement of only 6 percent The onlylow-income source country for which Jasso etal (1998) do not nd large earnings gains isMexico However their nding contrasts withother studies such as Richard W Cuthbert andJoe B Stevens (1981) or Douglas S Massey etal (1987) who nd that Mexican immigrantsearn around six times more in the United Statesthan in Mexico compared with a predicted gainof 17 percent For Puerto Ricans Ramos (1992) nds that controlling for migrant self-selectionworking in the United States doubles earningswhereas the model predicts an earnings gain ofonly 84 percent Large earnings gains due tomigration are also found for Pakistani workersin Saudi Arabia (around 800 percent Ha z APasha and Mir Anjum Altaf 1987) and in theMiddle East (Nadeem Ilahi and Saqib Jafarey1999) and for Egyptian emigrants (Adams1993) This evidence suggests that migratingfrom poor to rich countries results in earnings
gainsthatare considerablylarger thanthehuman-capital model predicts
One possible way of reconciling the human-capital model with large immigrant earningsgains is self-selection based on job matches8 Ifmigration occurs because workers have re-ceived attractive job offers then the earningsgap between immigrants and source countrynatives may in part re ect the high quality ofimmigrant job matches instead of differences inhuman capital Consistent with this hypothesisArnold De Silva (1997) nds that immigrantswho are admitted into Canada with prearrangedemployment enjoy higher earnings Howeverthe estimated earnings bene t of 17 percentaccounts for only a small fraction of the unex-plained gap between immigrant and sourcecountry earnings Moreover only around one in ve Canadian immigrants arrive with prear-ranged employment
A related concern is that skill-based ad-missions could induce strong immigrant self-selection This could be a problem for countriessuch as Canada which admits around 40percent of immigrants based on skill or em-ployment criteria However it is much lessof a concern for the United States where sincethe 1965 Immigration Act the bulk of immi-grants are admitted as relatives or familymembers of US residents The fraction ofskill-based admissions never exceeded 16 per-cent during the period 1988ndash1998 and most ofthese come from rich source countries (USImmigration and Naturalization Service 1998)Moreover while skill-based immigrants enjoyan initial earnings advantage over family mi-grants the gap vanishes after some years ofUS experience (Jasso and Mark R Rosenz-weig 1995 Harriet O Duleep and Mark CRegets 1996)
A nal reason to doubt the hypothesis ofstrong self-selection is that the earnings of im-migrants cluster around native earnings in allhost countries This arises naturally in a TFPmodel where the earnings of immigrants andnatives bene t equally from the country-speci c productivities of the host countries Bycontrast if productivity is embodied in workers
8 I am grateful to an anonymous referee for pointing outthis possibility
210 THE AMERICAN ECONOMIC REVIEW MARCH 2002
the fact that immigrant earnings are close tonative earnings requires a speci c pattern ofself-selection In particular immigrants frompoorer countries must be more positively se-lected (as measured in Figure 2) and immi-grants in poorer host countries must be lesspositively selected
Accounting for Cross-Country EarningsGaps with Stronger Migrant Self-SelectionmdashTaken together this evidence suggests that mi-grant self-selection in unmeasured skills islikely weak If this is the case then the esti-mates of Section III subsection A quantify thecontributions of human and physical capital tocross-country earnings gaps It is however use-ful to examine the robustness of these ndingsagainst the possibility of stronger self-selectionin unmeasured skills The evidence reviewedearlier indicates that unmeasured self-selectionis weaker than measured self-selection In termsof the model this means that the sc factors aresmaller than the ratio of measured skills ofimmigrants relative to source country natives[the rst term in equation (4)] Setting the scequal to these ratios should therefore overstateunmeasured selection It implies that immi-grants are drawn from the top 5 percent of thesource country earnings distribution for eightcountries in the sample and that immigrants inthe low-income sample possess 23 times morehuman capital than nonmigrants This degree ofself-selection is far greater than the evidencepresented earlier suggests Still large cross-country income gaps remain unaccounted forOutput per worker is overpredicted by a factorof 2 for the low-income sample and by a factorof 5 for the poorest ve countries I concludethat plausible degrees of unmeasured self-selection do not overturn the nding thatphysical- and human-capital accumulation failto account for a large part of cross-countryincome differences
C Multiple Skill Types
In neoclassical growth models it is typicallyassumed that workers of different skill levelsare perfect substitutes in production Relaxingthis assumption might help reconcile the modelwith the data If skilled and unskilled labor arepoor substitutes countries where skilled labor is
scarce may have low average earnings eventhough a typical unskilled worker possesses thesame amount of human capital in all countriesMigration then leads to large wage gains forunskilled workers because they bene t from thelarger supply of skilled labor in the hostcountry9
In order to empirically implement the modelwith two skill types it is necessary to de newhich education classes belong to each skillBarro and Leersquos (2000) data distinguish seveneducation classes for the source countries (noformal schooling primary secondary or higherschooling attained or completed) A commonapproach is to count only college graduates asskilled For this case Per Krusell et al (2000)estimate a substitution elasticity between skilledand unskilled labor of 167 However whenapplied across countries these parameters yieldskill premia in poor countries that are up to tentimes larger than in the United States Obtainingreasonable skill premia requires a broader def-inition of skill and a higher substitution elastic-ity In what follows I de ne workers with atleast completed secondary education as skilledThe substitution elasticity is set to 5 so that themodel matches the mean skill premium in thelow-income sample Experimentation with al-ternative skill de nitions or substitution elastic-ities either reduces the explanatory power of themodel or results in unreasonable skill premia10
The implications of the two skill model forsource country earnings are shown in Fig-ure 411 Comparing the ndings with those ofFigure 1 for the one skill model reveals thatimperfect substitutability of skills improves themodelrsquos ability to account for large cross-country income differences However the gapsbetween source country earnings in the data andthe model predictions shown in Figure 5 re-main large In the full sample physical andhuman capital account for a reduction in relativeearnings to 058 leaving an unexplained ratio of
9 I am grateful to Michele Boldrin for suggesting thisextension
10 The Technical Appendix (available upon request)shows that the qualitative conclusions reported here carryover to the case where skill types are not observed by theeconometrician
11 The Technical Appendix (available upon request) re-ports the underlying data
211VOL 92 NO 1 HENDRICKS HOW IMPORTANT IS HUMAN CAPITAL FOR DEVELOPMENT
19 As in the one skill case the unexplainedgaps are larger for poorer countries In the low-income sample predicted earnings are 26 timeslarger than measured earnings and for the poor-est ve countries the factor of overprediction is56
The reason for the limited improvement is thehigh substitution elasticity of skilled and un-skilled labor However the skill premia pre-dicted for poor countries are on average closeto those calculated from source country Mincerregressions This indicates that reducing thesubstitution elasticity substantially below 5would lead to unreasonable skill premia To
illustrate reducing the substitution elasticity to3 raises skill premia roughly 50 percent abovethose observed in the data
As in the one skill model it is useful to askwhether stronger migrant self-selection in-creases the ability of human and physical capitalto account for cross-country earnings gaps As aproxy for unmeasured self-selection I again setthe sc factors equal the ratios of measured skillsof immigrants relative to source country na-tives Consistent with the ndings for the oneskill case the implied ratios of predicted tomeasured earnings per worker remain large Forthe low-income sample output per worker is
FIGURE 4 DECOMPOSITION OF CROSS-COUNTRY EARNINGS DIFFERENCES TWO SKILL MODEL
212 THE AMERICAN ECONOMIC REVIEW MARCH 2002
overpredicted on average by a factor of 17while the corresponding factor for the poorest ve countries is 36 I conclude that while im-perfect skill substitution improves the explana-
tory power of the model large income gapsremain unaccounted for
D Comparison with Other Estimates
This subsection compares the decompositionof cross-country income gaps presented in thisarticle with estimates reported in the litera-ture12 My ndings are directly comparable tothose of Hall and Jones (1999) Except for themethod of measuring human capital their ac-counting framework is the same as the onedescribed in Section I As a result their esti-mates of the contribution of physical capital tocross-country output differences are close tomine Hall and Jones estimate human-capitalstocks based on Mincer regressions that arecommon to all countries together with meanyears of schooling taken from an earlier version
12 An interesting attempt at quantifying the role of hu-man capital in an environment with skill-speci c technolo-gies is presented in Acemoglu and Fabrizio Zilibotti (2001)
FIGURE 4mdashContinued
FIGURE 5 RATIO OF PREDICTED TO MEASURED SOURCE
COUNTRY EARNINGS IN THE TWO SKILL MODEL
213VOL 92 NO 1 HENDRICKS HOW IMPORTANT IS HUMAN CAPITAL FOR DEVELOPMENT
of Barro and Leersquos data Figure 6 plots theirestimates of human capital per worker relativeto the United States against those derived herefor the one skill model In spite of this verydifferent estimation method the two estimatesare highly correlated (the correlation coef cientis 082) For countries in the low-income sam-ple human capital accounts for a reduction inoutput per worker relative to the United Statesof 44 percent according to Hall and Jonesrsquosestimates compared with 36 percent based onthe one skill model It is easy to see why the twoestimates are close Hall and Jonesrsquos estimationframework assumes that the human-capital en-dowments of workers with identical schoolingare the same in all countries The approachpursued here estimates these human-capitalendowments from immigrant earnings butreaches a similar conclusion
My ndings are also consistent with those ofKlenow and Rodrotilde guez-Clare (1997a) who de-velop measures of country human-capital stocksbased on a Mincerian earnings function Thecontribution of human and physical capital tocross-country output differences is measured byregressing the logarithm of predicted output perworker on the logarithm of observed output perworker In my notation the regression equationis given by ln(wc
h ) 5 b0 1 b1ln(wc) 1 laquoc
where laquoc is a stochastic error term One inter-pretation is that the fraction b1 of the cross-country variance in log output is accounted forby physical and human capital Klenow andRodrotilde guez-Clare nd that b1 is likely less than05 with the exact gure depending on assump-tions about the production and measurement ofhuman capital Replicating this regression in myfull sample yields an estimate of b1 5 038(standard error 004) for the one skill model andof b1 5 045 (standard error 005) for the twoskill model Consistent with the nding that theunexplained output gaps are larger for poorercountries the low-income sample yields smallerestimates of b1 (027 in the one skill model and038 in the two skill model) The fact that myestimates are consistent with those of Hall andJones (1999) and Klenow and Rodrotilde guez-Clare(1997a) suggests that the implications for thesources of cross-country income gaps are robustagainst alternative methods of constructingcountry human-capital stocks
IV Conclusion
This paper offers new evidence on thesources of cross-country income differences Itexploits the idea that immigrant workers pro-vide an opportunity to estimate the human-capital endowments of workers from a varietyof source countries based on earnings attainedin a common labor market This approach cap-tures both observed and unobserved skill differ-ences without having to postulate a particularhuman-capital production function Immigrantearnings data suggest that cross-country differ-ences in unobserved skills are much smallerthan cross-country income gaps As a result myestimates strongly reject the hypothesis that hu-man and physical capital account for the bulk ofcross-country income differences
For a sample of low-income countries hu-man and physical capital account for a reductionin output per worker to one-half of the USlevel compared with one- fth in the data Al-lowing for skill complementarities and strongerimmigrant self-selection still leaves an averageincome gap of 17 unexplained For the poorest ve countries in the sample output per workerimplied by human- and physical-capital differ-ences is at least 36 times larger than in the dataThis evidence is consistent with Prescottrsquos
FIGURE 6 CONTRIBUTION OF HUMAN CAPITAL TO OUTPUT
PER WORKER DIFFERENCES
Notes The vertical axis shows source country output perworker relative to the United States implied by the human-capital stock estimates of Hall and Jones (1999) The hori-zontal axis shows the corresponding values predicted by theone skill model
214 THE AMERICAN ECONOMIC REVIEW MARCH 2002
(1998) conclusion that accounting for cross-country income differentials requires a theory oftotal factor productivity
APPENDIX A CENSUS DATA
Census data are taken from the 1990 PUMS5-percent State Sample data les Individuals areexcluded from the sample if they reside in groupquarters are younger than 20 years or older than69 years do not work at least 30 hours per weekand 40 weeks per year or are self-employed Inaddition observations are deleted if weekly hoursexceed 120 or annual earnings are less than $500Such cases are exceedingly rare and likely dueto measurement error Immigrants are alsodropped if they arrived in the United States beforeage 20 This excludes immigrants who attainedmost of their education in the United States In-creasing the lowest arrival age to 24 makes littledifference The resulting sample contains 22 mil-lion natives and 178000 immigrants When aver-aging over male and female workers xedweights of 06 and 04 are used This avoids count-ing differences in gender ratios as differences inhuman capital Observations are sorted into thefollowing classes
Years of schooling 0ndash4 5ndash8 9ndash11 12 13ndash14 151Age 20ndash24 25ndash29 30ndash34 35ndash39 40ndash4445ndash49 50ndash54 55ndash59 60ndash64 64ndash69Sex Male or femaleBirthplace According to Penn World Tablecountry codes
Annual work hours are calculated fromldquoweeks worked last yearrdquo and ldquohours usuallyworked per weekrdquo Labor earnings are calcu-lated from ldquowage and salary incomerdquo whichdoes not include self-employment income Thevariable ldquoeducational attainmentrdquo gives years ofschooling in an intervallic format Each personis assigned its interval midpoint as years ofschooling
APPENDIX B SOURCE COUNTRY DATA
Data on source country aggregates are gen-erally taken from the Penn World Table Mark56 Capital-output ratios are taken fromMcGrattan and Schmitz (1998) but results are
very similar if Penn World Table data are usedinstead For four countries capital stock data arenot available (Belize Dominica Hungary andPoland) In these cases I impute a capital-outputratio by regressing ln(capital stock per worker)on ln(real GDP per worker)
For the two skill model it is necessary tocalculate source country earnings by skill typeMincer regressions are used to calculate therelative earnings of skilled to unskilled workersin the source countries Psacharopoulos (1994)provides sources for a large number of coun-tries which are updated in Bils and Klenow(2000) Only earnings regressions that do notcontrol for additional variables which might becorrelated with educationexperience are usedMoreover the underlying samples must be rep-resentative for a signi cant fraction of thesource country workforce Additional detail isprovided in a Technical Appendix which isavailable from the author
Educational AttainmentmdashIn order to calcu-late the contribution of measured skills to cross-country income differences it is necessary toconstruct the joint distribution of age and edu-cational attainment for each country Data fromthree sources are used Barro and Lee (2000)report the population fractions pc in each ofc 5 1 7 educational attainment classesThe US Bureau of the Census InternationalData Base provides the population fraction main each of a 5 1 9 age classes Theobjective is to construct the joint distributionPr(c a) in such a way that the marginal dis-tributions pc and ma are respected
The algorithm draws on OECD data whichprovide conditional fractions Pr( jza) for a sub-set of 39 countries where j 5 1 3 indexeseducation classes Following Barro and Lee(2000) I map the c classes into the j classes asfollows Class j 5 1 captures persons with lessthan upper secondary education and is mappedinto Barro-Lee classes c 5 1 4 Class j 52 contains persons who completed upper sec-ondary education and corresponds to c 5 5Finally j 5 3 refers to tertiary education andcorresponds to c 5 6 7
The conditional fractions Pr( jza) are ex-tended to the ner c classes according toPr(cza) 5 Pr( jza)pcyenc [ Jj
pc where Jj de-notes the set of c classes that are mapped into
215VOL 92 NO 1 HENDRICKS HOW IMPORTANT IS HUMAN CAPITAL FOR DEVELOPMENT
class j This scales the marginal fractions pcsuch that the Pr( jza) are respected Constructingthe joint distribution according to Pr(c a) 5Pr(cza)ma would respect the age marginals mabut not the education marginals pc Therefore acorrection term Dpc 5 pc 2 yena Pr(c a) isadded to each column of Pr(c a) so that theresulting joint distribution respects both ma and
pc while capturing the observation that youngerpersons have higher educational attainmentcontained in the OECD data Countries not con-tained in the OECD data set are divided intothree classes based on whether real GDP perworker is below or above one-third of the USlevel Their Pr( jza) are replaced by the averagesacross countries in their income class
[Table B1 follows]
TABLE B1mdashSOURCE COUNTRY AND IMMIGRANT CHARACTERISTICS
Acemoglu Daron and Angrist Joshua ldquoHowLarge Are Human Capital Externalities Ev-idence from Compulsory Schooling Lawsrdquoin Ben S Bernanke and Kenneth Rogoffeds NBER macroeconomics annual 1997Cambridge MA MIT Press 2000 pp 5ndash59
Acemoglu Daron and Zilibotti Fabrizio ldquoPro-ductivity Differencesrdquo Quarterly Journal ofEconomics May 2001 116(2) pp 563ndash606
Adams Richard H Jr ldquoThe Economic and De-mographic Determinants of International Mi-gration in Rural Egyptrdquo Journal ofDevelopment Studies October 1993 30(1)pp 146ndash67
Notes PWT No is the Penn World Table 56 country number Relative RGDPW denotes real GDP per worker relative to theUnited States in 1990 Data for 1990 are not available for ve countries In four of these cases 1989 RGDPW is used insteadFor Iraq 1987 RGDPW is reported KY is the capital-output ratio taken from McGrattan and Schmitz (1998) Two de nitionsof relative immigrant earnings are shown Unadjusted relative earnings denote mean earnings per immigrant divided by meanearnings per native-born worker Adjusted relative earnings are de ned as the ratio of immigrant earnings per worker relativeto native-born workers with identical age education and sex Average years of schooling are taken from Barro and Lee (2000column BL) from a sample of source country Mincer regressions (column Mincer not available for all countries) and fromimmigrant data (Immigrant) The gures shown in column BL are calculated by assigning respectively the values 0 25 6510 12 13 and 17 years of schooling to the seven education categories reported in Barro and Lee (2000) N denotes thenumber of immigrants observed in the Census sample
217VOL 92 NO 1 HENDRICKS HOW IMPORTANT IS HUMAN CAPITAL FOR DEVELOPMENT
Arif G M ldquoReintegration of Pakistani ReturnMigrants from the Middle East in the Domes-tic Labour Marketrdquo Pakistan DevelopmentReview Summer 1998 37(2) pp 99ndash124
Barrett Alan and OrsquoConnell Philip J ldquoIs There aWage Premium for Returning Irish Mi-grantsrdquo IZA working paper Bonn 2000
Barro Robert and Lee Jong-Wha ldquoInternationalData on Educational Attainment Updatesand Implicationsrdquo National Bureau of Eco-nomic Research (Cambridge MA) WorkingPaper No 7911 2000
Beggs John J and Chapman Bruce J ldquoMaleImmigrant Wage and Unemployment Expe-rience in Australiardquo in John M Abowd andRichard B Freeman eds Immigrationtrade and the labor market Chicago Uni-versity of Chicago Press 1991 pp 369ndash84
Bell Brian D ldquoThe Performance of Immigrantsin the United Kingdom Evidence from theGHSrdquo Economic Journal March 1997107(441) pp 333ndash44
Bils Mark and Klenow Peter J ldquoDoes SchoolingCause Growthrdquo American Economic Re-view December 2000 90(5) pp 1160ndash83
Bloom David E and Gunderson Morley ldquoAnAnalysis of the Earnings of Canadian Immi-grantsrdquo in John M Abowd and Richard BFreeman eds Immigration trade and thelabor market Chicago University of Chi-cago Press 1991 pp 321ndash42
Borjas George J International differences in thelabor market performance of immigrantsKalamazoo MI W E Upjohn Institute ofEmployment Research 1988
Card David ldquoThe Impact of the Mariel Boatlifton the Miami Labor Marketrdquo Industrial andLabor Relations Review January 199043(2) pp 245ndash57
Co Catherine Y Gang Ira N and Yun Myeong-Su ldquoReturns to Returningrdquo Working paperRutgers University 1999
Creedy John Dynamics of income distributionOxford Blackwell 1985
Cuthbert Richard W and Stevens Joe B ldquoTheNet Economic Incentive for Illegal MexicanMigration A Case Studyrdquo International Mi-gration Review Fall 1981 15(3) pp 543ndash49
Deininger Klaus and Squire Lyn ldquoA New DataSet Measuring Income Inequalityrdquo World
Bank Economic Review September 199610(3) pp 565ndash91
De Silva Arnold ldquoEarnings of ImmigrantClasses in the Early 1980s in Canada AReexaminationrdquo Canadian Public PolicyJune 1997 23(2) pp 179ndash202
Duleep Harriet O and Regets Mark C ldquoAdmis-sion Criteria and Immigrant Earnings Pro- lesrdquo International Migration ReviewSummer 1996 30(2) pp 571ndash90
Edin Per-Anders LaLonde Robert J and Arings-lund Olof ldquoEmigration of Immigrants andMeasures of Immigrant Assimilation Evi-dence from Swedenrdquo Working paper Uni-versity of Chicago 2000
Friedberg Rachel ldquoYou Canrsquot Take It WithYou Immigrant Assimilation and the Porta-bility of Human Capitalrdquo National Bureau ofEconomic Research (Cambridge MA) Work-ing Paper No 5837 1996
Funkhouser Edward ldquoMass Emigration Remit-tances and Economic Adjustment The Caseof El Salvador in the 1980srdquo in George JBorjas and Richard B Freeman eds Immi-gration and the work force Economic con-sequences for the United States and sourceareas Chicago University of Chicago Press1992 pp 135ndash75
Gollin Douglas ldquoGetting Income SharesRight Self-Employment UnincorporatedEnterprise and the Cobb-Douglas Hypoth-esisrdquo Working paper Williams College1997
Hall Robert E and Jones Charles I ldquoWhy DoSome Countries Produce So Much More Out-put Per Worker Than Othersrdquo QuarterlyJournal of Economics February 1999114(1) pp 83ndash116
Hayfron John E ldquoThe Performance of Immi-grants in the Norwegian Labor MarketrdquoJournal of Population Economics May 199811(2) pp 293ndash303
Husted Leif Nielsen Helena S Rosholm Mi-chael and Smith Nina ldquoEmployment andWage Assimilation of Male First GenerationImmigrants in Denmarkrdquo IZA DiscussionPaper No 101 Bonn 2000
Ilahi Nadeem and Jafarey Saqib ldquoGuestworkerMigration Remittances and the ExtendedFamily Evidence from Pakistanrdquo Journal ofDevelopment Economics April 1999 58(2)pp 485ndash512
218 THE AMERICAN ECONOMIC REVIEW MARCH 2002
Jasso Guillermina and Rosenzweig Mark R ldquoDoImmigrants Screened for Skills Do Betterthan Family-Reuni cation Immigrantsrdquo In-ternational Migration Review Spring 199529(1) pp 85ndash111
Jasso Guillermina Rosenzweig Mark R andSmith James P ldquoDeterminants of Immi-grantsrsquo Economic Gains from ImmigrationrdquoWorking paper University of Pennsylvania1998
Klenow Peter J and Rodrotilde guez-Clare AndresldquoThe Neoclassical Revival in Growth Eco-nomics Has It Gone Too Farrdquo in Ben SBernanke and Julio J Rotemberg edsNBER macroeconomics annual 1997 Cam-bridge MA MIT Press 1997a pp 73ndash103
ldquoEconomic Growth A Review EssayrdquoJournal of Monetary Economics December1997b 40(3) pp 597ndash617
Krusell Per Ohanian Lee E R otilde os-Rull Jose-V otilde ctor and Violante Giovanni ldquoCapital-SkillComplementarity and Inequality A Macro-economic Analysisrdquo Econometrica Septem-ber 2000 68(5) pp 1029ndash53
Lubotsky Darren ldquoChutes or Ladders A Lon-gitudinal Analysis of Immigrant EarningsrdquoWorking paper Princeton University 2000
Mankiw N Gregory Romer David and WeilDavid N ldquoA Contribution to the Empirics ofEconomic Growthrdquo Quarterly Journal ofEconomics May 1992 107(2) pp 407ndash37
Massey Douglas S Alarcon Rafael DurandJorge and Gonzalez Humberto Return toAztlan The social process of internationalmigration from western Mexico BerkeleyCA University of California Press 1987
McGrattan Ellen R and Schmitz James A JrldquoExplaining Cross-Country Income Differ-encesrdquo Federal Reserve Bank of MinneapolisStaff Report No 250 July 1998
Olson Mancur Jr ldquoDistinguished Lecture onEconomics in Government Big Bills Left onthe Sidewalk Why Some Nations Are Richand Others Poorrdquo Journal of Economic Per-spectives Spring 1996 10(2) pp 3ndash24
Organization for Economic Cooperation and De-velopment Education at a glance OECD in-dicators Paris Centre for EducationalResearch and Innovation 2001
Pasha Ha z A and Altaf Mir Anjum ldquoReturnMigration in a Life-Cycle Setting An Ex-ploratory Study of Pakistani Migrants inSaudi Arabiardquo Pakistan Journal of AppliedEconomics Summer 1987 6(1) pp 1ndash21
Prescott Edward C ldquoNeeded A Theory of TotalFactor Productivityrdquo InternationalEconomicReview August 1998 39(3) pp 525ndash51
Psacharopoulos George ldquoReturns to Investmentin Education A Global Updaterdquo World De-velopment September 1994 22(9) pp 1325ndash43
Ramos Fernando A ldquoOut-Migration and ReturnMigration of Puerto Ricansrdquo in George JBorjas and Richard B Freeman eds Immi-gration and the work force Economic con-sequences for the United States and sourceareas Chicago University of Chicago Press1992 pp 49ndash66
Rauch James E ldquoProductivity Gains from Geo-graphic Concentration of Human Capital Ev-idence from the Citiesrdquo Journal of UrbanEconomics November 1993 34(3) pp 380ndash400
Romer Paul ldquoIdea Gaps and Object Gaps inEconomic Developmentrdquo Journal of Mone-tary Economics December 1993 32(3) pp543ndash73
Schmidt Christoph M ldquoImmigrant Performancein Germany Labor Earnings of Ethnic Ger-man Migrants and Foreign Guest-WorkersrdquoQuarterly Review of Economics and Finance1997 Spec Iss 37 pp 379ndash97
Topel Robert ldquoLabor Markets and EconomicGrowthrdquo Working paper University of Chi-cago 1998
US Department of Commerce Bureau of theCensus 1990 census of population and hous-ing Washington DC US GovernmentPrinting Of ce 1990
US Immigration and Naturalization Service1998 statistical yearbook Washington DCUS Government Printing Of ce 1998
Venturini Alessandra and Villosio ClaudialdquoForeign Workers in Italy Are They Assim-ilating to Natives Are They CompetingAgainst Natives An Analysis by the SSADatasetrdquo Working paper University of Ber-gamo 1998
219VOL 92 NO 1 HENDRICKS HOW IMPORTANT IS HUMAN CAPITAL FOR DEVELOPMENT
REFERENCES
Acemoglu Daron and Angrist Joshua ldquoHowLarge Are Human Capital Externalities Ev-idence from Compulsory Schooling Lawsrdquoin Ben S Bernanke and Kenneth Rogoffeds NBER macroeconomics annual 1997Cambridge MA MIT Press 2000 pp 5ndash59
Acemoglu Daron and Zilibotti Fabrizio ldquoPro-ductivity Differencesrdquo Quarterly Journal ofEconomics May 2001 116(2) pp 563ndash606
Adams Richard H Jr ldquoThe Economic and De-mographic Determinants of International Mi-gration in Rural Egyptrdquo Journal ofDevelopment Studies October 1993 30(1)pp 146ndash67
Notes PWT No is the Penn World Table 56 country number Relative RGDPW denotes real GDP per worker relative to theUnited States in 1990 Data for 1990 are not available for ve countries In four of these cases 1989 RGDPW is used insteadFor Iraq 1987 RGDPW is reported KY is the capital-output ratio taken from McGrattan and Schmitz (1998) Two de nitionsof relative immigrant earnings are shown Unadjusted relative earnings denote mean earnings per immigrant divided by meanearnings per native-born worker Adjusted relative earnings are de ned as the ratio of immigrant earnings per worker relativeto native-born workers with identical age education and sex Average years of schooling are taken from Barro and Lee (2000column BL) from a sample of source country Mincer regressions (column Mincer not available for all countries) and fromimmigrant data (Immigrant) The gures shown in column BL are calculated by assigning respectively the values 0 25 6510 12 13 and 17 years of schooling to the seven education categories reported in Barro and Lee (2000) N denotes thenumber of immigrants observed in the Census sample
217VOL 92 NO 1 HENDRICKS HOW IMPORTANT IS HUMAN CAPITAL FOR DEVELOPMENT
Arif G M ldquoReintegration of Pakistani ReturnMigrants from the Middle East in the Domes-tic Labour Marketrdquo Pakistan DevelopmentReview Summer 1998 37(2) pp 99ndash124
Barrett Alan and OrsquoConnell Philip J ldquoIs There aWage Premium for Returning Irish Mi-grantsrdquo IZA working paper Bonn 2000
Barro Robert and Lee Jong-Wha ldquoInternationalData on Educational Attainment Updatesand Implicationsrdquo National Bureau of Eco-nomic Research (Cambridge MA) WorkingPaper No 7911 2000
Beggs John J and Chapman Bruce J ldquoMaleImmigrant Wage and Unemployment Expe-rience in Australiardquo in John M Abowd andRichard B Freeman eds Immigrationtrade and the labor market Chicago Uni-versity of Chicago Press 1991 pp 369ndash84
Bell Brian D ldquoThe Performance of Immigrantsin the United Kingdom Evidence from theGHSrdquo Economic Journal March 1997107(441) pp 333ndash44
Bils Mark and Klenow Peter J ldquoDoes SchoolingCause Growthrdquo American Economic Re-view December 2000 90(5) pp 1160ndash83
Bloom David E and Gunderson Morley ldquoAnAnalysis of the Earnings of Canadian Immi-grantsrdquo in John M Abowd and Richard BFreeman eds Immigration trade and thelabor market Chicago University of Chi-cago Press 1991 pp 321ndash42
Borjas George J International differences in thelabor market performance of immigrantsKalamazoo MI W E Upjohn Institute ofEmployment Research 1988
Card David ldquoThe Impact of the Mariel Boatlifton the Miami Labor Marketrdquo Industrial andLabor Relations Review January 199043(2) pp 245ndash57
Co Catherine Y Gang Ira N and Yun Myeong-Su ldquoReturns to Returningrdquo Working paperRutgers University 1999
Creedy John Dynamics of income distributionOxford Blackwell 1985
Cuthbert Richard W and Stevens Joe B ldquoTheNet Economic Incentive for Illegal MexicanMigration A Case Studyrdquo International Mi-gration Review Fall 1981 15(3) pp 543ndash49
Deininger Klaus and Squire Lyn ldquoA New DataSet Measuring Income Inequalityrdquo World
Bank Economic Review September 199610(3) pp 565ndash91
De Silva Arnold ldquoEarnings of ImmigrantClasses in the Early 1980s in Canada AReexaminationrdquo Canadian Public PolicyJune 1997 23(2) pp 179ndash202
Duleep Harriet O and Regets Mark C ldquoAdmis-sion Criteria and Immigrant Earnings Pro- lesrdquo International Migration ReviewSummer 1996 30(2) pp 571ndash90
Edin Per-Anders LaLonde Robert J and Arings-lund Olof ldquoEmigration of Immigrants andMeasures of Immigrant Assimilation Evi-dence from Swedenrdquo Working paper Uni-versity of Chicago 2000
Friedberg Rachel ldquoYou Canrsquot Take It WithYou Immigrant Assimilation and the Porta-bility of Human Capitalrdquo National Bureau ofEconomic Research (Cambridge MA) Work-ing Paper No 5837 1996
Funkhouser Edward ldquoMass Emigration Remit-tances and Economic Adjustment The Caseof El Salvador in the 1980srdquo in George JBorjas and Richard B Freeman eds Immi-gration and the work force Economic con-sequences for the United States and sourceareas Chicago University of Chicago Press1992 pp 135ndash75
Gollin Douglas ldquoGetting Income SharesRight Self-Employment UnincorporatedEnterprise and the Cobb-Douglas Hypoth-esisrdquo Working paper Williams College1997
Hall Robert E and Jones Charles I ldquoWhy DoSome Countries Produce So Much More Out-put Per Worker Than Othersrdquo QuarterlyJournal of Economics February 1999114(1) pp 83ndash116
Hayfron John E ldquoThe Performance of Immi-grants in the Norwegian Labor MarketrdquoJournal of Population Economics May 199811(2) pp 293ndash303
Husted Leif Nielsen Helena S Rosholm Mi-chael and Smith Nina ldquoEmployment andWage Assimilation of Male First GenerationImmigrants in Denmarkrdquo IZA DiscussionPaper No 101 Bonn 2000
Ilahi Nadeem and Jafarey Saqib ldquoGuestworkerMigration Remittances and the ExtendedFamily Evidence from Pakistanrdquo Journal ofDevelopment Economics April 1999 58(2)pp 485ndash512
218 THE AMERICAN ECONOMIC REVIEW MARCH 2002
Jasso Guillermina and Rosenzweig Mark R ldquoDoImmigrants Screened for Skills Do Betterthan Family-Reuni cation Immigrantsrdquo In-ternational Migration Review Spring 199529(1) pp 85ndash111
Jasso Guillermina Rosenzweig Mark R andSmith James P ldquoDeterminants of Immi-grantsrsquo Economic Gains from ImmigrationrdquoWorking paper University of Pennsylvania1998
Klenow Peter J and Rodrotilde guez-Clare AndresldquoThe Neoclassical Revival in Growth Eco-nomics Has It Gone Too Farrdquo in Ben SBernanke and Julio J Rotemberg edsNBER macroeconomics annual 1997 Cam-bridge MA MIT Press 1997a pp 73ndash103
ldquoEconomic Growth A Review EssayrdquoJournal of Monetary Economics December1997b 40(3) pp 597ndash617
Krusell Per Ohanian Lee E R otilde os-Rull Jose-V otilde ctor and Violante Giovanni ldquoCapital-SkillComplementarity and Inequality A Macro-economic Analysisrdquo Econometrica Septem-ber 2000 68(5) pp 1029ndash53
Lubotsky Darren ldquoChutes or Ladders A Lon-gitudinal Analysis of Immigrant EarningsrdquoWorking paper Princeton University 2000
Mankiw N Gregory Romer David and WeilDavid N ldquoA Contribution to the Empirics ofEconomic Growthrdquo Quarterly Journal ofEconomics May 1992 107(2) pp 407ndash37
Massey Douglas S Alarcon Rafael DurandJorge and Gonzalez Humberto Return toAztlan The social process of internationalmigration from western Mexico BerkeleyCA University of California Press 1987
McGrattan Ellen R and Schmitz James A JrldquoExplaining Cross-Country Income Differ-encesrdquo Federal Reserve Bank of MinneapolisStaff Report No 250 July 1998
Olson Mancur Jr ldquoDistinguished Lecture onEconomics in Government Big Bills Left onthe Sidewalk Why Some Nations Are Richand Others Poorrdquo Journal of Economic Per-spectives Spring 1996 10(2) pp 3ndash24
Organization for Economic Cooperation and De-velopment Education at a glance OECD in-dicators Paris Centre for EducationalResearch and Innovation 2001
Pasha Ha z A and Altaf Mir Anjum ldquoReturnMigration in a Life-Cycle Setting An Ex-ploratory Study of Pakistani Migrants inSaudi Arabiardquo Pakistan Journal of AppliedEconomics Summer 1987 6(1) pp 1ndash21
Prescott Edward C ldquoNeeded A Theory of TotalFactor Productivityrdquo InternationalEconomicReview August 1998 39(3) pp 525ndash51
Psacharopoulos George ldquoReturns to Investmentin Education A Global Updaterdquo World De-velopment September 1994 22(9) pp 1325ndash43
Ramos Fernando A ldquoOut-Migration and ReturnMigration of Puerto Ricansrdquo in George JBorjas and Richard B Freeman eds Immi-gration and the work force Economic con-sequences for the United States and sourceareas Chicago University of Chicago Press1992 pp 49ndash66
Rauch James E ldquoProductivity Gains from Geo-graphic Concentration of Human Capital Ev-idence from the Citiesrdquo Journal of UrbanEconomics November 1993 34(3) pp 380ndash400
Romer Paul ldquoIdea Gaps and Object Gaps inEconomic Developmentrdquo Journal of Mone-tary Economics December 1993 32(3) pp543ndash73
Schmidt Christoph M ldquoImmigrant Performancein Germany Labor Earnings of Ethnic Ger-man Migrants and Foreign Guest-WorkersrdquoQuarterly Review of Economics and Finance1997 Spec Iss 37 pp 379ndash97
Topel Robert ldquoLabor Markets and EconomicGrowthrdquo Working paper University of Chi-cago 1998
US Department of Commerce Bureau of theCensus 1990 census of population and hous-ing Washington DC US GovernmentPrinting Of ce 1990
US Immigration and Naturalization Service1998 statistical yearbook Washington DCUS Government Printing Of ce 1998
Venturini Alessandra and Villosio ClaudialdquoForeign Workers in Italy Are They Assim-ilating to Natives Are They CompetingAgainst Natives An Analysis by the SSADatasetrdquo Working paper University of Ber-gamo 1998
219VOL 92 NO 1 HENDRICKS HOW IMPORTANT IS HUMAN CAPITAL FOR DEVELOPMENT