13
How Important was Water Pricing in Achieving Conserva�on Goals During the California Drought? MAY 2018

How Important was Water Pricing in Achieving Conserva�on Goals During the California Drought?
MAY 2018

Water Pricing and Conserva�on During the California Drought
1 | The Environmental Finance Center at the University of North Carolina at Chapel Hill
Water pricing and residential water use data for hundreds of water agencies in California during the State-mandated conservation period (June 2015 - May 2016) were studied to find out if the water rates or rate structures that the agencies charged were a critical component in achieving greater conservation. This research revealed that the relationship between pricing and water use is not straightforward. Certain aspects of pricing—the rates and the rate structure design—were an essential aspect of some water agencies’ success in maintaining long-term efficient water use or meeting short-term curtailment goals, but not for other agencies. There is no single pricing solution that works for all water agencies to encourage conservation. Pricing can encourage conservation, but should be customized to local conditions and in the context of non-pricing conservation programs.
About the Environmental Finance Center
The Environmental Finance Center at the University of North Carolina at Chapel Hill is part of a network of university-based centers that work on environmental issues, including water resources, solid waste management, energy, and land conserva�on. The EFC at UNC partners with organiza�ons across the United States to assist communi�es, provide training and policy analysis services, and disseminate tools and research on a variety of environmental finance and policy topics.
The Environmental Finance Center at the University of North Carolina, Chapel Hill is dedicated to enhancing the ability of governments to provide environmental programs and services in fair, effec�ve, and financially sustainable ways.
Acknowledgements
Writen by Jeff Hughes, Shadi Eskaf, Elizabeth Harvell, Lexi Kay Herndon, and Kyrsten French.
This report is a product of the Environmental Finance Center at the University of North Carolina at Chapel Hill. Findings, interpreta�ons, and conclusions included in this report are those of the authors and do not necessarily reflect the views of EFC at UNC funders, the University of North Carolina, the School of Government, or those who provided review.
© 2017 Environmental Finance Center at the University of North Carolina, Chapel Hill
School of Government Knapp-Sanders Building, CB# 3330
University of North Carolina at Chapel Hill Chapel Hill, NC 27599-3330
htp://efc.sog.unc.edu

Water Pricing and Conserva�on During the California Drought
2 | The Environmental Finance Center at the University of North Carolina at Chapel Hill
The California Mandated Conservation Period and Promoted Pricing Strategies Following the lowest snowpack ever recorded and with no end to the drought in sight, 2015 was a year of historic drought in California. In response, California Governor Jerry Brown signed Execu�ve Order B-29-15 on April 1, 2015, direc�ng the State Water Resources Control Board (Water Board) to implement a 25 percent overall reduc�on on the state’s local water supply agencies over the next year1. The state-mandated conserva�on period lasted for 12 months, from June 2015 through May 2016. During this period, each local water agency was required to achieve a specific conserva�on standard, measured as a cumula�ve reduc�on in their potable water produc�on rela�ve to their equivalent produc�on in 2013. While the Water Board was responsible for se�ng each local water agency’s conserva�on standard, individual agencies were largely free to choose their own strategies for mee�ng their par�cular reduc�on goals. Agencies employed a diverse range of pricing strategies and non-pricing programs throughout the state-mandated conserva�on period. Non-pricing measures, including limi�ng the use of water for lawn irriga�on and increasing infrac�on enforcement for violators of conserva�on direc�ves, among others, were common for many water agencies. In addi�on, many agencies used pricing as an important part of a suite of strategies to encourage customers to reduce water use. Some agencies employed water rate structures such as budget-based rates, which is an increasing block rate structure where the block sizes are determined by a water budget that defines an efficient level of water use for each customer based on their individual characteris�cs, such as household size or number of water fixtures in the home. Others implemented temporary drought surcharges on high levels of water use, while some agencies raised water rates for all uses. The Water Board promoted pricing strategies, claiming that “conserva�on pricing is an effec�ve tool to prevent wasteful water use,”2 and listed various reports and examples as resources to water agencies seeking to learn more about using pricing as a strategy to curtail water use. The basic premise is that rate structures can be designed in ways to provide a financial incen�ve—a price signal—to customers to conserve water. In a staff presenta�on by the Water Board on July 8, 2015, several types of rate structure designs were shared as examples of conserva�on rates, including increasing block (�ered) rates, alloca�on-based rates (i.e. budget-based rates), seasonal rates, variable fixed rates, and dynamic rates that are applicable in the energy sector.3 At around the same �me, the California Urban Water Conserva�on Council published a Water Shortage Pricing Primer which describes varia�ons of drought surcharges and fee structures that apply during water shortage periods that can “help send a stronger signal to customers to meet a water use reduc�on target while providing the u�lity some revenue stability.”4
1 State of California Executive Department. 2015. Executive Order B-29-15. https://www.waterboards.ca.gov/waterrights/water_issues/programs/drought/docs/040115_executive_order.pdf 2 California Water Boards State Water Resources Control Board. 2018. State Water Board Drought Year Water Actions: Conservation Pricing. https://www.waterboards.ca.gov/waterrights/water_issues/programs/drought/pricing/ 3 California Water Boards, Office of Research, Planning, and Performance. 2015. Conservation Rates and Pricing: Overview and Framework. https://www.waterboards.ca.gov/waterrights/water_issues/programs/drought/pricing/docs/workshop/070815_10_staff_pres.pdf 4 California Urban Water Conservation Council. 2015. Jumpstart Water Shortage Toolkit: Tool #3 Water Shortage Pricing Primer. http://cuwcc.org/Portals/0/Document%20Library/Resources/Drought%20Resources/Tool%20Kit/Tool%203%20Water%20Shortage%20Rate%20Structure%20Primer.pdf

Water Pricing and Conserva�on During the California Drought
3 | The Environmental Finance Center at the University of North Carolina at Chapel Hill
These recommenda�ons all follow the basic economic theory that the more you charge, the less people use, and hence rate structures that charge higher rates for high levels of water use will incen�vize customers to curtail their use. Water pricing, however, is more nuanced. Although water agencies may carefully consider how to send appropriate price signals to customers through certain types of rate structures, predic�ng how different price signals influence actual customer consump�on is challenging. Pricing signals might not come across clearly enough to bring about an incen�ve to reduce usage, or they may be ineffectual if not designed appropriately for the local condi�ons and characteris�cs of the customer base. Furthermore, water agencies may not be able to design water rate structures that strongly incen�vize conserva�on, given some restric�ons imposed on water rates under Proposi�on 218. For instance, under a cost of service rate model, a water agency with low treatment and delivery costs cannot charge high rates to encourage conserva�on if those rates exceed what is required to recover the costs of service. This water agency will find it more difficult to use pricing as a tool to encourage conserva�on than a water agency that has the ability to charge higher rates. The Environmental Finance Center (EFC) at the University of North Carolina at Chapel Hill analyzed data on up to 398 California water agencies’ water pricing, residen�al water use, and produc�on data during the mandatory conserva�on period to examine the rela�onship between pricing and customer conserva�on. The data and study design are described later in this ar�cle. The EFC’s research suggests that se�ng water rates is complex and there is no single, defini�ve pricing solu�on for reducing water consump�on that is effec�ve for all water agencies across the state.
Pricing is Complicated, and there is No Single Pricing Solution for Conservation Approaches to water pricing across California are diverse, each providing a unique set of pricing signals to customers. For example, the 2015 water rates for a quarter of the surveyed water agencies were priced in a way that a residen�al customer reducing their water use from 12 hundred cubic feet (ccf) in one month to 6 ccf in the next month would have saved more than $23 in their water bill. Yet, water rates for a different quarter of the surveyed agencies were priced in a way that their customers would have saved less than $9, providing a much lower price signal that financially incen�vizes customers to conserve. To complicate maters, a significant number (nearly half) of the agencies that charged the lower price signals actually had increasing block rate structures or budget-based rate structures, both types described as examples of conserva�on rates in the Water Board’s presenta�on. Furthermore, among the agencies with the higher price signals are a few that charge a total monthly water bill for average water use levels that are low rela�ve to most other agencies in the state. Even though a rate structure might be designed in one way to encourage conserva�on, it may s�ll provide a weaker incen�ve to conserve than another rate structure that was not designed with the same objec�ve. Hence, water agencies should be wary of being too focused on a simple interpreta�on of the rela�onship between rate structures and conserva�on. The strength of pricing signals is influenced by more than just whether a rate structure is classified as a uniform structure, increasing block rates, or budget-based rates. In fact, the analysis showed there was no sta�s�cally significant difference in the water savings achieved between different water rate structure types, and that high water produc�on savings during the conserva�on period were achieved with all types of rate structures, as illustrated in Figure 1. None of the rate structure types was necessarily the dominant predictor of water savings. For example, when looking

Water Pricing and Conserva�on During the California Drought
4 | The Environmental Finance Center at the University of North Carolina at Chapel Hill
just at those agencies that use increasing block rates, it is clear that some agencies achieved much higher water produc�on savings (30 percent or higher) than others (savings of less than 15 percent), demonstra�ng that one rate structure design influences customer water usage dissimilarly in different agencies, based on a variety of factors. Furthermore, several agencies with uniform rate structures achieved the same level of high water produc�on savings that agencies with increasing block rates achieved, illustra�ng that high levels of conserva�on can be influenced by different types of rate structures. To incen�vize conserva�on, both the various elements of the rate structure as well as the rates themselves need to be inten�onally designed. Figure 1: Water Produc�on Savings under Various Water Rate Structure Types in California
Pricing signals vary, and water agencies that incur higher costs to acquire, treat, and supply water typically set higher prices with higher conserva�on signals, regardless of the type of rate structure used. This is illustrated in Figure 2, which reveals a nega�vely correlated rela�onship between the total water price charged for a specific monthly consump�on amount and the average residen�al water use. Agencies charging higher prices had, on average, lower average residen�al water use than agencies charging lower prices. Thus, agencies that charge the full cost of water service inherently send stronger pricing signals than if they underprice their services. For many agencies, the decision to charge the true cost of water service may be as important as whether to adopt an increasing block, budget-based, or uniform rate structure, as there is poten�al to have strong price signals with all of these approaches. Another way to look at this is that a water agency with higher costs and prices may not have to manipulate its rates or use complicated rate structures to send strong pricing signals to customers.

Water Pricing and Conserva�on During the California Drought
5 | The Environmental Finance Center at the University of North Carolina at Chapel Hill
Figure 2: Water Prices and Average Residen�al Water Use in California in 2016
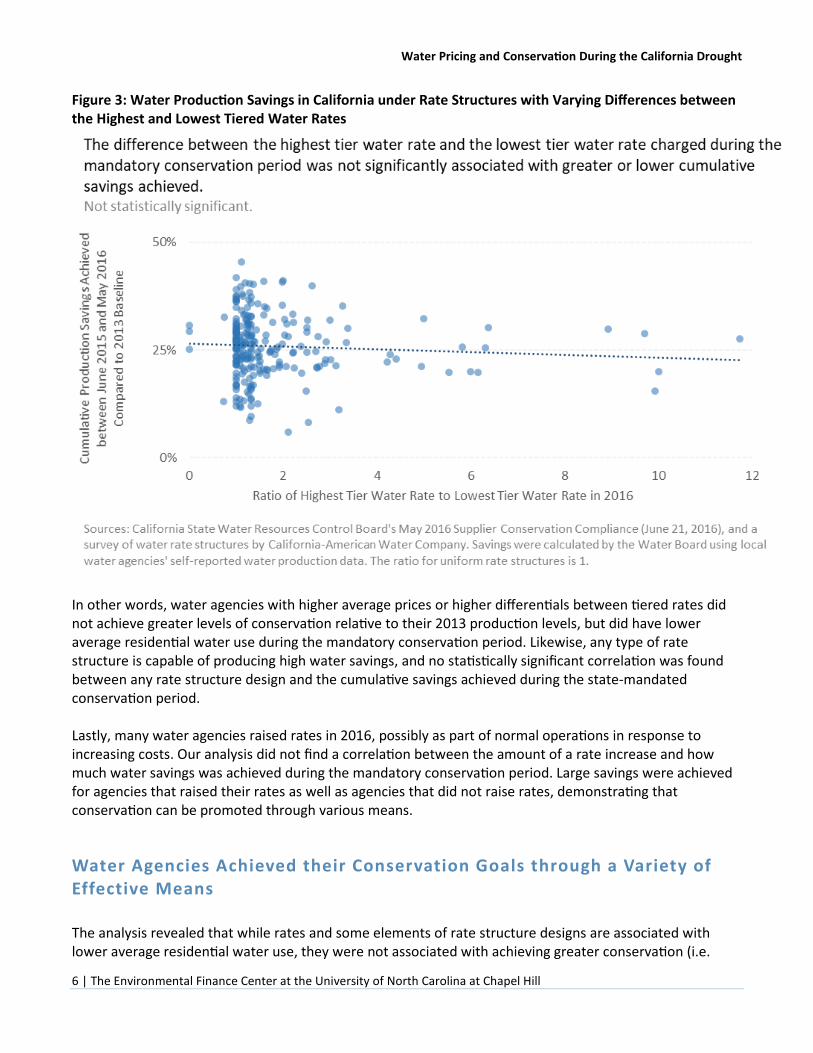
Increasing block rates or budget-based rates with steep differen�als between blocks are o�en designed to encourage conserva�on. For example, one agency’s volumetric water rate at the lowest �er was $1.95/ccf and at the highest �er was $16.97/ccf, making it 8.7 �mes higher than the lowest �ered rate. While the research found that larger differences between the highest and lowest �ered water rates is associated with lower average residen�al water use, it also revealed that those differences were not associated with greater water savings during the mandatory conserva�on period, shown in Figure 3. Similarly, while the prices charged at near-average consump�on were associated with lower average water use, they were not associated with greater water savings achieved during the mandatory conserva�on period.
Water Pricing and Conserva�on During the California Drought
6 | The Environmental Finance Center at the University of North Carolina at Chapel Hill
Figure 3: Water Produc�on Savings in California under Rate Structures with Varying Differences between the Highest and Lowest Tiered Water Rates
In other words, water agencies with higher average prices or higher differen�als between �ered rates did not achieve greater levels of conserva�on rela�ve to their 2013 produc�on levels, but did have lower average residen�al water use during the mandatory conserva�on period. Likewise, any type of rate structure is capable of producing high water savings, and no sta�s�cally significant correla�on was found between any rate structure design and the cumula�ve savings achieved during the state-mandated conserva�on period. Lastly, many water agencies raised rates in 2016, possibly as part of normal opera�ons in response to increasing costs. Our analysis did not find a correla�on between the amount of a rate increase and how much water savings was achieved during the mandatory conserva�on period. Large savings were achieved for agencies that raised their rates as well as agencies that did not raise rates, demonstra�ng that conserva�on can be promoted through various means.
Water Agencies Achieved their Conservation Goals through a Variety of Effective Means The analysis revealed that while rates and some elements of rate structure designs are associated with lower average residen�al water use, they were not associated with achieving greater conserva�on (i.e.

Water Pricing and Conserva�on During the California Drought
7 | The Environmental Finance Center at the University of North Carolina at Chapel Hill
reduc�ons in water use) during the mandatory conserva�on period. In other words, pricing does not appear to be the dominant tool that was used to generate short term curtailments. Yet, high levels of conserva�on were achieved during the 12-month period. The EFC’s research also looked at the basic rela�onships between higher levels of short-term conserva�on, non-price conserva�on strategies, and several external drivers that are typically associated with water savings. Based on a simple bi-variate analysis, one of the most successful strategies appears to have focused on strict local enforcement of conserva�on direc�ves by issuing warnings to customers that violated them. Water agencies that issued a greater number of infrac�on warnings, normalized by service popula�on size, achieved greater cumula�ve savings during the mandatory conserva�on period than those that did not issue as many warnings, as illustrated in Figure 4. A similar result was found when analyzing the number of penal�es issued to customers, suppor�ng the finding that greater local enforcement of conserva�on direc�ves was an effec�ve strategy on average across mul�ple water agencies in California. Figure 4: Water Produc�on Savings under Various Levels of Local Water Agency Enforcement (i.e. Warnings Issued) in California
In an age of constant news streams, media coverage of the drought also played an important role during the conserva�on period. Water conserva�on adver�sing by Governor Brown and media coverage of the issue contributed heavily to the water agencies’ savings. A recent Stanford study by Quesnel and Ajami, which developed an algorithm to quan�fy drought coverage by state and na�onal news outlets, linked real water consump�on data in California with the public aten�on garnered by the drought and subsequent

Water Pricing and Conserva�on During the California Drought
8 | The Environmental Finance Center at the University of North Carolina at Chapel Hill
conserva�on period.5 The study demonstrated that single-family residen�al customers reduced water consump�on at the fastest rate following intense drought-related news media coverage. One reason why higher water rates were associated with lower average residen�al water use but not with greater cumula�ve water savings is probably because the agencies that had higher pricing signals already had lower water use before the conserva�on period began. Thus, they were not able to achieve greater levels of conserva�on than agencies that had lower pricing signals and higher average use at the start. This is supported by another result of the analysis: water agencies star�ng the conserva�on period with a higher level of average residen�al water use were able to achieve greater cumula�ve savings than water agencies with more efficient customers from the start. In other words, more room for improvement means greater opportunity for progress. This is shown in Figure 5. However, it is important to remember that agencies with lower residen�al water use before the conserva�on period had lower conserva�on standards to achieve, reflec�ve of their already-more efficient water demands. This result highlights another key point: as water use becomes more efficient over �me under typical supply condi�ons, the flexibility that water agencies have in achieving significant short-term curtailment in demand during water shortage periods becomes limited. If Californians become more efficient water users in the long-term, they will find it harder to make short-term sacrifices and cut use even further during water shortage periods. The long-term water resources goal for water agencies is to encourage more efficient use among its customers, but it is not expected that customers will maintain their drought-�me use levels constantly. Beyond the control of the water agencies are external factors that affect how much water people use, and influenced the cumula�ve water savings during the conserva�on period, no mater the pricing signal or non-pricing conserva�on strategies employed. The EFC’s analysis iden�fied that weather paterns and household characteris�cs were important external factors. Average residen�al water use in June 2016 was, on average, higher in communi�es that had higher temperatures during that month than in other communi�es. Further, higher cumula�ve savings were achieved in communi�es with higher median household incomes and in communi�es with lower average household size.
5 Quesnel, K.J., & Ajami, N.K. 2017. Changes in water consumption linked to heavy news media coverage of extreme climatic events. Science Advances. Vol. 3, no. 10. DOI: 10.1126. http://advances.sciencemag.org/content/3/10/e1700784

Water Pricing and Conserva�on During the California Drought
9 | The Environmental Finance Center at the University of North Carolina at Chapel Hill
Figure 5: Water Produc�on Savings Achieved a�er Different Star�ng Points in Average Residen�al Water Use before the Conserva�on Period in California
Water Agencies Should Customize Pricing to Local Conditions and Consider Non-Pricing Conservation Programs Given the findings above on pricing, non-pricing strategies, local condi�ons, and their correla�ons with average water use and conserva�on, all of those factors need to be considered simultaneously at the local level to design effec�ve pricing and non-pricing strategies to encourage conserva�on. What is effec�ve for one water agency may not be as effec�ve for another water agency with different customer characteris�cs. The diversity of local condi�ons and costs defy a one-size-fits-all approach to pricing and conserva�on strategies across the state. Some water agencies have high water rates and do not need complex rate structures to convey conserva�on price signals, while others might rely more on the rate structure design than high rates. Water agencies with inexpensive treatment and delivery costs, or those that have avoided rate increases to keep water rates low, will provide litle incen�ve for customers to save water unless the rate structure has a design that signals an incen�ve to maintain low water use. It is also likely that these agencies will have to work harder with non-pricing conserva�on strategies to encourage water savings. In using pricing as a strategy to encourage conserva�on or low water use, as stated above, water agencies can cra� aggressive pricing signals with nearly any type of rate structure, and the rates themselves are as

Water Pricing and Conserva�on During the California Drought
10 | The Environmental Finance Center at the University of North Carolina at Chapel Hill
important in influencing water use as the rate structure designs. A uniform rate structure with high volumetric rates could provide greater financial incen�ves for the customers to reduce water use than an increasing block rate structure with low rates and low price differen�als between blocks. In addi�on, all rate structures could further encourage conserva�on by implemen�ng drought-period pricing strategies such as temporary drought surcharges. For example, Figure 6 displays the rate structures of eight California water agencies. Even though all eight agencies used uniform rate structures, the prices charged to customers provide very different financial incen�ves to reduce or maintain low water use. Figure 6: Example of Eight Uniform Rate Structures Charged to Residen�al Customers in 2016
Furthermore, two of the water agencies in Figure 6 implemented drought surcharges to encourage conserva�on and to recoup revenue from the sharp decline in water use during the mandatory conserva�on period. Even without employing block pricing, these agencies were able to send very different price signals to their customers than the other agencies. One of these agencies (orange line) imposed a volumetric surcharge on water use above 8.5 ccf/month, thereby essen�ally crea�ng a temporary increasing block rate structure. The other agency (blue line) implemented a drought surcharge of $0.50/ccf for all water use. However, customers with water use under 200 gallons per day (gpd) were given a full refund on that surcharge on the same bill. The drought surcharge and credit were dis�nct line items on the water bill. When the drought surcharge actually “kicked in” at any amount over 200 gpd, the drought charge then applied to all of the customer’s water use. This means that the next gallon used above 200 gpd was the most expensive gallon purchased, at a total of $4.00. This price jump can be seen in Figure 6, at the

Water Pricing and Conserva�on During the California Drought
11 | The Environmental Finance Center at the University of North Carolina at Chapel Hill
8 ccf mark. These two different approaches to implemen�ng temporary drought surcharges created different price signals to the customers, par�cularly during the mandatory conserva�on period when the surcharges were in effect.
Data and Study Design Each month during the mandatory conserva�on period, the local water agencies reported to the Water Board data on their water produc�on, number of customers, enforcement metrics, number of days when outdoor watering was permissible, and various other sta�s�cs. In addi�on, the water agencies were required to report their pricing, rate structures, and water usage data, among other informa�on, to the Water Board via the Electronic Annual Repor�ng System. About the same �me, one of the state’s largest water agencies completed its own statewide survey of water rate structures. Data from these sources provided an opportunity to study different pricing strategies and signals that agencies throughout the state used to influence usage during the mandatory conserva�on period. In the wake of this unique opportunity, a group of California water agencies asked the EFC to collect and analyze informa�on that could provide insight on how pricing, conserva�on measures, and a range of other factors might have influenced customer water consump�on behavior. In par�cular, the EFC:
1) determined the varia�on in water pricing signals employed by water agencies across the State before and during the mandatory conserva�on period,
2) determined the significance of pricing and non-pricing strategies in reducing water use during the mandatory conserva�on period, and
3) assessed the rela�onship between water pricing and residen�al water use at the conclusion of the mandatory conserva�on period.
To conduct these analyses, the EFC explored the annual pricing data (including rate structure designs, rates, drought surcharges, and changes from one year to the next) and the monthly usage data reported by 398 water agencies to the Water Board. Sta�s�cal analyses were conducted to test the significance of the bivariate rela�onships between various elements of pricing and non-pricing strategies with the achieved conserva�on levels during the conserva�on period and with the average residen�al water use post-conserva�on period. It is important to note that although extensive data cleaning was performed, some of the data reported by the water agencies to the Water Board may be prone to repor�ng errors not corrected by the data cleaning, or data may have been incomplete. At present, we performed exploratory analyses and tested bivariate correla�ons between pricing and non-pricing factors on water use and cumula�ve savings; the main results of which are described in this ar�cle. Future work will include more detailed explanatory analyses, including mul�variate regressions of the data.
What this Means for Future Strategies In the face of a changing climate, heightening water supply stress, and increasing popula�on, conserva�on efforts are likely to be a trending topic for water agencies in California and across much of the country for the foreseeable future. As conserva�on efforts—and possibly mandates—con�nue, water agencies should

Water Pricing and Conserva�on During the California Drought
12 | The Environmental Finance Center at the University of North Carolina at Chapel Hill
s�ll focus on using pricing as a strategy and understand the signals their pricing structures send, but should also consider pricing in the context of other measures. While the study did not show that pricing was correlated with higher levels of short-term curtailment/conserva�on, it did show that pricing was correlated with average water use, and that some agencies successfully employed pricing to meet reduc�ons. In order for pricing to be effec�ve, both the rates and elements of the rate structure need to be designed inten�onally to provide appropriate price signals to encourage conserva�on. However, there is no evidence to suggest that any single approach employed by any water agency was effec�ve across all of California in achieving water savings, or that pricing was the sole factor in reaching conserva�on goals. In fact, the research adds to the list of studies that iden�fied non-pricing conserva�on programs as effec�ve mechanisms to achieve short-term reduc�ons in water use.
In future periods of conserva�on, water agencies should consider their demographic, geographic, and climate-related situa�ons when making determina�ons about how to encourage conserva�on through pricing and non-pricing strategies.


