38
Glenn McGillivray Managing Director, Institute for Catastrophic Loss Reduction Philip Kaszuba President, DMTI Spatial
| Date post: | 18-Jul-2015 |
| Category: |
Economy & Finance |
| Upload: | dmti-spatial |
| View: | 117 times |
| Download: | 0 times |

Glenn McGillivrayManaging Director, Institute for Catastrophic Loss Reduction
Philip KaszubaPresident, DMTI Spatial

The trend to more and larger catastrophic losses in CanadaGlenn McGillivrayManaging Director
Institute for Catastrophic Loss ReductionMarch 11, 2015

ICLR Mission - reduce loss of life and property caused by severe
weather and earthquakes Created in 1997 by the insurance community to confront
rising disaster losses Multi-disciplinary research and education provides an
essential foundation for “science to action” Financed by member assessments (formula based on
premiums written), and flat-fee basis for associate members Historically, some funding through government programs Fee-based for specific research projects

Insured losses by peril
CLIMATE RELATED
EARTHQUAKES VOLCANOES
GEOPHYSICALEarthquake, volcanic eruption
METEOROLOGICALSevere weather, winter & tropical storms, hail, tornado
HYDROLOGICALRiver & flash flood, storm surge, landslide
CLIMATOLOGICALHeatwave, freeze, wildland fire, drought
TREND

Canadian cats 2013
Two small events early in the year Southern Alberta flood (June 19-21)$1.7 billion (preliminary)
GTA flood (July 8-9) >$850 million (preliminary)
Ontario/Quebec storm (July 19)$225 million

Calgary, Alberta, Canada
© 2013 AP Photo/The Canadian Press, Jonathan Hayward
>$1.7 billion insured damage

Toronto, Ontario
© 2013 AP Photo/The Canadian Press, Winston Neutel
$940 million insured damage

2013 high water marks
Canada’s costliest and third costliest insured loss events within two weeks of each other
Ice storm now the second costliest – took 15 years! Two billion dollar natural catastrophes in one year –
a first! Second place event (Slave Lake) fell not one, but
two notches to fourth place 5th consecutive year of billion-dollar events

Toronto, Ontario
$225 million insured damage

Canadian cats 2014 Angus tornado (June 17)>$30 million
Saskatchewan & Manitoba storms (June 28) Ontario storms/Burlington flood (August 4)$90 million
Alberta wind & thunderstorms (August 7 & 8)$450 million
Ontario/Quebec windstorm (November 24) $872 million (preliminary)

Aidrie, Alberta hailstorm
$450 million insured damage
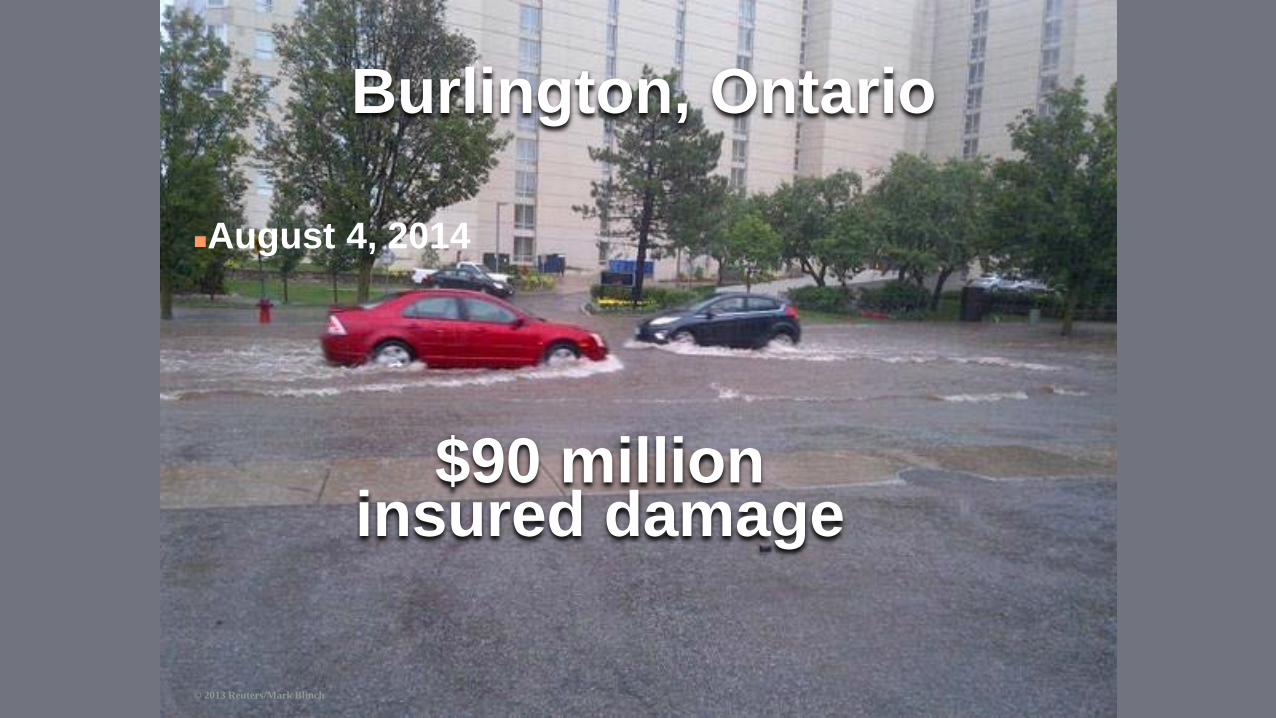
Burlington, Ontario
August 4, 2014
© 2013 Reuters/Mark Blinch
$90 million insured damage

Billion-dollar years 1998 – due solely to the ice storm 2005 – due greatly to the August 19 GTA rainstorm 2009 – due greatly to back-to-back windstorms in Alberta 2010 – due greatly to large hailstorm in Alberta 2011 – due greatly to Slave Lake wildfire 2012 – due greatly to one large and two smaller hailstorms in Alberta 2013 – due to the Southern Alberta flood and GTA flood
First time ever for two billion-dollar events
2014 - $872 million (preliminary)

Avg. difference between loss ratios
(Auto vs. personal property)
0.00%2.00%4.00%6.00%8.00%
10.00%12.00%14.00%16.00%18.00%20.00%
1983-1992 1993-2002 2003-2012

Why are losses rising?
More people and property at risk Aging infrastructure The climate is changing

Residential structures
Source: ICLR, based on data from Statistics Canada

Aging infrastructure
Source: Federation of Canadian Municipalities

Source: Meteorological Service of Canada, Environment Canada.
Between 1975-1995 and 2080-2100, Canadian climate change model
Projected winter temperature change
Not just personal property…
Increasing liability concernsCorporate/professional
Directors and officersErrors and omissions
PublicMunicipal

Some of the challenges Fire policy has become a water policy
Need data and information Large insurers have resources (eg. GIS), medium and small
players often do not Large players often don’t ‘share’
Past loss experience no longer indication of future losses Proliferation of modeling
Data hungry Very competitive market
Need to make good decisions quickly More severe weather ahead
Need to manage accumulations better

Some of the challenges
Often more data required from reinsurers Increasing need to explain market changes to
insureds (i.e. why premiums are rising) More demands from regulators (eg. earthquake) Need to better understand impact of climate change
on your book of business Introduction of a flood insurance product(?) Need to keep claims costs down

Data issues Overall poor government hazard data quality in Canada Government data scattered over many departments (no central
repositories) Some sources have been destroyed (eg fisheries libraries) or
scaled back (long form census) Data often scattered across the provinces (eg. wildfire) Government cutbacks over the years have taken their toll
Downloading/offloading (eg. flood mapping) Some hazard info better than others (earthquake is quite good,
flood fairly poor) Who’s has what, where, and how do we get at it?

Data issues Many private sources of dataSome of it is proprietary and owners keep it close to
the vestNeed to be careful of anti-competitive behaviourSome data has a price tag on it
Quality variesIf it seems too good to be true…
Privacy issues abound Even if you get good data, does your company have
the resources to analyze and act on it?

“Intact Financial and DMTI Spatial worked together to create and roll out a new visual user interface to enable 1,200 underwriters to make more informed and faster decisions regarding new and renewal policies. Efficiencies achieved during the quoting process resulted in a 15% reduction in processing time making the payback period for this project 6 months.”

Potential RisksHow can you constantly assess risk to minimize the impact on your book of business?

6 Steps to Leveraging Location
Back OfficeOperationsUnderwriting &
Claims
Post-EventTechnology Marketing

Underwriting & ClaimsUnderstand risks before a policy is assumed
Connect to enhanced perils & data layers
Analyze concentration
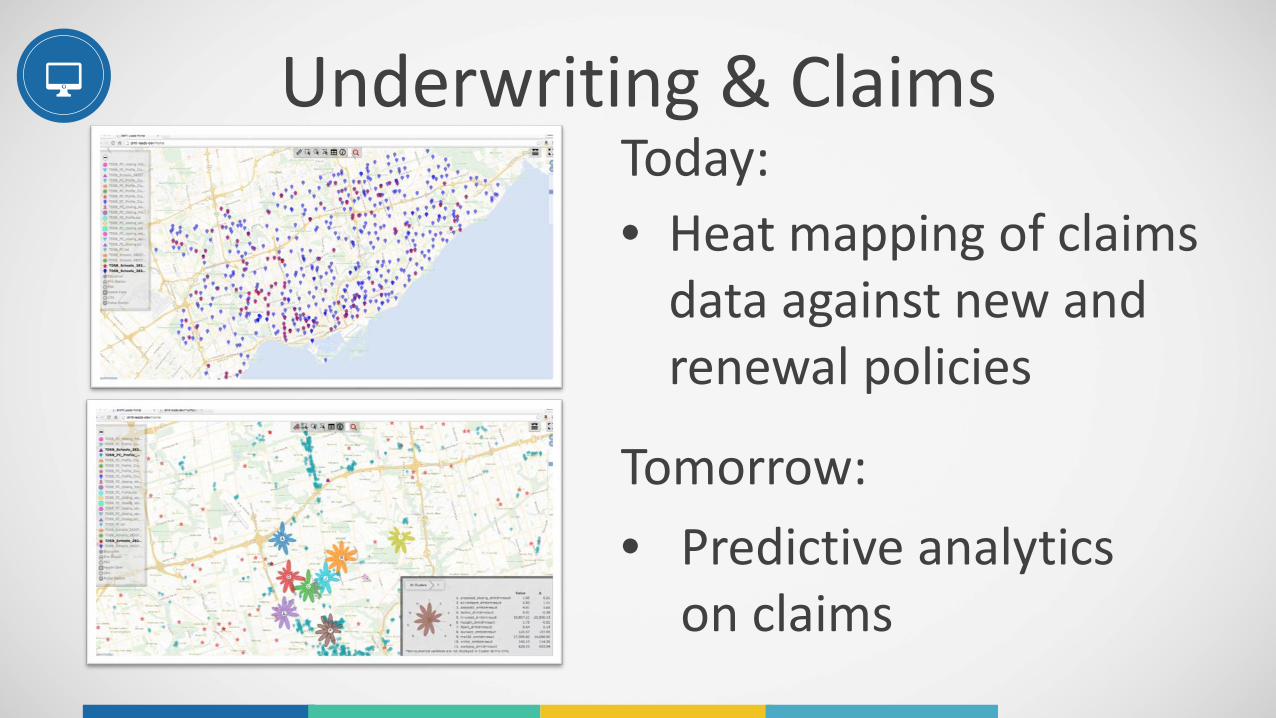
Underwriting & ClaimsToday:• Heat mapping of claims
data against new and renewal policies
Tomorrow:• Predictive analytics
on claims

Operations: Internal⁺ Connect 5 disparate sources
to 1 single national view⁺ Consistent processes⁺ Baseline training⁺ Best practices sharing15% productivity improvement

Operations: External
Location Based Ecosystem

Back OfficeProcesses
Claims Mapping vs. Entire Portfolio
Defining restricted zonesIncluding additional scrutiny & re-insurance needs
Portfolio AnalysisPortfolio Analysis – national concentration and risk exposure / hit rate vs pricing vs risks and exposure
Risk mapping across the portfolio

Post Event Analysis
Service customers more effectively when an event occurs.
Mitigate future risks by understanding the impact
of past events.
Understand Events as they occur, including lists of
customers, affected areas and satellite imagery.

MarketingProfile your best customers, and find your best prospects.

viewanalyzeclusterinfillexport
Marketing – Location Predictive Analytics
Analyze PerformanceUnderstand your current market penetration by policy and by broker. Analyze portfolio performance against thousands of demographic variables.
Find ProspectsUse your base of current customers to define your best future prospects using Location –avoid a one-size fits all solution and target your messaging in a way that drives higher engagement.

Technology
Leveraging cloud architectures to lower costs and increase data currency.
Highly Scalable architectures can grow as you instill location into more processes.
Big Data Friendly – Geocoding your book of business allows you to leverage a growing world of data for deeper analytics.
Secure – communicating using UAID keeps proprietary data secure.

We ignite the power of location for every individual, allowing every business to reach its full potential.
Connect Analyze Act

Questions?


