How Many Volunteers Does It Take To Map An Area Well? Dr Muki Haklay Department of Civil, Environmental and Geomatic Engineering, UCL [email protected]Aamer Ather (M.Eng 2009), Sofia Basiouka (MSc GIS 2009) and Naureen Zulfiqar (M.Eng 2008) Ordnance Survey data was kindly provided by the Ordnance Survey research unit. OSM data was provided by GeoFabrik & CloudMade
Transcript
How Many Volunteers Does It Take To Map An Area Well?
Dr Muki Haklay Department of Civil, Environmental and Geomatic Engineering, UCL [email protected]
Aamer Ather (M.Eng 2009), Sofia Basiouka (MSc GIS 2009) and Naureen Zulfiqar (M.Eng 2008)
Ordnance Survey data was kindly provided by the Ordnance Survey research unit. OSM data was provided by GeoFabrik & CloudMade
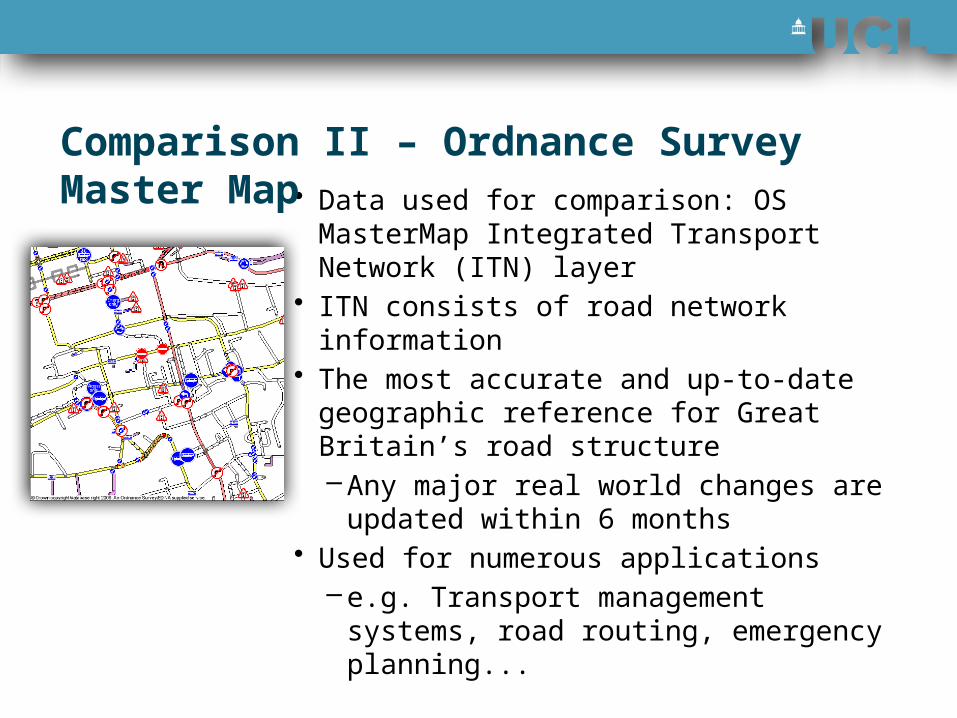
• Evaluation of OSM with Meridian data set• Evaluation of OSM with MasterMap• Linus’ low –more users: higher quality?
The quality issue
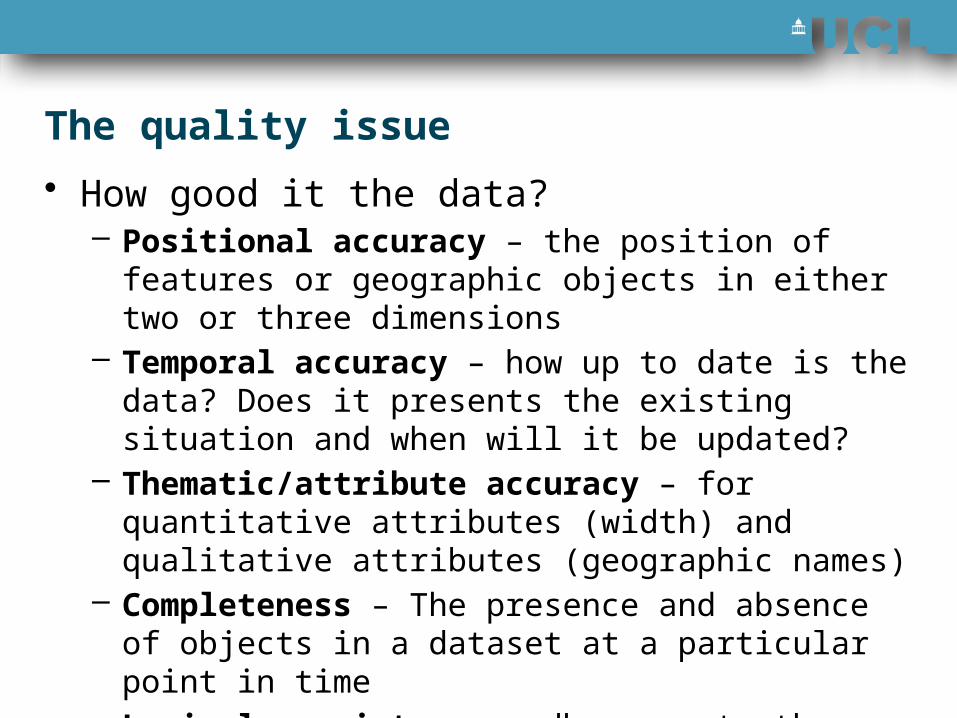
• How good it the data?
– First question: good for what? Subjective quality – fitness for purpose/use
– Second question: how to measure? Objective quality – but need to evaluate it in light of the first question
The quality issue
• How good it the data? – Positional accuracy – the position of features
or geographic objects in either two or three dimensions
– Temporal accuracy – how up to date is the data? Does it presents the existing situation and when will it be updated?
– Thematic/attribute accuracy – for quantitative attributes (width) and qualitative attributes (geographic names)
– Completeness – The presence and absence of objects in a dataset at a particular point in time
– Logical consistency –adherence to the logical rules of the data structure, attribution and relationships
The ‘problem’
“We know little about the people that collect it, their skills, knowledge or patterns of data collection”
“Loose coordination and no top-down quality assurance processes – can’t produce good data”
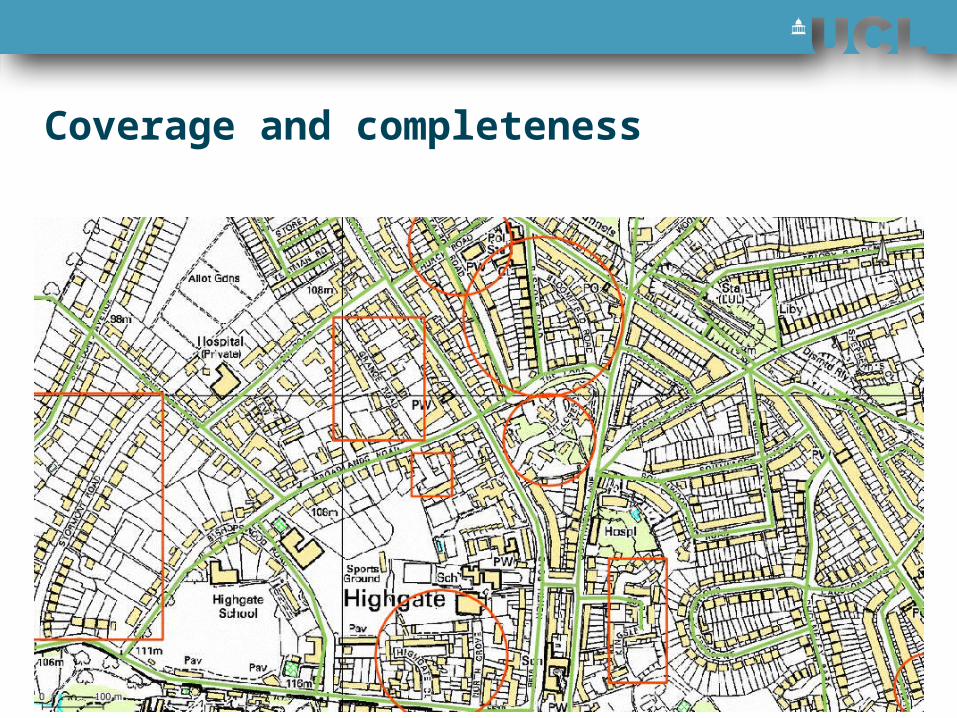
“It is not complete and comprehensive – there are white areas”
Coverage and completeness
Coverage and completeness
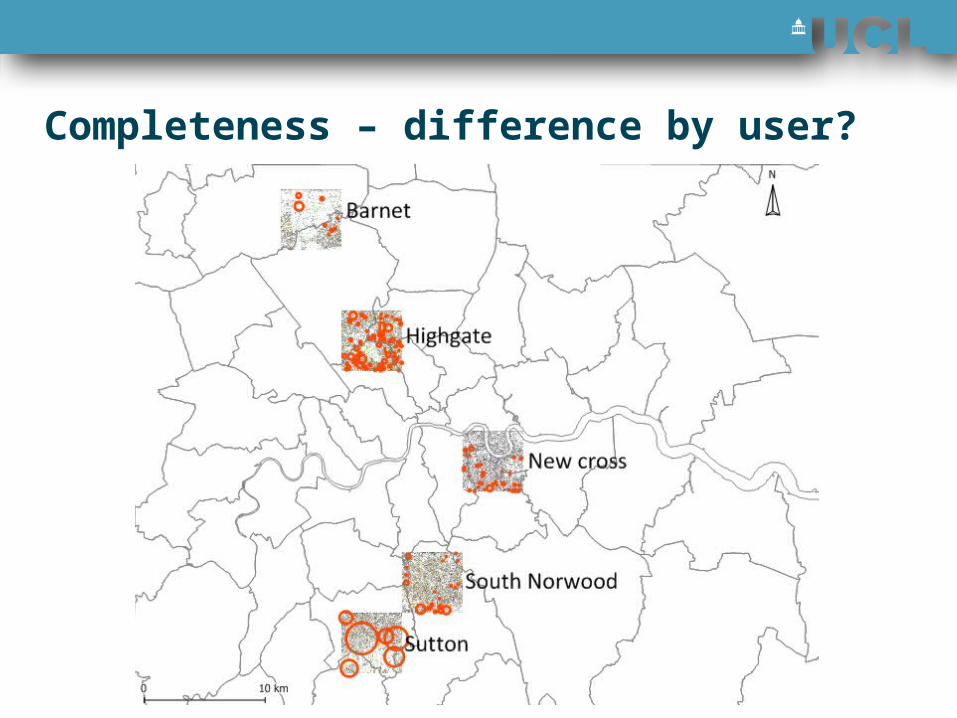
Completeness – difference by user?
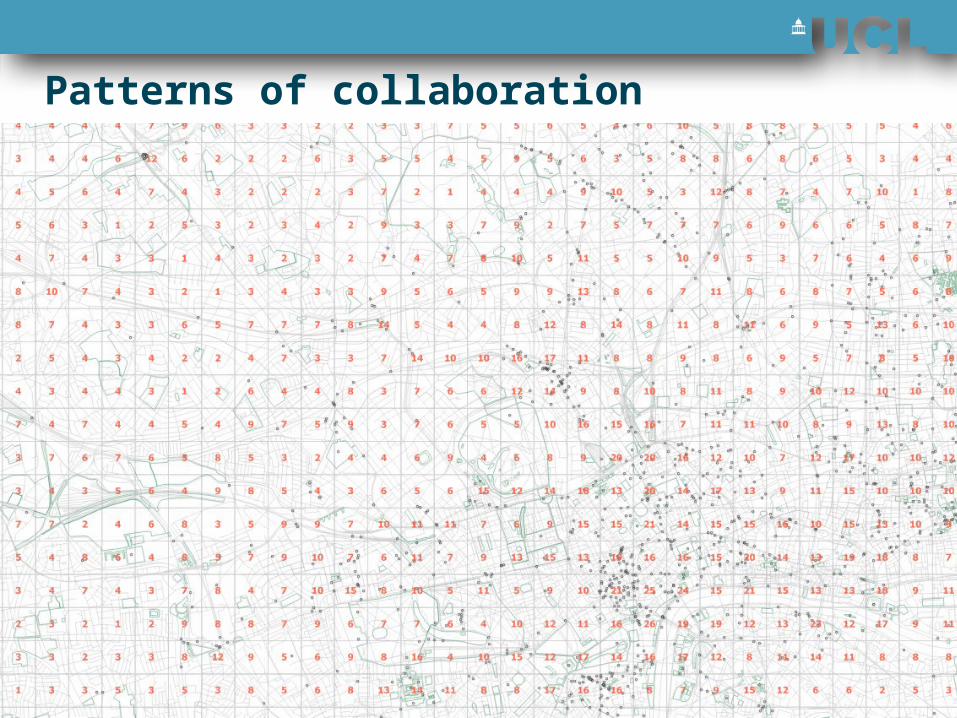
Patterns of collaboration
Number of Users Area covered (Sq Km)1 400212 207203 91364 41845 19866 9367 4488 2699 13910 and above 246
Users
• Limited ‘on the ground’ collaboration. Important as this can be the main source of quality assurance - ‘Given enough eyeballs, all bugs are shallow’ (Raymond, 2001)
• Translate to VGI it might mean:“The more users there are per area, the better is the positional and attribute quality”
• But does Linus’ law apply to OSM (and to VGI)?!?
Accuracy and Completeness- Study I
• Comparing OSM to OS Meridian 2 roads layer
• Maridian 2 -Motorways, major and minor roads are... Complex junctions are collapsed to single nodes and multi-carriageways to single links... some minor roads and cul-de-sacs less than 200m are not represented... Private roads and tracks are not included...
• Nodes are derived from 1:1,250-1:2,500 mapping, with 20m filter around centre line generalisation
Positional Accuracy
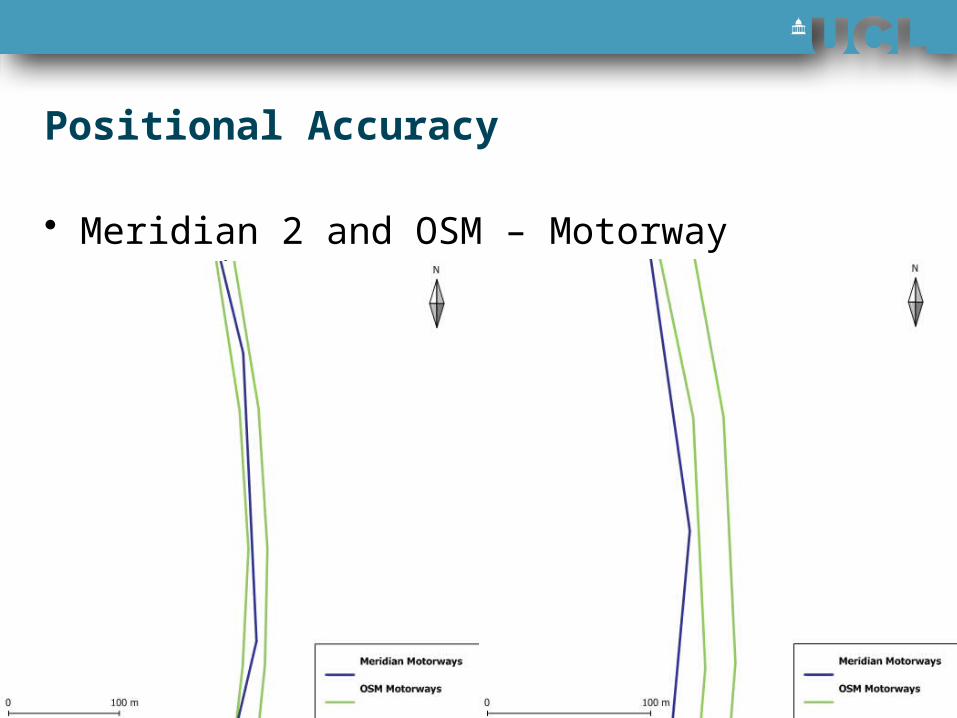
• Meridian 2 and OSM – Motorway comparison
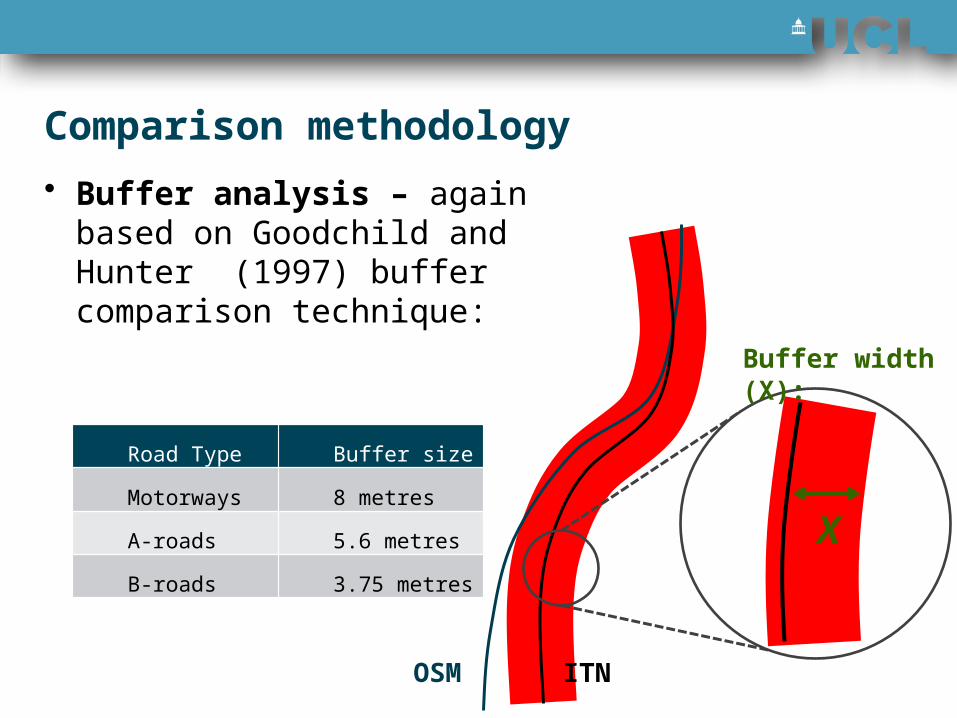
Goodchild and Hunter (1997), Hunter (1999) method
• Assuming that one dataset is of higher quality
• Create buffer around the dataset with known width
• Calculate the percentage of the evaluated dataset that falls within the buffer
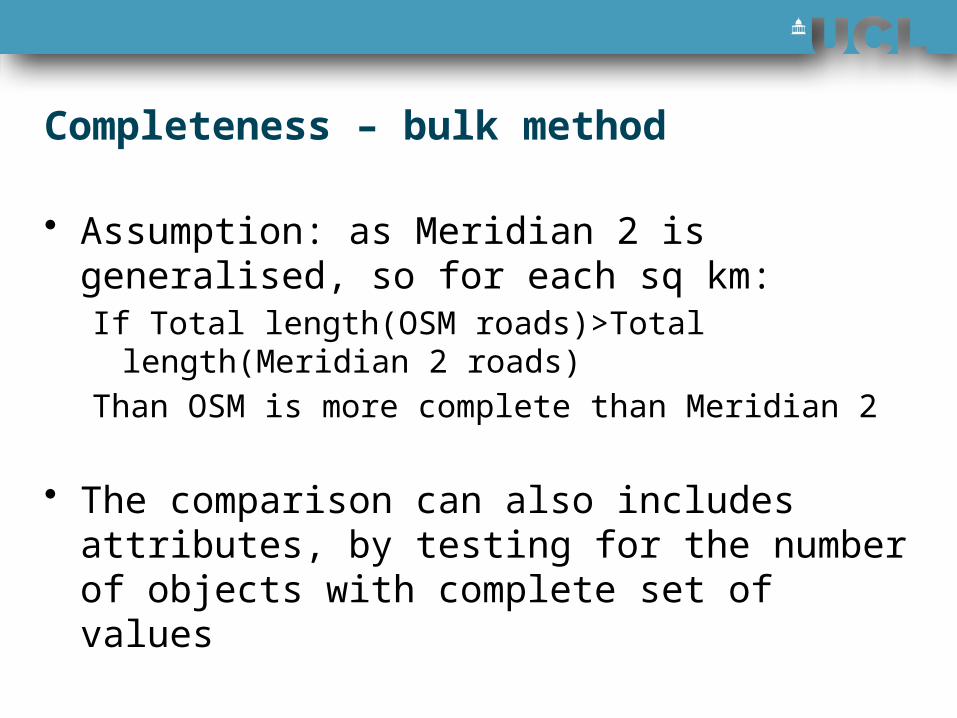
• Assumption: as Meridian 2 is generalised, so for each sq km:If Total length(OSM roads)>Total length(Meridian 2
roads)Than OSM is more complete than Meridian 2
• The comparison can also includes attributes, by testing for the number of objects with complete set of values
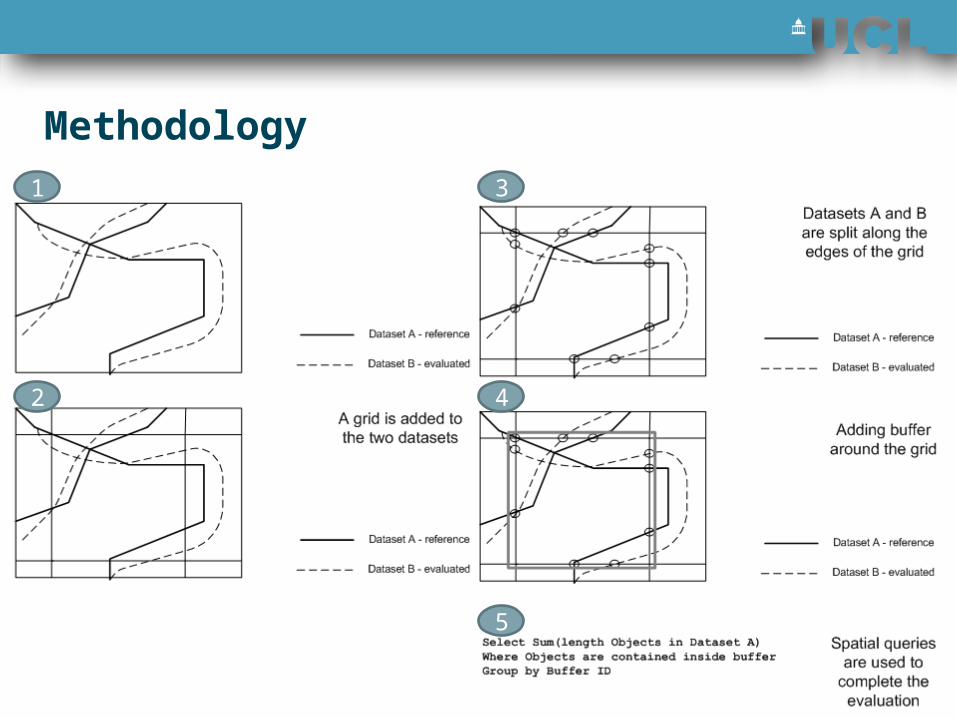
1
2
3
5
Methodology
4
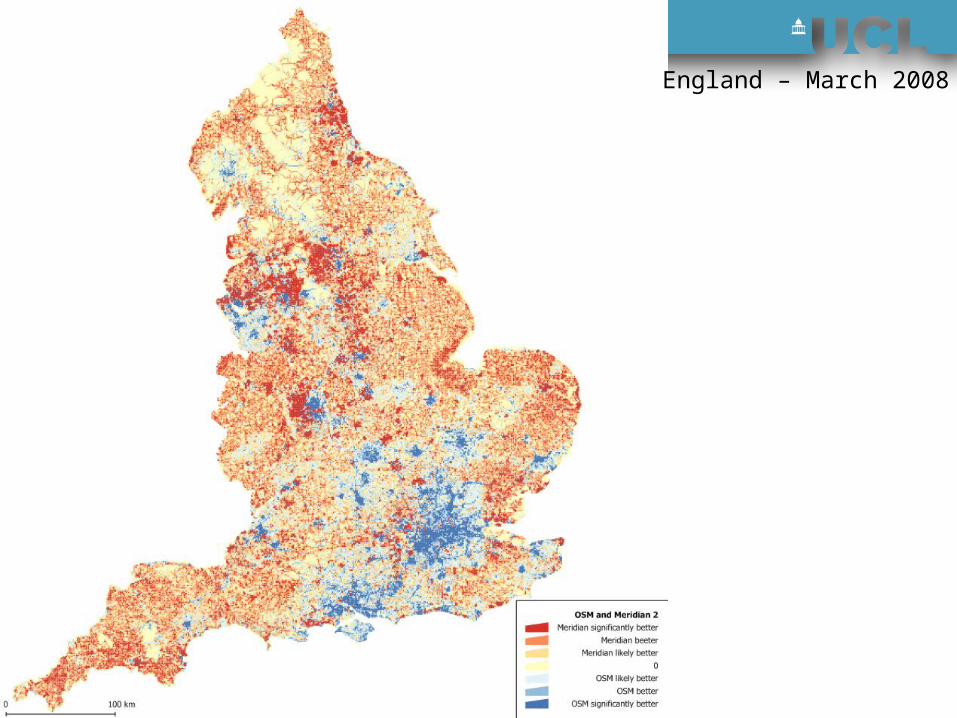
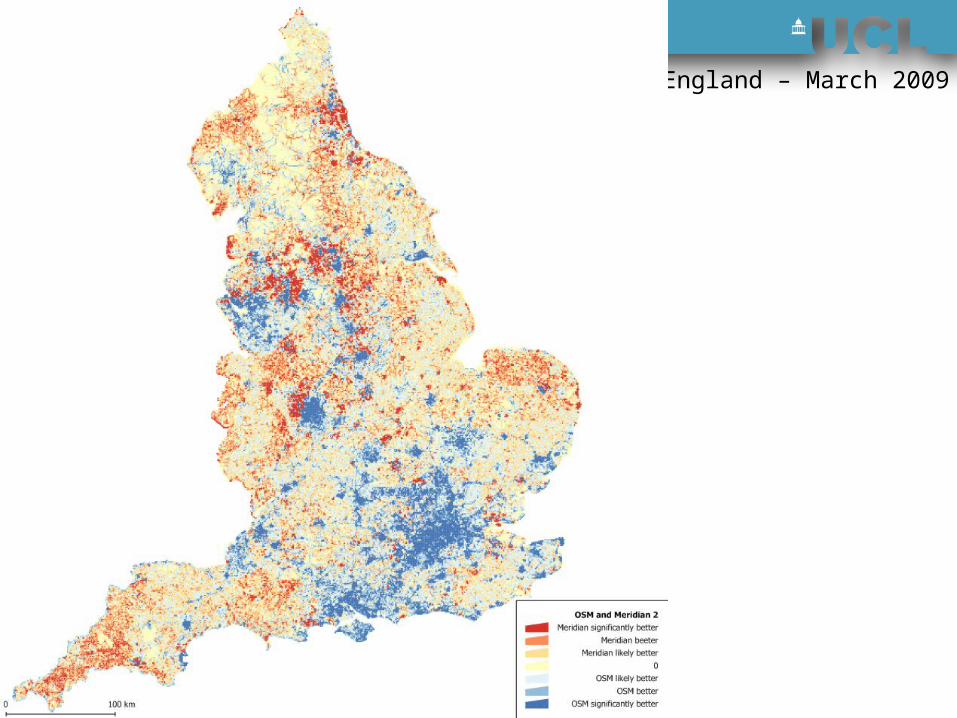
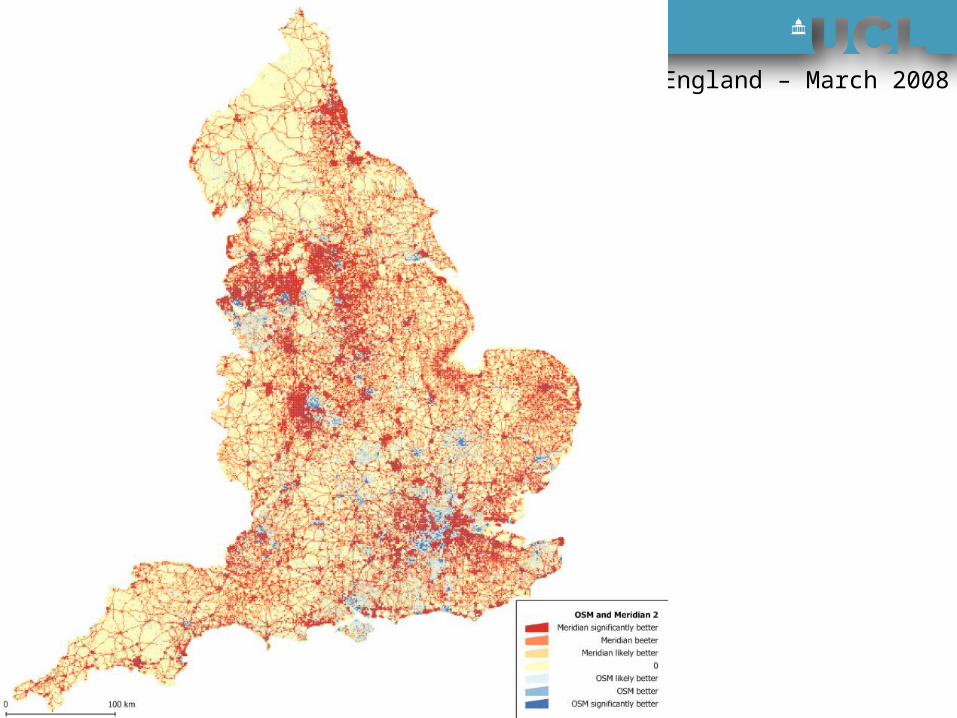
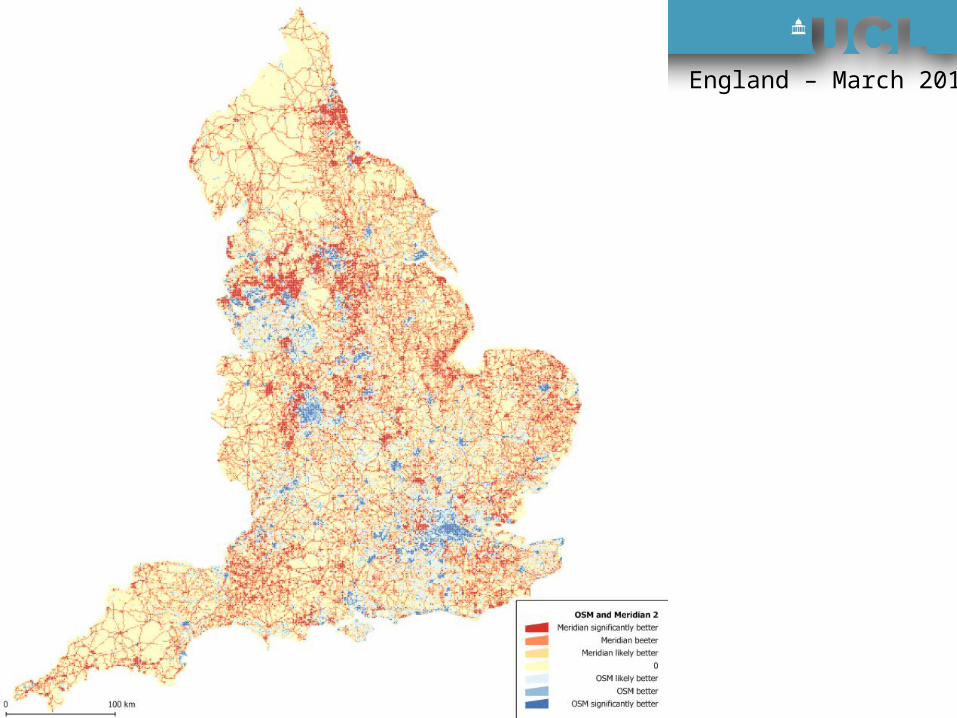
Change in completeness Mar 2008 – Mar 2010
England – March 2008
England – March 2009
England – October 2009
England – March 2010
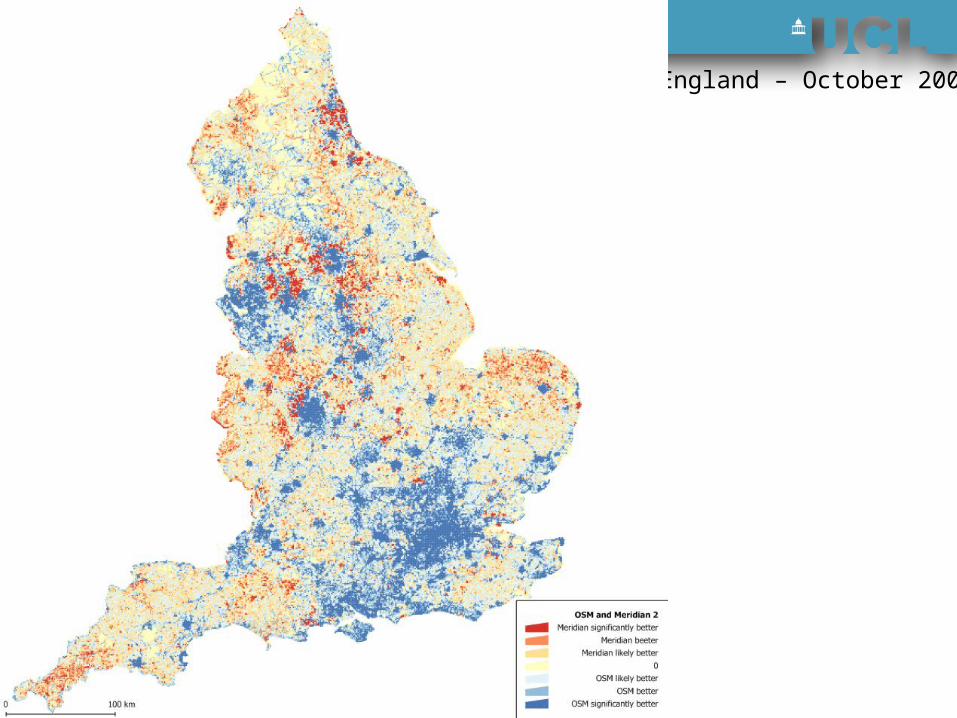
Completeness with attributes
• The test for completeness with attributes checks that roads and streets names have been completed
• Until the release of Ordnance Survey data in 1st April 2010, this was a good indication for ground survey of an area
England – March 2008
England – March 2009
England – October 2009
England – March 2010
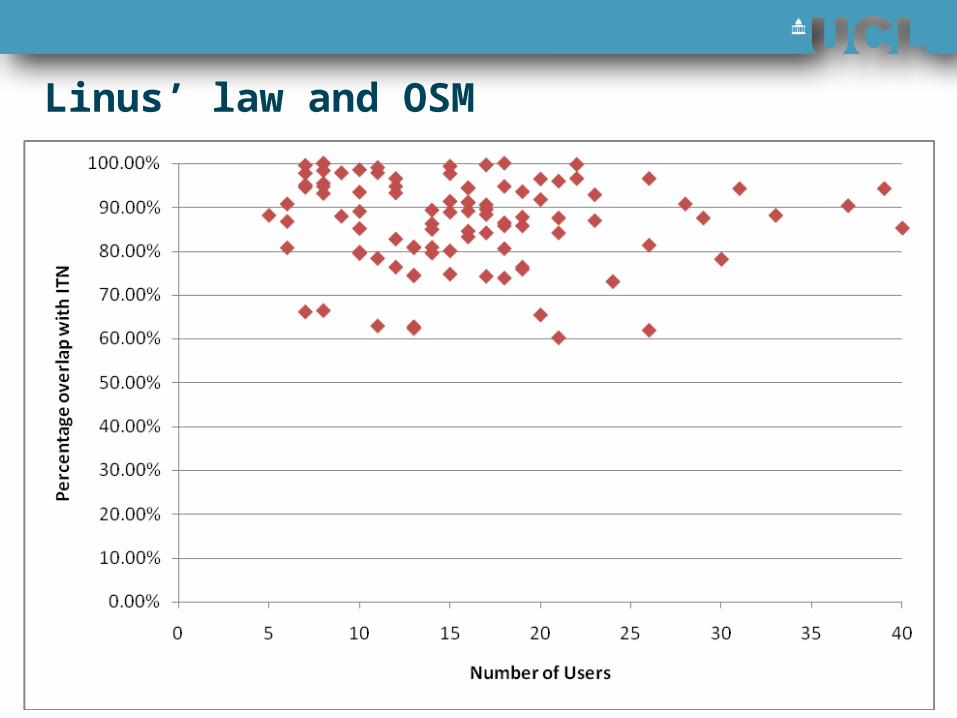
Linus’ law and OSM
Conclusions
• OSM quality is high – and it is assumed that the quality is coming from aerial imagery
• Linus’ Law does not seem to apply in a straight forward manner – at least not from 5 and above
• More research is required for lower numbers or participants and different quality of imagery
Further reading • Haklay, M., 2008, How good is OpenStreetMap
information? A comparative study of OpenStreetMap and Ordnance Survey datasets for London and the rest of England, submitted to Environment and Planning B.
• Haklay, M. And Weber, P., 2008, OpenStreetMap – User Generated Street Map, IEEE Pervasive Computing.
• Haklay, M., Singleton, A., and Parker, C., 2008, Web mapping 2.0: the Neogeography of the Geoweb, Geography Compass
• Haklay, M., 2008, Open Knowledge – learning from environmental information, presented at the Open Knowledge Conference (OKCon) 2008, London, 15 March.
• Haklay, M., 2007, OSM and the public - what barriers need to be crossed? presented at State of the Map conference, Manchester, UK, 14-15 July.
• To get a copy, write to [email protected] , or get them on povesham.wordpress.com


![venkateswaran2010,9976316089,m.venkateswaran,m.venkates[Final muki pdf]](https://static.documents.pub/doc/80x56/54956c2cb47959514d8b4d57/venkateswaran20109976316089mvenkateswaranmvenkatesfinal-muki-pdf.jpg)


