Journal of Contaminant Hydrology 142–143 (2012) 82–92
Contents lists available at SciVerse ScienceDirect
Journal of Contaminant Hydrology
j ourna l homepage: www.e lsev ie r .com/ locate / jconhyd
How mobile is iodide in the Callovo–Oxfordian claystones underexperimental conditions close to the in situ ones?
Sébastien Savoye a,⁎, Benjamin Frasca a,b, Bernard Grenut a, Agnès Fayette a
a CEA, DEN/DANS/DPC/SECR/Laboratoire de Mesures et Modélisation de la Migration des Radionucléides, F-91191 Gif-sur-Yvette, Franceb UMR “IDES” CNRS — Université de Paris-Sud, F-91405 Orsay, France
Article history:Received 14 October 2011Received in revised form 24 September 2012Accepted 8 October 2012Available online 23 October 2012
The iodide behaviour towards the Callovo–Oxfordian claystone was studied using batch anddiffusion experiments under conditions which limited the artefacts cited in the literature to beresponsible for the iodide uptake (i.e. the experiments were carried out under anoxic conditionswith N2/CO2 atmosphere with a monitoring of the iodine redox-state). The results show that allthe radioactive iodinewas 125I−, with nomeasurable activity for 125IO3
−, which is known to have ahigher affinity for the rock than iodide. Moreover, the batch experiments revealed no sorption,independently of the initial iodide concentration (from 10−6 to 10−3 mol L−1) and the contacttime (up to 106 days). Conversely, the diffusion experiments indicated a weak but measurableretention. The through-diffusion experiments led to distribution ratio values only significant(RD~0.05 mL g−1) for initial iodide concentration≤10−4 mol L−1. Higher RD values wereestimated from out-diffusion experiments, ranging from about 0.05 mL g−1 for an initialconcentration of 10−3 mol L−1 to 0.14 mL g−1 for the lowest one. A retention phenomenon thatcould be reversible and kinetically-controlled was proposed to explain the differences in theextent of the iodide retardation of the two types of diffusion experiments.
Keywords:DiffusionTritiumChlorideIodideCallovo–Oxfordian claystonesSorptionBatchCO2 control
1. Introduction
Iodine-129 might be one of the main dose contributorfrom nuclear waste disposal hosted in deep argillaceousformations due to its relatively high-life (t1/2=15.7 millionyears) and its high mobility related to its anionic nature ingroundwater as iodide, I− (Altmann, 2008; Grambow, 2008).The correct understanding of iodide migration behaviourthrough the clay barrier is hence essential to underpin itstransport parameters, which will then be used for theperformance assessment calculations of a deep repositoryfor spent fuel and high-level waste. Indeed, results derivedfrom performance assessment calculations indicated thateven low iodide retention could significantly slow down itsmigration to the biosphere (Altmann, 2008).
).
ll rights reserved.
Thus, several studies had focused on the diffusive behaviourof iodide and its potential affinity towards claystones. Acompilation of their results indicated that no consensus hasyet emerged on the veracity of the iodide retardation throughthese materials. On one hand, some authors (Bazer-Bachi,2005; Bazer-Bachi et al., 2006; Descostes et al., 2008; Savoye etal., 2006; Van Loon et al., 2003a;Wittebroodt et al., 2008, 2012)claimed that a weak but significant iodide retention wasmeasured at a low initial iodide concentration (less than orequal to 10−4 mol L−1) from batch and diffusion experiments.On the other hand, others authors (Claret et al., 2010; Glaus etal., 2008; Lerouge et al., 2010, 2011) suspected experimentalartefacts to be responsible for the apparent retention of iodide,such as the oxidation of the sample before/or during thediffusion experiment, the co-precipitation of the iodidewith carbonates due to a disequilibrium regarding thecalco-carbonic system, or the presence in the 125I− radioactivesource of 125IO3
−, known to have a higher affinity towards rocksthan 125I−.
83S. Savoye et al. / Journal of Contaminant Hydrology 142–143 (2012) 82–92
Therefore, the aims of this study was to investigate thebehaviour of iodide towards the Callovo–Oxfordian claystonesusing batch and diffusion experiments performed underexperimental conditions, which enabled the limitation of theaforementioned artefacts. For that purpose, (i) the rocksamples were kept away from oxygen as much as possible,i.e. from the drilling of the borehole to the experiments, (ii) allthe experiments were carried out into a glove box with a 99.6%N2/0.4% CO2 atmosphere to preserve the chemical equilibriumwith the carbonate minerals, and (iii) a special care was paidformonitoring any change of the iodine redox state throughoutthe duration of the experiments.
2. Materials and methods
2.1. Sample origin and sample preparation
The rock core used for themeasurementswas collected fromthe borehole OHZ1202 (X=823252 m; Y=1091659.37 m;Z=−115.54 m NGF), argon-drilled upwards in the Meuse/Haute Marne Underground Laboratory, located in the easternpart of the Paris basin. The sedimentary host formation(152–160 Ma) is a ~130-m-thick clay-rich Callovo–Oxfordianformation and with a burial depth of ~420–550 m belowground level (bgl). According to Gaucher et al. (2004), thelevel from which the core originates (EST30471 core 480.7–481.7 m bgl) corresponds to silty and calcareous claystones,containing 35–65% of clayminerals (with 27–38% ofmixed layerillite/smectite), 15–28% of carbonates, 21–31% of quartz, andaccessory minerals. Six samples were sliced from the EST30471claystone core using a diamond wire saw (no lubricating fluidwas used) into pieceswith thickness of about 1 cmunder anoxicconditions (O2b5 ppm). Then five were cut as a disk (ϕ=38 mm) for the diffusion experiments and one was powderedfor the batch experiments (particle sizeb63 μm).
2.2. Analytical procedure to estimate the fraction of 125I− andof 125IO3
−
The principle to determine the iodide speciation wasbased on an ion chromatography separation stage followedby gamma counting of the iodide and iodate fractions (seeGlaus et al., 2008 for details). The high-performance anionexchange chromatography system was a Metrohm 761Compact IC (Metrohm, Switzerland) with a 50 μL injectionloop and a 500 μL sample syringe. The separation of iodideand iodate was performed on an 4×250 mm A-Sup5 column(Metrohm, Switzerland) using an elution of 3.5 mmol L−1
NaHCO3/ Na2CO3 at a flow of 0.7 mL min−1. Elution of theanalytes was monitored by the conductivity detection.
In order to determine the times during which 125I− andof 125IO3
− fractions had to be collected, aqueous standards ofstable iodide and iodate at a concentration of 10−3 mol L−1
were previously eluted and monitored by conductivity.
2.3. Synthetic pore-water composition
All the solutions were prepared with ultrapure deionisedwater (18.2 MΩ cm−1) and commercial salts (AmericanChemical Society (ACS) reagent grade or higher quality andpurity salts) in order to obtain a chemical composition as close
as possible to the real pore-water. The recipe given in Table 1 isbased upon the chemical composition estimated from in situwater sampling performed at a level close to the sampling levelof this study (−475 m bgl; Vinsot et al., 2007). The CO2
content of the glove box (0.4% CO2 for 99.6% N2) was chosenclose to the in situ Callovo–Oxfordian claystone CO2 partialpressure (i) to preserve as much as possible the equilibriumwith carbonate minerals (Beaucaire et al., 2008; Vinsot et al.,2007) and (ii) to avoid any co-precipitation of iodide withcarbonates, as already suggested by Claret et al. (2010).
2.4. Batch experiments
About 1.2 g of argillite powder (particle sizeb63 μm)were put into 10 mL centrifugation tube (#NALGENE PC31-38-0010, USA). The synthetic pore-water was added tothe tubes with a water/rock (W/R) ratio of 4 mL g−1. All theexperiments were carried out in an oxygen-depleted(b5 ppm O2) glove box with a 99.6% N2/0.4% CO2 atmosphereand operated at ambient temperature (21±1 °C).
According to Descostes and Tevissen (2004), the equili-bration phase was started by a first step of 72 h equilibrationfollowed by two rinsings, and lasting one week each. Iodidetracer was added after equilibration as 125I− (#CERCAI125ELSB50, France) with variable concentration of stableiodide (NaI, Fluka, Switzerland) to reach a range of totaliodine concentration varying from 10−6 to 10−3 mol L−1.Two duplicates were used for each concentration. Sorptionevolution was investigated for 106 days by successivesamplings in each tube. Before sampling, tubes were cen-trifuged at 96,000 ×g for 45 min. An aliquot of supernatant(50 μL) was then withdrawn, weighted and analysed bygamma counting (Packard 1480 WIZARD, USA). Blankexperiments (same protocol used but without rock sample)did not reveal any sorption. After 106 days of contact, thesame procedure described above was applied, plus thefiltration of supernatants at 0.2 μm.
The distribution ratio RD (L kg−1 ormL g−1)was calculatedusing the following equation:
RD ¼ C0
C−1
� �� V
Rð1Þ
where C0 is the initial activity per mass unit (Bq g−1), C theresidual activity in solution per mass unit (Bq g−1); V thesolution volume (mL) and R the dry mass of argillite (g). Notethat the solution volume (V) was recalculated after eachwithdrawn to take into account the change of water/rock ratiointo Eq. (1). The detailed calculation used for determining theuncertainties on the RD data is given in the Appendices.
2.5. Diffusion experiments
2.5.1. EquipmentFig. 1 schematically represents the diffusion cells used in
this study. The through-diffusion cells comprise two reservoirsin polypropylene (up and downstream: 175 and 130 mL,respectively), a polypropylene sample holder, two perforatedplates in polyetheretherketone (Peek), and the whole beingpasted with glue and screwed together. Each part of thediffusion cell was beforehand cleaned with HNO3 (1%) and
Table 1Composition of the synthetic water used in this study.
84 S. Savoye et al. / Journal of Contaminant Hydrology 142–143 (2012) 82–92
water, and then dried. All the preparation of the diffusion cellswas made in a glove box (O2b5 ppm). As for the batchexperiments, all the diffusion experimentswere carried out in aglove box with a 99.6% N2/0.4% CO2 gas mixture and operatedat ambient temperature (21±1 °C).
2.5.2. ProtocolsThe rock disks of the five diffusion cells were equilibrated
over at least 4 weeks with synthetic water solution of acomposition shown in Table 1. This time was found to besufficient to reach chemical equilibrium (Motellier et al., 2007;Savoye et al., 2010, 2011). Note that among the five diffusioncells, one had the chemical solution composition modified byadding Na2S2O3 (Fluka, Switzerland) at 10−3 mol L−1. Theobjective was to investigate the effect of a reductive agent, thethiosulfate, capable of consuming the oxygen traces occurringin the glove box. This should limit the oxidation of the rocksample, and especially of the pyrite whose oxidation products,i.e. ferric oxyhydroxide, are more reactive towards iodide(Aimoz et al., 2011). This operation was previously performedby Bazer-Bachi et al. (2006) and Descostes et al. (2008) on COxsamples but under oxic conditions.
After equilibration, the synthetic solutionswere replaced bya fresh one and, the solution in the upstream reservoir wasthen spikedwithHTO, awater tracer, and 36Cl− (see Table 2 forthe injected activities). Up and downstream reservoirs wereperiodically sampled, and the solution volume taken wasreplaced in each compartment either by the radio-labelled
Sampling port
Upstream reservoir
J Sample
Glue
Sample holder
Downstream reservoir
Sampling port
JJ
Peek perforated plate
Fig. 1. Experimental set-up used for the diffusion experiments.
solution or by the synthetic water. The monitoring of the 36Cl−
flux through the rock sample allows the determination ofthe diffusion-accessible porosity of a non-reactive anionictracer (εa). After completion of the first through-diffusionstage, an out-diffusion procedure was applied to the five cells.The solutions in both reservoirs were fully replaced bysynthetic solution without tracer to induce HTO and 36Cl− todiffuse out of the rock samples. At selected time intervals, theactivity in the solutions was measured for monitoring theactivity rate atwhich the tracers cameout of the samples. Then,a second through-diffusion stage was performed by replacingthe solution in the upstream reservoir by synthetic solutionscontaining stable dissolved iodide (NaI, Fluka, Switzerland) at aconcentration ranging from 10−3 mol L−1 to 10−6 mol L−1
and the 125I-labelled source (#CERCA I125ELSB50, France) (seeTable 2 for the injected activity). In the downstream reservoir,tracer-free synthetic water solution was used.
In addition to the regular sampling used for monitoringthe 125I activity evolution (i.e. 0.1 mL and 5 mL in the upstreamand the downstream reservoirs, respectively), 2 mL of solutionwere withdrawn during the iodide diffusion stage in order tomonitor any changes in the iodide speciation by ion chroma-tography separation (§ 2.2.). After the iodide through-diffusionstage, a new out-diffusion procedure was carried out to studythe behaviour of iodide diffusing out of the rock sample.Besides, the cell inwhichwas injected iodide at a concentrationof 10−6 mol L−1 without Na2S2O3 underwent a new through-diffusion stage with iodide injected at a concentration of10−3 mol L−1. This allowed the effect of iodide initialconcentration on its retention behaviour towards the samerock sample to be tested, overcoming the mineralogicalheterogeneity issue. A summary of all the diffusion experi-ments performed on each cell is given in Table 2, with thecharacteristics of each rock samples and the amount of activityinjected for each tracer.
2.5.3. Data analysisThe analysis of the results was based on the Fick's second
law for one-dimensional transport:
∂C∂t ¼ De
α∂2C∂x2
¼ De
εa þ ρRD
∂2C∂x2
ð2Þ
where C is the concentration or activity per volume unit(mol m−3 or Bq m−3); t, the time (s); De, the effectivediffusion coefficient (m2 s−1); α, the rock capacity factor(m3 m−3); εa, the diffusion-accessible porosity (m3 m−3); ρ,the bulk dry density (kg m−3); and RD, the distribution ratio(m3 kg−1).
The RD value for iodide was calculated from the relation-ship RD=(α- εa)/ρ, by assuming that the accessible porositiesof chloride and iodide were identical (εI-125=εCl-36).
Table 2Summary of the tracers, their initial activity and the type of diffusion experiments performed on the 5 cells used in this study. √ means performed.
Cells Thickness of the rock sample HTO+36Cl through-diffusion step
85S. Savoye et al. / Journal of Contaminant Hydrology 142–143 (2012) 82–92
According to van Brakel and Heertjes (1974), De can bewritten as follows:
De ¼ Dpεa ¼δτ2
D0εa ¼D0
Gεa ð3Þ
where D0 is the free-solution (aqueous) diffusion coefficient(m2 s−1), δ represents the constrictivity factor (−), and τ is thetortuosity factor. G is the geometrical factor. Tortuosity andconstrictivity are purely geometric factors, which, comparedwith a specific cross-section in free water, lengthen thediffusion pathway and reduce the diffusion cross-section,respectively (van Brakel and Heertjes, 1974). Moreover, weassumed that the perforated plates maintaining the rocksamples have not to be taken into account in the analysis ofthe results. Such an assumption will be discussed below.
The boundary and initial conditions for the throughdiffusion problem are given by:
C x; tð Þ ¼ 0; t ¼ 0 ð4Þ
C x; tð Þ ¼ C0; x ¼ 0; t > 0 ð5Þ
C x; tð Þ ¼ 0; x ¼ L; t > 0 ð6Þ
where L is the sample thickness (m), and C0 is theconcentration of the tracer in the upstream reservoir(Bq m−3). For a non reactive tracer (RD=0), α is equal to εa.
The solution of Eq. (2), satisfying the boundary and initialconditions, was given by Crank (1975) as the diffusive flux(Bq m−2 s−1) in the downstream reservoir:
J tð Þ ¼ DeC0
L1þ 2
X∞n¼1
−1ð Þn exp −Den2π2t
αL2
!" #ð7Þ
Note that the boundary conditions (5) and (6) wereexperimentally respected throughout the duration of thethrough-diffusion experiment with tracer concentration (i) inthe upstream reservoir, not lower than 95% of its initial value,and (ii) in the downstream reservoir, not higher than 5% of theupstream reservoir concentration.
For the out-diffusion stage, Eq. (2) has to be solved withthe corresponding boundary conditions:
C 0; tð Þ ¼ C L; tð Þ ¼ 0; t > 0 ð8Þ
Assuming that the concentration gradient across thesample is linear when the through-diffusion stage reachesthe steady-state, the concentration profile that gives theinitial conditions for out-diffusion, is:
C xð Þ ¼ C0 1− xL
� �ð9Þ
According to Jakob et al. (1999), the total activity (Bq)diffused out of the sample at the two boundaries is given by:
at x ¼ 0 : A 0; tð Þ ¼ 2⋅C0⋅S⋅α⋅L16−X∞n¼1
1π2n2 e
− n⋅πLð Þ2⋅Deα ⋅t
" #
ð10Þ
and
at x ¼ L : A L; tð Þ ¼ 2⋅C0⋅S⋅α⋅L112
þX∞n¼1
−1ð Þnπ2n2 ⋅e−
n⋅πLð Þ2⋅Deα ⋅t
" #
ð11Þ
where S is the surface of the rock sample (m2).The analysis of the results was performed by a least-
square fitting of the model to the results of (i) the incomingdaily flux in the downstream reservoir for through-diffusionand (ii) the cumulative total activities in the downstream andthe upstream reservoirs, using the analytical solutions(Eqs. (7), (10) and (11)). Uncertainties on the experimentaldata were estimated by propagation of the analytical errorvariances (σ2
V1, σ2V2, etc.…) following the Gaussian error
propagation law. The approaches used for determining theuncertainties on the experimental data and the error range ofthe diffusive parameters are described in the Appendices.
2.6. Analyses
The activities of HTO and 36Cl− were simultaneouslycounted by α−β liquid scintillation. One ml of sample (or0.1 mL of sample+0.9 mL of tracer-free solution) was placedin a 5-mL polyethylene (PE) counting vial and 4-mL scintilla-tion cocktail was added (Ultima Gold XR, Canberra-Packard,USA). The samples were vigorously shaken and placed in aliquid scintillation counter (Tricarb 2500, Canberra-Packard,USA). In order to insure an independent determination ofthe activity of these two radioisotopes, the following energy
86 S. Savoye et al. / Journal of Contaminant Hydrology 142–143 (2012) 82–92
windows were chosen: from 0 to 18 keV for HTO and from 20to 710 keV for 36Cl−. Moreover, the activity of 125I wasmeasured by χ counter (Packard 1480 WIZARD, USA) with5 mL of sample (or 0.15 mL of sample+4.85 ml of tracer-freesolution) placed in a 5-mL polyethylene (PE) counting vial.The counting efficiency for each tracer was measured usingsynthetic water with known amounts of radioactivities.Background measurements were performed in the sameway using synthetic water without radiotracers. HTO, 36Cl−,and 125I−solution data were corrected for radioactive decaywith respect to the tracer injection time, i.e. the start of thethrough-diffusion experiment.
3. Results
3.1. Iodine redox-state
The determination of the iodine redox-state was carriedout (i) in the initial 125I source, (ii) in the upstream reservoirsolutions during the through diffusion experiments after112 days, 196 days and at the end of the through-diffusionstage, and (iii) in the blank used in the batch. No significantactivity (less than 0.1 Bq) was measured in all the fractionsexpected to contain 125IO3
−. Moreover, the 125I− fractionsshowed activity values very close to those measured in thecorresponding overall solutions with a standard deviation of2% (5 samples).
3.2. Batch experiments
Fig. 2 displays the evolution as a function of time of the RDvalues obtained at the four initial iodide concentrations onthe Callovo–Oxfordian (COx) claystone duplicates. Indepen-dently of the concentration, the RD values did not exhibit anyincrease with time but only a large scattering, from which no
-0.4
-0.3
-0.2
-0.1
0.0
0.1
0.2
0.3
0.4
0 20 40 60
Time, days
RD, m
L g
-1
Fig. 2. Evolution of the distribution ratio (RD) values derived in the batch experimensolution leakage. The error bars were calculated using the Gauss formulae.
clear 125I sorption can be evidenced, even after 106 days ofcontact time.
3.3. Diffusion results
3.3.1. Through-diffusion stageFig. 3 shows an example of the instantaneous fluxes
and the cumulative total activities obtained on the cellEST30471-1 for (A) HTO, for (B) 36Cl, and for (C) 125I withan initial iodide concentration of 10−3 mol L−1. All thediffusive parameters estimated from the through-diffusionstage are gathered in Table 3 for HTO and 36Cl and in Table 4for 125I. The values of the effective diffusion coefficient andthe porosity for HTO and 36Cl were consistent with eachother (bDe(HTO)>=2.84±0.37×10⁻¹¹ m2 s−1; bε(HTO)>=0.20±0.02; bDe(36Cl) >=0.42±0.13×10⁻¹¹ m2 s−1;bε(36Cl)>=0.086±0.015). They were also in good agreementwith those previously obtained by Descostes et al. (2008)and Savoye et al. (2010) on nearby samples (less than 4 maway) but they were slightly lower than those from Bazer-Bachiet al. (2006) on samples located about 30 m above (see Table 2for comparison).
The values of the effective diffusion coefficient obtainedfor 125I in the current study were very close to those for 36Clwith a mean De(125I) equal to 0.47±0.17×10⁻¹¹ m2 s−1,also consistent with the values previously obtained byBazer-Bachi et al. (2006), Descostes et al. (2008) andSavoye et al. (2010) (see Table 3 for comparison). This goodconsistency for all the studied tracers with the previousresults, especially for the nearby samples, validates ourassumption about the absence of impact of the perforatedplates on the whole diffusion process.
Moreover, only when the initial iodide concentrationinjected in the cells was ≤10−4 mol L−1, the rock formationfactor α became higher than the porosity accessible to 36Cl(Tables 3 and 4). This led to estimate weak but significant
80 100
10-3A
10-3B
10-4B
10-5A
10-5B
10-6A
10-6B
ts (10−3 to 10−6 mol L−1) over time. The series 10-4A was removed due to a
0.0.E+00
5.0.E+03
1.0.E+04
1.5.E+04
2.0.E+04
2.5.E+04
3.0.E+04
3.5.E+04
1 10 100 1000
Time, Days
Cu
mu
lati
ve t
ota
l act
ivit
y, B
q
0.0
0.2
0.4
0.6
0.8
1.0
1.2
1.4
1.6
1.8
2.0
Cumulative Activity
Flux
0
5000
10000
15000
20000
25000
0 5 10 15 20 25 30 350 5 10 15 20 25 30 35
Time, Days
Cu
mu
lati
ve t
ota
l act
ivit
y, B
q
0
2
4
6
8
10
12
Inst
anta
neo
us
flu
x, B
q.m
².s-1
Cumulative Activity
Flux0
500
1000
1500
2000
2500
3000
3500
4000
4500
Time, Days
Cu
mu
lati
ve t
ota
l act
ivit
y, B
q
0.0
0.2
0.4
0.6
0.8
1.0
1.2
1.4
1.6
1.8
2.0
Inst
anta
neo
us
Flu
x, B
q m
² s-1
Inst
anta
neo
us
Flu
x, B
q m
² s-1
Cumulative activity
Instant flux
(A) HTO (B) 36Cl
(C) 125I
Fig. 3. Cumulative total activity and instantaneous flux obtained on the cell EST30471-1 for (A) HTO, (B) 36Cl, and (C) 125I with [I−−]ini=10−3 mol L−1. Curveswere obtained from the analytical solutions with the values of diffusive parameters given in Tables 3 and 4.
87S. Savoye et al. / Journal of Contaminant Hydrology 142–143 (2012) 82–92
values of RD (~0.05 mL g−1), in agreement with what wasobserved by Bazer-Bachi et al. (2006) on COx samples(see Table 4). Note that, contrary to the Bazer-Bachi et al.'sstudy, the porosity accessible to a non-reactive anionicspecies, i.e. 36Cl−, was systematically determined on eachsample for which the iodide through-diffusion was carriedout. Therefore, this prevents any suspicion from arising aboutthe possible role played by the mineralogical heterogeneityon the apparent iodide retardation (e.g. local increase ofthe 36Cl porosity). Moreover, the issue of the mineralogicalheterogeneity was also addressed by performing on the samerock sample (cell EST30471-4) two successive injections ofiodide at 10−6 mol L−1 and 10−3 mol L−1. Fig. 4 shows thecomparison of the normalised fluxes obtained on this cellfor 36Cl, and for 125I with the two stable iodide concentra-tions. The diffusive behaviour of 125I clearly depended onthe initial iodide concentration. At 10−3 mol L−1, 125Idiffused similarly like 36Cl, with a RD value not significantregarding the uncertainties (Table 4). Conversely, at thelowest concentration, 125I exhibited a significant retardation.
Finally, the addition of Na2S2O3 in the cell EST30471-5 didnot reduce the extent of the iodide retardation (Table 4).
3.3.2. Out-diffusion stageFig. 5 shows the evolution of the total 36Cl− and 125I−
activities measured in the upstream and downstream reser-voirs during the out-diffusion stage performed on cellsEST30471-1 (Fig. 5A for 36Cl− and Fig. 5B for 125I−) andEST30471-4 (Fig. 5 B for 125I−). All the diffusive parametersestimated from this stage are gathered in Fig. 5A for 36Cl− andin Table 4 for 125I−. First, the out-diffusion stage of 36Cl−
resulted in diffusive parameters consistent with those deter-mined from the through-diffusion one, as previously shown byVan Loon et al. (2003b) on similar clay rocks (Opalinus Clay).For 125I−, the values of De were also consistent with thosederived from the through-diffusion stage, while the rockcapacity factor α exhibited in most cases, higher values thanthose obtained from the through-diffusion experiments. Thissuggests that larger amounts of 125I than predicted from thethrough-diffusion stage had diffused out of the rock samples.
Table 3Effective diffusion coefficients and porosities for the diffusion of HTO and 36Cl through the Callovo–Oxfordian claystones. Values between brackets indicate theuncertainty ranges.
EST30471-1 2.65 0.20 0.39 0.07480.7–481.7 m (1.9–3.4) (0.18–0.30) (0.27–0.48) (0.06–0.08)EST30471-2 3.2 0.21 0.53 0.10480.7–481.7 m (2.2–4.2) (0.16–0.25) (0.37–0.70) (0.07–0.13)EST30471-3 2.65 0.22 0.28 0.10480.7–481.7 m (1.9–3.5) (0.18–0.25) (0.19–0.38) (0.06–0.12)EST30471-4 2.4 0.18 0.31 0.07480.7–481.7 m (1.6–3.0) (0.16–0.20) (0.21–0.43) (0.05–0.10)EST30471-5 with NaS2O3 3.25 0.17 0.58 0.09480.7–481.7 m (2.3–4.0) (0.15–0.20) (0.40–0.85) (0.08–0.10)EST27337a 2.3 0.21 0.27 0.075484.5–484.8 m (1.7–2.85) (0.19–0.22) (0.2–0.32) (0.06–0.085)EST05641b 2.2±0.7 0.195±0.045 0.46 0.065476.97–477.35 m (3 samples) (3 samples)EST10425c 2.9±0.1 0.226±0.017 0.91 0.168454 m (5 samples) (5 samples)
a Data from Savoye et al. (2010) on PAC1011 core.b Data from Descostes et al. (2008) on EST205 core.c Data from Bazer-Bachi et al. (2006) on EST312 core.
88 S. Savoye et al. / Journal of Contaminant Hydrology 142–143 (2012) 82–92
Only the cell EST30471-2 did not show any discrepancybetween through-diffusion and out-diffusion. It is noteworthythat the error ranges associated with the α values estimatedfrom the downstream reservoir activity, overlap with thosedetermined from the through-diffusion phase (Table 3), so thatthis statement has to be used carefully. A mass balancecalculation was performed to estimate the ratio of the actual
Table 4Effective diffusion coefficients, rock capacity factors and distribution ratio for 125
[I−]ini=10−6 M (0.4–0.8) (0.15–0.22) (21; 60) (0.2–0.3)EST27337 a 0.2 0.075 – n-d484.5–484.8 m (0.14–0.28) (0.07–0.11)[I−]ini=10−3 MEST05641 b
476.97–477.35 m 0.16 0.033 – n-d[I−]ini=4.410−3 MEST10425 c 0.73 0.098 – [I−]ini=1×10−
454 m 0.67 0.107 4 [I−]ini=1×10−
4 samples fromEST312 core
0.66 0.447 150 [I−]ini=5×10−
0.77 0.261 71 [I−]ini=2×10−
a data from Savoye et al. (2010) on PAC1011 core. b data from Descostes et al. (200810−3 mol L−1.
tracer activity obtained from out-diffusion over the traceractivity expected after the through-diffusion; this led to thefollowing results: 101% for 36Cl− and 208% for 125I−in thecell EST30471-1, and 103, 125, 173, and 193% for 125I− in thecells EST30471-2, -3, -4 and -5, respectively. Even the cellEST30471-1 in which no clear sorption phenomenon waspreviously observed from the through-diffusion stage showed
I estimated from through- and out-diffusion experiments. Values between
om upstream Res. Out-diffusion from downstream Res.
) on EST205 core. c data from Bazer-Bachi et al. (2006) a,b,c with [Na2S2O3]=
0E+00
1E-10
2E-10
3E-10
4E-10
5E-10
6E-10
1 10 100 1000
No
rmal
ised
inst
ant
Flu
x, m
2.s
-1
Cl-36
I-125, [I-]=10-6 M
I-125, [I-]=10-3 M
Times, Days
Fig. 4. Comparison of thenormalised instantaneous fluxes obtained on the cell EST27321-4 for 36Cl, 125I with [I]ini=10−6 mol L−1, and for 125Iwith [I]ini=10−3 mol L−1.Normalised fluxes are the ratio of instantaneous flux (in Bq m−2 s−1) over the concentration in the upstream reservoir (in Bq m−3).
0
200
400
600
800
1000
1200
1400
1600
1800
2000
0 10 20 30 40
Time, Days
Time, Days Time, Days
To
tal d
iffu
sed
act
ivit
y, B
q
Upstream reservoir
Downstream reservoir
Upstream reservoir
D e =3.5 ± 1.0 10-12 m² s -1
εa =0.075 (0.065-0.090)
Downstream reservoir
D e =5.0 ± 1.5 10-12 m² s -1
εa =0.075 (0.065-0.100)
0
1000
2000
3000
4000
5000
6000
7000
8000
0
500
1000
1500
2000
2500
3000
3500
4000
4500
5000
0 50 100 150 0 50 100 150
(A) 36Cl
(B) 125I (C) 125I
To
tal d
iffu
sed
act
ivit
y, B
q
To
tal d
iffu
sed
act
ivit
y, B
q
Upstream reservoir
Downstream reservoir
Downstream reservoir
Upstream reservoir
Fig. 5. Evolution of the total diffused activity measured in the upstream and downstream reservoirs during the out-diffusion stage in the cell EST30471-1 for (A) 36Cland (B) 125I with [I]ini TD=10−3 mol L−1, and in the cell EST30471-4 for (C) 125I with [I]ini TD=10−6 mol L−1. Decay corrections were appliedwith respect to the startof the through-diffusion stage. The simulated curves were calculated with the diffusive parameter values given in Fig. 5 for 36Cl and in Table 4 for 125I.
89S. Savoye et al. / Journal of Contaminant Hydrology 142–143 (2012) 82–92
90 S. Savoye et al. / Journal of Contaminant Hydrology 142–143 (2012) 82–92
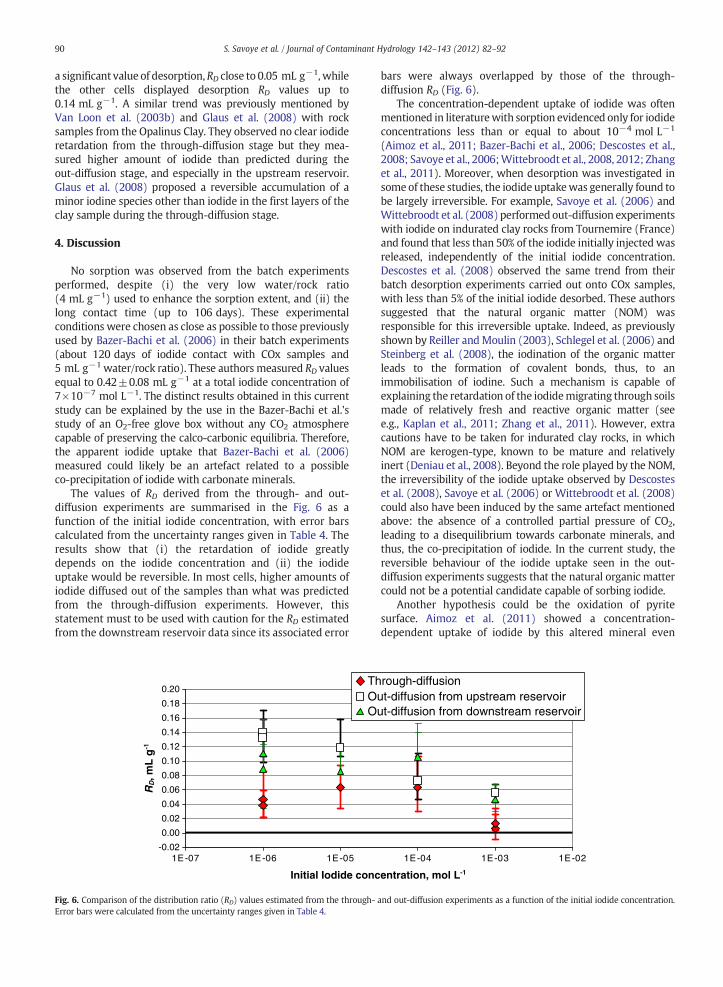
a significant value of desorption,RD close to 0.05 mL g−1, whilethe other cells displayed desorption RD values up to0.14 mL g−1. A similar trend was previously mentioned byVan Loon et al. (2003b) and Glaus et al. (2008) with rocksamples from the Opalinus Clay. They observed no clear iodideretardation from the through-diffusion stage but they mea-sured higher amount of iodide than predicted during theout-diffusion stage, and especially in the upstream reservoir.Glaus et al. (2008) proposed a reversible accumulation of aminor iodine species other than iodide in the first layers of theclay sample during the through-diffusion stage.
4. Discussion
No sorption was observed from the batch experimentsperformed, despite (i) the very low water/rock ratio(4 mL g−1) used to enhance the sorption extent, and (ii) thelong contact time (up to 106 days). These experimentalconditions were chosen as close as possible to those previouslyused by Bazer-Bachi et al. (2006) in their batch experiments(about 120 days of iodide contact with COx samples and5 mL g−1 water/rock ratio). These authors measured RD valuesequal to 0.42±0.08 mL g−1 at a total iodide concentration of7×10−7 mol L−1. The distinct results obtained in this currentstudy can be explained by the use in the Bazer-Bachi et al.'sstudy of an O2-free glove box without any CO2 atmospherecapable of preserving the calco-carbonic equilibria. Therefore,the apparent iodide uptake that Bazer-Bachi et al. (2006)measured could likely be an artefact related to a possibleco-precipitation of iodide with carbonate minerals.
The values of RD derived from the through- and out-diffusion experiments are summarised in the Fig. 6 as afunction of the initial iodide concentration, with error barscalculated from the uncertainty ranges given in Table 4. Theresults show that (i) the retardation of iodide greatlydepends on the iodide concentration and (ii) the iodideuptake would be reversible. In most cells, higher amounts ofiodide diffused out of the samples than what was predictedfrom the through-diffusion experiments. However, thisstatement must to be used with caution for the RD estimatedfrom the downstream reservoir data since its associated error
-0.02
0.00
0.02
0.04
0.06
0.08
0.10
0.12
0.14
0.16
0.18
0.20
1E-07 1E-06 1E-05
Initial Iodide conc
ThOO
RD, m
L g
-1
Fig. 6. Comparison of the distribution ratio (RD) values estimated from the through-Error bars were calculated from the uncertainty ranges given in Table 4.
bars were always overlapped by those of the through-diffusion RD (Fig. 6).
The concentration-dependent uptake of iodide was oftenmentioned in literaturewith sorption evidenced only for iodideconcentrations less than or equal to about 10−4 mol L−1
(Aimoz et al., 2011; Bazer-Bachi et al., 2006; Descostes et al.,2008; Savoye et al., 2006;Wittebroodt et al., 2008, 2012; Zhanget al., 2011). Moreover, when desorption was investigated insome of these studies, the iodide uptakewas generally found tobe largely irreversible. For example, Savoye et al. (2006) andWittebroodt et al. (2008) performed out-diffusion experimentswith iodide on indurated clay rocks from Tournemire (France)and found that less than 50% of the iodide initially injected wasreleased, independently of the initial iodide concentration.Descostes et al. (2008) observed the same trend from theirbatch desorption experiments carried out onto COx samples,with less than 5% of the initial iodide desorbed. These authorssuggested that the natural organic matter (NOM) wasresponsible for this irreversible uptake. Indeed, as previouslyshown by Reiller andMoulin (2003), Schlegel et al. (2006) andSteinberg et al. (2008), the iodination of the organic matterleads to the formation of covalent bonds, thus, to animmobilisation of iodine. Such a mechanism is capable ofexplaining the retardation of the iodidemigrating through soilsmade of relatively fresh and reactive organic matter (seee.g., Kaplan et al., 2011; Zhang et al., 2011). However, extracautions have to be taken for indurated clay rocks, in whichNOM are kerogen-type, known to be mature and relativelyinert (Deniau et al., 2008). Beyond the role played by the NOM,the irreversibility of the iodide uptake observed by Descosteset al. (2008), Savoye et al. (2006) or Wittebroodt et al. (2008)could also have been induced by the same artefact mentionedabove: the absence of a controlled partial pressure of CO2,leading to a disequilibrium towards carbonate minerals, andthus, the co-precipitation of iodide. In the current study, thereversible behaviour of the iodide uptake seen in the out-diffusion experiments suggests that the natural organic mattercould not be a potential candidate capable of sorbing iodide.
Another hypothesis could be the oxidation of pyritesurface. Aimoz et al. (2011) showed a concentration-dependent uptake of iodide by this altered mineral even
1E-04 1E-03 1E-02
entration, mol L-1
rough-diffusionut-diffusion from upstream reservoirut-diffusion from downstream reservoir
and out-diffusion experiments as a function of the initial iodide concentration
.
91S. Savoye et al. / Journal of Contaminant Hydrology 142–143 (2012) 82–92
under anoxic conditions (O2b5 ppm) with RD values of 0.6and 2 mL g−1 for an initial iodide concentration of 10−6 and10−11 mol L−1 (respectively) and equal to zero for an initialiodide concentration of 10−3 mol L−1. These authors pro-posed that iodide sorption was mainly due to electrostaticouter-sphere complexation of iodide, being bound to Fe(III)oxide-like clusters on the pyrite surface, which were formedpresumably by reaction with limited amounts of dissolvedoxygen. This mechanism was assumed to be reversible (onlyweak electrostatic outer-sphere complexation), and unlikethe iodination of NOM, could explain the iodide uptakedescribed in the current study.
Let us now consider the increase of the values of thedesorption RD obtained during the out-diffusion, in particularfrom the upstream reservoir monitoring, compared to thoseof the RD estimated from through-diffusion. This significantdifference observed could be explained by a possiblekinetically-controlled iodide retention, assuming that thelonger the iodide contact time with the rock, the higher theretention. In this sense, the through-diffusion method wouldbe less suitable than the out-diffusion one for addressing thekinetic issue. Indeed, the through-diffusionmethod enables theestimation of the rock capacity factor, i.e. the sorption intensity,only from the short transient-state (less than 30 days from thestart of the through-diffusion) (Schackelford, 1991), and thus,before the possible occurrence of some changes in the sorptionintensity. However, a more detailed analysis of the 125I fluxdata (Fig. 4) still reveals the existence of some intermediateplateaus before reaching the steady-state, reflecting thepossible change with time in the 125I− affinity towards therocks. On the other hand, the out-diffusionmethod seems to bemore suitable because it was launched after a longer period ofiodide contact with the rock (e.g. after 230 days of through-diffusion).Moreover, in this case, when the species has finisheddiffusing out, the corresponding cumulative activity reaches aplateau, directly related to the rock capacity factor value, andthus, to the desorption RD (Fig. 5). In summary, the differencein the RD values could indicate that the sorption extent likelycontinues to increase throughout the duration of the through-diffusion experiment, in particular even after its estimationfrom the transient state, so that only the out-diffusion stepwould enable its accurate determination (but limited to itsreversible component).
Among the mechanisms behind the kinetically-controllediodide retention, it can be proposed one based on the study ofAimoz et al. (2011). This mechanism can be related to a slowprocess of pyrite oxidation that could occur under our nearlyanoxic conditions, and could progressively increase theamount of the new reactive phases capable of sorbing iodide,until the iodide desorption. However, this hypothesis doesnot take into account the results obtained from the cellEST30471-5, in which it was injected a reductive agent(S2O3
2−) to limit oxygen contamination. The diffusive behav-iour of iodide in this cell was found to be very similar to whatobserved in the thiosulfate-free cell EST30471-4, containingthe same initial iodide concentration (10−6 mol L−1). Thismeans that, if the iodide sorption had been related to theoxidation of pyrite, the oxidation could not have occurredthroughout the duration of the experiments but would havetaken place before the addition of the reductive agent.Nevertheless, this last statement can also be excluded because
of (i) the care paid to limit oxygen entrance (argon-drilledborehole; nearly anoxic conditions throughout the experi-ments) and (ii) the relative large size of our pristine rocksamples (~1 cm) compared to the powdered pyrite (grainsizeb63 μm) used by Aimoz et al. (2011), which reduces theoxygen contamination to the sample surface only. Therefore,excluding the slow oxidation of pyrite as a possible candidate,led us to assume that the kinetic control could be very likelyrelated to the iodide retention mechanism itself, as previouslysuggested by Bazer-Bachi et al. (2006) from their batchexperiments performed under oxic conditions but withaddition of S2O3
2−. However, no clear mechanism has beenyet identified to account for such an increase on the iodideintensity of sorption with the contact time.
5. Conclusion
The behaviour of iodide towards the Callovo–Oxfordianclaystones was investigated using batch and diffusion exper-iments under conditions that limited the artefacts responsiblefor the iodide uptake and mentioned in the literature.
The results showed that all the radioactive iodinewas 125I−,with nomeasurable activity for 125IO3
−, which is known to havea higher affinity towards the rock than iodide. Batch experi-ments revealed no sorption, independently of the initial iodideconcentration (from 10−6 to 10−3 mol L−1) and the contacttime (up to 106 days), suggesting that the results obtained inprevious batch experiments with the Callovo–Oxfordianclaystones were probably affected by some artefacts, such asthe lack of controlled CO2 partial pressure.
Conversely, the two types of diffusion experiments showeda weak but measurable sorption, suggesting the limitation ofthe batch approach,which seems to be not sensitive enough forinvestigating species too weakly retained. From the through-diffusion experiments, the retardation occurred for initialiodide concentrations ≤10−4 mol L−1, and the distributionratio values (RD) were b0.06 mL g−1. This result was con-firmed even when a reductive agent (S2O3) was added to thesynthetic solution to consume the small amounts of oxygen,and thus, to limit the oxidation of the rock sample. In anotherdiffusion cell, two successive injections of iodide were carriedout at two different initial concentrations (10−6 and 10−3
mol L−1), and the same conclusion was drawn. The out-diffusion experiments resulted in desorption distribution ratiovalues (RD) ranging from about 0.05 mL g−1 for the highestinitial concentration to 0.14 mL g−1 for the lowest one. Thedifference in the extent of the iodide uptake between thethrough- and out-diffusion experiments observed in most ofthe studied cells, and especially from the upstream reservoirmonitoring, was explained by a possible kinetically-controlledretention, better revealed by the out-diffusion experiments.
Finally, in spite of all the care paid in this study to limit theoccurrence of the experimental artefacts, a weak but measur-able uptake of iodide by the Callovo–Oxfordian claystoneswas evidenced, exhibiting a reversible behaviour. Nevertheless,the use of these sorption data for a performance assessmentcalculation with 129I−, requires some caution, because of thelarge uncertainties in the estimated distribution ratio values,and the fact that the exactmechanisms governing the retentionphenomena, and thus their kinetics are not yet known, making
92 S. Savoye et al. / Journal of Contaminant Hydrology 142–143 (2012) 82–92
questionable such an extrapolation to larger time and spatialscales.
Acknowledgement
The research leading to these results has received fundingfrom the European Union's European Atomic Energy Commu-nity's (Euratom) Seventh Framework Programme FP7/2007–2011 under grant agreement no. 212287 (RECOSY project).The authors also thank Andra for providing the core used inthis study. We gratefully acknowledge E. Reinoso Maset forEnglish improvement.
Appendix A. Supplementary data
Supplementary data to this article can be found online athttp://dx.doi.org/10.1016/j.jconhyd.2012.10.003.
References
Aimoz, L., Curti, E., Mäder, U., 2011. Iodide interaction with natural pyrite.Journal of Radioanalytical and Nuclear Chemistry 288, 517–524.
Altmann, S., 2008. Geochemical research: a key building block for nuclearwaste disposal safety cases. Journal of Contaminant Hydrology 102,174–179.
Bazer-Bachi, F., 2005. Etude de l'influence de la retention chimique sur ladiffusion d'espèces anioniques dans les milieux argileux compacts. Ph. DThesis, INPL, Nancy, France.
Bazer-Bachi, F., Tevissen, E., Descostes, M., Grenut, B., Meier, P., Simonnot,M.-O., Sardin, M., 2006. Characterization of iodide retention on Callovo–Oxfordian argillites and its influence on iodide migration. Physics andChemistry of the Earth 31, 517–522.
Beaucaire, C., Michelot, J.-L., Savoye, S., Cabrera, J., 2008. Groundwatercharacterisation andmodelling of water–rock interaction in an argillaceousformation (Tournemire, France). Applied Geochemistry 23, 2182–2197.
Claret, F., Lerouge, C., Laurioux, T., Bizi, M., Conte, T., Ghestem, J.P., Wille, G.,Sato, T., Gaucher, E.C., Giffaut, E., Tournassat, C., 2010. Natural iodine in aclay formation: implications for iodine fate in geological disposals.Geochimica et Cosmochimica Acta 74, 16–29.
Crank, J., 1975. The Mathematics of Diffusion. Oxford Science Publication,New York.
Deniau, I., Devol-Brown, I., Derenne, S., Behar, F., Largeau, C., 2008.Comparison of the bulk geochemical features and thermal reactivity ofkerogens from Mol (Boom Clay), Bure (Callovo–Oxfordian argillite) andTournemire (Toarcian shales) underground research laboratories. TheScience of the Total Environment 389, 475–485.
Descostes, M., Tevissen, E., 2004. Definition of an equilibration protocol forbatch experiments on Callovo–Oxfordian argillite. Physics and Chemistryof the Earth 29, 79–90.
Descostes, M., Blin, V., Bazer-Bachi, F., Meier, P., Grenut, B., Radwan, J.,Schlegel, M., Buschaert, S., Coelho, D., Tevissen, E., 2008. Diffusion ofanionic species in Callovo–Oxfordian argillites and Oxfordian limestones(Meuse/Haute-Marne, France). Applied Geochemistry 23, 655–677.
Gaucher, E., Robelin, C., Matray, J.-M., Négrel, G., Gros, Y., Heitz, J.-F., Vinsot, A.,Rebours, H., Cassagnabère, A., Bouchet, A., 2004. ANDRA undergroundresearch laboratory: interpretation of the mineralogical and geochemicaldata acquired in the Callovian–Oxfordian formation by investigativedrilling. Journal of Physics and Chemistry of the Earth 29, 55–77.
Glaus, M.A., Müller, W., Van Loon, L.R., 2008. Diffusion of iodide and iodatethrough Opalinus Clay: monitoring of the redox state using an anionchromatographic technique. Applied Geochemistry 23, 3612–3619.
Grambow, B., 2008. Mobile fission and activation products in nuclear wastedisposal. Journal of Contaminant Hydrology 102, 180–186.
Jakob, A., Sarott, F.-A., Spieler, P., 1999. Diffusion and sorption on hardenedcement pastes — experiments and modelling results. PSI Bericht 99-05.
Paul Scherrer Institut, Villigen, Switzerland. (http://www.nagra.ch/documents/database/dokumente/$default/Default%20Folder/Publikationen/NTBs%201994-2000/e_ntb99-06.pdf).
Kaplan, D.I., Roberts, K.A., Schwehr, K.A., Lilley, M.S., Brinkmeyer, R.,Denham, M.E., DiPrete, D., Li, H.-P., Powell, B.A., Xu, C., Yeager, C.M.,Zhang, S.J., Santschi, P.H., 2011. Evaluation of a radioiodine plumeincreasing in concentration at the Savannah River Site. EnvironmentalScience and Technology 45, 489–495.
Lerouge, C., Claret, F., Denecke, M.A., Wille, G., Falkenberg, G., Ramboz, C.,Beny, C., Giffaut, E., Schäfer, T., Gaucher, E.C., Tournassat, C., 2010.Comparative EPMA and μ-XRF methods for mapping micro-scaledistribution of iodine in biocarbonates of the Callovian–Oxfordianclayey formation at Bure, Eastern part of the Paris Basin. Physics andChemistry of the Earth 35 (6–8), 271–277.
Lerouge, C., Grangeon, S., Gaucher, E.C., Tournassat, C., Agrinier, P., Guerrot, C.,Widory, D., Fléhoc, C., Wille, G., Ramboz, C., Vinsot, A., Buschaert, S., 2011.Mineralogical and isotopic record of biotic and abiotic diagenesis of theCallovian–Oxfordian clayey formation of Bure (France). Geochimica etCosmochimica Acta 75 (10), 2633–2663.
Motellier, S., Devol-Brown, I., Savoye, S., Thoby, D., Alberto, J.-C., 2007.Evaluation of tritiated water diffusion through the Toarcian clayeyformation of the Tournemire experimental site (France). Journal ofContaminant Hydrology 94, 99–108.
Reiller, P., Moulin, V., 2003. Influence of organic matter in the prediction ofiodine migration in natural environment. Materials Research SocietySymposium Proceedings 757, 565–570.
Savoye, S., Michelot, J.-L., Wittebroodt, C., 2006. Evaluation of thereversibility of iodide uptake by argillaceous rocks by the radial diffusionmethod. Radiochimica Acta 94, 699–704.
Savoye, S., Page, J., Puente, C., Imbert, C., Coelho, D., 2010. A newexperimental approach for studying diffusion through an intact andunsaturated medium: a case study with Callovo–Oxfordian argillite.Environmental Science and Technology 44, 3698–3704.
Savoye, S., Goutelard, F., Beaucaire, C., Charles, Y., Fayette, A., Herbette, M.,Larabi, Y., Coelho, D., 2011. Effect of temperature on the containmentproperties of argillaceous rocks: the case study of Callovo–Oxfordianclaystones. Journal of Contaminant Hydrology 125, 102–112.
Schackelford, C.D., 1991. Laboratory diffusion testing for waste disposal: areview. Journal of Contaminant Hydrology 7, 177–217.
Schlegel, M.L., Reiller, P., Mercier-Bion, F., Barre, N., Moulin, V., 2006. Molecularenvironment of iodine in naturally iodinated humic substances: insightfrom X-ray absorption spectroscopy. Geochimica et Cosmochimica Acta70, 5536–5551.
Steinberg, S.M., Kimble, G.M., Schmett, G.T., Emerson, M.F., Turner, M.R., 2008.Abiotic reaction of iodate with sphagnum peat and other natural organicmatter. Journal of Radioanalytical and Nuclear Chemistry 27, 185–191.
van Brakel, J., Heertjes, P.M., 1974. Analysis of diffusion in macroporousmedia in terms of a porosity, a tortuosity and a constrictivity factor.International Journal of Heat and Mass Transfer 17, 1093–1103.
Van Loon, L.R., Soler, J.M., Bradbury, M.H., 2003a. Diffusion of HTO, 36Cl- and125I- in Opalinus Clay samples from Mont Terri, effect of confiningpressure. Journal of Contaminant Hydrology 61, 73–83.
Van Loon, L.R., Soler, J.M., Jakob, A., Bradbury, M.H., 2003b. Effect of confiningpressure on the diffusion of HTO, 36Cl- and 125I- in a layeredargillaceous rock (Opalinus Clay): diffusion perpendicular to the fabric.Applied Geochemistry 18, 1653–1662.
Vinsot, A., Mettler, S., Wechner, S., 2007. In situ characterization of theCallovo–Oxfordian pore water composition. Physics and Chemistry ofthe Earth 33, 75–86.
Wittebroodt, C., Savoye, S., Gouze, P., 2008. Influence of initial iodideconcentration on the iodide uptake by the argillite of Tournemire.Physics and Chemistry of the Earth 33, 943–948.
Wittebroodt, C., Savoye, S., Frasca, B., Gouze, P., Michelot, J.-L., 2012.Diffusion of HTO, 36Cl− and 125I− in Upper Toarcian argillite samplesfrom Tournemire: effects of initial iodide concentration and ionicstrength. Applied Geochemistry 27, 1432–1441.
Zhang, S., Du, J., Xi, C., Schwehr, K.A., Ho, Y.-F., Li, H.-P., Roberts, K.A., Kaplan,D.I., Brinkmeyer, R., Yeager, C.M., Chang, H., Santschi, P.H., 2011.Concentration-dependent mobility, retardation, and speciation of iodinein surface sediment from the Savannah River Site. EnvironmentalScience and Technology 45, 5543–5549.