How Much Time Do You Spend Online?Understanding and Improving the Accuracy of Self-Reported Measures of Internet Use
Theo Araujo, Anke Wonneberger, Peter Neijens & Claes de Vreese
To cite this article: Theo Araujo, Anke Wonneberger, Peter Neijens & Claes de Vreese (2017)How Much Time Do You Spend Online? Understanding and Improving the Accuracy of Self-Reported Measures of Internet Use, Communication Methods and Measures, 11:3, 173-190, DOI:10.1080/19312458.2017.1317337
To link to this article: https://doi.org/10.1080/19312458.2017.1317337
How Much Time Do You Spend Online? Understanding andImproving the Accuracy of Self-Reported Measures of Internet UseTheo Araujo, Anke Wonneberger, Peter Neijens, and Claes de Vreese
Amsterdam School of Communication Research (ASCoR), University of Amsterdam, Amsterdam, The Netherlands
ABSTRACTGiven the importance of survey measures of online media use for commu-nication research, it is crucial to assess and improve their quality, in parti-cular because the increasingly fragmented and ubiquitous usage of internetcomplicates the accuracy of self-reported measures. This study contributesto the discussion regarding the accuracy of self-reported internet use bypresenting relevant factors potentially affecting biases of self-reports andtesting survey design strategies to improve accuracy. Combining automatictracking data and survey data from the same participants (N = 690) con-firmed low levels of accuracy and tendencies of over-reporting. The analysisrevealed biases due to a range of factors associated with the intensity of(actual) internet usage, propensity to multitask, day of reference, and theusage of mobile devices. An anchoring technique could not be proved toreduce inaccuracies of reporting behavior. Several recommendations forresearch practice follow from these findings.
With a lot of media use shifting from traditional to online media environments, measures of onlinemedia behavior receive a prominent role in communication research. Users of digital media leave anabundance of traces which could, at least in theory, provide accurate measures of online media usewithout relying on self-reports. Access to these highly accurate tracking data, however, is limited dueto concerns regarding data privacy, technical challenges and high costs of retrieving, storing, andprocessing these data. This is why self-reported measures of online media use remain crucial formany research areas including political (Kruikemeier, van Noort, Vliegenthart, & de Vreese, 2014),entertainment (Kardefelt-Winther, 2014), marketing (Jiang, Yang, & Jun, 2013), or health commu-nication (Xiao, Sharman, Rao, & Upadhyaya, 2014), as well as studies about media use in general(Voorveld, Segijn, Ketelaar, & Smit, 2014).
Online behavior—increasingly fragmented and scattered across situations, devices, and platforms—poses a critical challenge for the accuracy of self-reports (de Vreese & Neijens, 2016). Studiescomparing self-reported measures with tracking data—that can be considered a “gold standard” forthe measurement of online behavior—indeed indicate that respondents are, in general, not accuratewhen providing estimates for their online media use. This is true for frequency of internet use ingeneral (Scharkow, 2016), social network sites (Junco, 2013; Scharkow, 2016), and websites (Revilla,Ochoa, & Loewe, 2016). Because self-reported measures of online media use are expected to remain acrucial instrument for communication research, it is important to go beyond knowing the level of(in)accuracy of these measures. An important first step is to understand the factors that influenceunder- and over-reporting of online media use. Understanding these factors allows researchers tointerpret self-reports of online media use more accurately, and to correct the respondent’s estimates
COMMUNICATION METHODS AND MEASURES2017, VOL. 11, NO. 3, 173–190http://dx.doi.org/10.1080/19312458.2017.1317337
for known biases brought in by such factors. The first aim of the present study is, therefore, topresent a systematic account of factors influencing biases of self-reports.
A second, and perhaps even more critical, step is to establish which survey design strategies can beadopted to aid respondents in their estimations, and therefore improve the accuracy of such measures.
The present study combines self-reported measures of internet use with tracking data in order toaddress these challenges, and contributes to communication research in several ways. First, thepresent study offers a systematic approach to factors potentially affecting the accuracy of self-reportsof online behavior by including personal characteristics and media-use related variables. In doing so,this study extends earlier findings regarding the impact of sociodemographics and frequency ofinternet use on under- and over-reporting of online media use (Scharkow, 2016) by uncovering theeffects of factors yet unexplored such as multitasking, interest in the survey, and tablet use. Second,the present study employs an experimental design to test how different survey strategies improve theaccuracy of self-reported measures of online media use. Finally, this study provides a set ofactionable guidelines for communication researchers to employ in studies that require self-reportedmeasures of online media use.
Factors influencing response accuracy
Systematic differences in response behavior related to specific characteristics of respondents presenta severe threat to the accuracy of survey measures (Prior, 2009b; Southwell et al., 2010). Previousresearch has mainly looked at biases of self-reports due to sociodemographic factors (Prior, 2009b;Scharkow, 2016). However, these factors alone do not offer explanations for differences in theaccuracy of self-reports. These differences may actually be caused by various motivational orcognitive processes that are related to individual characteristics but also to factors related to mediause. Specifically, factors related to the fragmented and ubiquitous nature of internet use maypotentially affect the quality of reporting behavior.
The respondent’s involvement with the survey as a whole could as an individual factor be responsiblefor systematic differences in the accuracy of self-reports. As a motivational factor, a respondent’s interestin the surveymay be related to satisficing, that is, tendencies to reduce the cognitive effort that is requiredto retrieve the necessary information or make a valid estimation of one’s behavior (Krosnick, 1991). Thelevel of interest in the survey may influence the level of accuracy in self-reports, with the underlyingassumption that respondents who are more motivated will potentially make a higher effort to accuratelyrecall their behavior and consequently show less tendencies of satisficing.
H1: The higher the level of interest in the survey, the higher the accuracy of self-reports.
Individual media-use behavior might affect the accuracy of self-reports. Respondents who use theinternet more frequently, or who have a stronger tendency to multitask, may have more difficulty inrecalling their specific behavior. Low-frequency events are generally more easily rememberedcorrectly than more frequent events (Schwarz & Oyserman, 2001).
In addition, research has shown that media multitasking—performing several media- and non-media related tasks simultaneously—decreases the attention that is devoted to each activity (Duff,Yoon, Wang, & Anghelcev, 2014; Voorveld, 2011) and is associated more generally with lowerperformance levels (Rubinstein, Meyer, & Evans, 2001; Segijn, Voorveld, Vandeberg, & Smit, 2017).Consequently, recalling web use may be less accurate if the internet is used more often in multi-tasking situations.
H2: The higher the level of internet use, the lower the accuracy of self-reports.
H3: The higher the level of multitasking, the lower the accuracy of self-reports.
174 T. ARAUJO ET AL.
While the likelihood for media-multitasking can be explained by sociodemographic factors, suchas age and gender, as well as personality traits (Duff et al., 2014), also the context of Internet use hasbeen found important. Specifically, mobile media devices encourage rapid and frequent task-switch-ing (Rubinstein et al., 2001; Zhong, 2013). So did 90% of tablet users report to engage in otheractivities while using their tablets (Moses, 2012). Accordingly, the use of tablets or other mobilemedia devices may also decrease the accuracy of self-reports.
H4: The accuracy of self-reports is lower for the use of mobile devices compared to PCs.
Improving the accuracy of self-reports through survey design
Improving survey design strategies is an important way to improve accuracy of self-reports. Onepossibility is to include specific reference periods in survey questions, or to ask respondents toestimate their typical behavior (Chang & Krosnick, 2003; Price, 1993; Wonneberger & Irazoqui,2016). Earlier research highlights tradeoffs when it comes to using either of these options, i.e., askingabout a specific (recent) time period (e.g., last week), or asking about typical behavior (e.g., anaverage week). On the one hand, asking about a specific time period in the recent past potentiallyreduces the cognitive load on respondents, and brings more accurate responses. This recency effecthas been found, for example, for estimation of TV exposure (Wonneberger & Irazoqui, 2016). Onthe other hand, earlier research also found that respondents tend to over-report typical behavior andmay actually under-report their behavior when being asked about more recent time periodsindicating that asking about a typical week may have higher predictive validity for other outcomes,such as current events knowledge (Althaus & Tewksbury, 2007; Chang & Krosnick, 2003). Analternative explanation could be that the typical week question is confounded with attitudes, suchas political interest or involvement, and therefore is more strongly correlated with knowledge (Prior,2009a). Consequently, “typical week” would not yield more valid measures compared to more recenttime periods. Considering that these two strategies are yet to be compared for internet use, wepropose the following research question:
RQ1: Which reference period (recent vs. typical) is more accurate for questions regarding theduration of internet use?
Another possibility to aid respondents is to provide an anchor that facilitates their estimation(Belli, 1998; Burton & Blair, 1991; Schwarz & Oyserman, 2001). If available, population averagescan provide useful cues for respondents to accurately estimate the frequency of their own behavior(Burton & Blair, 1991; Prior, 2009a; Schwarz & Oyserman, 2001). Alternatively, cues on individualsituations of media use might improve response accuracy (Jerit et al., 2016; Potts & Seger, 2013).The internet is typically used at scattered moments throughout the day and oftentimes forincidental aims, such as checking e-mails or the news. This type of non-habitual or irregularbehavior might complicate an accurate recall or estimation of online activities as opposed to moreregular behavior that is easier to recall (Schwarz, 1999). Providing contextual cues by askingquestions about one’s past has been found effective to activate memories of past behaviorfrequencies and to aid correct estimation (Menon & Yorkston, 2000; Potts & Seger, 2013). Suchmechanism of memory activation might also facilitate more accurate recall and estimation of morerecent behavior.
H5: Anchoring in a survey question improves accuracy in respondents’ estimates of internet usecompared to no anchoring.
COMMUNICATION METHODS AND MEASURES 175
Discerning under- and overreporting
While the discussion about possible problems of self-reported measures often concerns accuracy ingeneral, previous research revealed theoretical and empirical arguments why underreporting and over-reporting should be distinguished. From a theoretical point of view, for specific types of media exposurea prevailing direction of inaccurate reporting behavior has been attributed to the perceived socialdesirability of the behavior (Holbrook, Green, & Krosnick, 2003; Kahn, Ratan, &Williams, 2014; Smit &Neijens, 2011). The underlying expectation is that respondents would over-report behavior that isperceived to be positive by their social group, and under-report behavior perceived to be negative. Theinfluence of social desirability can be assessed as an individual trait (i.e., the respondent’s tendency toanswer questions in a socially desirable manner) or as characteristics from different social groups (i.e.,higher social classes may be expected to behave in different ways than lower social classes). Earlierresearch has found, for example, that members of higher socioeconomic classes are more likely to over-report their exposure to television news (Prior, 2009b) but also more likely to under-report the timethey spend video gaming (Kahn et al., 2014). For general Internet use that is assessed in the presentstudy, there are no clear expectations regarding the influence of social desirability.
However, also previous empirical findings indicate different mechanisms behind under- andoverreporting. Revilla et al. (2016), for instance, found that visits of some websites were system-atically under-reported while others were over-reported. The study on accuracy of self-reportedinternet use by Scharkow (2016) revealed that different predictors were associated to under- andoverreporting indicating different underlying mechanisms for both types of errors. The followingresearch question addresses these possible differences:
RQ2: To what extend are there differences in how personal characteristics and media-use factorsrelate to under- and overreporting?
Specifically, concerning the influence of the amount of media use on response accuracy previousresearch has yielded consistent findings for TV exposure (Wonneberger & Irazoqui, 2017), mobilephone use (Vanden Abeele, Beullens, & Roe, 2013) as well as for internet use (Scharkow, 2016). Thegeneral pattern here is that light users have a tendency to over-report while heavy users have atendency to under-report their use of the medium in question.
H6: Lower levels of internet use are associated to higher levels of over-reporting (a) and higherlevels of internet use are associated to higher levels of under-reporting (b).
Methods
Sample
This study combines automatic tracking data of online behavior and a survey on online media use ofthe same respondents. The sample was drawn from an online panel with approximately 200,000respondents (50,000 households) who regularly take part in surveys of one of the largest researchcompanies in the Netherlands, TNS NIPO. The Netherlands is an ideal case for this study, given theextremely high levels of internet penetration (above 95%).
Approximately 9,000 of the households were part of an ongoing panel that had installed software thatenables tracking of internet use on PCs (laptops and desktops), and Android tablets, enabling acomparison between these devices. To take part in this specific panel, households were randomly selectedfrom the general panel and were asked to install the software, receiving an incentive to do so. Theinstallation was a voluntary decision, and panel participants had to give an opt-in after being informedabout what type of data would be tracked. As indicated by the panel research company, the completeprocess followed ESOMAR rules, and the panel was already collecting tracking data prior to this study.
176 T. ARAUJO ET AL.
Out of the households that had the tracking software installed, a sample was selected that met thefollowing conditions: (1) the tablet and/or PC must have used the internet in the previous month, (2)for PCs, the desktop or laptop should be registered for one person in the household (so thatindividual internet activity could be registered), and (3) the household must have been composedof only one person (to ensure that the device was only used by one person). From all 9,000 panelparticipants with the tracking software installed, 921 met the criteria above, and were invited toparticipate in the survey, yielding 690 responses (AAPOR response rate 1 = 75%).
The majority of the respondents (55.9%) belonged to a sample of PC users, and the remainingbelonged to a sample of tablet users. The average age was 53.99 (SD = 14.28), and 58% of therespondents were female. Education was measured according to the Dutch education system usingseven categories, with the lowest level being basic education (2% of the sample), and the highest levelbeing master- or doctorate-level (9% of the sample).
Procedure
The respondents answered questions about their general internet use on the specific device (PC ortablet) in which the tracking software was installed. A split-sample experiment was integrated in thesurvey. Before answering the main questions, a random selection of 50% of the respondents firstanswered three anchoring questions. The first two questions asked the respondent to think about theprevious day/the previous week, and indicate what type of day/week it was (e.g. normal day/week,holidays, being sick, etc.). In addition, respondents were asked to think back in which situations theymade use of their private computer or tablet (e.g., at home, at work, while commuting, etc.). Thisanchoring procedure aims at improving recall, and has been used successfully applied in earlierstudies (Bronner & Neijens, 2006). The duration of Internet use was asked with respondentsanswering questions about their internet use on the day before (yesterday), and on an averageday. For all Internet use self-reported measures, respondents were requested to provide the informa-tion specifically for the device (tablet or laptop) on which the tracking software was installed (i.e., notto report their internet use on other devices).
Self-reported measures
Internet use durationRespondents informed how long they used the internet in number of minutes. On average,respondents reported using the internet 126.74 min (SD = 120.45) on the day before, and143.14 min (SD = 125.49) on an average day.
MultitaskingRespondents answered an adapted version of a multitasking scale (Wang et al., 2012), with the itemsbeing “I multitask often when I use a PC/tablet” and “I can get more things done when I multitask”.The answers were given on a 7-point scale (M = 3.89, SD = 1.55, α = 0.80). Respondents alsoanswered two questions from the behavioral media multitasking scale (Duff et al., 2014), whichincluded “How often do you multitask in general? (e.g., talk to a friend while watching TV)” and“How often do you use multiple media at the same time? (e.g., use computer while watching TV)”.The answers were also given on a 7-point scale (M = 3.76, SD = 1.49, α = 0.67). Because both scaleswere highly correlated r(688) = .57, p < .001, only the first scale (by Wang et al., 2012) was used inthe analysis given its higher reliability.
Survey interestRespondents answered a single-item measure on a 7-point scale on how interested they were in thesurvey (M = 5.28, SD = 1.22).
COMMUNICATION METHODS AND MEASURES 177
Sociodemographic characteristics were included as control variables, considering that previousresearch has indicated systematic differences in response behavior due to age, gender, and education(Southwell et al., 2010). The self-reported measures are summarized in Table 1A.
Tracking data
The research company provided all the respondents’ tracking data from the previous month. Thetracking software captured each URL accessed by the respondent, with timestamps for when therespondent first visited the URL, and the number of seconds in which the URL remained active inthe browser of the respondent. For this specific tracking software, a URL is considered to be activewhen it is the one being displayed in the browser, meaning that other URLs that may be open inother tabs are not considered to be active. The number of active seconds is measured as the timebetween the URL first becoming active in the browser (i.e., displayed to the respondent) and adifferent URL becoming active in the browser. The same software was used for desktops and formobile devices (tablets).1
The data contained about 3 million rows, with each row containing a timestamp, the number ofseconds of activity. We used a series of custom Python scripts to generate a set of variables thatreflected the online behavior of each respondent. These variables always related the internet use onthe device where the respondent had the tracking software installed, and were created as follows.
Minutes of internet use (yesterday)The number of minutes that a respondent used the internet on the day before she or he answered thesurvey (aggregated for all URLs or domains). On average, respondents used the internet for103.55 min (SD = 140.69) on the day before they answered the survey.
Minutes of internet use (average day)The number of minutes for all URLs or domains used by each respondent from the moment that thetracking data started (about one month before the survey) and the day before she or he answered thesurvey were aggregated. The sum of active seconds was then divided by the number of days that the
Table 1A. Self-reported measures (N = 690).
Measure Definition M SD
Survey Interest Single question on how interested the respondent was in the survey (7-point scale) 5.28 1.22Internet Use Duration Number of minutes for:
The previous day 126.74 120.45An average day 143.14 125.49
Multitasking Preference for multitasking scale (Wang et al., 2012). Answers given on a 7-point scale(α = 0.80).
3.89 1.55
Sample characteristicsAge Age in years 53.99 14.28Gender Male (0), Female (1) 58%Education Measured according to the Dutch education system using seven categories 4.65 1.59
1Due to technological limitations, tablet measures contained only daily information by respondent aggregated at the domain level(e.g., google.com) instead of detailed URL information (e.g., google.com/mail). This domain-level information considered thestart of the measurement of active seconds as the timestamp at which the domain was first active, and the end as thetimestamp at which the domain was last active within a navigation session (defined as ongoing activity by a respondent, with nomore than 120 sec between URLs). If a domain was used in more than one session throughout the day, all the active seconds ofeach session were aggregated. For some respondents, however, there was no end timestamp registered—and this was recordedas 0 active seconds. For these instances, we used the average seconds per session for that respondent on other days. Because ofthis limitation, all analyses related to duration are performed twice: (1) with the averages replacing the instances in which adomain has 0 active seconds, and (2) with the 0 active seconds as an actual measure. Only the first analysis is reported unlessthere are strong differences in the nature of the relationships between the independent and dependent variables of the study.
178 T. ARAUJO ET AL.
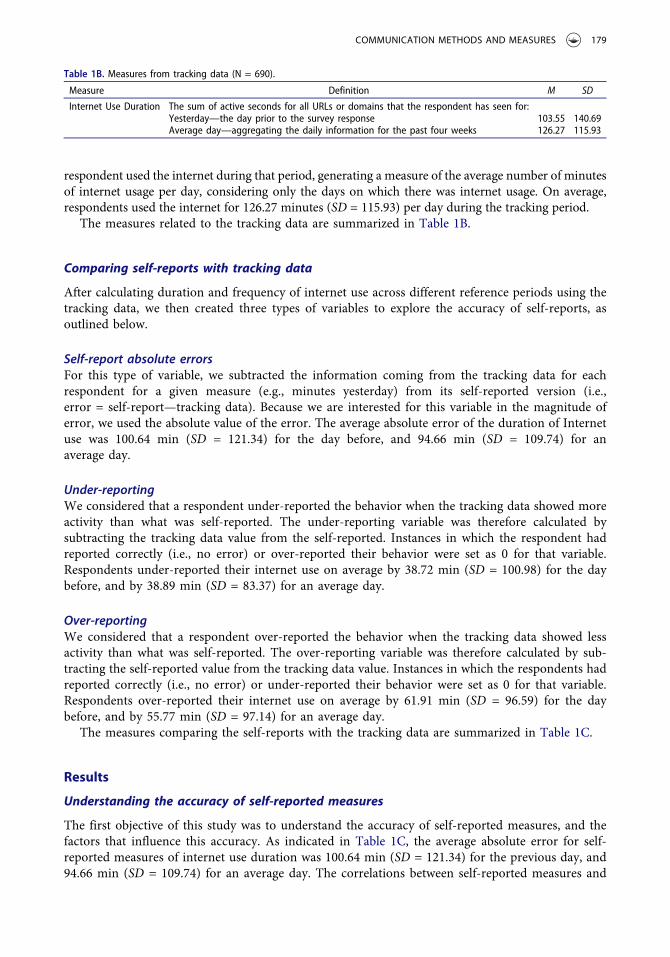
respondent used the internet during that period, generating a measure of the average number of minutesof internet usage per day, considering only the days on which there was internet usage. On average,respondents used the internet for 126.27 minutes (SD = 115.93) per day during the tracking period.
The measures related to the tracking data are summarized in Table 1B.
Comparing self-reports with tracking data
After calculating duration and frequency of internet use across different reference periods using thetracking data, we then created three types of variables to explore the accuracy of self-reports, asoutlined below.
Self-report absolute errorsFor this type of variable, we subtracted the information coming from the tracking data for eachrespondent for a given measure (e.g., minutes yesterday) from its self-reported version (i.e.,error = self-report—tracking data). Because we are interested for this variable in the magnitude oferror, we used the absolute value of the error. The average absolute error of the duration of Internetuse was 100.64 min (SD = 121.34) for the day before, and 94.66 min (SD = 109.74) for anaverage day.
Under-reportingWe considered that a respondent under-reported the behavior when the tracking data showed moreactivity than what was self-reported. The under-reporting variable was therefore calculated bysubtracting the tracking data value from the self-reported. Instances in which the respondent hadreported correctly (i.e., no error) or over-reported their behavior were set as 0 for that variable.Respondents under-reported their internet use on average by 38.72 min (SD = 100.98) for the daybefore, and by 38.89 min (SD = 83.37) for an average day.
Over-reportingWe considered that a respondent over-reported the behavior when the tracking data showed lessactivity than what was self-reported. The over-reporting variable was therefore calculated by sub-tracting the self-reported value from the tracking data value. Instances in which the respondents hadreported correctly (i.e., no error) or under-reported their behavior were set as 0 for that variable.Respondents over-reported their internet use on average by 61.91 min (SD = 96.59) for the daybefore, and by 55.77 min (SD = 97.14) for an average day.
The measures comparing the self-reports with the tracking data are summarized in Table 1C.
Results
Understanding the accuracy of self-reported measures
The first objective of this study was to understand the accuracy of self-reported measures, and thefactors that influence this accuracy. As indicated in Table 1C, the average absolute error for self-reported measures of internet use duration was 100.64 min (SD = 121.34) for the previous day, and94.66 min (SD = 109.74) for an average day. The correlations between self-reported measures and
Table 1B. Measures from tracking data (N = 690).
Measure Definition M SD
Internet Use Duration The sum of active seconds for all URLs or domains that the respondent has seen for:Yesterday—the day prior to the survey response 103.55 140.69Average day—aggregating the daily information for the past four weeks 126.27 115.93
COMMUNICATION METHODS AND MEASURES 179
tracking data were about 0.3 for both the yesterday and average-day measure, indicating low tomoderate levels of convergent validity (see Table 2).
OLS regression models on the different types of errors were estimated to examine to what extentinaccuracies of self-reports were systematically related to individual characteristics. We consider themodels on the absolute errors as conclusive regarding hypotheses 1–5 and the first research question.The more specific models on over- and under-reporting offer additional information about theprevailing nature of inaccuracies and serve to answer the second research question and test hypoth-esis 6. Furthermore, plots of predicted values facilitated the interpretation of significant effects foundfor the more specific models of over- and under-reporting.
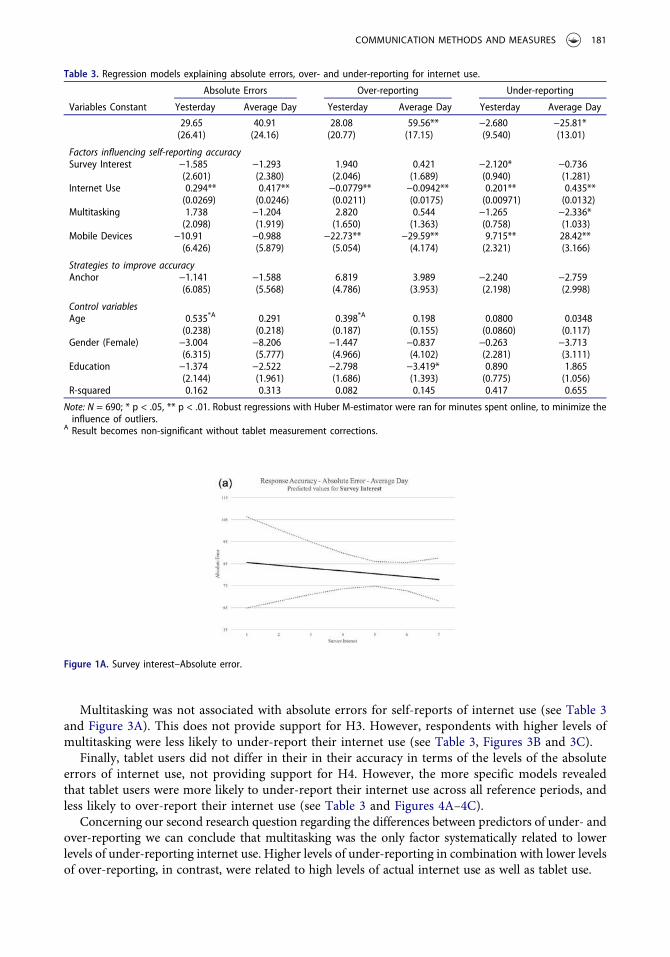
Interest in the survey was not associated with lower levels of absolute errors for self-reportedduration of internet use, not providing support for H1. Also, no associations were found for levels ofover-reporting. However, respondents with higher levels of interest in the survey were less likely tounder-report the minutes spent online on the previous day while no association was found forunder-reporting of internet use on an average day (see Table 3 and Figures 1A–1C). Overall, wefound only a very limited influence of survey interest on response accuracy.
Actual levels of internet use (as observed in the tracking data) confirmed our expectations when itcomes to accuracy of self-reports. Respondents with higher levels of actual internet use durationwere associated with higher levels of absolute errors for self-reports (see Table 3 and Figure 2A),providing support for H2. The more specific models of over- and under-reporting revealed tenden-cies corresponding to previous research. Respondents with lower levels of internet use wereassociated to higher levels of over-reporting, supporting H6a. In contrast, those with higher actuallevels of media exposure were less likely to over-report their behavior for the previous day and anaverage day. In addition, those with higher actual usage levels were more likely to under-report theirbehavior, supporting H6b (see Table 3, Figures 2B and 2C). In sum, heavy users were more likely tounder-report while light users were more likely to over-report their internet use.
Table 2. Bivariate correlations between self-reports and tracking data.
Self-reports Tracking Data
Yesterday Average day Yesterday Average day
Self-ReportsYesterday 1 .797** .294** .311**Average Day 1 .229** .291**Tracking DataYesterday 1 .702**Average Day 1
Note: N = 690; * * p < .01 (2-tailed)
Table 1C. Comparisons of self-reported and tracking data measures (N = 690).
Measure Definition
Minutes spent online(Duration)
Yesterday Average Day
Self-report absoluteerrors
The information coming from the tracking data for each respondent for a givenmeasurement (e.g., minutes yesterday) was subtracted from its self-reportedversion. Because we are interested in the magnitude of error, we used theabsolute value of the error.
100.64 94.66(121.34) (109.74)
Under-reporting The under-reporting variable was calculated by subtracting the tracking datavalue from the self-reported. Instances in which the respondent had reportedcorrectly (i.e., no error) or over-reported their behavior were set as 0 for thatvariable.
38.72 38.89(100.98) (83.37)
Over-reporting The over-reporting variable was calculated by subtracting the self-reported valuefrom the tracking data value. Instances in which the respondent had reportedcorrectly (i.e., no error) or under-reported their behavior were set as 0 for thatvariable.
61.91 55.77(96.59) (97.14)
Note: Standard deviations reported in parentheses.
180 T. ARAUJO ET AL.
Multitasking was not associated with absolute errors for self-reports of internet use (see Table 3and Figure 3A). This does not provide support for H3. However, respondents with higher levels ofmultitasking were less likely to under-report their internet use (see Table 3, Figures 3B and 3C).
Finally, tablet users did not differ in their in their accuracy in terms of the levels of the absoluteerrors of internet use, not providing support for H4. However, the more specific models revealedthat tablet users were more likely to under-report their internet use across all reference periods, andless likely to over-report their internet use (see Table 3 and Figures 4A–4C).
Concerning our second research question regarding the differences between predictors of under- andover-reporting we can conclude that multitasking was the only factor systematically related to lowerlevels of under-reporting internet use. Higher levels of under-reporting in combination with lower levelsof over-reporting, in contrast, were related to high levels of actual internet use as well as tablet use.
Table 3. Regression models explaining absolute errors, over- and under-reporting for internet use.
Absolute Errors Over-reporting Under-reporting
Variables Constant Yesterday Average Day Yesterday Average Day Yesterday Average Day
Note: N = 690; * p < .05, ** p < .01. Robust regressions with Huber M-estimator were ran for minutes spent online, to minimize theinfluence of outliers.
A Result becomes non-significant without tablet measurement corrections.
Figure 1A. Survey interest–Absolute error.
COMMUNICATION METHODS AND MEASURES 181
Improving the accuracy of self-reports through survey design
The second objective of this study was to explore the effectiveness of different survey designstrategies on improving the accuracy of self-reports. As seen in Table 3 and Figure 5A, the anchoringquestion is not related to absolute levels of error of self-reported internet use, not providing supportfor H5. In addition, under- or over-reporting were not significantly related to the use of anchorquestions. Moreover, as opposed to our expectations, the predicted values displayed in Figures 5Band 5C revealed higher levels of over-reporting and lower levels of under-reporting for the anchorcondition indicating that the specific anchor applied in this study did not improve accuracy.
Figure 1B. Survey interest–Over-reporting.
Figure 1C. Survey interest–Under-reporting.
Figure 2A. Internet use–Absolute error.
182 T. ARAUJO ET AL.
Second, exposing respondents to different reference periods, in response to RQ2, is not associatedwith differences in absolute errors (F(1,689) = 2.116, p = .146), however, when removing outliers2 forboth absolute errors for an average day and for the previous day, the differences become significant(F(1,667) = 4.167, p < .05), with Bonferroni post-hoc adjustments indicating that respondents hadhigher levels of absolute errors for the previous day in comparison to an average day(Mdifference = 6.210, SE = 3.042). The repeated-measures ANOVA for over-reporting showed sig-nificant differences (F(1,689) = 4.149, p < .05), with Bonferroni post-hoc adjustments indicating thatrespondents had higher levels of over-reporting for the previous day in comparison to an average
Figure 2B. Internet use–Over-reporting.
Figure 2C. Internet use–Under-reporting.
Figure 3A. Multitasking–Absolute error.
2Cases with z-scores above 3.29 were considered outliers for this analysis.
COMMUNICATION METHODS AND MEASURES 183
day (Mdifference = 6.145, SE = 3.017). For under-reporting, however, the differences were notsignificant (F(1,689) = .003, p = .958).3
Table 4 presents the key findings of this study.
Conclusions and discussion
While online behavior and improved self-reported measures of this behavior become increasinglyimportant in communication research and other disciplines, our knowledge about the accuracy ofthese measures is still limited. For the present study a survey was conducted among the participants
Figure 3B. Multitasking–Over-reporting.
Figure 3C. Multitasking–Under-reporting.
Figure 4A. Device type–Absolute error.
3The same patterns were found when removing outliers, and as such the ANOVAs are not reported.
184 T. ARAUJO ET AL.
of an online panel who had a tracking software installed on their private PCs or tablets. This studyextended earlier findings (e.g., Revilla et al., 2016; Scharkow, 2016) by including a wider range ofexplanatory factors influencing the accuracy of self-reported internet use, and including tablet
Figure 4B. Device type–Over-reporting.
Figure 4C. Device type–Under-reporting.
Figure 5A. Anchor–Absolute error.
Figure 5B. Anchor–Over-reporting.
COMMUNICATION METHODS AND MEASURES 185
devices in addition to PCs. In addition, detailed measures of internet use and an experimental designallowed to explore how the accuracy of such measures could be improved by survey design strategies.
Overall, the analysis revealed a vast gap between self-reported internet use and the equivalentmeasures derived from the tracking data with low correlations between both types of measures.Respondents were found to more often over-report than under-report the time they spend online.These findings correspond to previous research that has found low levels of measurement corre-spondence and tendencies of over-reporting for internet use (Scharkow, 2016). This pattern has alsobeen found to apply for other media use behavior, such as the use of social media (Junco, 2013) ormobile phones (Vanden Abeele et al., 2013).
While random deviations of reported from actual behavior mainly limit the reliability of themeasures and research findings, any non-random errors lead to biased results (e.g., Prior, 2009b).From a range of possible predictors factors related to actual internet use were most consistentlyassociated to the magnitude of response errors. As has been found before, not sociodemographic or
Multitasking H3. The higher the level ofmultitasking, the lower theaccuracy of self-reports.
Notsupported
Notsupported
Increases Decreases
Mobile devices H4. The accuracy of self-reports islower for the use of mobiledevices compared to PCs.
Notsupported
Notsupported
Decreases Decreases Increases Increases
Strategies to improve accuracyAnchoring H5. Anchoring in survey questions
improves the accuracy of self-reports.
Notsupported
Notsupported
Reference periods RQ1. Which reference period(recent vs. typical) is more accurate?
Recent > Typical Over-reporting: Recent> Typical
No differences
Discerning under- and over-reportingUnder- and over-reporting
H6: Lower levels of internet useare associated to higher levels ofover-reporting (a) and greaterlevels of internet use areassociated to higher levels ofunder-reporting (b).
Supported Supported Supported Supported
186 T. ARAUJO ET AL.
other personality factors are most decisive for response accuracy, but factors that are closely related tothe behavior in question (Kahn et al., 2014; Revilla et al., 2016). Particularly, those with higher levels ofactual internet use as well as tablet users showed lower levels of over-reporting and, accordingly, higherlevels of under-reporting and, thus, clearly deviated from the general tendencies of over-reporting.
Related to this point and also in line with previous findings, the variance in the self-reportedmeasures was smaller compared to the actual behavior which could imply a lower explanatory powerof self-reported measures of internet use (Scharkow, 2016; Vanden Abeele et al., 2013; Wonneberger& Irazoqui, 2016). Corroborating these previous studies, actual internet use was identified as a maindriver for this phenomenon: Greater levels of internet use were associated to higher levels of under-reporting and lower levels of internet use to higher levels of over-reporting. This pattern coincideswith a more general notion about how the frequency of a behavior influences whether it is over- orunder-reported: Rare behaviors have been found to be more prone to being over-estimated whilemore frequent behaviors are under-estimated more often (Schwarz & Oyserman, 2001). In otherwords, vast differences of internet or other media use within the population, and more importantlytheir effects, are not sufficiently reflected by self-reported data.
By discerning users of PCs and tablets, this study reveals the importance of taking the modality ofinternet use or media use in general into account when assessing the accuracy of self-reports. Incontrast to previous research on more specific website use that revealed considerably lower levels ofaccuracy for mobile devices (smartphones) as opposed to PC users (Revilla et al., 2016), the currentstudy showed that tablet users were particularly prone to under-reporting whereas PC users weremore likely to over-report. Using mobile devices “en passant” might hinder recollecting actual usagesituations. With a growing relevance of mobile devices, the problem of self-reported online mediause might thus shift from overall tendencies of over-reporting to under-reporting.
In addition to analyzing factors that may cause biases in self-reports, this study also examined twostrategies to improve the accuracy of self-reported internet use. First, different reference periods, thatis average behavior and a more recent time frame, were compared revealing higher levels of accuracyfor the more general reference period. Also for more specific forms of media use, such as newsexposure, measures of average behavior have been found to perform better compared to more recenttime frames (Althaus & Tewksbury, 2007; Chang & Krosnick, 2003).
Second, the use of anchor questions that primed the individual context of internet use (Jerit et al.,2016; Potts & Seger, 2013) was tested with an experimental design. Triggering respondents to thinkabout their previous day and week was not found to facilitate more accurate estimations and reports.A reason for this finding might be that estimating one’s duration of internet use simply is a toocomplex task and improving recall is not the right starting point here. Providing population averagesas suggested, for instance, for news exposure (Prior, 2009b) might be a possible alternative. This,however, requires a good estimate of such an average that preferably should be based on trackingdata of a sample representative for the particular group. Generally, to improve anchoring techniquesmore research is necessary to, first, better understand the underlying mechanisms of providingindividual, contextual, or population cues. Second, anchor questions should be further refined andtheir effectiveness assessed and compared.
Limitations
Probably most important for a validation study is the underlying definition of internet use that wasapplied for the tracking and the survey research. In the survey—in line with common researchpractice—no detailed explanation about what is considered internet use was given to the respondentsleaving ample room for subjective interpretations regarding, for instance, the type of internet use, theminimum duration of use, or whether one has to actually look at the screen, etc. The tracking data,in contrast, applied clear rules, such as a threshold of 120 sec as minimum duration or therecognition of active URLs and applications. Consequently, the tracking software might recognizeinternet use that is not perceived as such by a respondent, for instance, because he or she left the
COMMUNICATION METHODS AND MEASURES 187
room for a moment or was talking to someone else. Taking into account that respondents mayoverlook or ignore lengthy qualifications (Belson, 1981), providing simple and clear definitions torespondents might help to overcome subjectivity and hence improve the validity of self-reports.
Arguably, general internet use is a broad concept that comprises manifold online activities andusage motivations, such as information seeking, entertainment, or communication. However, inaddition to these more specific types of usage also general use appears as a relevant explanatoryconcept in areas, such as uses-and-gratifications research (Papacharissi & Rubin, 2000), healthcommunication (LaRose, Lin, & Eastin, 2003), or adolescents research (Hargittai & Hinnant,2008). Considering that previous research indicates higher levels of accuracy for more specific onlineactivities (Scharkow, 2016), measuring these might be the preferred option if possible in a specificresearch context. However, it should be noted that comparisons of the accuracy of different self-reported online activities are scarce and inconclusive. Revilla et al. (2016), for instance, found vastdifferences in the accuracy of self-reported visits for a range of popular websites.
The problem of a selection bias has previously been discussed for the use of tracking data andalso applies to the current study (Revilla et al., 2016). To relate internet use to individual personsas opposed to households, it was necessary, for instance, to restrict the sample to single-personhouseholds. The purpose of the current study was, however, not to extrapolate findings regardinglevels of accuracy or the extent of specific biases to a more general population but rather touncover general problems of self-reported internet use and test possible solutions (see also,Mandell, 1974).
While a strength of this study was that different reference periods could be directly compared for thesame respondents, the order of questions (referring first to more recent behavior, followed by typicalbehavior) might have also affected the response accuracy. Alternating between different referenceperiods might have caused confusion among the respondents and was therefore not applied.
This study started out from the assumption that tracking data can serve as a “gold standard” toassess the quality of self-reported measures of internet use. However, as all measurements also thistype of data is not free of problems. For example, the tracking software itself presented limitationswhen it comes to the reporting of actual internet use for tablets, by which certain domains had 0 secof activity (when they were at the end of the navigation session). While we tested all models with theactual tracking for tablets and a correction, future research should test other technologies fortracking user activity.
This was the first study comparing self-reports with tracking data of internet use to explore theaccuracy of mobile device (tablet) use, in addition to internet use on home computers. That said, our dataincluded only one (private) device per person. While all questions clearly indicated that the respondentshould provide estimates considering only private use on that device (PC or tablet), this might havecomplicated an accurate estimation of their behavior (see Scharkow, 2016). While the design adopted bythis study allowed for a clearer comparison between PC and tablet users, future research shouldcontemplate if multiple devices per person would increase the comparability to measures typicallyused in survey research. Moreover, future studies relying only on tracking data should be cautiousabout device sharing when considering their research designs, and the tracking software to be used.
Recommendations
A first clear recommendations that can be derived from this study is that asking about theduration of internet use on a typical day yields more accurate reports compared to asking aboutyesterday and should, thus be the preferred reference period. In addition, media-use relatedfactors appeared to be most problematic in their effects on response accuracy. First, the type ofdevice matters with users of mobile devices showing different patterns of response errors. Second,the variance of self-reports appears smaller compared to actual internet use. It is, therefore, ofcrucial importance to help respondents to overcome recall and estimation problems that arerelated to media use, for instance, by developing anchors that are targeted at these problems.
188 T. ARAUJO ET AL.
Testing such anchors in combination with in-depth interviews would allow to better understandtheir effectiveness (Belson, 1981). Specifically, the effectiveness of providing population averagesas anchors for duration measures should be studied. Applying multi-method approaches insteadof relying on survey data only is another way to enhance the possibilities of survey and trackingdata also allowing to directly asses response inaccuracies (e.g., Dvir-Gvirsman, Tsfati, &Menchen-Trevino, 2016).
In sum, while this study further contributed to our understanding of possible biases of self-reports, more strategies need to be developed and tested that help us to improve the accuracy ofcentral measures within communication research. These include a wider range of anchors thatfacilitate estimation processes but also multi-method approaches, that is, combining survey datawith other sources, such as tracking data, event sampling, or also qualitative data. While this studyfocused on measures of general internet use, research should invest in better understanding andimproving more specific measures of internet use.
Funding
Funding for this study was provided by Research Priority Area Communication, University of Amsterdam.
References
Althaus, S. L., & Tewksbury, D. H. (2007). Toward a new generation of media use measures for the ANES, Report No.nes011903. Retrieved from http://www.electionstudies.org/Library/papers/Pilot2006/nes011903.pdf
Belli, R. F. (1998). The structure of autobiographical memory and the event history calendar: Potential improvementsin the quality of retrospective reports in surveys. Memory, 6(4), 383–406. doi:10.1080/741942610
Belson, W. A. (1981). The design and understanding of survey questions. Aldershot, UK: Gower Publishing Limited.Bronner, F., & Neijens, P. (2006). Audience experiences of media context and embedded advertising-a comparison of
eight media. International Journal of Market Research, 48(1), 81–100.Burton, S., & Blair, E. (1991). Task conditions, response formulation processes, and response accuracy for behavioral
frequency questions in surveys. The Public Opinion Quarterly, 55(1), 50–79. doi:10.1086/269241Chang, L., & Krosnick, J. A. (2003). Measuring the frequency of regular behaviors: Comparing the “Typical Week” to
the “Past Week.”. Sociological Methodology, 33(1), 55–80. doi:10.1111/j.0081-1750.2003.t01-1-00127.xde Vreese, C. H., & Neijens, P. (2016). Measuring media exposure in a changing communications environment.
Communication Methods and Measures, 10(2–3), 69–80. doi:10.1080/19312458.2016.1150441Duff, B. R.-L., Yoon, G., Wang, Z. (Glenn), & Anghelcev, G. (2014). Doing it all: An exploratory study of predictors of
media multitasking. Journal of Interactive Advertising, 14(1), 11–23. doi:10.1080/15252019.2014.884480Dvir-Gvirsman, S., Tsfati, Y., & Menchen-Trevino, E. (2016). The extent and nature of ideological selective exposure
online: Combining survey responses with actual web log data from the 2013 Israeli Elections. New Media & Society,18(5), 857–877. doi:10.1177/1461444814549041
Hargittai, E., & Hinnant, A. (2008). Digital inequality: Differences in young adults’ use of the internet. CommunicationResearch, 35(5), 602–621. doi:10.1177/0093650208321782
Holbrook, A. L., Green, M. C., & Krosnick, J. A. (2003). Telephone versus face-to-face interviewing of nationalprobability samples with long questionnaires: Comparisons of respondent satisficing and social desirability responsebias. Public Opinion Quarterly, 67(1), 79–125. doi:10.1086/346010
Jerit, J., Barabas, J., Pollock, W., Banducci, S., Stevens, D., & Schoonvelde, M. (2016). Manipulated vs. measured: Usingan experimental benchmark to investigate the performance of self-reported media exposure. CommunicationMethods and Measures, 10(2–3), 99–114. doi:10.1080/19312458.2016.1150444
Jiang, L. (Alice), Yang, Z., & Jun, M. (2013). Measuring consumer perceptions of online shopping convenience. Journalof Service Management, 24(2), 191–214. doi:10.1108/09564231311323962
Junco, R. (2013). Comparing actual and self-reported measures of Facebook use. Computers in Human Behavior, 29(3),626–631. doi:10.1016/j.chb.2012.11.007
Kahn, A. S., Ratan, R., & Williams, D. (2014). Why we distort in self-report: Predictors of self-report errors in videogame play. Journal of Computer-Mediated Communication, 19(4), 1010–1023. doi:10.1111/jcc4.12056
Kardefelt-Winther, D. (2014). Problematizing excessive online gaming and its psychological predictors. Computers inHuman Behavior, 31, 118–122. doi:10.1016/j.chb.2013.10.017
Krosnick, J. A. (1991). Response strategies for coping with the cognitive demands of attitude measures in surveys.Applied Cognitive Psychology, 5(3), 213–236. doi:10.1002/acp.2350050305
Kruikemeier, S., van Noort, G., Vliegenthart, R., & de Vreese, C. H. (2014). Unraveling the effects of active and passiveforms of political Internet use: Does it affect citizens’ political involvement? New Media & Society, 16(6), 903–920.doi:10.1177/1461444813495163
LaRose, R., Lin, C. A., & Eastin, M. S. (2003). Unregulated internet usage: Addiction, habit, or deficient self-regulation?Media Psychology, 5(3), 225–253. doi:10.1207/S1532785XMEP0503_01
Mandell, L. (1974). When to weight: Determining nonresponse bias in survey data. The Public Opinion Quarterly,38(2), 247–252. doi:10.1086/268155
Menon, G., & Yorkston, E. A. (2000). The use of memory and contextual cues in the formation of behavioralfrequency judgments. In A. Stone, J. Turkkan, C. Bachrach, J. Jobe, H. Kurtzman, & V. S. Cain (Eds.), The scienceof self-report: Implications for research and practice (pp. 63–79). Mahwah, NJ: Erlbaum.
Moses, L. (2012, November 7). Data points: Two-screen viewing. Retrieved from http://www.adweek.com/news/technology/data-points-two-screen-viewing-145014
Papacharissi, Z., & Rubin, A. M. (2000). Predictors of Internet use. Journal of Broadcasting & Electronic Media, 44(2),175–196. doi:10.1207/s15506878jobem4402_2
Potts, R., & Seger, J. (2013). Validity of adults’ retrospective memory for early television viewing. CommunicationMethods and Measures, 7(1), 1–25. doi:10.1080/19312458.2012.760731
Price, V. (1993). The impact of varying reference periods in survey questions about media use. Journalism & MassCommunication Quarterly, 70(3), 615–627. doi:10.1177/107769909307000312
Prior, M. (2009a). Improving media effects research through better measurement of news exposure. The Journal ofPolitics, 71(3), 893. doi:10.1017/S0022381609090781
Prior, M. (2009b). The immensely inflated news audience: Assessing bias in self-reported news exposure. PublicOpinion Quarterly, 73(1), 130–143. doi:10.1093/poq/nfp002
Revilla, M., Ochoa, C., & Loewe, G. (2016). Using passive data from a meter to complement survey data in order tostudy online behavior. Social Science Computer Review. doi:10.1177/0894439316638457
Rubinstein, J. S., Meyer, D. E., & Evans, J. E. (2001). Executive control of cognitive processes in task switching. Journalof Experimental Psychology: Human Perception and Performance, 27(4), 763–797. doi:10.1037//0096-1523.27.4.763
Scharkow, M. (2016). The accuracy of self-reported Internet use—A validation study using client log data.Communication Methods and Measures, 10(1), 13–27. doi:10.1080/19312458.2015.1118446
Schwarz, N. (1999). Self-reports: How the questions shape the answers. American Psychologist, 54(2), 93–105.doi:10.1037/0003-066X.54.2.93
Schwarz, N., & Oyserman, D. (2001). Asking questions about behavior: Cognition, communication, and questionnaireconstruction. American Journal of Evaluation, 22(2), 127–160. doi:10.1177/109821400102200202
Segijn, C. M., Voorveld, H. A. M., Vandeberg, L., & Smit, E. G. (2017). The battle of the screens: Unraveling attentionallocation and memory effects when multiscreening. Human Communication Research, n/a-n/a. doi:10.1111/hcre.12106
Smit, E. G., & Neijens, P. C. (2011). The march to reliable metrics. Journal of Advertising Research, 51(150thAnniversary Supplement), 124–135. doi:10.2501/JAR-51-1-124-135
Southwell, B. G., Gilkerson, N. D., Depue, J. B., Shelton, A. K., Friedenberg, L. M., & Koutstaal, W. (2010). Aging andthe questionable validity of recognition-based exposure measurement. Communication Research, 37(5), 603–619.doi:10.1177/0093650209356442
Vanden Abeele, M., Beullens, K., & Roe, K. (2013). Measuring mobile phone use: Gender, age and real usage level inrelation to the accuracy and validity of self-reported mobile phone use. Mobile Media & Communication, 1(2), 213–236. doi:10.1177/2050157913477095
Voorveld, H. A. M. (2011). Media multitasking and the effectiveness of combining online and radio advertising.Computers in Human Behavior, 27(6), 2200–2206. doi:10.1016/j.chb.2011.06.016
Voorveld, H. A. M., Segijn, C. M., Ketelaar, P. E., & Smit, E. G. (2014). Investigating the prevalence and predictors ofmedia multitasking across countries. Retrieved from http://repository.ubn.ru.nl/dspace31xmlui/handle/2066/133630
Wang, Z., David, P., Srivastava, J., Powers, S., Brady, C., D’Angelo, J., & Moreland, J. (2012). Behavioral performanceand visual attention in communication multitasking: A comparison between instant messaging and online voicechat. Computers in Human Behavior, 28(3), 968–975. doi:10.1016/j.chb.2011.12.018
Wonneberger, A., & Irazoqui, M. (2017). Explaining response errors of self-reported frequency and duration of TVexposure through individual and contextual factors. Journalism & Mass Communication Quarterly, 94(1), 259–281.doi:10.1177/1077699016629372
Xiao, N., Sharman, R., Rao, H. R., & Upadhyaya, S. (2014). Factors influencing online health information search: Anempirical analysis of a national cancer-related survey. Decision Support Systems, 57, 417–427. doi:10.1016/j.dss.2012.10.047
Zhong, B. (2013). From smartphones to iPad: Power users’ disposition toward mobile media devices. Computers inHuman Behavior, 29(4), 1742–1748. doi:10.1016/j.chb.2013.02.016