+ All Categories
Home > Documents > How National and International Financial Development...

How National and International Financial Development...

Date post: 08-Sep-2018
Category:
Upload: lekhuong
View: 214 times
Download: 0 times
Share this document with a friend
45
How National and International Financial Development Affect Industrial R&D Keith E. Maskus a Rebecca Neumann b Tobias Seidel c Abstract We examine the impacts of both domestic and international financial market development on R&D intensities in 22 manufacturing industries in 18 OECD countries for the period 1990-2003. We take account of such industry characteristics as the need for external financing and the amount of tangible assets. Multiple forms of domestic financial development are important determinants of R&D intensity but only foreign direct investment is significant among alternative measures of international financial development. We find the strongest effects for private bond- market capitalization, while FDI, private credit by banks, and stock-market capitalization have similar effects in terms of magnitude. JEL classification: F36, G10, G15, G32, O30 Keywords: R&D; Financial systems; Financial development; International financial integration a Corresponding Author. Department of Economics, UCB 256, University of Colorado at Boulder, Boulder CO 80309-0256, USA, [email protected] ; telephone 1-303-492-7588; fax 1-303-492-8960. b Department of Economics, PO Box 413, University of Wisconsin at Milwaukee, Milwaukee WI 53201-0413, USA, [email protected] . c ETH Zurich, Department of Management, Technology, and Economics, WEH E4, Weinbergstrasse 35, 8092 Zurich, Switzerland, [email protected] . Much of this research was conducted while Neumann and Seidel were visiting scholars at the Department of Economics at the University of Colorado. Seidel gratefully acknowledges financial support from the Fritz-Thyssen- Foundation. We are grateful to two referees for insightful comments.
Transcript

How National and International Financial

Development Affect Industrial R&D

Keith E. Maskusa

Rebecca Neumann

b

Tobias Seidel

c

Abstract

We examine the impacts of both domestic and international financial market

development on R&D intensities in 22 manufacturing industries in 18 OECD

countries for the period 1990-2003. We take account of such industry characteristics

as the need for external financing and the amount of tangible assets. Multiple forms

of domestic financial development are important determinants of R&D intensity but

only foreign direct investment is significant among alternative measures of

international financial development. We find the strongest effects for private bond-

market capitalization, while FDI, private credit by banks, and stock-market

capitalization have similar effects in terms of magnitude.

JEL classification: F36, G10, G15, G32, O30

Keywords: R&D; Financial systems; Financial development; International financial integration

a Corresponding Author. Department of Economics, UCB 256, University of Colorado at Boulder, Boulder CO

80309-0256, USA, [email protected]; telephone 1-303-492-7588; fax 1-303-492-8960. b Department of Economics, PO Box 413, University of Wisconsin at Milwaukee, Milwaukee WI 53201-0413,

USA, [email protected]. c ETH Zurich, Department of Management, Technology, and Economics, WEH E4, Weinbergstrasse 35, 8092

Zurich, Switzerland, [email protected].

Much of this research was conducted while Neumann and Seidel were visiting scholars at the Department of

Economics at the University of Colorado. Seidel gratefully acknowledges financial support from the Fritz-Thyssen-

Foundation. We are grateful to two referees for insightful comments.

1

1. Introduction

One of the most fundamental issues in economic development is how important the

maturation and deepening of financial markets are for growth. This issue has been much debated

since its reintroduction into the literature by King and Levine (1993). According to Levine

(2005), a consensus has been reached that more developed domestic financial markets stimulate

economic growth. Presumably this linkage stems from gaining better access to credit, which

allows easier financing of investment projects, which in turn leads to productivity growth.1 At a

deeper level, however, it is important to study the specific channels through which access to

finance enhances economic growth.2 In this paper we consider one particular type of investment,

namely research and development (R&D), and its association with national and international

financial market development. It is prominently argued that more investment in R&D stimulates

technological progress, which provides the foundation for the bulk of economic growth

(Griliches, 1998; Acemoglu, 2009).

Our specific focus is asking how firms’ R&D intensities respond to country-wide

financial development when such firms are in industries that rely heavily on external finance or

have limited tangible assets.3 Are financially dependent companies more likely to have higher

R&D intensities when national capital markets develop or when there is greater access to

international financial markets? If so, financial development and financial access provide key

reasons why enterprises in countries with deeper markets invest more in R&D than do their

counterparts in other nations. Additionally, industries with low proportions of tangible capital,

1 King and Levine (1993) focus on the impact of credit markets in their study of cross-country growth, while Levine

and Zervos (1998) show the importance of both stock markets and credit markets. 2 For example, Beck, et al. (2000) analyze impacts on total factor productivity, physical capital accumulation, and

private savings, while Pang and Wu (2009) consider efficient capital allocation. 3 R&D intensity is defined as expenditures on research and development relative to output at the industry level and

is endogenous in our conception. We take this terminology from the OECD and stress that it is not a purely

technology-driven measure describing the tendency of a sector to produce high-technology goods.

2

meaning plant and equipment expenditures, tend to be those with higher proportions of

intellectual capital. If the R&D intensities of those sectors also rise with capital-market

sophistication then financial development supports higher innovation in knowledge-based

endeavours.

We follow the influential approach developed by Rajan and Zingales (1998) to link

financial development and investment in R&D. Those authors interact several indicators of

financial development (on the country level) with a measure of external financial dependence (on

the industry level) to explore the relationship between financial development and economic

growth. We apply this approach to analyze the impact of various forms of financial development

on R&D intensities across industries, accounting for sectoral financial dependence and

tangibility.

Prior work on financing investments at the firm level also motivates our study (Aghion, et

al. 2004; Hall, 2002; Hall and Lerner, 2010). This research has demonstrated that firms first tap

internal funds in order to maintain control rights over their innovations. As they need additional

capital to fund R&D expenditures, however, they turn to external funds, first accessing bank

credit and then equity markets.4 This apparent hierarchy of finance specific to innovation

motivates our explicit consideration of both credit and equity measures, such as liquid liabilities,

private credit, stock market and private bond market capitalization.

We also include variables that describe international financial market development

(portfolio investment, foreign direct investment (FDI), and foreign debt), which has been ignored

in this line of research. This is an important consideration as recent work has documented a

positive link between the integration of financial markets across countries and economic growth

4 See Myers (1984), Myers and Majluf (1984) and Leland and Pyle (1977) regarding this pecking-order logic for

general investments. Harris and Raviv (1991) offer a useful review.

3

(Eichengreen, 2001; Kose, et al. 2009). Nevertheless, very little focus has been placed on

whether openness to international capital markets may affect innovation and growth through

financing R&D.5 The standard conception is that FDI is a direct source of technology transfer

and may induce greater local innovation through learning spillovers (He and Maskus, 2012;

Keller and Yeaple, 2010). However, there has been considerable growth in the

internationalization of R&D as multinational firms establish research affiliates abroad

(Gammeltoft, 2006). Further, affiliates may be financed via a mix of ownership and debt

(Kesternich and Schnitzer, 2010). It is therefore of interest to study how access to international

financial sources may affect innovation.

Financing constraints may be particularly restrictive for R&D relative to other forms of

investment.6 According to Brown, et al. (2009), innovative firms (those with high R&D

expenditures) tend to have few tangible assets that can serve as collateral for credit. R&D

expenditures largely go to salaries and wages for scientists and researchers. These human-capital

investments cannot be collateralized. Further, firms may wish to protect their proprietary

information over innovation, and thus may be unable or unwilling to offer sufficient signals

about the effectiveness of their intended R&D programs to credit providers. These issues

motivate the inclusion of a measure of asset tangibility into our analysis.

The relationships between innovation and economic growth, and between financial

development and economic growth, have been explored in a wide swath of literature. However,

there are far fewer studies of the effects of financial development on innovation as a specific

channel by which the former may stimulate growth. Aghion, et al. (2010) provide one such link

with a theoretical model that explores the impact of financing constraints on the composition of

5 Henry (2000) focuses on investment as a specific channel by which equity market liberalization may affect growth.

6 See Hall (1992), Himmelberg and Petersen (1994), Mulkay, et al. (2001), and Bond, et al. (2005) for evidence that

R&D faces financing constraints.

4

investment. Financial frictions may limit economic growth by reducing long-term investment in

R&D during economic downturns. Aghion, et al., (2008) provide related firm-level evidence.

They show that R&D investment is pro-cyclical, rising with firms’ sales in the presence of firm-

specific credit constraints. This link is particularly pronounced for enterprises with greater

external financial dependence and fewer tangible assets.

Using aggregate data, Carlin and Mayer (2003) study the relationship between R&D

intensity at the industry level and national institutional variables describing the structure of

countries’ financial systems. In particular, these authors interact accounting standards, bank

concentration and control of voting rights with equity finance dependence, bank finance

dependence, and skill dependence to look at the effects on growth, fixed investment and R&D

investment. They provide initial evidence on the relationship between domestic financial

institutions and R&D expenditures, showing broadly that better accounting standards and more

developed credit markets positively impact investment in R&D for those industries that rely

more on external equity. They find little impact on R&D from the development of equity

markets.

Our paper contributes to this literature in several ways. First, we deploy alternative

measures of financial development to describe more fully the impacts on R&D intensities of such

different dimensions as private credit, stock markets, private bond markets, portfolio investments

and foreign direct investment. Second, this menu permits us to derive novel findings based on

two classifications of the data: a differentiation between national and international sources of

finance and a categorization of financial systems as bank-based or market-based. Third, we

calculate the implied impacts of financial development on R&D propensities.

5

To preview, our findings point to a strong association between domestic financial market

development and R&D intensity. However, among sources from the international capital markets

only FDI seems to be a major factor in financing research and development. As to bank-based

versus market-based financial systems, we find significant effects for varieties of both systems.

However, we obtain the strongest effect for market-based (direct) forms of finance. Regarding

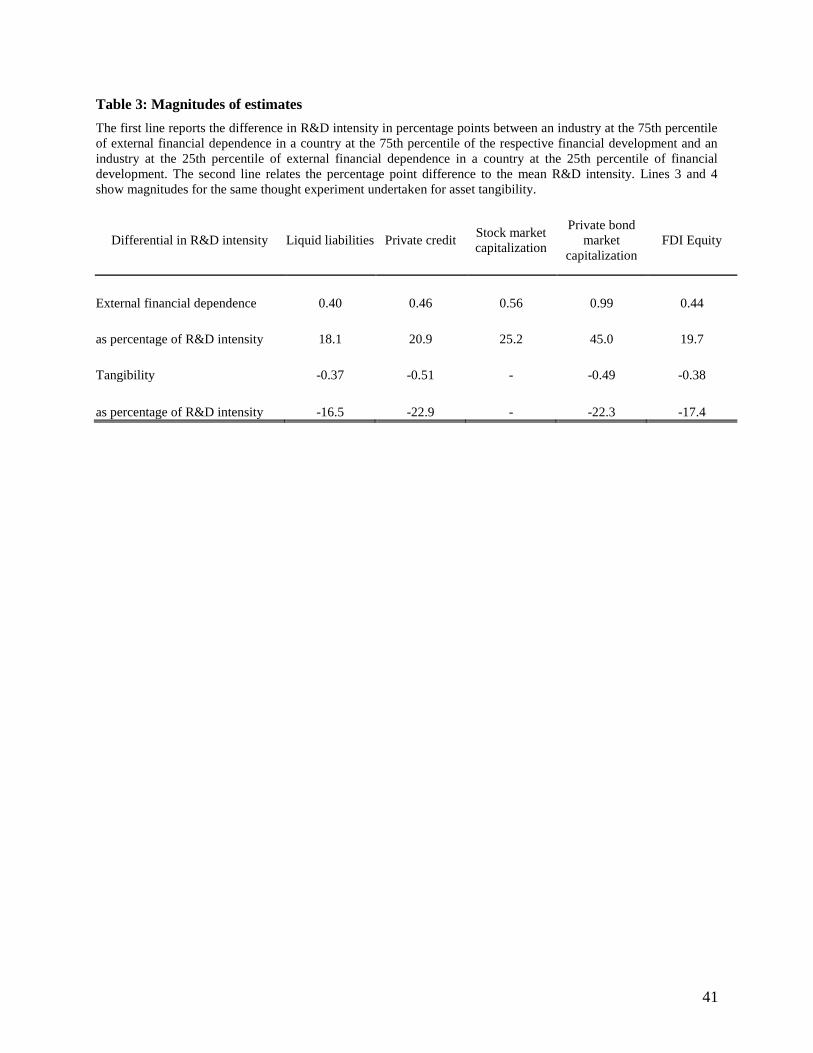
quantitative impacts, the R&D intensity of an industry that is heavily dependent on external

sources of finance in a country with well developed domestic financial markets is more than 0.4

percentage points higher than that of an industry that relies less on external sources of funding in

a country with poorly developed financial markets. This difference is about 20 percent of the

average R&D intensity in our industry sample. The largest difference arises as the private bond

market becomes larger, with our estimates suggesting as much as a 45-percent expansion of

R&D intensity in industries located in a country with extensive bond-market capitalization

versus those located in one with little capitalization.

A fourth contribution is that, to our knowledge, this is the first paper to include a measure

of asset tangibility in the context of financial market development and R&D investments. We

find that industries with fewer tangible assets generally benefit more from financial market

development than industries that are endowed with more tangible assets.7

In the next section we formally introduce the hypotheses we test and lay out the

econometric methodology to do so. We then describe the data we use in Section 3 before we

discuss our results in Section 4. In Section 5 we report the results of several robustness checks of

our benchmark specification. We offer concluding remarks in Section 6.

2. Hypotheses and econometric approach

7 Braun (2003) and Manova (2008) have used tangibility in analyzing financial constraints in international trade.

6

We study the different impacts of financial market development on R&D intensity in

industries that (i) depend on external finance to different extents and (ii) are characterized by

varying degrees of tangible assets in their overall balance sheets. Our hypotheses are that more

developed financial markets should be associated with greater R&D in industries that (i) rely

more on external finance and (ii) have less tangible assets to use as collateral.

The first industry characteristic – external financial dependence – captures the industry’s

ability to generate cash flow to finance investment projects, such as R&D. As Rajan and

Zingales (1998) argue, this measure should be determined to a large extent by industry-specific

factors that are external to the firm. For instance, it is plausible to argue that projects differ

across industries with respect to “initial project scale, the gestation period, the cash harvest

period, and the requirement for continuing investment” (Rajan and Zingales, 1998, p. 563). In

our regressions, we expect a positive coefficient on the interaction term between financial

development and sectoral external financial dependence.

The idea behind the second industry characteristic – asset tangibility – is that industries

with a high degree of tangible assets, such as equipment and plants, should be able to access

credit more easily, and at lower cost, because they have more collateral with which to guarantee

such credit. Hence, we expect a negative coefficient on the interaction term between financial

development and asset tangibility because industries with a greater presence of intangible assets,

such as intellectual capital, should gain relatively greater access to capital as financial markets

deepen. Like external dependence, tangibility is an industry characteristic largely external to the

firm.

The approach we use follows the influential work by Rajan and Zingales (1998) in

interacting industry variables (external financial dependence and asset tangibility) with several

7

country variables capturing the degree of financial market development.8 We thus regress R&D

intensity on these interaction terms, the industry share in GDP, financial market development,

and a set of country, industry and year dummies. The model we estimate is

0 1

2

(

j,k,t k j,t

k j,t

R & D intensity external financial dependence * financial market development )

(tangibility * financial market development )

3 , , 4

, ,

*( )

,

j k t j,t

j k t j k t

(industry share ) financial market development

(1)

where j denotes country, k represents industry, t is the year index, and , ,j k t describes the error

term. As Rajan and Zingales (1998) point out, the interaction terms deliver predictions about

within-country differences across industries after controlling for country-, industry- and year-

specific effects. We do not estimate the direct effect of external financial dependence or

tangibility as they are captured by our industry indicators.

Time-invariant country characteristics are controlled for by our country indicator j . The

year dummies capture all effects that countries and industries face in common, such as global

booms and busts and international trade liberalization. Furthermore, we use figures on industry

output shares to control for different industry patterns across countries.9 This is an important

inclusion since the industry shares control for national variations in comparative advantage that

could affect the relationships between industry characteristics, financial development and R&D

8 There are numerous applications of the Rajan and Zingales approach to study different aspects of financial

development within heterogeneous industries or firms. For example, Manova (2008) applies the approach to

international trade, Pang and Wu (2009) consider the efficiency of capital allocation, Cetorelli and Gambera (2001)

examine banking market structure, financial dependence, and growth, Claessens and Laeven (2003) focus on

property rights and growth, and Carlin and Mayer (2003) study differential effects on growth, physical investment,

and R&D investment. 9 To rule out autocorrelation in the error term, we alternatively used the share of industry output in 1990 instead of

the annual values. Our results are robust to this change. Similarly, taking out annual industry share entirely has little

effect on the coefficients of the two interaction terms.

8

intensity.10

In contrast to Rajan and Zingales (1998), and more closely related to Manova (2008),

we do not take average annual growth rates but instead use the annual levels for the years 1990-

2003. Hence, identification of 1 and 2 results from variation across countries and time of the

financial development indicators and variation across industries in external financial dependence

and asset tangibility. According to our hypotheses, we expect 1 to be positive and 2 to be

negative.

There are potential concerns about endogeneity and causality in equation (1), which we

now address. As a basic observation, it is difficult to envision factors that would be general

determinants of financial development and also drive variations in R&D intensity at the industry

level. In addition, there are several technical reasons for arguing that causality problems are

likely less important in our context. Note first that asset tangibility and external dependence

measures are industry characteristics that do not vary over time or across nations. Moreover, they

are calculated using U.S. data from 1990-1999. Thus, time-varying R&D expenditures at the

industry level, which change annually over 1990-2003 for each country in the sample, are not

likely to be causal for asset tangibility or external dependence computed for U.S industries. Still,

we leave the United States out of the regression analysis to eliminate any feedback effect from

U.S. R&D expenditures to these industry variables.

Second, financial development is endogenous to at least macroeconomic factors, which

has been a paramount question in the literature analyzing the impacts of market deepening on

growth. For example, the extent of economic expansion surely influences the demand for

financial instruments and the capacity to invest in national financial development. In turn, any

measures of financial development, including our own, are affected by other factors linking

10

We explore the issue of comparative advantage in more detail in the robustness section below.

9

growth to financial market structure. In prior work these influences are often instrumented by

such variables as an index for the rule of law, efficient governance, and bank regulation. In our

case, however, we argue that this concern is considerably lessened since it seems unlikely that

R&D intensity at the industry level is causal to the development of broad financial markets

(though it might be for narrower measures, such as venture capital).

Third, it could be that the interaction terms between financial development and industry

characteristics could suffer from a potential causality problem. Specifically, it is reasonable to

suppose that the more developed are financial markets the less problematic are unobservable

credit constraints, permitting firms to raise external finance without frictions. Suppose also that

industries requiring higher amounts of outside capital also happen to have better investment

prospects than those with lower dependence on external finance. Then the data will show both

high national financial development and greater R&D propensities in sectors with high external

dependence. A positive interaction coefficient then might not demonstrate a causal impact of

credit constraints, which in this situation are absent in financially developed economies.11

As a practical matter this issue is a concern only if external dependence and R&D

intensities become more correlated as credit constraints are relaxed. We check this possibility by

ranking the six countries with the highest, and six with the lowest, indicators for each measure of

financial development, then computing correlations between R&D ratios and external

dependence across these country groups. These correlations are all positive and range from 0.24

to 0.44. However, there is no systematic pattern across types of financial development and in

most cases there is no significant difference between the higher-ranked nations and the lower-

ranked nations. Thus, there is no evidence in the data that sectors with higher external

dependence also are more R&D-intensive in countries with well-developed financial markets.

11

We are grateful to a referee for pointing this out.

10

With respect to asset tangibility, in our data this variable is negatively correlated with

external dependence at the industry level. Thus, the concern expressed in the prior paragraphs

does not exist, for if firms in industries with fewer tangible assets have better innovation

opportunities, and therefore higher R&D intensities, this situation would not be conflated with

the absence of credit constraints in highly financially developed economies. Our hypothesized

negative coefficients on the interaction terms between asset tangibility and financial

development would imply that the availability of collateral does matter for the ability to raise

external capital, suggesting there is a causal effect of credit constraints on R&D. Nonetheless,

we compute the correlations between asset tangibility and R&D intensities in our high-

development and low-development sub-samples. These correlation coefficients are all negative

and vary in a narrow range between -0.31 and -0.48. More importantly, there is again no

systematic pattern in these correlations across countries grouped by levels of financial

development.

For all these reasons, we argue that it is unnecessary in our specification to deploy an

instrumental-variables approach. However, we undertake several robustness checks to raise

confidence in our results. For example, one such check is to use lagged financial development

variables in our baseline specification, which gave nearly identical results to those discussed

below.

3. Data

R&D intensity is calculated as industry-level R&D expenditures as a share of industry

output in each country for the years 1990 to 2003.12

We take R&D expenditures from the

OECD’s ANBERD database, ISIC Revision 3, with our industries defined at the two-digit level.

12

An alternative measure, R&D expenditures as a share of value added, provides similar results.

11

Industrial research and development is defined as R&D activities carried out in the business

enterprise sector, regardless of the origin of funding. Industry production (gross output at current

prices) is from the OECD’s STAN database, ISIC Rev. 3. Industry share is defined as each

industry’s production relative to GDP. GDP data (in current local currency units) are from the

World Bank’s World Development Indicators 2007.

Our proxy for each industry’s external financial dependence is calculated with figures for

U.S. companies over 1990-1999 using Standard and Poor’s Compustat database. A firm’s

external dependence is defined as capital expenditures minus cash flow from operations divided

by capital expenditures. The idea is that higher cash flow makes a firm less dependent on

external finance. This variable is calculated by Klapper, et al. (2006) and follows the definition

in Rajan and Zingales (1998).13

Specifically, we use the industry-level median (across firms) of

the ratio of capital expenditures minus cash flow over capital expenditures, where the numerator

and denominator are summed over all years for each firm before dividing. The data from

Compustat are calculated on the four-digit SIC level and then converted to the two-digit ISIC

codes to match the R&D data.

Tangibility is a proxy for each industry’s share of physical assets in total capital stock.

Following Braun (2003), we calculate this variable using U.S. data from Compustat.14

A firm’s

asset tangibility is defined as net property, plant, and equipment relative to the total book value

of assets. We take the sum of the numerator and denominator over the years 1990-1999 before

taking the ratio, in order to smooth any temporal fluctuations (and to match the calculation used

for the external financial dependence figures). The value for the median firm in each industry is

taken as the industry value. The original data are on the four-digit SIC level and are then

13

We thank Luc Laeven for providing us with the external financial dependence data. 14

We thank Nathalie Moyen for assistance with the Compustat data to generate the tangibility measure.

12

reclassified to match the ISIC Rev. 3 two-digit codes. Tangibility has been shown to be

positively associated with firms’ debt obligations using U.S. data (see Braun, 2003).15

The measures for both external dependence and tangibility are calculated from U.S. data

with the idea that they capture technological differences across industries and can thus be used to

rank industries. Rajan and Zingales (1998) provide the central argument for using U.S. data.

Specifically, because the United States has well-developed financial markets its levels of sectoral

external dependence and tangibility are those that would exist under complete markets. Hence,

these measures provide proxies for external dependence and tangibility that industries in other

countries would achieve in the absence of other financial market frictions. It is important to note,

however, that it is the ranking rather than the level that matters for identifying the coefficients in

our regressions. Technological differences within the same industry across countries are likely to

be small so that U.S. data can be used as a proxy for the ranking of industries in other countries.

We utilize a variety of measures of national financial development to capture varying

aspects of both domestic and international capital markets. All domestic indicators are taken

from the World Bank’s Financial Structure Database 2007.16

The international variables are

taken from Lane and Milesi-Ferretti (2006). All indicators are expressed relative to GDP. In the

benchmark specification, we use liquid liabilities, private credit by deposit money banks, stock-

market capitalization, and private bond-market capitalization for the domestic dimension. We

employ total external assets and liabilities, portfolio equity, FDI equity, and foreign debt to

describe the international capital market dimension.

15

Tangibility has also been used by Manova (2008) in her study on equity-market liberalization and international

trade. Claessens and Laeven (2003) use a measure of asset intangibility (i.e., the ratio of intangible-to-fixed assets)

and apply the Rajan and Zingales approach to focus on property rights and industry growth across countries. 16

See Beck, et al. (2000) for details.

13

Liquid liabilities, which equal currency plus demand and interest-bearing liabilities of

banks and other financial intermediaries, are the broadest measure of financial intermediation

and are often referred to as the depth of financial markets in a country. Private credit focuses on

credit issued to the private sector by banks, as opposed to credit issued to the government. Stock-

market capitalization, which equals the value of listed shares, measures the size of the stock

market. Similarly, bond-market capitalization, which equals the amount of outstanding domestic

debt securities issued by private entities, measures the size of the private bond market.

The broadest measure of international financial development is the sum of external assets

and external liabilities relative to GDP, which captures both the cumulative flows of capital and

relevant valuation adjustments. This variable captures financial openness in a manner analogous

to the standard measure of trade openness, which is the sum of exports and imports relative to

GDP. Each component of this measure is calculated in a similar fashion. Thus, portfolio equity is

the sum of external portfolio equity assets and liabilities, while FDI is the sum of FDI assets and

liabilities relative to GDP. We also consider a measure of foreign debt, which is calculated as

external debt assets plus liabilities (made up of portfolio debt and other investment), again

relative to GDP.

The Lane and Milesi-Ferretti (2006) variables are standard de facto measures of

international capital-market integration. Like our indicators of domestic financial development,

they vary across countries and years. Further, the measures of international financial

development are stock variables in the same way that the domestic financial development

indicators are stock variables, thus making the types of financing directly comparable at the

domestic and international level.

14

Other potential measures of international capital market openness are typically de jure

measures that may be slow to change. For example, Manova (2008) uses the dates of equity-

market liberalization as a measure of financial development in a study linking such liberalization

to trade flows. Thus, her specification relies on the interaction between external financial

dependence or tangibility and a dummy variable for the date when a country’s stock market was

liberalized. We believe it is preferable to use the actual measures of capital stocks to capture the

level of international financial market development. Kose, et al. (2009) provide additional

discussion of these de facto measures of capital-market openness in relation to alternative de jure

measures. In particular, they argue that the stocks of assets and liabilities are preferable to using

annual capital flows since the flows may be highly volatile and suffer from measurement error.

We exclude the United States from the analysis because we have used publicly listed

firms there to calculate both the external dependence and tangibility measures per industry. This

leaves 18 countries in the panel.17

The OECD R&D expenditure data by industry are available

for the years 1987-2004, although there are many missing values for 2004. Due to missing

observations for earlier years in the financial structure database, we restrict our analysis to the

period 1990-2003. Furthermore, we focus on the set of 22 two-digit manufacturing industries

because the few service industries for which data are available have very different values of

external financial dependence and tangibility in comparison with the manufacturing data.18

<Tables 1a-c>

17

Australia, Belgium, Canada, Czech Republic, Denmark, Finland, France, Germany, Ireland, Italy, Japan, Korea,

Netherlands, Norway, Poland, Spain, Sweden, and the United Kingdom. 18

We take out recycling (ISIC Rev. 3 code 37) from the OECD list of available manufacturing industries because

there is not a relevant direct concordance between the SIC industry classification (for the U.S. data used to calculate

the tangibility and external financial dependence measures) and the ISIC Rev. 3 industry classification (for the R&D

expenditures).

15

Table 1a depicts the industry descriptions and the two industry variables (external

financial dependence and tangibility) along with the average R&D intensity for each industry.

Tables 1b and 1c, respectively, summarize descriptive statistics for the data we use in our

benchmark specification and report correlation coefficients for the financial development

variables. Note from the last table that liquid liabilities and private credit are highly correlated,

presumably because they both represent broad measures of the size of domestic credit markets.

The indicators for international capital-market integration are even more highly correlated.

Interestingly, the correlations between the domestic and international variables are lower and

often close to zero.

Note that in our regressions we interact all of the financial development variables with

the same industry-level measure for external dependence or tangibility. This approach means that

the correlations among the interaction terms exceed those between the financial development

variables. We thus restrict our attention to one financial development variable at a time in the

baseline specification, rather than simultaneously including multiple interaction terms over

different financial development variables. In the sensitivity analysis, however, we explore

various combinations of the financial development measures. In particular, we include both a

debt measure and a stock-market variable simultaneously to see if there is some substitutability

or complementarity among the different types of financial development.

4. Results

We discuss the role of domestic and international financial markets sequentially in the

following two subsections, focusing attention on our two main hypotheses: (i) R&D intensity

should be higher in industries that depend more on external finance in countries with more

developed financial markets, and (ii) R&D intensity should be lower in industries that have more

16

tangible assets in countries with more developed financial markets. Hence, estimates of 1

should be positive while estimates of 2 should be negative.

4.1. Domestic financial market development

Table 2 reports baseline results for specification (1) using liquid liabilities, private credit,

stock-market capitalization, and private bond-market capitalization (all relative to GDP) as

indicators of domestic financial market development. Each of these variables is interacted with

external dependence and tangibility. We observe first that 1 , the coefficient on the interaction

term using external dependence, has a positive sign and is statistically significant in all cases.

Second, the coefficient on the tangibility interaction term, 2 , has a negative sign and is

significant in all cases, except for stock-market capitalization. Generally, the statistical

significance is lower for the tangibility interactions than for the external financial dependence

interactions. Thus, we find broad support for our two hypotheses.

Third, the estimates for external dependence, interacted with liquid liabilities, private

credit, or stock-market capitalization, are very similar in magnitude across specifications. This is

true as well for asset tangibility interacted with liquid liabilities and private credit. The size of

the private bond market coefficients differ from these levels and exert the biggest effect on R&D

intensity. For external dependence, the estimate is larger by a factor of three to four while for

tangibility the estimate is larger by a factor of two. Finally, it is notable that we do not find a

statistically significant direct effect of financial market development on R&D intensity. For

completeness we retain the level variables in the regressions but note that the coefficients on the

interaction terms are little changed by leaving out these direct effects.

<Table 2>

17

To gauge the economic significance of the estimates, we undertake the following thought

experiment. We examine by how much the R&D intensity in the 75th

percentile of external

dependence (furniture; manufacturing n.e.c.) exceeds the R&D intensity in the 25th

percentile of

external dependence (pulp, paper and paper products) if the respective financial development

measure is raised from the 25th

to the 75th

percentile of the distribution. Put differently, we ask by

how much the R&D intensity of a high-dependence sector would exceed that of a low-

dependence sector if both were moved from a country with low financial development to one

with high financial development. We do the same comparison for physical-capital tangibility by

comparing the industry at the 75th

percentile of tangibility (rubber and plastics products) with the

one at the 25th

percentile of tangibility (chemicals and chemical products).

Table 3 provides a summary of the economic magnitudes for the financial measures that

are significant in the baseline regressions, computing the implied percentage-point change in

R&D intensity and relating that value to the average R&D intensity. It is evident that the

estimated effects can be quite large, with a difference in R&D intensity of up to 45 percent of the

mean R&D intensity for the interaction between the size of the private bond market and external

financial dependence. Specifically, the industry at the 75th

percentile of external dependence has

an R&D intensity that is about one percentage point higher in France (the country at the 75th

percentile of bond-market capitalization) than does the industry at the 25th

percentile of external

dependence in Canada (the country at the 25th

percentile of bond-market capitalization). This

difference makes up 45 percent of the average R&D intensity. The interpretation is that deeper

bond-market capitalization would increase the R&D intensity of the high-dependence sector

relative to the low-dependence sector by 45 percent of the mean industry value. For liquid

18

liabilities, private credit, and stock-market capitalization, the magnitudes are between 18 and 25

percent of the mean R&D intensity.

Tangibility also is a substantial determinant of the cross-industry variation in R&D as

financial markets get deeper. An increase in the relative size of private credit and private bond

markets from the 25th

-percentile to the 75th

-percentile nation are both estimated to reduce R&D

intensity by around 22 to 23 percent in comparing the industry at the 75th

percentile of tangibility

to that at the 25th

percentile. The effect of more developed financial markets as measured by

liquid liabilities is 16.5 percent. Put differently, the data suggest that as these markets grow

relative to GDP relatively more R&D occurs in sectors with lower stocks of physical capital. One

interpretation is that improvements in credit markets (measured broadly as liquid liabilities or

more specifically finance supplied through banks or the bond market) tend to benefit those

industries with fewer tangible assets, thus loosening credit constraints for R&D investment.

It is interesting to note that there is not a significant effect via tangibility when financial

development is measured by the size of the stock market. That is, R&D intensities are not

different between levels of tangibility as stock markets grow. This may suggest that firms with

fewer tangible assets tap into equity markets even in countries where those markets are relatively

small, as we discuss in the following section.

<Table 3>

The coefficient on the industry share in GDP is negative and significant throughout in

Table 2, with similar magnitudes across the different regressions. This indicates that R&D

intensity is lower in larger industries, which is similar to the finding in Rajan and Zingales

(1998) that larger industries grow more slowly than smaller industries.

4.2. International financial market development

19

While the link between domestic financial market development and R&D intensity turns

out to be strong, there is evidence for just one influential channel of international capital. We

interact four measures of international integration – total external assets and liabilities, portfolio

equity, FDI equity, and foreign debt – with both the external financial dependence and tangibility

variables. As Table 4 shows, FDI equity seems to be the crucial international financial

development dimension that affects R&D intensity via the interaction terms. Total assets and

liabilities also show a (weakly) significant effect when interacted with external dependence.

Since foreign direct investment is one of the components of total assets and liabilities, it might be

that this effect is driven by the FDI channel.

The coefficient on the interaction between FDI equity and external dependence is highly

significant while that on the tangibility interaction is less precisely estimated, though still

significant. Both coefficients are of comparable sizes to those on the domestic measures for

liquid liabilities, private credit, and stock-market capitalization. Turning to the magnitudes of the

effects of FDI and external dependence in Table 3, we find that they are similar to the liquid

liabilities and private credit variables. Specifically, the industry at the 75th

percentile of external

dependence has an R&D intensity that is 0.44 percentage points higher in France (the country at

the 75th

percentile of FDI) than does the industry at the 25th

percentile of external dependence in

Germany (the country at the 25th

percentile of FDI). This difference makes up 19.7 percent of the

average R&D intensity. For tangibility, this thought experiment delivers a difference in R&D

intensity of -0.38 percentage points or -17.4 percent of average R&D intensity. The interaction

between tangibility and FDI shows a similar magnitude (both in percentage points and relative to

mean R&D intensity) as the liquid liability measure, which can be taken as a general measure of

20

overall credit in the economy. Thus, greater stocks of FDI are associated with greater R&D

investments for industries with lower proportions of tangible assets.

<Table 4>

4.3. Discussion

In this section we relate our empirical findings regarding R&D investments to

established theories in the finance literature. We structure our discussion according to the main

contributions of this paper: (i) the role of tangibility; (ii) national versus international measures

of financial development; and (iii) market-based versus intermediated finance.

Tangibility – debt versus equity

Generally, when a firm has few tangible assets, it is less able to take advantage of credit

markets since it has little real capital and equipment on which to collateralize the debt. This is

particularly true for R&D investment, where much of the expenditures are on wages and salaries

for scientists and other researchers. We find that the results via the tangibility channel are

particularly strong for the various forms of credit markets, with the largest effects for private

credit and private bond-market capitalization. This is consistent with the idea that R&D

expenditures face financing constraints based on the lack of tangible assets. Thus, development

of such financial markets plays a particularly large role in loosening such constraints.

As noted above, the size of the stock market, interacted with tangibility, does not have a

significant effect on R&D expenditures. This finding indicates that development of the stock

market plays little role in relaxing credit constraints associated with low stocks of capital and

equipment. This makes sense since industries with fewer tangible assets are more inclined to use

equity financing, requiring no collateralization, for their R&D programs even at lower levels of

21

financial development. Firms in those sectors may therefore find little additional stimulus to

R&D from the development of domestic stock markets.

In contrast, there is a negative impact of FDI equity interacted with tangibility. That is,

FDI can allow for greater financing of R&D even for firms with few physical-capital assets. This

finding is consistent with evidence that industries with high reliance on intellectual capital tend

to be more multinational in scope (Markusen, 2002), indicating that FDI may loosen any capital

constraints facing their R&D programs.

National versus international measures of financial development

The basic results show that financial development at the international level may be just as

important as financial development at the domestic level. The significantly positive impacts of

FDI (via the external finance channel) indicate that openness to international capital can increase

R&D expenditures by amounts that are similar to the impacts of development of domestic credit

markets. Further, the tangibility results indicate that FDI may by a useful form of financing for

firms with less capital and equipment. Note that FDI offers greater potential to monitor local-

affiliate R&D activities, which seems consistent with the notion that sectors with low tangibility

(and higher intellectual capital) would resort to this form of international capital.

Indeed, it is not surprising that the magnitude of FDI in an economy is the primary

international variable that provides significant results for relative R&D expenditures. There are a

number of reasons to expect FDI to be more effective in supporting R&D activity than other

forms of international finance, as discussed by Kose, et al. (2009). First, innovative activities

often entail greater uncertainty than physical-capital investments (Hall, 2002, and Hall and

Lerner, 2010). It thus takes a greater commitment to invest in firms with high R&D intensity.

Foreign direct investment might serve this requirement quite well. Neither portfolio equity nor

22

foreign debt offers the monitoring activities that are embodied in FDI, and thus provide a poor

alternative form of financing for those firms with fewer tangible assets.

Second, the close relationships that are often established between multinational firms and

their subsidiaries may reduce the need for tangible assets as collateral to support R&D

investments. Further, subsidiaries may be able to access the internal credit resources of the

multinational parent.19

Third, FDI is a considerably more stable source of funding than are short-

term financial flows. In that regard, it is more likely to finance innovative activities with longer

time horizons.

More fundamentally, our finding that FDI is a primary source of R&D finance

complements prior studies of the growth effects of international capital liberalization. In that

literature positive growth impacts are often found for FDI liberalization but not necessarily for

openness to other forms of portfolio equity or debt flows (Kose, et al. 2009). For example, using

country-level data Kose, et al. (2008) show that total factor productivity (TFP) growth is

increased by openness to FDI and portfolio equity flows. However, growth is diminished by

openness to external debt, a relationship that weakens as countries achieve higher levels of

domestic financial development and better domestic institutions. They argue that FDI both

provides a more stable source of funding and brings increased efficiency and potential

technology spillovers. International debt flows, in contrast, are more volatile and may lead to an

inefficient allocation of capital, particularly where domestic financial institutions are weak.20

Our

results add another layer to this analysis by showing that FDI can spur R&D investments,

19

See Desai, et al. (2004) and Manova, et al. (2009). 20

Similarly, Vlachos and Waldenström (2005) find a threshold effect in that countries above a certain level of

domestic financial development see higher growth in industry output and the number of establishments when

international capital markets are liberalized.

23

presumably because FDI supports more relationship-based finance and less arm’s-length,

lending.

External financial dependence – Market-based versus intermediated finance

While we present our results by the type of financing based on domestic or international

sources, alternatively we can consider a division into direct or market-based finance (e.g., stock-

market capitalization and bond-market capitalization) versus intermediated finance (e.g., liquid

liabilities and private credit). In the literature on the financing of innovative activities, one

primary argument is that once firms must access external funds, market-based financing may

provide a preferred form of financing relative to bank-based financing. The notion is that banks

are effective at monitoring specific firm activities where the outcomes are relatively well defined

but are less able to monitor innovative activities with highly uncertain returns. Further, bank

lending decisions are typically made by a single bank manager, who forms an opinion about the

potential returns and may be less likely to finance highly uncertain projects.

Market-based financing, on the other hand, relies on a wide variety of opinions, with this

diversity allowing for investment in uncertain activities. Allen and Gale (2000) point out that

market-based systems may be particularly significant when opinions vary about the potential

outcome of risky R&D investments. In this case, a diverse set of financiers obtain information

and invest based on their individual priors, which may differ from other investors’ expectations.

Thus, development of market-based external finance is likely to be important for innovative

enterprises. Conversely, bank-based systems may have a comparative advantage in monitoring

borrower behavior and managing risk when there is greater agreement about the potential

outcomes of investment.

24

This line of thinking is consistent with our results, which show that the positive impacts

on R&D intensities are strongest for the stock-market capitalization and private bond-market

capitalization variables (interacted with external dependence). Interestingly, we find that liquid

liabilities and private credit have impacts on R&D intensity that are similar to those of stock-

market capitalization. Thus, we may be picking up both the importance of market-based

financing and the relative preference for debt over equity in terms of maintaining control rights.

Of the international measures, FDI may incorporate aspects of both direct finance (through its

equity component) and intermediated finance (since FDI entails some control over management).

Finally, note that Denis and Mihov (2003) find a negative relationship between R&D

expenditures and the likelihood of issuing bonds. Those firms that do issue bonds (relative to

private credit) tend to be larger, more profitable, have a higher proportion of fixed assets, and

spend less on R&D. In contrast, Altunbaş et al. (2009) argue that bond markets may be

particularly useful for financing activities that embody forward-looking expectations. In a study

of large European firms, they find that firms with more growth opportunities (measured by

higher and more visible capital investment spending, which they describe as R&D investment)

prefer the bond market over syndicated loans. Thus, if large firms with higher credit ratings tend

to undertake relatively more R&D investment, then this may explain the larger impacts of the

private bond-market interaction terms in our regressions. Our data do not allow us to infer firm

details such as size or credit ratings but this line of thought may be suggestive of the differential

effects.

In summary, our findings on the determinants of relative R&D investments across

industries and countries complement these various ideas. Development of domestic financial

markets and openness to FDI clearly raise R&D intensities in sectors with higher degrees of

25

external dependence and lower proportions of physical assets. Since the latter are largely

industries with much intellectual capital, these forms of market growth favor R&D expenditures

in high-technology sectors. This finding may offer one clue about why growth and productivity

are enhanced as found in the prior literature.

5. Sensitivity analysis and robustness

5.1 Combinations of financial development variables

An important issue is whether there is an omitted variable bias from only considering one

financial development variable at a time. As can be seen in Table 1c, many of the measures of

financial development are correlated with one another. Since we use those variables interacted

with our measures for external financial dependence and tangibility, the correlations among the

interaction terms are even higher. Thus, we are unable to include all of the financial development

variables at once due to multicollinearity. Nevertheless, we consider specific combinations that

measure different aspects of financial market development and hence are less correlated.

Thereby, we clarify whether the development of different types of financial variables may

substitute for one another. In particular, we examine combinations of the credit variables and the

stock-market variables. Further, since the bond market appears to play a large role, we focus on

combinations that include the private bond-market variable.

Table 5 shows the results of these combinations of financial development variables.

Generally, the overall results are little changed. Domestic private credit appears to complement

domestic stock-market development as the interactions with the stock-market variable remain

significant when included along with interaction terms with liquid liabilities or bank credit

(columns 1 and 2). The coefficients on the interactions with external dependence are somewhat

smaller (and less precise for private credit and liquid liabilities). The stock-market interaction

26

with external dependence remains highly significant. The results on the tangibility interactions

also remain largely the same, with R&D intensity responding to the two credit variables and not

the stock-market size.

The stock-market capitalization interaction with external dependence is also robust to

including FDI and private bonds. In each case the effects of the size of stock markets come

through the external dependence channel and not through the tangibility channel.

The results on the private bond-market variable for both the interactions with external

financial dependence and tangibility are quite robust, with little change in either the magnitude

or significance of the interaction terms when it is included along with any of the other measures

of domestic or international financial development. The coefficients on the interaction terms with

liquid liabilities or private credit (columns 3 and 4) are both slightly smaller and somewhat less

significant, while the coefficient on the stock-market variable (column 5) interacted with external

financial dependence is somewhat larger and more significant. Thus, joint development of the

private bond market and domestic credit or equity markets plays a role in facilitating higher

R&D intensity.

We next consider whether domestic and international financial development measures

interact with one another. Columns 6-9 of Table 5 show that the impacts of the international-

equity variable (FDI) via the external dependence channel remain significant and are only

slightly smaller in magnitude when included with any of the domestic credit or stock-market

variables. Further, the FDI interactions have little effect on the size of the external dependence

interactions with the credit variables but attenuate the size of the external dependence

interactions with stock-market capitalization. One interesting finding is that the tangibility

interaction with FDI generally loses significance except where stock-market capitalization is

27

included, in which case it takes on a larger magnitude and is more significant. Thus, with respect

to financing R&D investment there appears to be a notable complementarity between

development of the stock market and growth in FDI for sectors with low levels of physical

assets.

<Table 5>

5.2 Institutional quality

In a recent paper, Eichengreen, et al. (2009) show that capital liberalization has positive

growth effects on financially dependent industries only in countries with well developed

financial systems and institutions. To rule out that overall development or institutional quality

are the silent drivers behind our financial development interaction terms, we control for real

GDP per capita (in logs) and a “quality of governance” index interacted with external

dependence and asset tangibility.21

To summarize the findings, when these two controls are included the estimates of the

coefficients on interactions between financial development and external dependence and

tangibility are little changed. Thus, our conclusions regarding the impacts of financial market

development on R&D investments remain robust. Among the interaction terms that include GDP

per capita, only tangibility exerts a statistically significant effect. Specifically, we find that

higher income has a positive effect on R&D investments in industries with more tangible assets.

The coefficient on institutional quality by itself is positive and significant, suggesting a

21

We do not report regression tables for this and subsequent robustness checks for the sake of brevity. However,

they may be obtained from the authors upon request. Data on GDP per capita are taken from the World Bank’s

World Development Indicators while the institutional index is provided by the PRS Group’s International Country

Risk Guide (ICRG). This index reports the mean value of the sub-indicators “corruption”, “law and order”, and

“bureaucracy quality”. This measure is widely used as an indicator for institutional quality (see, for example, Kose,

et al., 2008).

28

stimulative direct effect on R&D intensity. In this case, both interaction terms between

institutional quality and industry characteristics are significant and have the expected sign as

well. These results indicate that institutional development plays both direct and indirect roles in

encouraging investments in research and development. The main point, however, is that

including domestic institutions does not alter the importance of the different types of financial

development we have already discussed.

5.3 Comparative advantage

Systematic differences among economies in economic environments or relative factor

endowments generate distinct comparative advantages in industries across countries. In the

regressions above we controlled for this factor by including relative industry size. However, this

basic variable may not capture all the national and sectoral components of specialization. Thus,

as an additional robustness check we control first for national characteristics, including country

size (as measured by real GDP) and three factor endowments (labor force, real capital stock and

the share of the labor force with tertiary education).22

Real capital stock is computed from gross

fixed capital formation using the perpetual inventory method. In these regressions these time-

varying country variables do not exert a statistically significant effect on R&D intensity at the

industry level and, more importantly, leave unaffected the estimates of the interaction terms.

To account for comparative advantage at the industry level, we compute sector-level

capital-labor ratios across all countries, using data from the UNIDO Indstat 4 Database, and

interact these ratios with both the real capital stock and the labor force. It is notable that our basic

results are robust to controlling for both the direct and interacted effects of these additional

variables. Compared to our baseline results displayed in Tables 2 and 4, estimates of the

interaction terms between financial development and external dependence remain positive and

22

All data are taken from the World Bank’s World Development Indicators.

29

highly significant. The coefficients on tangibility retain their signs but are somewhat less

significant. Overall, however, the main pattern of the effects of financial development on R&D

investments remains undisturbed.

5.4 Additional robustness checks

We also consider a variety of alternative financial development variables, with similar

results in most cases. These alternative measures are all taken from the World Bank’s Financial

Structure Database 2007. A somewhat broader measure, private credit by deposit money banks

and other financial institutions, provides similar results to those for private credit by deposit

money banks. We also consider capitalization of the public-bond market, which is found to have

smaller effects and is less significant than private bond-market capitalization. Further, we

compare two alternative measures of stock-market capitalization: total market value traded

relative to GDP (also called market liquidity) and the market turnover ratio. The stock-market

total value traded interacted with external dependence has a positive and significant coefficient

of 0.015, which is somewhat smaller than the effect of market capitalization. The turnover ratio

is not significant. Further, as with stock-market capitalization, neither of these alternatives is

significant when interacted with tangibility. These results suggest that both stock-market size and

liquidity may be relevant for R&D expenditures for those industries that rely more on external

financing.

Further, note that with the exception of the Czech Republic and Poland, our sample

covers advanced OECD countries. To ensure that the results are not driven by these two

economies, we exclude them from the regressions and rerun each specification. We find very

similar effects overall to the baseline cases. None of the previously insignificant channels

becomes significant.

30

Recall that our industry characteristics, external dependence and asset tangibility, were

calculated from data for the years 1990-99. Thus, we conduct another robustness check by

restricting our regression sample to these years. The tangibility interaction term remains

significant only for private bond-market capitalization and the estimate exceeds the value of the

benchmark coefficient. The results on external financial dependence remain robust in this

subsample. We also look at the period 1995-1999 separately since stock markets and FDI

boomed during that period. The coefficients for the interaction terms on external financial

dependence are generally comparable to those for the whole sample. For the tangibility

interaction, the coefficients are nearly double for liquid liabilities, private credit and foreign

direct investment.

6. Conclusions

In this paper we examine the impacts of financial market development on R&D intensity

in 22 manufacturing industries in 18 OECD countries for the period 1990-2003. We include a

range of variables capturing domestic financial market development, encompassing liquid

liabilities, private credit by banks, and both stock and bond markets. Financing constraints for

R&D may be particularly tight due to the intangible nature of R&D assets. Thus we ask whether

expenditures on R&D in industries with greater levels of intangible assets respond more to

financial development. Further, because prior literature based on firm-level analysis points to

cash flow (internal funds) as important for the direct financing of R&D, we ask whether

expenditures on R&D in industries that rely more on external funds respond more to financial

development. Overall, we expect to see varying responses to the different types of financial

development. By interacting these measures with tangibility and external financial dependence,

31

we identify sectoral effects of relaxations of specific financing constraints that may be

detrimental to financing R&D.

We find statistically and economically strong effects for most domestic indicators of

financial market development. In particular, the largest impacts arise from the development of

the bond market for firms relying more on external finance. The other measures of domestic

financial market development are smaller and similar to each other.

For international capital flows, foreign direct investment has by far the strongest impacts

on R&D, operating both through sectoral financial dependence and asset tangibility. It is

remarkable that neither portfolio investments nor foreign debt (which is a combination of

portfolio debt and other investment) seem to be related to R&D intensity at the industry level.

We interpret these results as suggesting that it requires strong monitoring and managerial

commitment (which is present with FDI but not with more short-term and volatile portfolio

investment) to support more risky investments in research and development.

The largest impacts occur in response to private bond-market growth. This outcome may

be related to the size and credit ratings of firms that undertake R&D investment, although we

cannot examine this question specifically due to data limitations. Alternatively, it may be that the

development of private bond markets has larger effects for firms relying more on external

finance because those markets allow for a greater diversity of opinion among financiers, while

maintaining some control rights (in the event of bankruptcy) that stock markets do not permit.

In terms of asset tangibility, we find similar magnitudes of both credit markets and FDI,

with insignificant results for stock markets. This may indicate an important role of monitoring

through relationship lending for those firms with limited tangible assets, which generally

correspond to a high degree of intellectual capital established through R&D spending.

32

In summary, we find that development of different forms of financing may stimulate

R&D investment to different degrees. Policymakers in both advanced and emerging economies

are keen to promote domestic private R&D spending, which is a direct input into innovation and

growth. Thus, they offer tax advantages, direct subsidies and infrastructural support for R&D

programs. Our results suggest that a key factor in encouraging R&D investments is access to

finance of various forms. Thus, authorities may wish to remove impediments to the growth of

domestic financial markets, which seem to promote higher R&D intensities in sectors with high

external dependence or low asset tangibility. It also seems important to relax restrictions on FDI

flows, which have similar effects and seem particularly significant for building R&D in sectors

with high intellectual capital. Of course, these findings do not necessarily imply that these

policies will maximize overall welfare. Rather, they underscore the need to ensure access to

financial resources if R&D investments are an important policy concern.

33

References

Acemoglu, D., 2009. Introduction to Modern Economic Growth. Princeton University Press,

Princeton.

Aghion, P., Angeletos, G.-M., Banerjee, A., and Manova, K., 2010. Volatility and growth: Credit

constraints and the composition of investment. Journal of Monetary Economics 57, 246–

265.

Aghion, P., Askenazy, P., Berman, N., Cette, G., and Eymard, L., 2008. Credit constraints and

the cyclicality of R&D investment: Evidence from France. Paris School of Economics

Working Paper No 2008-26.

Aghion, P., Bond, S., Klemm, A., Marinescu, I., 2004. Technology and financial structure: Are

innovative firms different? Journal of the European Economic Association 2, 277-288.

Allen, F., Gale, D., 2000. Comparing financial systems. The MIT Press, Cambridge, MA.

Altunbaş, Y., Kara, A., Marqués-Ibáñez, D., 2009. Large debt financing: syndicated loans versus

corporate bonds. European Central Bank Working Paper Series, No. 1028.

Beck, T., Demirgüç-Kunt, A., Levine, R., 2000. A new database on financial development and

structure. World Bank Economic Review 14, 597-605.

Beck, T., Levine, R., Loayza, N., 2000. Finance and the sources of growth. Journal of Financial

Economics 58, 261-300.

Bond, S., Harhoff, D. and van Reenen, J., 2005. Investment, R&D and financial constraints in

Britain and Germany. Annales d’Economie et de Statistique 79/80, 435-463.

Braun, M., 2003. Financial contractibility and asset hardness. Unpublished working paper.

Harvard University.

Brown, J.R., Fazzari, S.M. and Petersen, B.C., 2009. Financing innovation and growth: Cash

flow, external equity, and the 1990s R&D boom. The Journal of Finance 64, 151-185.

Carlin, W., Mayer, C., 2003. Finance, investment, and growth. Journal of Financial Economics

69, 191-226.

Cetorelli, N., Gambera, M., 2001. Banking market structure, financial dependence and growth:

International evidence from industry data. Journal of Finance 56, 617-648.

Claessens, S., Laeven, L., 2003. Financial development, property rights, and growth. Journal of

Finance 58, 2401-2437.

34

Denis, D.J., Mihov, V.T., 2003. The choice among bank debt, non-bank private debt, and public

debt: Evidence from new corporate borrowings. Journal of Financial Economics 70, 3–

28.

Desai, M.A., Foley, C.F., and Hines, J.R., 2004. A Multinational perspective on capital structure

choice and internal capital markets, Journal of Finance 59, 2451–2488.

Eichengreen, B., 2001. Capital account liberalization: What do cross-country studies tell us?

World Bank Economic Review 15, 341-365.

Eichengreen, B., Gullapalli, R., and Panizza, U., 2009. Capital account liberalization, financial

development and industry growth: A synthetic view. Department of Public Policy and

Public Choice – POLIS, working paper no. 144.

Gammeltoft, P. 2006. Internationalisation of R&D: trends, drivers, and managerial challenges.

International journal of technology and globalisation 2, 177-199.

Griliches, Z., 1998. R&D and productivity: The econometric evidence. The University of

Chicago Press, Chicago.

Hall, B.H., 1992. Investment and research and development at the firm level: Does the source of

financing matter? NBER WP No. 4096.

Hall, B.H., 2002. The financing of research and development, Oxford Review of Economic

Policy 18, 35–51.

Hall, B.H., Lerner, J., 2010. The financing of R&D and innovation. In: Hall, B. H. and

Rosenberg, N. (Eds.), The Elsevier Handbook of the Economics of Innovation, Vol. 1,

Elsevier, Amsterdam, 609-639.

Harris, M., Raviv, A., 1991. The theory of capital structure. Journal of Finance 46, 297-355.

He, Y. and Maskus, K.E. 2012. Southern innovation and reverse knowledge spillovers: a

dynamic FDI model. International Economic Review, forthcoming.

Henry, P.B., 2000. Do stock market liberalizations cause investment booms? Journal of Financial

Economics 58, 301-334.

Himmelberg, C.P. and Petersen, B.C., 1994. R&D and internal finance: A panel study of small

firms in high-tech industries, Review of Economics and Statistics 76, 38–51.

Keller, W. and Yeaple, S.R. 2010. Multinational enterprises, international trade, and productivity

growth: firm-level evidence from the United States. Review of Economics and Statistics

91: 821-832.

35

Kesternich, I. and Schnitzer, M. 2010. Who is afraid of political risk? Multinational firms and

their choice of capital structure. Journal of International Economics 82: 208-218.

King, R., Levine, R., 1993. Finance and growth: Schumpeter might be right. Quarterly Journal of

Economics 108, 717-737.

Klapper, L., Laeven, L., Rajan, R.G., 2006. Entry regulation as a barrier to entrepreneurship.

Journal of Financial Economics 82, 591-629.

Kose, M.A., Prasad, E.S., Rogoff, K., and Wei, S.-J., 2009. Financial globalization: A

reappraisal. IMF Staff Papers 56, 8-62.

Kose, M.A., Prasad, E.S., and Terrones, M.E., 2008. Does openness to international financial

flows contribute to productivity growth? IZA Discussion Paper No. 3634.

Lane, P.R., Milesi-Ferretti, G.M., 2006. The external wealth of nations mark II: Revised and

extended estimates of foreign assets and liabilities, 1970-2004. IMF Working Paper

06/69.

Leland, H., Pyle, D., 1977. Information asymmetries, financial structure, and financial

intermediation. Journal of Finance 32, 371-387.

Levine, R., 2005. Finance and growth: Theory and evidence. In: Aghion, P., Durlauf, S. (Eds.),

Handbook of Economic Growth, vol. 1. Elsevier, Amsterdam, pp. 865-994.

Levine, R., Zervos, S., 1998. Stock markets and economic growth. American Economic Review

88, 537-558.

Manova, K., 2008. Credit constraints, equity market liberalizations and international trade.

Journal of International Economics 76, 33–47.

Manova, K., Wei, S.-J., Zhang, Z., 2009. Firm exports and multinational activity under credit

constraints. Unpublished manuscript, Stanford University.

Markusen, J.R., 2002. Multinational firms and the theory of international trade. MIT Press,

Cambridge, MA.

Mulkay, B., Hall, B.H. and Mairesse, J., 2001. Investment andR&D in France and in the United

States. In Deutsche Bundesbank, (Ed.): Investing Today for the World of Tomorrow,

Spring Verlag, Dresden.

Myers, S.C., 1984. The capital structure puzzle. Journal of Finance 39, 575-592.

Myers, S.C., Majluf, N.S., 1984. Corporate financing and investment decisions when firms have

information that investors do not have. Journal of Financial Economics 13, 187-221.

36

Organization for Economic Cooperation and Development, 2005. STAN Structural Analysis

Database STAN Industry Vol. 2005 release 05.

Organization for Economic Cooperation and Development, 2006. STAN Structural Analysis

Database ANBERD - R&D Expenditure in Industry (ISIC Rev.3) Vol. 2006 release 01.

Pang, J., Wu, H., 2009. Financial markets, financial dependence, and the allocation of capital.

Journal of Banking and Finance 33, 810-818.

Rajan, R.G., Zingales, L., 1998. Financial dependence and growth. American Economic Review

88, 559-586.

Vlachos, J., Waldenström, D., 2005. International financial liberalization and industry growth.

International Journal of Finance and Economics 10, 263-284.

37

Table 1a: R&D intensities and industry indicators by industry

Average R&D intensity is the industry average over all years (1990-2003) and countries, where R&D intensity is calculated as R&D expenditures as a share of

industry output by country j in industry k in year t for the years 1990 to 2003. We take R&D expenditures from OECD, ANBERD database, ISIC Rev. 3, with

manufacturing industries defined at the two-digit level. Columns 4 and 5 record two industry variables, calculated using Compustat data over 1990-1999.

External dependence is the industry-level median of the ratio of capital expenditures minus cash flow over capital expenditures, where the numerator and

denominator are summed over all years (1990-1999) for each firm before dividing. The variable comes from Klapper, Laeven, and Rajan (2006). Tangibility is

the industry-level median of the ratio of net property, plant, and equipment relative to the total book value of assets, where the numerator and denominator are

summed over all years (1990-1999) for each firm before dividing.

Industry ISIC Average R&D intensity External dependence Tangibility

Food products and beverages 15 0.0024 0.1809 0.3467

Tobacco products 16 0.0060 0.9445 0.1881

Textiles 17 0.0050 0.2615 0.3433

Wearing apparel, dressing and dyeing of fur 18 0.0028 0.1743 0.1261

Leather, leather products and footwear 19 0.0036 0.0981 0.1231

Wood and products of wood and cork (except furniture) 20 0.0021 0.1560 0.4472

Pulp, paper and paper products 21 0.0050 0.1233 0.5039

Publishing, printing and reproduction of recorded media 22 0.0012 0.0959 0.2141

Coke, refined petroleum products and nuclear fuel 23 0.0048 -0.0439 0.6112

Chemicals and chemical products 24 0.0397 0.7905 0.1778

Rubber and plastics products 25 0.0135 0.2995 0.3641

Other non-metallic mineral products 26 0.0063 -0.1205 0.3887

Basic metals 27 0.0070 0.1468 0.4095

Fabricated metal products, except machinery and equipment 28 0.0050 0.1664 0.2757

Machinery and equipment, n.e.c. 29 0.0191 0.0765 0.2088

Office, accounting and computing machinery 30 0.0662 0.5015 0.1135

Electrical machinery and apparatus, n.e.c. 31 0.0292 0.1373 0.2090

Radio, television and communication equipment 32 0.0900 0.3276 0.1594

Medical, precision and optical instruments, watches and clocks 33 0.0503 0.6425 0.1452

Motor vehicles, trailers and semi-trailers 34 0.0239 0.3943 0.2728

Other transport equipment 35 0.0415 0.1235 0.2419

Furniture; manufacturing n.e.c. 36 0.0054 0.3761 0.1844

38

Table 1b: Summary statistics for industry variables and financial development variables

The table provides summary statistics over the 22 industries and 18 countries for the sample period from 1990-2003. R&D intensity is calculated as R&D

expenditures as a share of industry output by country j in industry k in year t for the years 1990 to 2003. The R&D intensity summary statistics are taken over all

industries, years, and countries. R&D expenditures are from OECD, ANBERD database, ISIC Rev. 3. Industry production (gross output at current prices) is from

OECD, STAN database, ISIC Rev. 3. Industry share in GDP is defined as industry production relative to GDP. GDP data (in current local currency units) are

from the World Bank’s World Development Indicators 2007. External dependence is the industry-level median of the ratio of capital expenditures minus cash

flow over capital expenditures, where the numerator and denominator are summed over all years for each firm before dividing. The variable is calculated by

Klapper, Laeven, and Rajan (2006), using Compustat data over 1990-1999. Tangibility is the industry-level median of the ratio of net property, plant, and

equipment relative to the total book value of assets, where the numerator and denominator are summed over all years for each firm before dividing. We calculate

this variable using Compustat data over 1990-1999. The second block of figures provides summary statistics (over countries and years) for the domestic

financial development variables, taken from the World Bank Financial Structure Database 2007 (Beck, Demirgüç-Kunt, and Levine, 2000). The third block of

figures provides summary statistics (over countries and years) for the international financial development variables, taken from Lane and Milesi-Ferretti (2006).

The financial development variables are all calculated relative to GDP.

Mean Std. Dev. Min Max Observations

R&D intensity 0.0221 0.0382 0.0000 0.7007 3802

Industry share in GDP 0.0269 0.0281 0.0003 0.2730 4662

External dependence 0.2660 0.2535 -0.1205 0.9445 22

Tangibility 0.2752 0.1321 0.1135 0.6112 22

Liquid liabilities 0.7313 0.4045 0.2733 2.4222 240

Private credit 0.7918 0.3942 0.0867 2.1785 240

Stock market capitalization 0.5816 0.4104 0.0022 2.6877 239

Private bond market capitalization 0.3398 0.2336 0.0006 1.1882 238

Total external assets and liabilities 2.5581 2.4130 0.3452 17.9457 249

Portfolio equity 0.4032 0.6116 0.0027 4.6202 246

FDI equity 0.4966 0.4405 0.0117 2.2009 249

Foreign debt 1.5649 1.5279 0.2499 11.2992 249

39

Table 1c: Correlations among financial development variables

The table provides correlations among the domestic and financial development variables for the 18 countries for the sample period from 1990-2003. The

domestic financial development variables (the first four variables) come from the World Bank Financial Structure Database 2007 (Beck, Demirgüç-Kunt, and

Levine, 2000). The international financial development variables (the last four variables) are taken from Lane and Milesi-Ferretti (2006). The financial

development variables are all calculated relative to GDP.

Liquid

liabilities

Private

credit

Stock market

capitalization

Private bond

market

capitalization

Total external

assets and

liabilities

Portfolio

equity

FDI

equity

Foreign

debt

Liquid liabilities 1

Private credit 0.8327 1

Stock market capitalization 0.2576 0.3788 1

Private bond market capitalization 0.0312 0.0554 -0.12 1

Total external assets and liabilities 0.0553 0.2159 0.4072 -0.0844 1

Portfolio equity 0.0405 0.1786 0.4684 -0.1807 0.9123 1

FDI equity -0.0049 0.169 0.4859 0.0297 0.8127 0.6701 1

Foreign debt 0.0786 0.2232 0.3141 -0.0792 0.9756 0.8437 0.7108 1

40

Table 2: Regression of R&D intensity on domestic financial development interacted with external

financial dependence and tangibility

The table illustrates OLS panel regression results for 22 manufacturing industries in 18 OECD countries for the

years 1990-2003. Each column represents a separate regression using a different measure of domestic financial

market development (as indicated in the first row) interacted with both external financial dependence and asset

tangibility. The dependent variable is R&D intensity calculated as R&D expenditures as a share of industry output.

Industry share in GDP is defined as industry production relative to GDP. Robust standard errors are in parentheses:

* significant at 10 %; ** significant at 5%; *** significant at 1%.

Liquid

liabilities Private credit

Stock market

capitalization

Private bond

market

capitalization

Industry share in GDP -0.1347 -0.1386 -0.138 -0.1331

(0.0189)*** (0.0193)*** (0.0210)*** (0.0183)***

Liquid liabilities 0.0039

(0.0086)

External dependence * Liquid liabilities 0.0175

(0.0049)***

Tangibility * Liquid liabilities -0.0193

(0.0111)*

Private credit 0.0025

(0.0059)

External dependence * Private credit 0.0183

(0.0052)***

Tangibility * Private credit -0.0243

(0.0127)*

Stock market capitalization -0.0044

(0.0046)

External dependence * Stock market capitalization 0.0233

(0.0057)***

Tangibility * Stock market capitalization -0.0047

(0.0119)

Private bond market capitalization 0.0088

(0.013)

External dependence * Private bond market cap. 0.0674

(0.0069)***

Tangibility * Private bond market cap. -0.0375

(0.0112)***

Constant 0.0172 0.0195 0.0155 0.0147

(0.0051)*** (0.0041)*** (0.0034)*** (0.0034)***

Country-, Industry- and Year-Dummies YES YES YES YES

Observations 3643 3643 3667 3626

R-squared 0.5 0.5 0.48 0.49

41

Table 3: Magnitudes of estimates

The first line reports the difference in R&D intensity in percentage points between an industry at the 75th percentile

of external financial dependence in a country at the 75th percentile of the respective financial development and an

industry at the 25th percentile of external financial dependence in a country at the 25th percentile of financial

development. The second line relates the percentage point difference to the mean R&D intensity. Lines 3 and 4

show magnitudes for the same thought experiment undertaken for asset tangibility.

Differential in R&D intensity Liquid liabilities Private credit Stock market

capitalization

Private bond

market

capitalization

FDI Equity

External financial dependence 0.40 0.46 0.56 0.99 0.44

as percentage of R&D intensity 18.1 20.9 25.2 45.0 19.7

Tangibility -0.37 -0.51 - -0.49 -0.38

as percentage of R&D intensity -16.5 -22.9 - -22.3 -17.4

42

Table 4: Regression of R&D intensity on international financial development interacted with

external financial dependence and tangibility

The table illustrates OLS panel regression results for 22 manufacturing industries in 18 OECD countries for the

years 1990-2003. Each column represents a separate regression using a different measure of international financial

market development (as indicated in the first row) interacted with both external financial dependence and asset

tangibility. The dependent variable is R&D intensity calculated as R&D expenditures as a share of industry output.

Industry share in GDP is defined as industry production relative to GDP. Robust standard errors are in parentheses:

* significant at 10 %; ** significant at 5%; *** significant at 1%.

Total external

assets and

liabilities

Portfolio

equity FDI equity Foreign debt

Industry share in GDP -0.1401 -0.1378 -0.1496 -0.1302

(0.0232)*** (0.0241)*** (0.0223)*** (0.0214)***

Total external assets and liabilities -0.0004

(0.0006)

External dependence * Total external assets and liab. 0.0012

(0.0007)*

Tangibility * Total external assets and liab. -0.0008

(0.0019)

Portfolio equity -0.0002

(0.0025)

External dependence * Portfolio equity 0.0037

(0.003)

Tangibility * Portfolio equity -0.003

(0.0087)

FDI equity -0.0023

(0.0046)

External dependence * FDI equity 0.0194

(0.0052)***

Tangibility * FDI equity -0.0191

(0.0115)*

Foreign debt -0.0009

(0.0008)

External dependence * Foreign debt 0.0006

(0.0009)

Tangibility * Foreign debt 0.0011

(0.0022)

Constant 0.0174 0.0168 0.02 0.0158

(0.0035)*** (0.0035)*** (0.0034)*** (0.0033)***

Country-, Industry- and Year-Dummies YES YES YES YES

Observations 3795 3795 3795 3795

R-squared 0.47 0.47 0.48 0.47

43

Table 5: Combinations of financial development variables

The table illustrates OLS panel regression results for 22 manufacturing industries in 18 OECD countries for the years 1990-2003. Each column represents a different

combination of various measures of financial development. The financial development variables are each interacted with external financial dependence and tangibility.

The dependent variable is R&D intensity calculated as R&D expenditures as a share of industry output. Industry share in GDP is defined as industry production relative

to GDP. Robust standard errors are in parentheses: * significant at 10 %; ** significant at 5%; *** significant at 1%.

Liquid

liabilities and

stock market

capitalization

Private credit

and stock

market

capitalization

Liquid

liabilities and

private bond

market

capitalization

Private credit

and private

bond market

capitalization

Stock market

cap and

private bond

market cap

Liquid

liabilities and

FDI

Private credit

and FDI

Stock market

capitalization

and FDI

Private bond

market

capitalization

and FDI

Industry share in GDP -0.1422 -0.1462 -0.1354 -0.1372 -0.1486 -0.1539 -0.1539 -0.1526 -0.1515

(0.0206)*** (0.0211)*** (0.0181)*** (0.0185)*** (0.0201)*** (0.0226)*** (0.0226)*** (0.0233)*** (0.0210)***

Liquid liabilities 0.0046 0.0014 0.0034

(0.0091) (0.0092) (0.0085)

Private credit 0.0041 -0.001 0.0029

(0.0062) (0.0068) (0.006)

Stock market capitalization -0.0058 -0.0066 -0.0059 -0.0055

(0.0043) (0.0043) (0.0052) (0.0042)

Private bond market capitalization 0.01 0.012 0.0066 0.0077

(0.0151) (0.0166) (0.0148) (0.0136)

FDI equity -0.0021 -0.0029 -0.0001 -0.0034

(0.0045) (0.0048) (0.0046) (0.005)

External dependence* 0.0126 0.0147 0.0175

Liquid liabilities (0.0051)** (0.0050)*** (0.0049)***

Tangibility * -0.0193 -0.0122 -0.0211

Liquid liabilities (0.0111)* (0.0115) (0.0113)*

44

External dependence* 0.0121 0.0142 0.016

Private credit (0.0055)** (0.0053)*** (0.0052)***

Tangibility * -0.0251 -0.0138 -0.0231

Private credit (0.0121)** (0.0138) (0.0122)*

External dependence* 0.0172 0.0161 0.0282 0.0173

Stock market capitalization (0.0058)*** (0.0057)*** (0.0063)*** (0.0052)***

Tangibility * 0.0036 0.0068 0.0007 0.0072

Stock market capitalization (0.011) (0.0103) (0.0125) (0.0098)

External dependence* 0.0661 0.0655 0.0757 0.0671

Private bond market capitalization (0.0072)*** (0.0070)*** (0.0076)*** (0.0067)***

Tangibility * -0.0385 -0.0377 -0.0329 -0.0362

Private bond market capitalization (0.0112)*** (0.0114)*** (0.0128)** (0.0111)***

External dependence* 0.0185 0.0164 0.0108 0.0186

FDI equity (0.0057)*** (0.0055)*** (0.0048)** (0.0054)***

Tangibility * -0.0182 -0.0144 -0.022 -0.0126

FDI equity (0.012) (0.0113) (0.0097)** (0.0115)

Constant 0.0166 0.0186 0.016 0.0178 0.0143 0.0217 0.0226 0.0181 0.0184

(0.0056)*** (0.0044)*** (0.0045)*** (0.0036)*** (0.0039)*** (0.0056)*** (0.0044)*** (0.0035)*** (0.0035)***

Country-, Industry- and Year-Dummies YES YES YES YES YES YES YES YES YES

Observations 3522 3522 3467 3467 3491 3643 3643 3667 3619

R-squared 0.5 0.5 0.52 0.52 0.5 0.5 0.5 0.48 0.5


Recommended