Department of Health and Human Services OFFICE OF INSPECTOR GENERAL PREVALENCE AND QUALIFICATIONS OF NONPHYSICIANS WHO PERFORMED MEDICARE PHYSICIAN SERVICES Daniel R. Levinson Inspector General August 2009 OEI-09-06-00430
Transcript
Department of Health and Human Services
OFFICE OF INSPECTOR GENERAL
PREVALENCE AND QUALIFICATIONS OF NONPHYSICIANS WHO PERFORMED
MEDICARE PHYSICIAN SERVICES
Daniel R. Levinson Inspector General
August 2009 OEI-09-06-00430
Office of Inspector Generalhttp://oig.hhs.gov
The mission of the Office of Inspector General (OIG), as mandated by Public Law 95-452, as amended, is to protect the integrity of the Department of Health and Human Services (HHS) programs, as well as the health and welfare of beneficiaries served by those programs. This statutory mission is carried out through a nationwide network of audits, investigations, and inspections conducted by the following operating components:
Office of Audit Services The Office of Audit Services (OAS) provides auditing services for HHS, either by conducting audits with its own audit resources or by overseeing audit work done by others. Audits examine the performance of HHS programs and/or its grantees and contractors in carrying out their respective responsibilities and are intended to provide independent assessments of HHS programs and operations. These assessments help reduce waste, abuse, and mismanagement and promote economy and efficiency throughout HHS.
Office of Evaluation and Inspections The Office of Evaluation and Inspections (OEI) conducts national evaluations to provide HHS, Congress, and the public with timely, useful, and reliable information on significant issues. These evaluations focus on preventing fraud, waste, or abuse and promoting economy, efficiency, and effectiveness of departmental programs. To promote impact, OEI reports also present practical recommendations for improving program operations.
Office of Investigations The Office of Investigations (OI) conducts criminal, civil, and administrative investigations of fraud and misconduct related to HHS programs, operations, and beneficiaries. With investigators working in all 50 States and the District of Columbia, OI utilizes its resources by actively coordinating with the Department of Justice and other Federal, State, and local law enforcement authorities. The investigative efforts of OI often lead to criminal convictions, administrative sanctions, and/or civil monetary penalties.
Office of Counsel to the Inspector General The Office of Counsel to the Inspector General (OCIG) provides general legal services to OIG, rendering advice and opinions on HHS programs and operations and providing all legal support for OIG’s internal operations. OCIG represents OIG in all civil and administrative fraud and abuse cases involving HHS programs, including False Claims Act, program exclusion, and civil monetary penalty cases. In connection with these cases, OCIG also negotiates and monitors corporate integrity agreements. OCIG renders advisory opinions, issues compliance program guidance, publishes fraud alerts, and provides other guidance to the health care industry concerning the anti-kickback statute and other OIG enforcement authorities.
OBJECTIVES For days that Medicare allows more than 24 hours of services billed by a single physician:
1. Identify the services physicians bill to Medicare but do not perform personally.
2. Assess the qualifications of nonphysicians who perform these services.
BACKGROUND Medicare Part B pays for services that are billed by physicians but are performed by nonphysicians. These services often are called “incident to” services, or services provided under the “incident to” rule. “Incident to” services may be vulnerable to overutilization and may put beneficiaries at risk of receiving services that do not meet professionally recognized standards of care. Little is known about Medicare services performed “incident to” the professional services of a physician.
Using Part B Medicare National Claims History data for the first quarter of 2007, we identified all days during which Medicare allowed services for physicians in a single day that exceeded 24 hours of physician worktime. We randomly selected 250 of these “physician-day” combinations and requested that the physicians identify who performed each service that Medicare allowed on the selected day(s). We asked the physicians to submit all relevant credentials for the nonphysicians they identified. Our contractor’s nurse-reviewers determined whether the nonphysicians were qualified to render the particular services. In making these determinations, the nurse-reviewers considered any relevant Medicare requirements, State laws and regulations, and the nurses’ own professional judgment as to whether the particular service generally falls within the standard competencies of the particular type of nonphysician provider who rendered the service.
FINDINGS When Medicare allowed physicians more than 24 hours of services in a day, half of the services were not performed personally by a physician. In the first quarter of 2007, physicians who were allowed services that exceeded 24 hours of physician worktime in a day personally performed approximately half of these services. Nonphysicians performed the remaining services, which physicians may
E X E C U T I V E S U M M A R Y
have billed as “incident to” services. Medicare allowed $105 million for approximately 934,000 services that the physicians personally performed and approximately $85 million for approximately 990,000 services that nonphysicians personally performed during this 3-month period.
Nonphysicians performed almost two-thirds of the invasive services that Medicare allowed the physicians. An invasive procedure involves entry into the living body (as by incision or by insertion of an instrument). Nonphysicians performed almost half of the noninvasive services that Medicare allowed the physicians.
Unqualified nonphysicians performed 21 percent of the services that physicians did not perform personally. In the first 3 months of 2007, Medicare allowed $12.6 million for approximately 210,000 services performed by unqualified nonphysicians. These nonphysicians did not possess the necessary licenses or certifications, had no verifiable credentials, or lacked the training to perform the service. Nonphysicians with inappropriate qualifications performed 7 percent of the invasive services that physicians did not perform.
RECOMMENDATIONS Services performed by unqualified nonphysicians represent a risk to Medicare beneficiaries. State laws that require training, certification, and licensure of nonphysicians help to ensure that patients receive safe and quality care. However, among the physicians who billed Medicare for more than 24 hours of services in a day, nonphysicians performed half of the services billed, and unqualified nonphysicians performed one in every five services not performed by a physician. These nonphysicians were not practicing pursuant to State laws, State regulations, or Medicare regulations; had no verifiable credentials; and/or had not received the appropriate training to perform the services (according to our reviewers’ professional judgment).
We are concerned about the potential scale of this problem. We cannot report the extent to which all physicians who bill Medicare bill for services performed by unqualified nonphysicians because our sample included only those physicians who billed for more than 24 hours of services in a day. The sample was a proxy for physicians who billed “incident to.” Medicare claims data do not identify “incident to” services as such. However, we have no reason to believe that the issues identified in this review are unique to these physicians. For example,
O E I - 0 9 - 0 6 - 0 0 4 3 0 N O N P H Y S I C I A N S W H O P E R F O R M E D M E D I C A R E P H Y S I C I A N S E R V I C E S iii
E X E C U T I V E S U M M A R Y
physicians who bill Medicare for fewer than 24 hours of services in a day might also bill for “incident to” services performed by unqualified nonphysicians. Although our sample represents relatively few physicians (3,165 of the 805,401 physicians who billed Medicare in the first 3 months of 2007), the potential exists that this problem is more widespread than we can report at this time.
Therefore, we recommend that the Centers for Medicare & Medicaid Services (CMS):
1. Seek revisions to the “incident to” rule. The rule should require that physicians who do not personally perform the services they bill to Medicare ensure that no persons except:
a. licensed physicians personally perform the services or
b. nonphysicians who have the necessary training, certification, and/or licensure, pursuant to State laws, State regulations, and Medicare regulations personally perform the services under the direct supervision of a licensed physician.
2. Require physicians who bill services to Medicare that they do not personally perform to identify the services on their Medicare claims by using a service code modifier. The modifier would allow CMS to monitor claims to ensure that physicians are billing for services performed by nonphysicians with appropriate qualifications.
3. Take appropriate action to address the claims for services that we detected that:
a. were billed by physicians and performed by nonphysicians that were, by definition, not “incident to” services and
b. were for rehabilitation therapy services performed by nonphysicians who did not have the training of a therapist.
AGENCY COMMENTS AND OFFICE OF INSPECTOR GENERAL RESPONSE CMS concurred with two of our three recommendations. CMS did not concur with our recommendation to create a service code modifier to identify physicians’ claims for services that physicians do not personally perform. CMS stated that “incidental services are often shared by physicians and staff, making definition of a service not ‘personally
O E I - 0 9 - 0 6 - 0 0 4 3 0 N O N P H Y S I C I A N S W H O P E R F O R M E D M E D I C A R E P H Y S I C I A N S E R V I C E S iv
E X E C U T I V E S U M M A R Y
performed’ operationally difficult.” However, CMS stated it agrees with our “underlying objective of increasing the available data on services provided “incident to.”
We continue to believe that CMS should have the ability to identify and monitor physicians’ claims for services that physicians bill, but do not personally perform. This review identified unqualified nonphysicians who furnished services to Medicare beneficiaries. We believe that the lack of a service code modifier to identify physicians’ “incident to” claims represents a significant vulnerability to the Medicare program. CMS stated it would study the operational issues involved in implementing the recommendation. We look forward to learning the specific steps CMS plans to take with respect to this issue.
CMS provided technical comments in addition to its response to our recommendations. If appropriate, we incorporated the technical comments into the final report.
O E I - 0 9 - 0 6 - 0 0 4 3 0 N O N P H Y S I C I A N S W H O P E R F O R M E D M E D I C A R E P H Y S I C I A N S E R V I C E S v
T A B L E O F C O N T E N T S Δ
E X E C U T I V E S U M M A R Y . . . . . . . . . . . . . . . . . . . . . . . . . . . . . . . . . . . . . i
I N T R O D U C T I O N . . . . . . . . . . . . . . . . . . . . . . . . . . . . . . . . . . . . . . . . . . . 1
F I N D I N G S . . . . . . . . . . . . . . . . . . . . . . . . . . . . . . . . . . . . . . . . . . . . . . . . . 8
When Medicare allowed physicians more than 24 hours of services in a day, half of the services were notperformed personally by a physician . . . . . . . . . . . . . . . . . . . . . . . . 8
Unqualified nonphysicians performed 21 percentof the services that physicians did not perform personally . . . . . . 12
R E C O M M E N D A T I O N S . . . . . . . . . . . . . . . . . . . . . . . . . . . . . . . . . . . . . 18
Agency Comments and Office of Inspector General Response . . . 19
A P P E N D I X E S . . . . . . . . . . . . . . . . . . . . . . . . . . . . . . . . . . . . . . . . . . . . . 20
A C K N O W L E D G M E N T S . . . . . . . . . . . . . . . . . . . . . . . . . . . . . . . . . . . . 33
O E I - 0 9 - 0 6 - 0 0 4 3 0 N O N P H Y S I C I A N S W H O P E R F O R M E D M E D I C A R E P H Y S I C I A N S E R V I C E S vi
I N T R O D U C T I O N Δ
OBJECTIVES For days that Medicare allows more than 24 hours of services billed by a single physician:
1. Identify the services physicians bill to Medicare but do not perform personally.
2. Assess the qualifications of nonphysicians who perform these services.
BACKGROUND “Incident to” Services Medicare Part B pays for services that are billed by physicians but are performed by nonphysician practitioners (hereinafter referred to as “nonphysicians”). These services often are called “incident to” services, or services provided under the “incident to” rule. Section 1861(s)(2)(A) of the Social Security Act (the Act) defines Medicare coverage of services and supplies performed “incident to” the professional services of a physician.1 2
“Incident to” services typically are performed by nonphysicians in a physician’s office (whether it is located in a separate office suite or institution). The Act defines these services as “. . . services and supplies (including drugs and biologicals which are not usually self-administered by the patient) furnished as incident to a physician’s professional service, of kinds which are commonly furnished in physicians’ offices and are commonly either rendered without charge or included in the physicians’ bills.” Section 1861(s)(2) of the Act does not permit services and supplies listed in their own benefit categories (except outpatient rehabilitation therapy) to be billed “incident to.”3
The “incident to” rule allows physicians to bill for services performed by any personnel (licensed or unlicensed). Examples of nonphysicians include physician assistants, nurses, medical technicians, and medical
O E I - 0 9 - 0 6 - 0 0 4 3 0 N O N P H Y S I C I A N S W H O P E R F O R M E D M E D I C A R E P H Y S I C I A N S E R V I C E S
1 42 U.S.C. § 1395x(s)(2)(A). 2 In this context, “physicians” include medical doctors, doctors of osteopathy, doctors of
dental surgery, podiatrists, optometrists, and chiropractors. The Act, § 1861(r), 42 U.S.C § 1395x(r).
3 42 U.S.C. § 1395x(s)(2)(A).
1
I N T R O D U C T I O N
assistants.4 The implementing regulations allow physicians’ reimbursement for services at the full physician fee schedule amount for services provided by their staff if the services are:
• furnished to beneficiaries who are not inpatients of a hospital or skilled nursing facility;
• commonly furnished in a physician’s office and are “an integral, although incidental, part of the service of a physician or other practitioner in the course of diagnosis or treatment of an injury or illness;”
• included in a treatment plan for an injury or illness, where the physician personally performs the initial service and is involved actively in the course of treatment;
• “commonly furnished without charge or included in the bill of a physician (or other practitioner);” and
• furnished under the direct supervision5 of a physician (42 CFR § 410.26(b)).
“Incident to” services must meet Medicare’s general criteria for medical necessity, documentation, and quality of care. Section 1862(a)(1)(A) of the Act states that no payment may be made for services that “are not reasonable and necessary for the diagnosis or treatment of illness or injury or to improve the functioning of a malformed body member.”6
Section 1833(e) of the Act requires that providers furnish “such information as may be necessary . . . to determine the amounts due” to receive Medicare payment.7
Medicare does not require identifiers on claims indicating that the service was furnished “incident to.” Therefore, based on claims data analysis, it is not possible to determine the extent to which physicians are billing their services under “incident to.” In 1996, Medicare began a 2-year demonstration project in five States (Illinois, Maryland,
4 Some nonphysicians, such as physician assistants, are permitted to be paid independently for services provided to patients at a lower rate than a physician. These are not “incident to” types of services.
5 Direct supervision in the office setting means that the physician must be present in the office suite and immediately available to furnish assistance and direction throughout the performance of the procedure. It does not mean that the physician must be present in the room when the procedure is performed (42 CFR § 410.32(b)(3)(ii)).
O E I - 0 9 - 0 6 - 0 0 4 3 0 N O N P H Y S I C I A N S W H O P E R F O R M E D M E D I C A R E P H Y S I C I A N S E R V I C E S 2
I N T R O D U C T I O N
Michigan, Pennsylvania, and Texas) to identify “incident to” claims by adding a “YR” modifier. Provider participation was voluntary, and the Centers for Medicare & Medicaid Services (CMS) did not implement the modifier nationwide. However, claims data from 1998 indicate that a minimum of $75 million was allowed for “incident to” services in the five States. In 2006, Medicare allowed $58.4 billion8 for physician fee schedule services under Part B. It is uncertain how much of this amount was for “incident to” services.
Previous Work The Office of Inspector General (OIG) has not conducted specific reviews of “incident to” services. From 2002 to 2006, OIG issued a series of reports on cardiac rehabilitation services, which addressed physician supervision requirements when the services were furnished as “incident to.” In 2006, OIG issued a memorandum report to CMS that summarized OIG’s medical review of Medicare claims for physical therapy billed by physicians.9 We found that Medicare should not have paid for approximately 90 percent of the services we reviewed. In addition, our reviewers could not determine the skill levels for most of the staff who rendered the services that physicians had billed because of poor medical record documentation. However, 20 of the 32 physicians10 we interviewed reported that someone other than themselves performed the services they billed.
Scope This review is limited to identifying services that physicians11 bill to Medicare but do not perform personally and assessing the appropriateness of the qualifications of nonphysicians who perform them. The physicians in our sample identified the nonphysicians who personally performed the services and supplied the nonphysicians’ credentials. We determined whether the nonphysicians had all the training, certifications, and licenses required by State laws, State regulations, and/or Medicare regulations. We did not review patients’
8 “2007 Annual Report of the Boards of Trustees of the Federal Hospital Insurance and Federal Supplementary Medical Insurance Trust Funds,” Boards of Trustees of the Federal Hospital Insurance and Federal Supplementary Medical Insurance Trust Funds, April 23, 2007.
9 “Physical Therapy Billed by Physicians,” OEI-09-02-00200, May 2006. 10 We interviewed 32 of the 54 physicians in our sample. 11 Our sample population is limited to physicians for whom Medicare allowed more than
24 hours of services in a day. Medicare does not limit the services that physicians can bill to Medicare in a single day based on the total time of the services.
O E I - 0 9 - 0 6 - 0 0 4 3 0 N O N P H Y S I C I A N S W H O P E R F O R M E D M E D I C A R E P H Y S I C I A N S E R V I C E S 3
I N T R O DI N T R O D U C TU C T I O NI O N
medical records. Therefore, we did not assess the medical necessity of the services or the completeness of the medical record documentation.
METHODOLOGY Using Part B Medicare National Claims History (NCH) data for the first quarter of 2007, we identified all days during which Medicare allowed services for physicians12 in a single day that exceeded 24 hours of physician worktime. We randomly selected 250 of these “physician-day” combinations and requested that the physicians identify who performed each service that Medicare allowed on the selected day(s). We asked the physicians to submit all relevant credentials for the nonphysicians whom they identified. Our contractor’s nurse-reviewers determined whether the nonphysicians had all the training, certifications, and licenses required by State laws, State regulations, and/or Medicare regulations to perform the services billed. The following is a summary of our methodology. For additional details, see Appendix A.
Sample Sample definition. From NCH data for services rendered January through March 2007, we created a population of “physician-days.” We defined a “physician-day” as a single day (24 hours), per physician, wherein Medicare allowed services that apparently exceeded 24 hours of physician worktime. In the first quarter of 2007, Medicare allowed claims for services from 3,165 physicians for a total of 18,403 “physician-days.” Medicare allowed $204,415,178 for these physicians’ claims. We selected our sample from this population.
Final sample. Our sample of 250 “physician-days” included 30,822 line-item claims for services that Medicare allowed for 221 physicians. Because our sample-unit was the unique combination of physician and day, some physicians had more than 1 day of services in our sample. Four of the two-hundred twenty-one physicians in our sample were part of an active OIG investigation, so we removed them from the final sample. Fifteen physicians did not respond to our request for information prior to the deadline. We removed them from the sample, and they are not included in our analyses.13 Therefore, our
O E I - 0 9 - 0 6 - 0 0 4 3 0 N O N P H Y S I C I A N S W H O P E R F O R M E D M E D I C A R E P H Y S I C I A N S E R V I C E S
12 We excluded claims from doctors of dental surgery, podiatrists, optometrists, and chiropractors.
13 Our review of these physicians’ reasons for not complying with our request for information is ongoing. We will take appropriate action that may include referring the physicians to CMS or to OIG’s Office of Investigations.
4
I N T R O D U C T I O N
final review sample consisted of 27,379 line-item claims allowed by Medicare for 202 physicians on 228 “physician-days.”
Review Protocol Data collection. We requested that each sampled physician logon to our secure Web site and list who personally furnished each of the services that Medicare allowed on the sampled day(s). We asked the physicians to list all relevant licenses, certifications, and training (relevant to the service performed by the nonphysician) for each nonphysician they reported personally having performed the sampled services.
We requested that the physicians mail to us documentation to support the information that they provided on the Web site. Our Web site allowed the physicians to print and sign attestation forms that we required the physicians to sign, attesting to the accuracy and completeness of the information that they provided on the Web site. We requested copies of all licenses, certifications, diplomas, and proof of training for each nonphysician, physicians’ schedules of patient appointments, and nonphysician hours for the sampled day(s).
Nonphysician-appropriateness determinations. We provided the information submitted by the physicians to our contractor. Registered nurses served as the reviewers and determined whether the qualifications of the nonphysicians who performed the sampled services were appropriate vis-à-vis the services that the nonphysicians performed.
Nonphysicians in 29 States performed Medicare services for the physicians in our sample. The nonphysicians included technicians, nurses, licensed or certified assistants, and therapists. In addition, some nonphysicians in our sample were not licensed or certified but instead had received other formal medical training, on-the-job training, or no formal medical training at all.
O E I - 0 9 - 0 6 - 0 0 4 3 0 N O N P H Y S I C I A N S W H O P E R F O R M E D M E D I C A R E P H Y S I C I A N S E R V I C E S 5
I N T R O D U C T I O N
In addition to Medicare regulation,14 the reviewers based their decisions on State laws and regulations. For each State, the reviewers researched the State laws and regulations applicable to each nonphysician in our sample who performed services in that State. For the services performed by nonphysicians that are not addressed by State laws and regulations, the reviewers researched the training that the nonphysicians received and used their professional judgment to determine whether the training addressed the nonphysician’s competency to perform the service.
The reviewers deemed a nonphysician’s qualifications appropriate if the nonphysician who performed the services had all training, certifications, and licenses required by State laws, State regulations, and/or Medicare regulations. The reviewers deemed the nonphysician’s qualifications inappropriate if:
• the nonphysician performed the service without the licenses, certifications, or training required by Medicare regulation;15
• the nonphysician performed the service outside of his or her profession’s scope of practice as defined by State laws and/or regulations and the nonphysician lacked additional training conferring competency to perform the service; and/or
• the physician did not provide adequate documentation to confirm that the nonphysician’s credentials were valid.
Adverse actions. We determined whether the physicians in our sample and the nonphysicians who personally furnished the sampled services had been reprimanded (e.g., suspended license, revoked license, or official reprimand) from a State licensing agency and/or had been excluded from Federal health care programs. No physicians or nonphysicians in our sample had active adverse actions that would have precluded them from providing the services we reviewed. No physicians
14 The “incident to” rule allows physicians to bill for services performed by any personnel (licensed or unlicensed). However, when a physician bills rehabilitation therapy services as “incident to,” Medicare requires that the service and the person who furnishes the service must meet the standards and conditions that apply to physical therapy and physical therapists, except that a license to practice physical therapy in the State is not required (42 CFR § 410.60(a)(3)(iii)). In addition, the “incident to” rule requires physicians (or other authorized practitioners) to personally perform the initial services. Initial services billed by physicians (or other authorized practitioners) but performed by nonphysicians are not “incident to” services (42 CFR § 410.26(b)).
15 42 CFR §§ 410.60(a)(3)(iii), 410.26(b)).
O E I - 0 9 - 0 6 - 0 0 4 3 0 N O N P H Y S I C I A N S W H O P E R F O R M E D M E D I C A R E P H Y S I C I A N S E R V I C E S 6
I N T R O D U C T I O N
or nonphysicians in our sample were excluded from Federal health care programs on the dates of service we reviewed.
Patient and nonphysician schedules. We requested that the physicians submit their patient and nonphysician-staff schedules on the sampled date(s) of service. We reviewed these schedules to determine how many patients and staff the physicians had scheduled on the dates of service.
Analysis. We stored the information that we gathered from our secure Web site in a database. The reviewers input their review decisions into the same database. Using SAS software, we converted the database into SAS-format datasets, reviewed the data for completeness and logic, and analyzed the data. We used SUDAAN software to produce confidence intervals for the projectable statistics.
Projectable statistics. All statistics in the findings section of this report are projections to the total population of “physician-days” in the first 3 months of 2007. (See Appendix B for the confidence intervals for selected statistics.) Appendix C describes features of the sample that we did not project to the population and, therefore, these features should not be extrapolated to any population other than the 202 physicians and 27,379 line-item claims for the sampled services.
Limitations. Our findings are limited to the physician population for whom Medicare allowed services on “physician-days” in the first quarter of 2007. The findings in this report should not be projected to all physicians for whom Medicare allows services. Nor should our findings be projected to all nonphysicians who perform services under the auspices of physicians for whom Medicare allowed claims.
Standards
This study was conducted in accordance with the “Quality Standards for Inspections” issued by the President’s Council on Integrity and Efficiency and Executive Council on Integrity and Efficiency (now Council of the Inspectors General on Integrity and Efficiency).
O E I - 0 9 - 0 6 - 0 0 4 3 0 N O N P H Y S I C I A N S W H O P E R F O R M E D M E D I C A R E P H Y S I C I A N S E R V I C E S 7
F I N D I N G SΔ When Medicare allowed physicians more than
24 hours of services in a day, half of the services were not performed personally by a physician
In the first 3 months of 2007, physicians for whom Medicare allowed services that exceeded 24 hours of physician worktime in a
day personally performed approximately half of these services (49 percent). Nonphysicians performed the remaining services (51 percent), which may have been “incident to” services, if the services met the requirements of section 1861(s)(2)(A) of the Act. Medicare allowed approximately $105 million for approximately 934,000 services that the physicians personally performed and approximately $85 million for approximately 990,000 services that the nonphysicians performed during these months. See Chart 1.
CHART 1 Who Performed
the Services When Medicare
Allowed Physicians More
Than 24 Hours of Services in a Day
Source: OIG analysis of 2007 Medicare NCH data and document review results, 2008.
Physicians’ Claims for Services Medicare Allowed in the First Quarter of 2007
$-
$20
$40
$60
$80
$100
$120
Physicians Nonphysicians
Personally Performed By
Mill
ions
934,000 Services
990,000 Services
O E I - 0 9 - 0 6 - 0 0 4 3 0 N O N P H Y S I C I A N S W H O P E R F O R M E D M E D I C A R E P H Y S I C I A N S E R V I C E S 8
F I N D I N G
TABLE 1 Categories of
Services and Who Performed the Services When
Medicare Allowed Physicians More
Than 24 Hours of Services in a Day
S
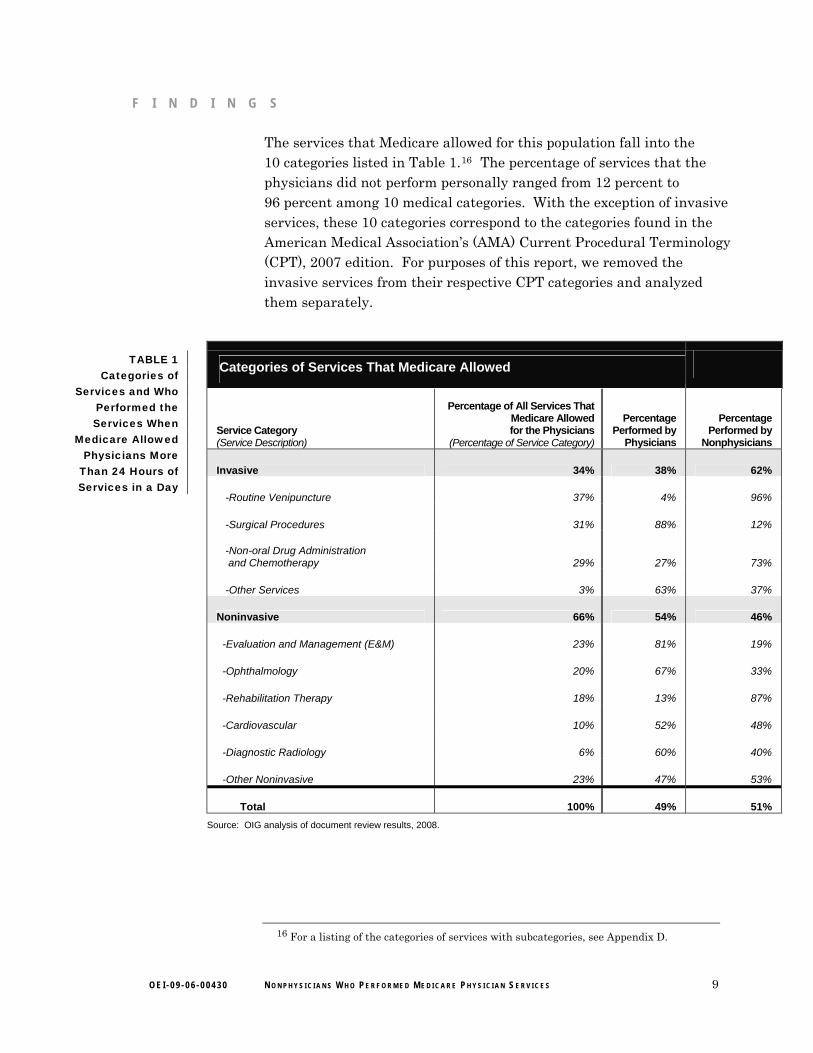
The services that Medicare allowed for this population fall into the 10 categories listed in Table 1.16 The percentage of services that the physicians did not perform personally ranged from 12 percent to 96 percent among 10 medical categories. With the exception of invasive services, these 10 categories correspond to the categories found in the American Medical Association’s (AMA) Current Procedural Terminology (CPT), 2007 edition. For purposes of this report, we removed the invasive services from their respective CPT categories and analyzed them separately.
Categories of Services That Medicare Allowed
Service Category (Service Description)
Percentage of All Services That Medicare Allowed for the Physicians
(Percentage of Service Category)
Percentage Performed by
Physicians
Percentage Performed by
Nonphysicians
Invasive 34% 38% 62%
-Routine Venipuncture 37% 4% 96%
-Surgical Procedures 31% 88% 12%
-Non-oral Drug Administration and Chemotherapy 29% 27% 73%
-Other Services 3% 63% 37%
Noninvasive 66% 54% 46%
-Evaluation and Management (E&M) 23% 81% 19%
-Ophthalmology 20% 67% 33%
-Rehabilitation Therapy 18% 13% 87%
-Cardiovascular 10% 52% 48%
-Diagnostic Radiology 6% 60% 40%
-Other Noninvasive 23% 47% 53%
Total 100% 49% 51% Source: OIG analysis of document review results, 2008.
O E I - 0 9 - 0 6 - 0 0 4 3 0 N O N P H Y S I C I A N S W H O P E R F O R M E D M E D I C A R E P H Y S I C I A N S E R V I C E S
16 For a listing of the categories of services with subcategories, see Appendix D.
9
F I N D I N G S
Nonphysicians performed almost two-thirds of the invasive services that Medicare allowed the physicians A service is “invasive” if it involves “entry into the living body (as by incision or by insertion of an instrument).”17 Invasive services account for 34 percent of all services that Medicare allowed the physicians, and nonphysicians performed 62 percent of them. These invasive services ranged in complexity from routine venipuncture and drug injections to cataract surgery and extensive foot surgery. Nonphysicians performed almost all routine venipuncture and almost three-quarters of the non-oral drug administration services and chemotherapy. Nonphysicians performed 12 percent of the surgical procedures.
Nonphysicians performed almost half of the noninvasive services that Medicare allowed the physicians Two-thirds of all the services that Medicare allowed the physicians were noninvasive services, and nonphysicians performed 46 percent of them. This includes evaluation and management (E&M), ophthalmology, rehabilitation therapy, cardiovascular, diagnostic radiology, and other noninvasive services such as diagnostic ultrasound and application of splints or casts.
E&M services account for 23 percent of the services that Medicare allowed for the physicians. Medicare allowed physicians the following types of E&M services: office visits, inpatient services, consultations, and home visits. These services typically involve at least one of three key components— patient history, physical examination, and medical decisionmaking. E&M services can vary based on these three key components, and reimbursement is based on one of five levels.18 E&M services also are classified by the setting in which they occur (e.g., office, nursing facility, or hospital) and by whether they are initial services or a repeat visit.19
Finally, a consultation is a service provided by a physician whose opinion or advice about a specific problem is requested by another physician or other appropriate source.20
O E I - 0 9 - 0 6 - 0 0 4 3 0 N O N P H Y S I C I A N S W H O P E R F O R M E D M E D I C A R E P H Y S I C I A N S E R V I C E S
17 MedlinePlus, a service of the U.S. National Library of Medicine and National Institutes of Health. Available online at http://www.nlm.nih.gov/medlineplus/mplusdictionary.html. Accessed on June 30, 2008.
18 AMA, “Current Procedural Terminology, Professional Edition,” 2007, pp. 6–8. 19 Ibid, pp. 9–33. 20 Ibid, p. 14.
Ophthalmology services account for 20 percent of the services that Medicare allowed for the physicians. Ophthalmology is the branch of medicine dealing with the eye, including its anatomy, physiology, and pathology. The service categories for ophthalmology include: eye examinations, diagnostic imaging and eye photography, and other services, such as ophthalmoscopy.
Rehabilitation therapy services account for 18 percent of the services that Medicare allowed for the physicians. Rehabilitation therapy is the treatment of functional limitations to prevent the onset and/or slow the progression of physical impairments after an illness or injury.21 These services typically are included in a plan of care and performed by physical therapists, occupational therapists, or speech-language pathologists. The plan of care can include multiple treatment modalities. Nonphysicians performed 87 percent of these services.
Most of the rehabilitation therapy services that Medicare allowed for physicians were therapeutic exercises, massage therapy, ultrasound therapy, therapeutic activities, and electrical stimulation. Other services included neuromuscular reeducation and manual therapy. The physicians were allowed relatively few physical and occupational therapy evaluations.
Cardiovascular, diagnostic radiology, and other services account for the remaining 39 percent of the services that Medicare allowed for the physicians. Cardiovascular services account for 10 percent of the services that Medicare allowed for the physicians and include cardiography and cardiac catheterization. Diagnostic radiology services account for 6 percent of the services that Medicare allowed for the physicians and include x-rays of the chest, lower extremities, spine, and pelvis. Other noninvasive services account for 23 percent of the services that Medicare allowed for the physicians. Examples of these services include radiation oncology services, diagnostic nuclear medicine services, and vascular studies.
O E I - 0 9 - 0 6 - 0 0 4 3 0 N O N P H Y S I C I A N S W H O P E R F O R M E D M E D I C A R E P H Y S I C I A N S E R V I C E S
21 For a more complete definition of physical therapy, see American Physical Therapy Association, “Model Definition of Physical Therapy for State Practice Acts in the Guide to Physical Therapy Practice,” 1997, chapter 1, p. 2.
11
FF II N D I N GN D I N G SS
Unqualified nonphysicians performed 21 percent of the services that physicians
did not perform personally
In the first 3 months of 2007, Medicare allowed $12.6 million for approximately 210,000 services performed by unqualified nonphysicians. These
nonphysicians’ qualifications were not appropriate vis-à-vis the services they performed. (See Table 2 on the following page.)22
Our primary criteria for determining whether nonphysicians were qualified to perform the services were State laws and regulations. In addition, for rehabilitation therapy services and initial patient services, we used the Medicare regulation that requires nonphysicians who perform the services “incident to” to have received the training of a therapist.23
Because the “incident to” rule allows physicians to bill for services performed by any personnel (licensed or unlicensed), we cannot report that the services were paid in error by Medicare solely because they were performed by unqualified nonphysicians. In addition, we did not request physicians’ medical records and the reviewers did not review them. The reviewers’ determinations are not based on medical necessity, proper coding, or medical record documentation. The reviewers’ determinations are not based on Medicare rules and regulations, except the services that were (1) by definition not “incident to” services24 or (2) rehabilitation therapy performed by nonphysicians who had not been trained as therapists.25
Almost half of the services that were performed by unqualified nonphysicians were performed by nonphysicians who did not possess the required licenses or certifications according to State laws, regulations, and/or Medicare rules. Nonphysicians with no verifiable qualifications performed 25 percent of the services. We could not verify the nonphysicians’ qualifications because the physicians did not provide adequate documentation. Nonphysicians who lacked the necessary training performed another 25 percent of the services. Based on our reviewers’ professional judgment, the training program(s) did not address the nonphysician’s competency to perform the service. Less
O E I - 0 9 - 0 6 - 0 0 4 3 0 N O N P H Y S I C I A N S W H O P E R F O R M E D M E D I C A R E P H Y S I C I A N S E R V I C E S
22 See Appendix E for a listing of nonphysician types and the services they performed. 23 42 CFR §§ 410.60(a)(3)(iii), 410.26(b). 24 42 CFR § 410.26. 25 42 CFR § 410.60(a)(3)(iii).
12
F I N D I N G S
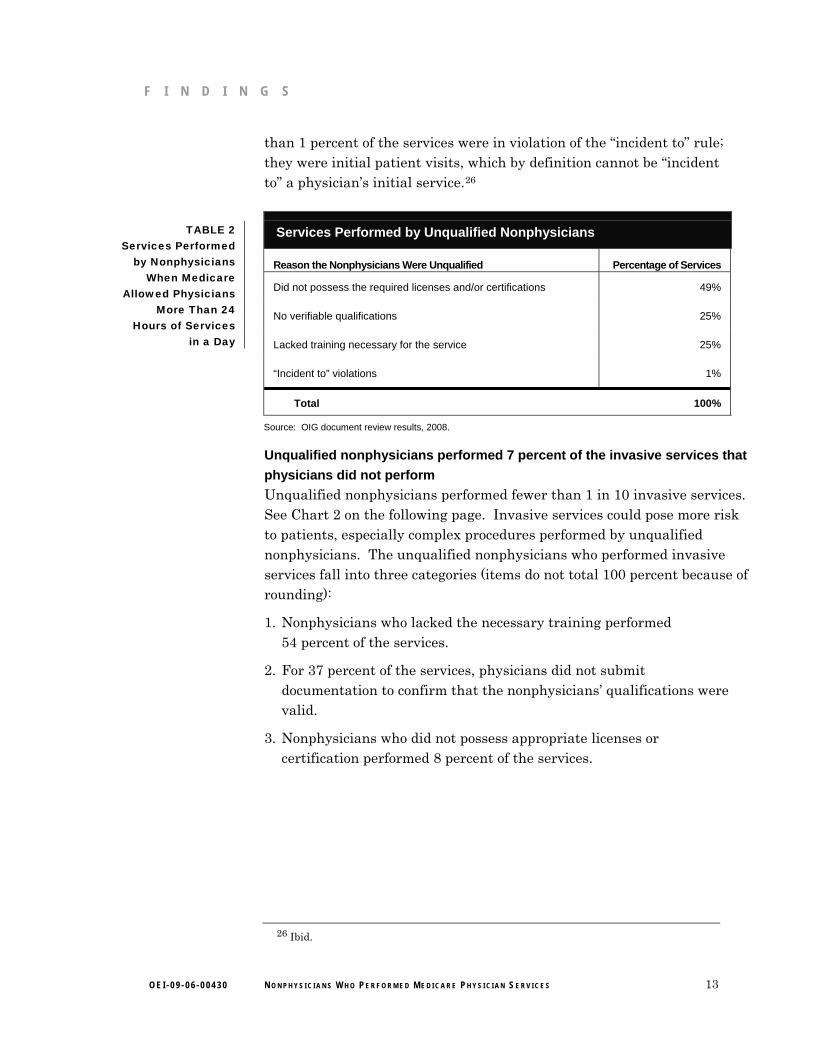
than 1 percent of the services were in violation of the “incident to” rule; they were initial patient visits, which by definition cannot be “incident to” a physician’s initial service.26
TABLE 2 Services Performed
by Nonphysicians When Medicare
Allowed Physicians More Than 24
Hours of Services in a Day
Services Performed by Unqualified Nonphysicians
Reason the Nonphysicians Were Unqualified Percentage of Services
Did not possess the required licenses and/or certifications
No verifiable qualifications
Lacked training necessary for the service
“Incident to” violations
49%
25%
25%
1%
Total 100%
Source: OIG document review results, 2008.
Unqualified nonphysicians performed 7 percent of the invasive services that physicians did not perform Unqualified nonphysicians performed fewer than 1 in 10 invasive services. See Chart 2 on the following page. Invasive services could pose more risk to patients, especially complex procedures performed by unqualified nonphysicians. The unqualified nonphysicians who performed invasive services fall into three categories (items do not total 100 percent because of rounding):
1. Nonphysicians who lacked the necessary training performed 54 percent of the services.
2. For 37 percent of the services, physicians did not submit documentation to confirm that the nonphysicians’ qualifications were valid.
3. Nonphysicians who did not possess appropriate licenses or certification performed 8 percent of the services.
O E I - 0 9 - 0 6 - 0 0 4 3 0 N O N P H Y S I C I A N S W H O P E R F O R M E D M E D I C A R E P H Y S I C I A N S E R V I C E S
26 Ibid.
13
F I N D I N G S
Invasive and Noninvasive Services
-
200,000
400,000
600,000
800,000
1,000,000
1,200,000
1,400,000
Invasive Noninvasive Service Type
Proj
ecte
d N
umbe
r of S
ervi
ces
Performed by Unqualified Nonphysicians
Performed by Qualified Nonphysicians
Performed by Physicians
CHART 2 Services
Performed by Physicians,
Qualified Nonphysicians,
and Unqualified
Nonphysicians
Source: OIG document review results, 2008.
Surgical procedures27 are among the more complex invasive services performed by unqualified nonphysicians. Surgical procedures (excluding routine venipuncture) comprise 31 percent of the invasive services performed by unqualified nonphysicians. These surgeries ranged from arterial injections to complex skin surgery. For example, medical assistants performed all of the micrographic surgical removal of tumors not performed by physicians. Our reviewers found that these types of procedures are “beyond the scope of usual medical assistant curricula,” and the physicians provided no documentation that confirmed the nonphysicians received additional training to qualify them to perform the service. These services represent more than 9,000 surgeries that nonphysicians performed on Medicare beneficiaries in the first 3 months of 2007.
O E I - 0 9 - 0 6 - 0 0 4 3 0 N O N P H Y S I C I A N S W H O P E R F O R M E D M E D I C A R E P H Y S I C I A N S E R V I C E S
27 We used AMA’s CPT definitions to determine which services in our sample were surgeries. Surgeries range broadly in the CPT, from routine venipuncture to heart/lung transplantation. However, the most complex surgeries performed by the nonphysicians in our sample were skin grafts, skin tissue rearrangement, and removal of skin lesions. The nonphysicians in our sample did not perform more complex surgeries, such as neurosurgery, cardiovascular surgery, or orthopedic surgery.
14
F I N D I N G S
Nonphysicians were not trained adequately to perform several other skin surgeries. Unqualified nonphysicians performed 90 percent of three types of the skin surgeries not performed by physicians: skin grafts, skin tissue rearrangement, and complex skin wound repairs.28
Nurses performing outside their scopes of practice performed the skin grafts. Nurses and medical assistants, also performing outside their scopes of practice, performed the tissue rearrangement and complex wound repairs. Our reviewers found that these surgeries are “beyond the usual training and education” of nurses and medical assistants, and the physicians provided no documentation that confirmed these nonphysicians received additional training to perform the services. Altogether, these three types of skin surgeries represent more than 9,000 surgeries that nonphysicians performed on Medicare beneficiaries in the first 3 months of 2007.
Unqualified nonphysicians performed 31 percent of the noninvasive services that physicians did not perform Among the categories of services (e.g., E&M, ophthalmology), the percent of services performed by unqualified nonphysicians ranged from 15 percent to 49 percent. (See Table 3 on the following page.) The unqualified nonphysicians who performed invasive services fall into four categories:
1. Nonphysicians who did not possess appropriate licenses or certification performed 56 percent of the services.
2. For 23 percent of the services, physicians did not submit documentation to confirm that the nonphysicians’ qualifications were valid.
3. Nonphysicians who lacked the necessary training performed 20 percent of the services.
4. One percent of the services did not meet the “incident to” requirement because they were initial patient visits.
O E I - 0 9 - 0 6 - 0 0 4 3 0 N O N P H Y S I C I A N S W H O P E R F O R M E D M E D I C A R E P H Y S I C I A N S E R V I C E S
28 For a list of all surgeries that are included in these categories, see AMA, “Current Procedural Terminology, Professional Edition,” 2007, pp. 58–63.
15
F I N D I N G S
TABLE 3 Categories of Services That
Medicare Allowed Physicians That
Were Performed by Qualified Versus
Unqualified Nonphysicians
Percentage of Services Performed by Nonphysicians: Total, Qualified, and Unqualified
Service Category
Nonphysicians
Total Qualified Unqualified
Invasive
Noninvasive
-E&M
-Ophthalmology
-Rehabilitation Therapy
-Cardiovascular
-Diagnostic Radiology
-Other Noninvasive
62%
46%
19%
33%
87%
48%
40%
53%
93%
69%
74%
63%
51%
85%
84%
84%
7%
31%
26%
37%
49%
15%
16%
16%
Total 51% 79% 21% Source: OIG document review results, 2008.
Unqualified nonphysicians performed 26 percent of the E&M services that physicians did not perform. These nonphysicians performed office visits, inpatient services, consultations, and home visits. Office visits represent 74 percent of all E&M services performed by unqualified nonphysicians. Inpatient services, consultations, and home visits represent 8 percent, 13 percent, and 5 percent, respectively.
Unqualified nonphysicians performed 37 percent of the ophthalmology services that physicians did not perform. These nonphysicians performed eye examinations, diagnostic imaging, eye photography, and ophthalmoscopy. Diagnostic imaging represents 47 percent of the ophthalmology services performed by unqualified nonphysicians. Eye examinations represent 35 percent of all ophthalmology services performed by unqualified nonphysicians. The remaining 18 percent of services were eye photography and ophthalmoscopy services.
Unqualified nonphysicians performed 49 percent of the rehabilitation therapy services that physicians did not perform. These nonphysicians performed therapeutic exercises, massage therapy, ultrasound therapy, therapeutic activities, and electrical stimulation. These five modalities represent 75 percent of all rehabilitation therapy modalities performed
O E I - 0 9 - 0 6 - 0 0 4 3 0 N O N P H Y S I C I A N S W H O P E R F O R M E D M E D I C A R E P H Y S I C I A N S E R V I C E S 16
F I N D I N G S
by unqualified nonphysicians. Other rehabilitation therapy services performed by unqualified nonphysicians include neuromuscular reeducation, manual therapy, and evaluations.
Generally, State laws allow only physicians and licensed physical therapists, occupational therapists, or speech-language pathologists and licensed assistants to perform rehabilitation therapy. However, when a physician bills the services as “incident to,” Medicare allows unlicensed nonphysicians to perform rehabilitation therapy if the service and the person who furnishes the service meet the standards and conditions that apply to physical therapy and physical therapists, except that a license to practice physical therapy in the State is not required.29 One nonphysician in our sample met this criterion. In addition to this nonphysician, massage therapists, medical assistants, and physical therapist assistants performed rehabilitation therapy services.
O E I - 0 9 - 0 6 - 0 0 4 3 0 N O N P H Y S I C I A N S W H O P E R F O R M E D M E D I C A R E P H Y S I C I A N S E R V I C E S
29 42 CFR § 410.60(a)(3)(iii).
17
R E C O M M E N D A T I O N S Δ
Services performed by unqualified nonphysicians represent a risk to Medicare beneficiaries. State laws that require training, certification, and licensure of nonphysicians help to ensure that patients receive safe and quality care. However, among the physicians who billed Medicare for more than 24 hours of services in a day, nonphysicians performed half of the services billed, and unqualified nonphysicians performed one in every five services not performed by a physician. These nonphysicians were not practicing pursuant to State laws, State regulations, or Medicare regulations; had no verifiable credentials; and/or had not received the appropriate training to perform the services (according to our reviewers’ professional judgment).
We are concerned about the potential scale of this problem. We cannot report the extent to which all physicians who bill Medicare bill for services performed by unqualified nonphysicians because our sample included only those physicians who billed for more than 24 hours of services in a day. The sample was a proxy for physicians who billed “incident to.” Medicare claims data do not identify “incident to” services as such. However, we have no reason to believe that the issues identified in this review are unique to these physicians. For example, physicians who bill Medicare for fewer than 24 hours of services in a day might also bill for “incident to” services performed by unqualified nonphysicians. Although our sample represents relatively few physicians (3,165 of the 805,401 physicians who billed Medicare in the first 3 months of 2007), the potential exists that this problem is more widespread than we can report at this time.
Therefore, we recommend that CMS:
1. Seek revisions to the “incident to” rule. The rule should require that physicians who do not personally perform the services they bill to Medicare ensure that no persons except:
a. licensed physicians personally perform the services or
b. nonphysicians who have the necessary training, certification, and/or licensure, pursuant to State laws, State regulations, and Medicare regulations personally perform the services under the direct supervision of a licensed physician.
2. Require physicians who bill services to Medicare that they do not personally perform to identify the services on their Medicare
O E I - 0 9 - 0 6 - 0 0 4 3 0 N O N P H Y S I C I A N S W H O P E R F O R M E D M E D I C A R E P H Y S I C I A N S E R V I C E S 18
E X E C U T I V E S U M M A R Y
claims by using a service code modifier. The modifier would allow CMS to monitor claims to ensure that physicians are billing for services performed by nonphysicians with appropriate qualifications.
3. Take appropriate action to address the claims for services that we detected that:
a. were billed by physicians and performed by nonphysicians that were, by definition, not “incident to” services and
b. were for rehabilitation therapy services performed by nonphysicians who did not have the training of a therapist.
AGENCY COMMENTS AND OFFICE OF INSPECTOR GENERAL RESPONSE CMS concurred with two of our three recommendations. For the full text of CMS’s comments, see Appendix F.
CMS did not concur with our recommendation to create a service code modifier to identify physicians’ claims for services that physicians do not personally perform. CMS stated that “incidental services are often shared by physicians and staff, making definition of a service not “personally performed” operationally difficult.” However, CMS stated it agrees with our “underlying objective of increasing the available data on services provided “incident to.”
We continue to believe that CMS should have the ability to identify and monitor physicians’ claims for services that physicians bill, but do not personally perform. This review identified unqualified nonphysicians who furnished services to Medicare beneficiaries. We believe that the lack of a service code modifier to identify physicians’ “incident to” claims represents a significant vulnerability to the Medicare program. CMS stated it would study the operational issues involved in implementing the recommendation. We look forward to learning the specific steps CMS plans to take with respect to this issue.
CMS provided technical comments in addition to its response to our recommendations. If appropriate, we incorporated the technical comments into the final report.
O E I - 0 9 - 0 6 - 0 0 4 3 0 N O N P H Y S I C I A N S W H O P E R F O R M E D M E D I C A R E P H Y S I C I A N S E R V I C E S 19
A P P E N D I X ~ AΔ
Detailed Methodology Using Part B Medicare National Claims History (NCH) data for the first quarter of 2007, we identified all days during which Medicare allowed services for physicians30 in a single day that exceeded 24 hours of physician worktime. We randomly selected 250 of these “physician-day” combinations and requested that the physicians identify who performed each service that Medicare allowed on the selected day(s). We asked the physicians to submit all relevant credentials for the nonphysicians whom they identified. Our contractor’s nurse-reviewers determined whether the nonphysicians had all the training, certifications, and licenses as required by State laws, State regulations, and/or Medicare regulations to perform the services billed. The following is a summary of our methodology.
Sample Sample definition. From NCH data for services rendered January through March 2007, we created a population of “physician-days.” We defined a “physician-day” as a single day (24 hours), per physician, wherein Medicare allowed services that apparently exceeded 24 hours of physician worktime.31 Our method to select “physician-days” was as follows:
1. We extracted from the NCH all physician claims that Medicare allowed (excluding claims billed by all groups, institutions, or suppliers) in the first quarter of 2007.
2. Using the 2007 Medicare Physician Fee Schedule, we assigned the “intra-time” (physician time) component to each line-item claim.
3. We calculated the total time per physician, per day for each day that Medicare allowed claims for services (excluding pathology/laboratory services and major surgeries).32
30 We excluded claims from doctors of dental surgery, podiatrists, optometrists, and chiropractors.
31 We used the Medicare Physician Fee Schedule, which lists the average time associated with each service that physicians can bill to Medicare. The fee schedule is available online at http://www.cms.hhs.gov/PhysicianFeeSched/01_Overview.asp#TopOfPage. Accessed on June 9, 2008.
32 Prior to our pretest of the review protocol (page 22), we excluded pathology and laboratory services. Following the pretest, we concluded that physicians were unlikely to bill major surgery services to Medicare as “incident to” services. The physicians in our pretest who performed major surgery billed few or no “incident to” services.
O E I - 0 9 - 0 6 - 0 0 4 3 0 N O N P H Y S I C I A N S W H O P E R F O R M E D M E D I C A R E P H Y S I C I A N S E R V I C E S 20
4. We created a database that included one observation for each unique combination of physician and day (“physician-day”) during which the physician’s total intra-time (the physician’s personal time) was equal to or exceeded 24 hours.
5. We selected a stratified random sample33 of 250 “physician-days.”
6. We created a database of all claims Medicare allowed for the physicians on the “physician-days.”
Sample population. In the first quarter of 2007, Medicare allowed claims for services from 3,165 physicians for a total of 18,403 “physician-days.” Medicare allowed $204,415,178 for these physicians’ claims. We selected our sample from this population. These 3,165 physicians are 0.4 percent of the 805,401 physicians who submitted Medicare claims for services in the first 3 months of 2007.
Final sample. Our sample of 250 “physician-days” included 30,822 line-item claims for services that Medicare allowed for 221 physicians. Because our sample unit was the unique combination of physician and day, some physicians had more than 1 day of services in our sample. (See Table 4 on the following page.) Four of the two-hundred twenty-one physicians in our sample were part of an active Office of Inspector General (OIG) investigation, so we removed them from the final sample. Fifteen physicians did not respond to our request for information prior to the deadline, and we removed them from the sample.34 Therefore, our final review sample consisted of 27,379 line-item claims allowed by Medicare for 202 physicians on 228 “physician-days.”
33 Stratum 1 consisted of “physician-days” for which Medicare allowed a total of $10,000 or more for claims on the day. Stratum 2 consisted of “physician-days” for which Medicare allowed a total of less than $10,000 for claims on the day. We selected 125 “physician-days” from each stratum. Stratifying the sample in this way increased our precision when we projected some statistics to the population, such as Medicare allowed amounts.
34 Our review of these physicians’ reasons for not complying with our information request is ongoing. We will take appropriate action that may include referring the physicians to the Centers for Medicare & Medicaid Services or to OIG’s Office of Investigations.
O E I - 0 9 - 0 6 - 0 0 4 3 0 N O N P H Y S I C I A N S W H O P E R F O R M E D M E D I C A R E P H Y S I C I A N S E R V I C E S 21
A P P E N D I X ~ A
Table 4 Days When Medicare
Allowed the Physician More Than
24 Hours in Services
Sample of “Physician-Days” for First Quarter of 2007
“Physician-Days” (Per Physician) Total Physicians Total “Physician-Days”
1
2
3
4
Selected Sample
Physicians Under Investigation Removed
Final Sample
Non-Respondents Removed
Final Review Sample
197
20
3
1
221
4
217
15
202
197
40
9
4
250
4
246
18
228
Source: OIG analysis of 2007 Medicare NCH data, 2008.
Review Protocol Data collection. We requested that each sampled physician logon to our secure Web site and list who personally furnished each of the services that Medicare allowed on the sampled day(s). We asked the physicians to list all relevant licenses, certifications, and training (relevant to the service performed by the nonphysician) for each nonphysician whom they reported as personally having performed the sampled services.
We requested that the physicians mail to us documentation to support the information that they provided on the Web site. Our Web site allowed the physicians to print and sign attestation forms, attesting to the accuracy and completeness of the information they provided us via the Web site. We requested copies of all licenses, certifications, diplomas, and proof of training for each nonphysician. We requested copies of the physicians’ schedules of patient appointments and nonphysician hours for the sampled day(s).
O E I - 0 9 - 0 6 - 0 0 4 3 0 N O N P H Y S I C I A N S W H O P E R F O R M E D M E D I C A R E P H Y S I C I A N S E R V I C E S 22
A P P E N D I X ~ A
Nonphysician-appropriateness determinations. We provided the information submitted by the physicians to our contractor. Registered nurses served as the reviewers and determined whether the qualifications of the nonphysicians who performed the sampled services were appropriate vis-à-vis the services that the nonphysicians performed.
Nonphysicians in 29 States performed Medicare services for the physicians in our sample. The nonphysicians included technicians, nurses, licensed or certified assistants, and therapists. In addition, some nonphysicians in our sample were not licensed or certified but instead had received other formal medical training, on-the-job training, or no formal medical training at all.
In addition to Medicare regulation,35 the reviewers based their decisions on State laws and regulations. For each State, the reviewers researched the State laws and regulations applicable to each nonphysician in our sample who performed services in that State. For the services performed by nonphysicians that are not addressed by State laws and regulations, the reviewers researched the training that the nonphysicians received and used their professional judgment to determine whether the training addressed the nonphysician’s competency to perform the service.
The reviewers deemed a nonphysician’s qualifications appropriate if the nonphysician who performed the services had all the training, certifications, and licenses, required by State laws, State regulations, and/or Medicare regulations. The reviewers deemed the nonphysician’s qualifications inappropriate if:
• the nonphysician performed the service without the licenses, certifications, or training required by Medicare regulation;36
• the nonphysician performed the service outside of his or her profession’s scope of practice as defined by State laws and/or regulations and additional training that the nonphysician attended
35 The “incident to” rule allows physicians to bill for services performed by any personnel (licensed or unlicensed). However, when a physician bills rehabilitation therapy services as “incident to,” Medicare requires that unlicensed nonphysicians who perform the services have received the training of a licensed therapist (42 CFR § 410.60(a)(3)(iii)). In addition, the “incident to” rule requires the physician to personally perform the initial service. Initial services billed by physicians but performed by nonphysicians are not “incident to” services (42 CFR § 410.26(b)).
36 42 CFR §§ 410.60(a)(3)(iii), 410.26(b)).
O E I - 0 9 - 0 6 - 0 0 4 3 0 N O N P H Y S I C I A N S W H O P E R F O R M E D M E D I C A R E P H Y S I C I A N S E R V I C E S 23
A P P E N D I X ~ A
did not address the nonphysician’s competency to perform the service; and/or
• the physician did not provide adequate documentation to confirm that the nonphysician’s credentials were valid.
Adverse actions. We determined whether the physicians in our sample and the nonphysicians who personally furnished the sampled services had been reprimanded (e.g., suspended license, revoked license, or official reprimand) by a State licensing agency and/or had been excluded from Federal health care programs. We researched each physician and nonphysician using the Healthcare Integrity and Protection Data Bank and OIG’s Exclusions Database. We focused on the physicians’ and nonphysicians’ status on the date during which they furnished the sampled services. However, we reviewed all entries for the physicians and nonphysicians in both databases, regardless of the dates of the adverse action. To the extent that they are listed in either of these two databases, we noted all criminal convictions.
No physicians or nonphysicians in our sample had active adverse actions that would have precluded them from providing the sampled services. No physicians or nonphysicians in our sample were excluded from Federal health care programs on the dates of service we reviewed.
Patient and nonphysician schedules. We requested that the physicians submit their patient and nonphysician-staff schedules on the sampled date(s) of service. We reviewed these schedules to determine how many patients and staff the physicians had scheduled on the same day.
Analysis. We stored the information that we gathered from our secure Web site in a database. The reviewers input their review decisions into the same database. Using SAS software, we converted the database into SAS-format datasets and reviewed the data for completeness and logic. We analyzed the data using SAS. Finally, we used SUDAAN software to produce confidence intervals for the projectable statistics.
Projectable statistics. All statistics in the findings section of this report are projections to the total population of “physician-days” in the first 3 months of 2007. Appendix B includes the confidence intervals for selected statistics. Appendix C describes features of the sample that we did not project to the population and, therefore, these features should not be extrapolated to any population other than the 202 physicians and 27,379 line-item claims for the sampled services.
O E I - 0 9 - 0 6 - 0 0 4 3 0 N O N P H Y S I C I A N S W H O P E R F O R M E D M E D I C A R E P H Y S I C I A N S E R V I C E S 24
A P P E N D I X ~ A
Limitations. The findings in this report about the physicians, nonphysicians, and the services that they performed are confined within the context of “physician-days” (the unique combination of physician and day in the first 3 months of 2007 during which Medicare allowed services for the physician who apparently exceeded 24 hours of physician worktime). We used “physician-days” to create a population of Medicare “incident to” services.
Therefore, our findings are limited to the physician population for whom Medicare allowed services on “physician-days” in the first quarter of 2007. The findings in this report should not be projected to all physicians for whom Medicare allows services. Nor should our findings be projected to all nonphysicians who perform services under the auspices of physicians for whom Medicare allowed claims.
O E I - 0 9 - 0 6 - 0 0 4 3 0 N O N P H Y S I C I A N S W H O P E R F O R M E D M E D I C A R E P H Y S I C I A N S E R V I C E S 25
A P P E N D I X ~ BΔ
Confidence Intervals
Statistic Point Estimate 95-Percent
Confidence Interval
Physicians personally performed 49 percent of the Medicare services that they were
allowed in the first quarter of 2007 49% 43% to 54%
Medicare allowed $105 million for services that the physicians personally performed $104,822,245 $91,570,910 to $118,073,580
Medicare allowed approximately 934,000 services that the physicians personally performed 934,388 821,075 to 104,7702
Medicare allowed $85 million for services that the nonphysicians personally performed $84,593,424 $62,110,148 to $107,076,700
Medicare allowed approximately 990,000 services that the nonphysicians personally
performed 990,457 835,268 to 1,145,646
Nonphysicians performed almost two-thirds of the invasive services that Medicare allowed
the physicians 62% 52% to 72%
Nonphysicians performed almost half of the noninvasive services 46% 40% to 52%
Nonphysicians with inappropriate qualifications performed 21 percent of the services that
physicians did not perform 21% 15% to 27%
In the first 3 months of 2007, Medicare allowed $12.6 million performed by nonphysicians
with inappropriate qualifications $12,561,845 $8,768,913 to $ 16,354,777
In the first 3 months of 2007, Medicare allowed approximately 210,000 services performed
by nonphysicians with inappropriate qualifications 209,773 146,337 to 273,210
Nonphysicians with inappropriate qualifications performed 7 percent of the invasive services
that physicians did not perform 7% 4% to 11%
Nonphysicians with inappropriate qualifications performed 31 percent of the noninvasive
services that physicians did not perform 31% 23% to 39%
Reason the Qualifications Were Inappropriate
Did not possess the required licenses and/or certifications
No verifiable qualifications
Lacked training necessary for the service
“Incident to” violations
49%
25%
25%
1%
34% to 64%
14% to 36%
14% to 35%
0.1% to 2%
Source: Office of Inspector General analysis of 2007 Medicare National Claims History data and document review results, 2008.
O E I - 0 9 - 0 6 - 0 0 4 3 0 N O N P H Y S I C I A N S W H O P E R F O R M E D M E D I C A R E P H Y S I C I A N S E R V I C E S 26
A P P E N D I X ~ CΔ
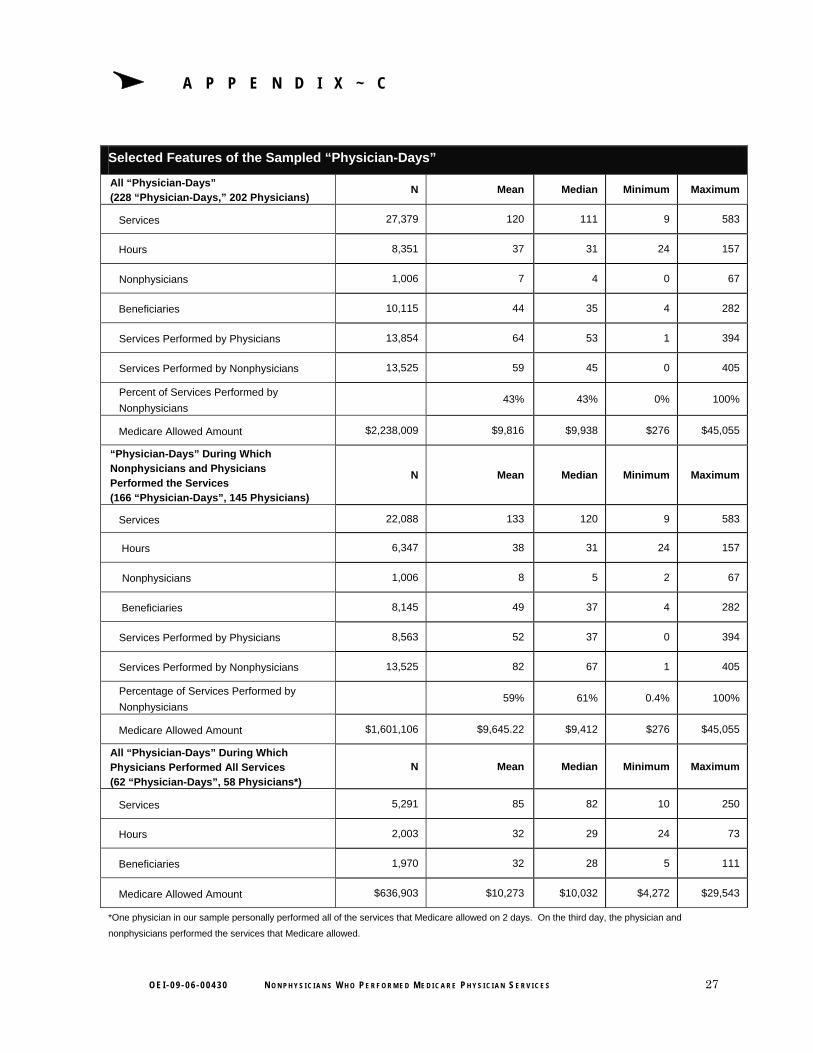
Selected Features of the Sampled “Physician-Days”
All “Physician-Days” (228 “Physician-Days,” 202 Physicians)
N Mean Median Minimum Maximum
Services 27,379 120 111 9 583
Hours 8,351 37 31 24 157
Nonphysicians 1,006 7 4 0 67
Beneficiaries 10,115 44 35 4 282
Services Performed by Physicians 13,854 64 53 1 394
Services Performed by Nonphysicians 13,525 59 45 0 405
-Physical and Occupational Therapy Evaluations 1% 19% 81%
-Other Services 26% 22% 78%
-Cardiovascular 10% 52% 48%
-Diagnostic Radiology 6% 60% 40%
-Other Noninvasive 23% 47% 53%
Total 100% 49% 51% Source: Office of Inspector General analysis of 2007 Medicare National Claims History data and document review results, 2008. *Row does not total 100 percent because of rounding.
O E I - 0 9 - 0 6 - 0 0 4 3 0 N O N P H Y S I C I A N S W H O P E R F O R M E D M E D I C A R E P H Y S I C I A N S E R V I C E S 29
A P P E N D I X ~ A A P P E N D I X ~ A
A P P E N D I X ~ EΔ
Services Performed by Nonphysicians by Service Category and Nonphysician Qualifications
Formal Medical Training* No Formal Medical Training
Service Category Technicians Nurses
Licensed or Certified
Assistants Therapists
Other Medical
Training On-The-Job
Training No Relevant
Qualifications**
Invasive 40% 30% 15% <1% <1% 11% 4%
Noninvasive 39% 8% 17% 25% 2% 2% 9%
-Evaluation and Management 10% 46% 39% 2% <1% 3% <1%
-Ophthalmology 43% <1% 15% 0% 5% <1% 35%
-Rehabilitation Therapy 14% 4% 21% 62% 0% 0% 2%
-Cardiovascular 61% 11% 15% 2% 5% 4% 6%
-Diagnostic Radiology 87% 0% 8% 0% 3% 0% 2%
-Other Noninvasive 62% 5% 6% 13% 1% 5% 9%
Total 39% 17% 16% 15% 1% 6% 7% *Technicians include phlebotomists and medical sonographers. Nurses include registered nurses and nurse practitioners. Licensed or certified assistants
include physician assistants and medical assistants. Therapists include physical therapists or massage therapists. Nonphysicians with other medical training
include paramedics.
**Includes nonphysicians for whom physicians did not submit documentation to confirm their qualifications.
Rows do not total 100 percent because of rounding and/or some services were performed by two nonphysicians simultaneously.
Source: Office of Inspector General analysis of 2007 Medicare National Claims History data and document review results, 2008.
O E I - 0 9 - 0 6 - 0 0 4 3 0 N O N P H Y S I C I A N S W H O P E R F O R M E D M E D I C A R E P H Y S I C I A N S E R V I C E S 30
A P PEN 0 Fx
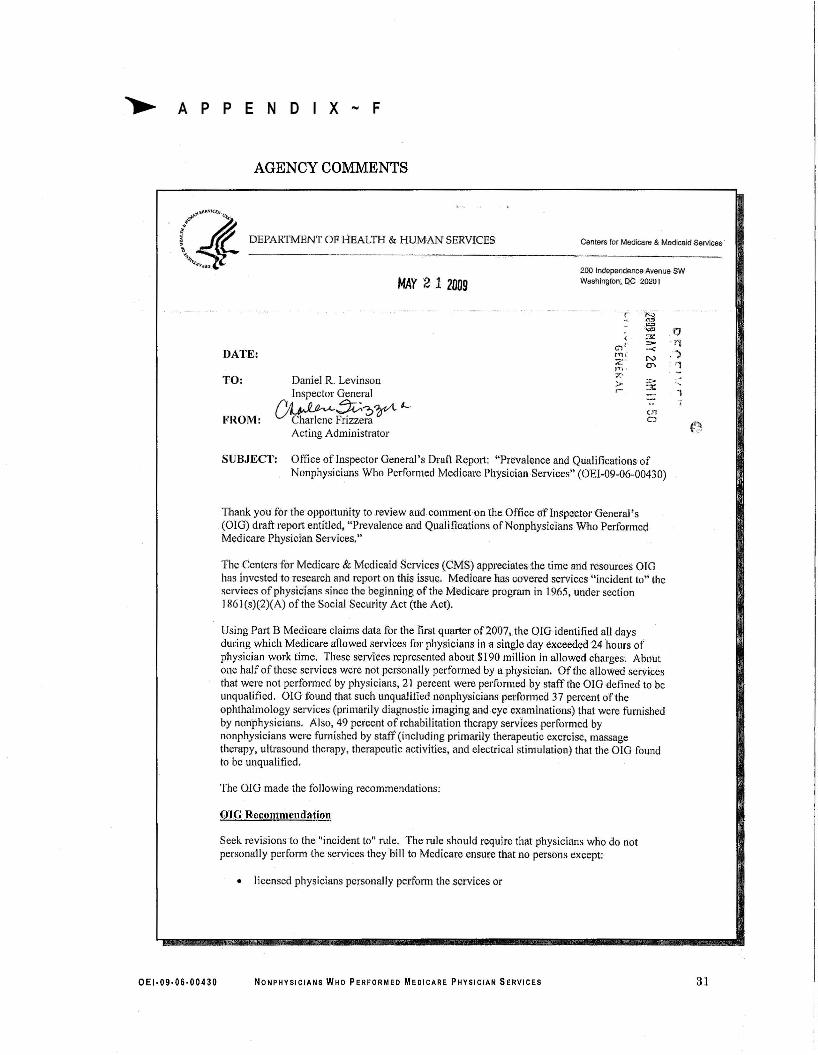
AGENCY COMMENTS
.sI"'",s\tItVlCf'.r0t<t,
( tit. DEPARTMENT OF HEALTH & HUMAN SERVICES
:5~MAY '21 2009
Centers for Medicare & Medicaid Services
200 IndependencaAvenue SWWashington; PC 20201
DATE:
TO:
FROM:
Daniel R. LevinsonInspector General
~X~t-Charlene Frizze~Acting Administrator
(' ~("~co;>.~
'0( :'X
'1"1C'l"~."",
.")rll(N-......~
~- C!" '1,.,)-.,:.;.- ':0:'3
,- :7' "....(!1C:}
f~
SUBJECT: Office of Inspector General's Draft Report: "Prevalence and Qualifications ofNonphysicians Who Performed Medicare Physician Serviccs" (OEI-09-06-00430)
Thank you for the opportunity to review and commenlon the Office oflnspector General's(OIG) draft report entitled, "Prevalence and Quaiificatlons'ofNonphysiGians Who PerformedMedicare Physician Services."
The Centers foJ' Medicare & Medicaid Services CCMS)appreciatesihe tlmeartd resour.ees OIGhas invested to' research and report on this issue. Medlcarehas covered services "incident to" theservices of physicians sinc-e the beginning of the Medicare program in 1965, under section186 I(s)(2)(A) of the Social Security Act (the Acf).
Using Part B Medicare claims data for the first quarter of2007, the OIG identifi,ed all di\ysduring which Medicare allowed services for physioians in a single day exceeded 24hol\l's ofphysician work time. These seJyices represented about $190 million in allowed charges. Aboutone half of these services were not personally performed by a physiDian. Of the allowed serVicesthat were not performed by physicians, 21 percent were performed by staff the OIG detined tobeunqualified. orG found that such unqualified nonphysicia.ns performed 37 percent of theophthalmology sei"Vices (primarily diagnostic imaging and eye examinations)that were furnishedby nonphysicians. Also, 49 percent of rehabilitation therapy services performed bynonphysicians were furnished by staff (including primarily therapeutic exercise, massagetherapy, ultrasound therapy, therapeutic activities, and electrical stimulation) thatthe OlG foundto be unqualified.
The OlG made the following recommendations:
om Recommendation
Seek revisions to the "incident to" rule. The nile should require that physicians who do notpersonally perform the.services they bill to Medicare ensure that no persons except:
• licensed physicians personally perform the services or
oE1·09·0 6·0 0430 NONPHYSICIANS WHO PERFORMED MEDICARE PHYSICIAN SERVICES 31
Page 2 - Daniel R. Levinson
• nonphysicians who have the necessary training, certification, andfor licensun:, pursuantto State laws, State regulations. and Medicare regulations personally perform the servicesunder the direct supervision of a licensed physician.
CMS Response
We concur with the recommendation. CMS is currently in the process of clarifying the manualpolicies relative to services incident to physicians' services. We will provide improved guidancefor documenting the qualifications of the person performing services billed to Medicare byphysicians and those nonphysician practitioners who may bill services "incident to" theirservices.
OIG Recommendation
Require physicians who bill for services that they do not personally perform to identify theservices on their Medicare claims by using a service code modifier. The modifier would allowCMS to monitor claims to ensure that physicians are billing for services performed bynonphysicians with appropriate qualifications.
CMS Response
We non-concur with this recommendation as it is currently structurcd, not because we disagreewith its undcrlying objectivc of increasing the available data on services provided "incident to".but because incidental services are ollcn shared by physicians and staff, making definition of aservice not "personally pCrfOffiled" operationally difficult. CMS will study the operationalissues involved in adding code modifiers to services furnished exclusively by stafT other than thephysician identified as the rendering provider.
OIG Recommendation
Take appropriate action to address the claims that we detected that were bilkd by pbysicians:a. and performed by nonphysieians who were, by definition, nOI "incident to" services andb. for rehabilitation therapy services performed by nonphysieians who did not have the tminingof a therapist.
CMS Response
We concur with tbis recommendation. eMS will sbare tbc OIG report and any additional claiminfonTlation received from the OIG with the Medicare AdminiSlnllive Contractors (MACs).CMS will instruct the MACs to consider the issues identified in this report and the additionalclaim information when prioritizing their medical review strategies or other interventions.
Thank you again for the opportunity to review tbis report. We appreciate tbe OIG's efforts onthis study and look forward to working with them on other issues in the futllre.
A P PA P P EE NN DD II XX ~~ FF
O E I - 0 9 - 0 6 - 0 0 4 3 0 N O N P H Y S I C I A N S W H O P E R F O R M E D M E D I C A R E P H Y S I C I A N S E R V I C E S 32
A P P E N D I X ~ F
A C K N O W L E D G M E N T SΔ
This report was prepared under the direction of Timothy S. Brady, Regional Inspector General for Evaluation and Inspections in the San Francisco regional office, and Deborah W. Harvey, Deputy Regional Inspector General.
Steven Zerebecki served as the team leader for this study. Other principal Office of Evaluation and Inspections staff from the
San Francisco regional office who contributed to the report include Veronica Gonzalez, Scott Hutchison, and Marcia Wong; central office staff who contributed include Robert Gibbons, Doris Jackson, and Rita Wurm.
O E I - 0 9 - 0 6 - 0 0 4 3 0 N O N P H Y S I C I A N S W H O P E R F O R M E D M E D I C A R E P H Y S I C I A N S E R V I C E S 33