FUNDAMENTALS ™ September 2015 United States and Canada Hewes Communications + 1 (212) 207-9450 [email protected]Europe JPES Partners (London) +44 (0) 20 7520 7620 [email protected]Media Contacts Chris Brightman, CFA Momentum investors are like the surfers we watch from beaches along the Pacific coast. Both must catch a wave. Both attempt to ride it as it breaks. But the ability to glide away smoothly before being caught inside the inevitable crash(ing wave) that follows is what determines success. Momentum, one of a handful of equity factors that empirically displays robust equity returns, has recently become popular as investors explore factor investing. In the passive realm, investors are increasingly seeking to replicate cheap and transparent indices. But does index replication make sense in the case of momentum? We believe a momentum strategy implemented through an index-based approach has serious limitations. And although some active managers are quite adept at riding the momentum wave, it does require significant experience and skill. Our view is that momentum as an index replication strategy can be very dangerous, but incorporating it into an active value strategy is an opportune way to exploit its insights. Catching the Wave The investment industry borrowed the term “momentum” from the physical sciences. In physics, momentum is defined as mass (such as ocean water) in motion. When used in the sense of investing, momentum refers to movement in stock prices. Several explanations exist for the energy that creates the prolonged movement of stock prices higher or lower. The most convinc- ing explanation in our view is that investors initially underreact to earnings surprises. Chordia and Shivakumar (2006) and Novy- Marx (2015) have shown that earnings momentum explains most of the momen- tum effect. Investors are at first slow to react to an unexpected uptick or downtick in earn- ings. But when the next earnings data are reported and they confirm the prior report, investors register the potential importance of the change in trend. If earnings are higher than expected, the momentum in price is upward. Subsequent confirming earnings releases may even cause euphoria and over-extrapolation of future earnings fore- casts, reinforcing the fast-moving upward trajectory. The momentum investor benefits as the price reacts to subsequent earnings announcements and moves higher. Price momentum can also move in the opposite direction—down—with correspondingly negative outcomes for investors. We will discuss this “fly in the sunscreen” in the next section. Investors have good reason to want to catch the momentum wave. History shows that stocks with above-average performance in the prior year have tended to persist in producing short-term excess returns. This tendency is one of the strongest empirical regularities in finance and has been docu- mented across geogr aphies and asset clas ses. How NOT to Wipe Out with Momentum Chris Brightman, CF A, Vitali Kalesnik, Ph.D., and Engin Kose, Ph.D. KEY POINTS 1. Implementation costs and front running make an index replica- tion strategy inadvisable as a means to capture the momen- tum premium. 2. The pros (proven profitability and robustness) of momentum can swiftly be wiped out by the cons (crashes and crowded trades), making an active imple- mentation dangerous for all but the most skilled managers. 3. Combining value and momen- tum in order to exploit their typically negative correlation in stock holdings and alpha can improve a portfolio’s Sharpe ratio over those of either strat- egy alone. A momentum strategy implemented through an index- based approach has serious limitations.
Catching the WaveThe investment industry borrowed the term
“momentum” from the physical sciences.
In physics, momentum is defined as mass
(such as ocean water) in motion. When
used in the sense of investing, momentum
refers to movement in stock prices.
Several explanations exist for the energy tha
creates the prolonged movement of stoc
prices higher or lower. The most convinc
ing explanation in our view is that investor
initially underreact to earnings surprise
Chordia and Shivakumar (2006) and Novy
Marx (2015) have shown that earning
momentum explains most of the momen
tum effect. Investors are at first slow to reac
to an unexpected uptick or downtick in earn
ings. But when the next earnings data ar
reported and they confirm the prior repor
investors register the potential importanc
of the change in trend. If earnings are highe
than expected, the momentum in price
upward. Subsequent confirming earning
releases may even cause euphoria an
over-extrapolation of future earnings fore
casts, reinforcing the fast-moving upwar
trajectory. The momentum investor benefit
as the price reacts to subsequent earning
announcements and moves higher. Pric
momentum can also move in the opposit
direction—down—with corresponding
negative outcomes for investors. We w
discuss this “fly in the sunscreen” in the nex
section.
Investors have good reason to want to catc
the momentum wave. History shows tha
stocks with above-average performanc
in the prior year have tended to persist i
producing short-term excess returns. Th
tendency is one of the strongest empiric
regularities in finance and has been docu
mented across geographies and asset classe
How NOT to Wipe Out with MomentumChris Brightman, CFA, Vitali Kalesnik, Ph.D., and Engin Kose, Ph.D.
KEY POINTS1. Implementation costs and front
running make an index replica-tion strategy inadvisable as ameans to capture the momen-tum premium.
2. The pros (proven profitabilityand robustness) of momentumcan swiftly be wiped out by thecons (crashes and crowdedtrades), making an active imple-mentation dangerous for all butthe most skilled managers.
3. Combining value and momen-tum in order to exploit theirtypically negative correlationin stock holdings and alpha canimprove a portfolio’s Sharperatio over those of either strat-egy alone.
620 Newport Center Drive, Suite 900 | Newport Beach, CA 92660 | + 1 (949) 325 - 8700 | www.researchaffiliates.com
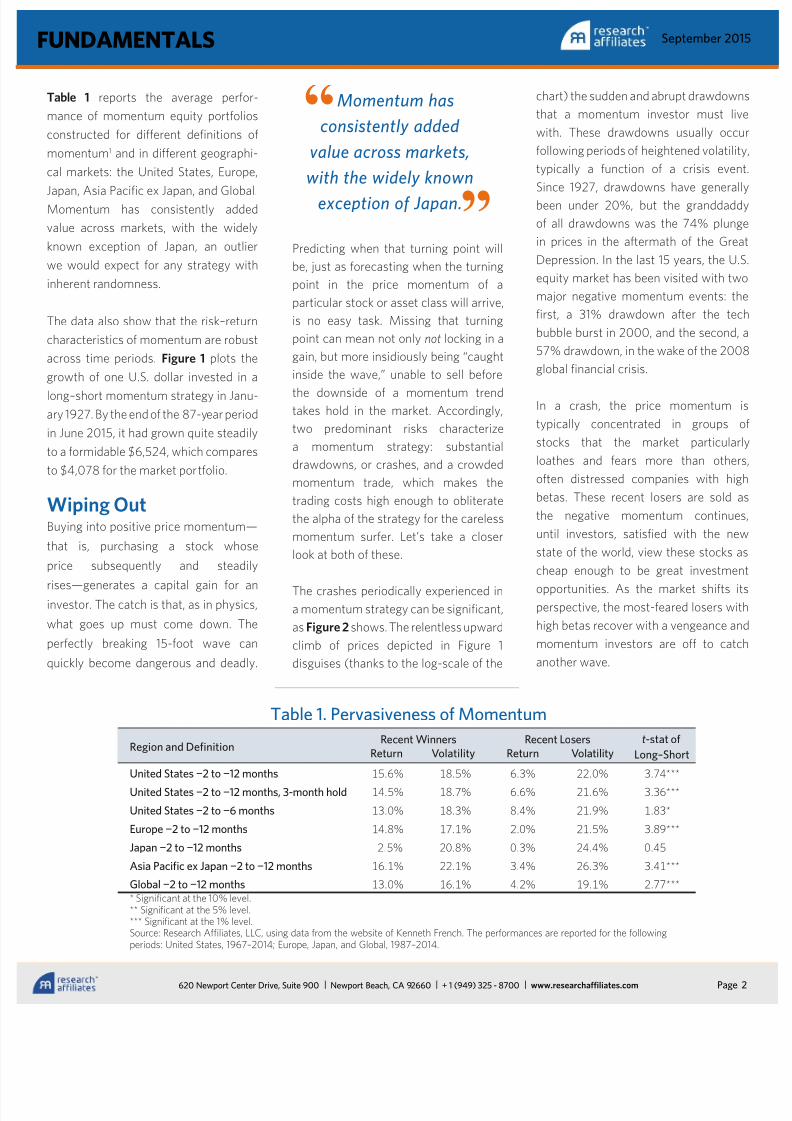
Table 1 reports the average perfor-
mance of momentum equity portfolios
constructed for different definitions of
momentum1 and in different geographi-
cal markets: the United States, Europe,
Japan, Asia Pacific ex Japan, and Global.Momentum has consistently added
value across markets, with the widely
known exception of Japan, an outlier
we would expect for any strategy with
inherent randomness.
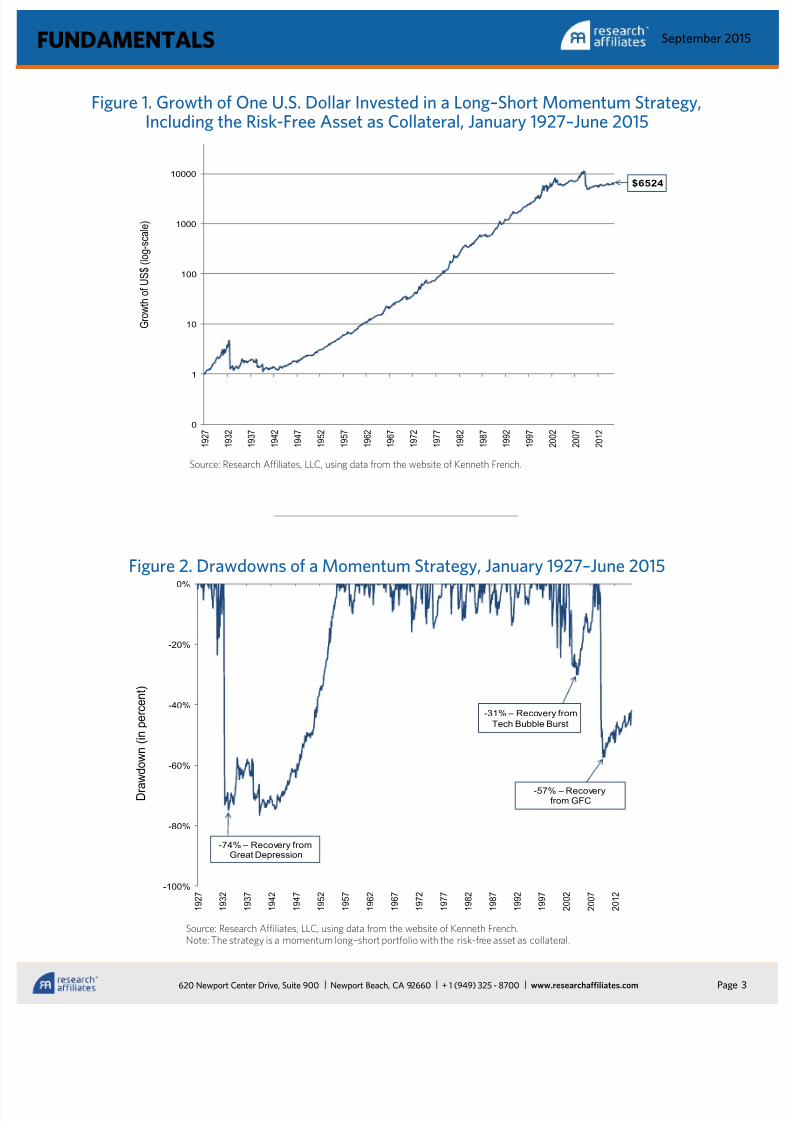
The data also show that the risk–return
characteristics of momentum are robust
across time periods. Figure 1 plots the
growth of one U.S. dollar invested in a
long–short momentum strategy in Janu-
ary 1927. By the end of the 87-year period
in June 2015, it had grown quite steadily
to a formidable $6,524, which compares
to $4,078 for the market portfolio.
Wiping OutBuying into positive price momentum—
that is, purchasing a stock whose
price subsequently and steadily
rises—generates a capital gain for aninvestor. The catch is that, as in physics,
what goes up must come down. The
perfectly breaking 15-foot wave can
quickly become dangerous and deadly.
chart) the sudden and abrupt drawdown
that a momentum investor must liv
with. These drawdowns usually occu
following periods of heightened volatilit
typically a function of a crisis even
Since 1927, drawdowns have general
been under 20%, but the granddadd
of all drawdowns was the 74% plung
in prices in the aftermath of the Grea
Depression. In the last 15 years, the U.
equity market has been visited with tw
major negative momentum events: th
first, a 31% drawdown after the tec
bubble burst in 2000, and the second,
57% drawdown, in the wake of the 200
global financial crisis.
In a crash, the price momentum
typically concentrated in groups o
stocks that the market particular
loathes and fears more than other
often distressed companies with hig
betas. These recent losers are sold a
the negative momentum continue
until investors, satisfied with the ne
state of the world, view these stocks a
cheap enough to be great investmen
opportunities. As the market shifts itperspective, the most-feared losers wit
high betas recover with a vengeance an
momentum investors are off to catc
another wave.
Predicting when that turning point will
be, just as forecasting when the turning
point in the price momentum of a
particular stock or asset class will arrive,
is no easy task. Missing that turning
point can mean not only not locking in a
gain, but more insidiously being “caught
inside the wave,” unable to sell before
the downside of a momentum trendtakes hold in the market. Accordingly,
two predominant risks characterize
a momentum strategy: substantial
drawdowns, or crashes, and a crowded
momentum trade, which makes the
trading costs high enough to obliterate
the alpha of the strategy for the careless
momentum surfer. Let’s take a closer
look at both of these.
The crashes periodically experienced ina momentum strategy can be significant,
as Figure 2 shows. The relentless upward
climb of prices depicted in Figure 1
disguises (thanks to the log-scale of the
Region and DefinitionRecent Winners Recent Losers t-stat of
Long–ShortReturn Volatility Return Volatility
United States −2 to −12 months 15.6% 18.5% 6.3% 22.0% 3.74***
United States −2 to −12 months, 3-month hold 14.5% 18.7% 6.6% 21.6% 3.36***
United States −2 to −6 months 13.0% 18.3% 8.4% 21.9% 1.83*
Europe −2 to −12 months 14.8% 17.1% 2.0% 21.5% 3.89***
Japan −2 to −12 months 2.5% 20.8% 0.3% 24.4% 0.45
Asia Pacific ex Japan −2 to −12 months 16.1% 22.1% 3.4% 26.3% 3.41***
Global −2 to −12 months 13.0% 16.1% 4.2% 19.1% 2.77***
* Significant at the 10% level.** Significant at the 5% level.*** Significant at the 1% level.Source: Research Affiliates, LLC, using data from the website of Kenneth French. The performances are reported for the followingperiods: United States, 1967–2014; Europe, Japan, and Global, 1987–2014.
620 Newport Center Drive, Suite 900 | Newport Beach, CA 92660 | + 1 (949) 325 - 8700 | www.researchaffiliates.com
Figure 1. Growth of One U.S. Dollar Invested in a Long–Short Momentum Strategy,Including the Risk-Free Asset as Collateral, January 1927–June 2015
0
1
10
100
1000
10000
1 9 2 7
1 9 3 2
1 9 3 7
1 9 4 2
1 9 4 7
1 9 5 2
1 9 5 7
1 9 6 2
1 9 6 7
1 9 7 2
1 9 7 7
1 9 8 2
1 9 8 7
1 9 9 2
1 9 9 7
2 0 0 2
2 0 0 7
2 0 1 2
$6524
G r o w t h o f U S $ ( l o g - s c a l e )
Source: Research Affiliates, LLC, using data from the website of Kenneth French.
Figure 2. Drawdowns of a Momentum Strategy, January 1927–June 2015
-100%
-80%
-60%
-40%
-20%
0%
1 9 2 7
1 9 3 2
1 9 3 7
1 9 4 2
1 9 4 7
1 9 5 2
1 9 5 7
1 9 6 2
1 9 6 7
1 9 7 2
1 9 7 7
1 9 8 2
1 9 8 7
1 9 9 2
1 9 9 7
2 0 0 2
2 0 0 7
2 0 1 2
-74% – Recovery fromGreat Depression
-31% – Recovery from
Tech Bubble Burst
-57% – Recoveryfrom GFC D
r a
w d o w n ( i n p e r c e n t )
Source: Research Affiliates, LLC, using data from the website of Kenneth French.Note: The strategy is a momentum long–short portfolio with the risk-free asset as collateral.
620 Newport Center Drive, Suite 900 | Newport Beach, CA 92660 | + 1 (949) 325 - 8700 | www.researchaffiliates.com
(crashes and crowded trades). One
strong “pro” we have yet to mention
is the contribution that momentum
can make to a value strategy. Adding
momentum to a value strategy is similar
to a surfer riding “peaky” waves that
will give him a lengthy and exciting ride,
leaving others to surf “close-out” waves
with short, dull rides.
In a value strategy, investors sometimes
find themselves trading against momen-
tum. As a stock becomes cheaper, a
value strategy suggests buying more of
it, the exact opposite of what a momen-
tum strategy suggests. Not surpris-
ingly, value and momentum strategiesare usually negatively correlated both
in terms of stock holdings and alpha.
Exploiting this negative correlation is
essentially riding the curl—a value strat-
egy conditioned on momentum. The
combined strategy generally trades like
a value strategy, but with purchases and
sales delayed to benefit from momen-
tum’s impact on prices. The addition of
momentum need not boost turnover
relative to a value investing strategy, and
therefore, need not incur the high trading
costs of a momentum strategy.
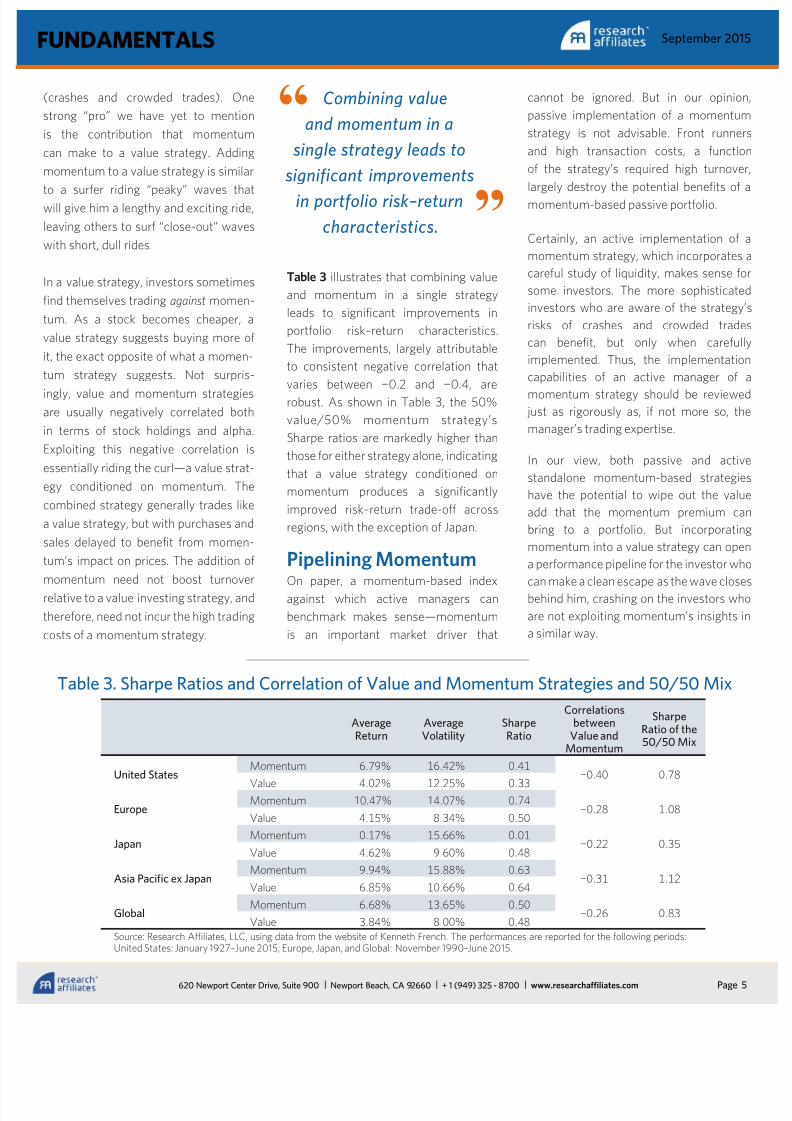
Table 3 illustrates that combining value
and momentum in a single strategy
leads to significant improvements in
portfolio risk–return characteristics.
The improvements, largely attributable
to consistent negative correlation that
varies between −0.2 and −0.4, are
robust. As shown in Table 3, the 50%
value/50% momentum strategy’s
Sharpe ratios are markedly higher than
those for either strategy alone, indicating
that a value strategy conditioned on
momentum produces a significantly
improved risk–return trade-off across
regions, with the exception of Japan.
Pipelining MomentumOn paper, a momentum-based index
against which active managers can
benchmark makes sense—momentum
is an important market driver that
cannot be ignored. But in our opinio
passive implementation of a momentu
strategy is not advisable. Front runne
and high transaction costs, a functio
of the strategy’s required high turnove
largely destroy the potential benefits of
momentum-based passive portfolio.
Certainly, an active implementation of
momentum strategy, which incorporates
careful study of liquidity, makes sense f
some investors. The more sophisticate
investors who are aware of the strategy
risks of crashes and crowded trad
can benefit, but only when carefu
implemented. Thus, the implementatio
capabilities of an active manager of
momentum strategy should be reviewejust as rigorously as, if not more so, th
manager’s trading expertise.
In our view, both passive and activ
standalone momentum-based strategi
have the potential to wipe out the val
add that the momentum premium ca
bring to a portfolio. But incorporatin
momentum into a value strategy can ope
a performance pipeline for the investor wh
can make a clean escape as the wave clos
behind him, crashing on the investors wh
are not exploiting momentum’s insights
a similar way.
AverageReturn
AverageVolatility
SharpeRatio
Correlationsbetween
Value andMomentum
SharpeRatio of the50/50 Mix
United StatesMomentum 6.79% 16.42% 0.41
-0.40 0.78
Value 4.02% 12.25% 0.33
EuropeMomentum 10.47% 14.07% 0.74
-0.28 1.08Value 4.15% 8.34% 0.50
JapanMomentum 0.17% 15.66% 0.01
-0.22 0.35Value 4.62% 9.60% 0.48
Asia Pacific ex JapanMomentum 9.94% 15.88% 0.63
-0.31 1.12Value 6.85% 10.66% 0.64
GlobalMomentum 6.68% 13.65% 0.50
-0.26 0.83Value 3.84% 8.00% 0.48
Source: Research Affiliates, LLC, using data from the website of Kenneth French. The performances are reported for the following periods:United States: January 1927–June 2015; Europe, Japan, and Global: November 1990–June 2015.
Table 3. Sharpe Ratios and Correlation of Value and Momentum Strategies and 50/50 Mix
The material contained in this document is for general information purposes only. It is not intended as an offer or a solicitation for the purchase and/or sa
of any security, derivative, commodity, or financial instrument, nor is it advice or a recommendation to enter into any transaction. Research results relat
only to a hypothetical model of past performance (i.e., a simulation) and not to an asset management product. No allowance has been made for tradin
costs or management fees, which would reduce investment performance. Actual results may differ. Index returns represent back-tested performanc
based on rules used in the creation of the index, are not a guarantee of future performance, and are not indicative of any specific investment. Indexes ar
not managed investment products and cannot be invested in directly. This material is based on information that is considered to be reliable, but Researc
Affiliates™ and its related entities (collectively “Research Affiliates”) make this information available on an “as is” basis without a duty to update, mak
warranties, express or implied, regarding the accuracy of the information contained herein. Research Affiliates is not responsible for any errors or omis
sions or for results obtained from the use of this information. Nothing contained in this material is intended to constitute legal, tax, securities, financial o
investment advice, nor an opinion regarding the appropriateness of any investment. The information contained in this material should not be acted upo
without obtaining advice from a licensed professional. Research Affiliates, LLC, is an investment adviser registered under the Investment Advisors Act o
1940 with the U.S. Securities and Exchange Commission (SEC). Our registration as an investment adviser does not imply a certain level of skill or trainin
Investors should be aware of the risks associated with data sources and quantitative processes used in our investment management process. Errors may
exist in data acquired from third party vendors, the construction of model portfolios, and in coding related to the index and portfolio construction process
While Research Affiliates takes steps to identify data and process errors so as to minimize the potential impact of such errors on index and portfoli
performance, we cannot guarantee that such errors will not occur.
The trademarks Fundamental Index™, RAFI™, Research Affiliates Equity™, RAE™, and the Research Affiliates™ trademark and corporate name and a
related logos are the exclusive intellectual property of Research Affiliates, LLC and in some cases are registered trademarks in the U.S. and other countrie
Various features of the Fundamental Index™ methodology, including an accounting data-based non-capitalization data processing system and method fo
creating and weighting an index of securities, are protected by various patents, and patent-pending intellectual property of Research Affiliates, LLC. (See a
applicable US Patents, Patent Publications, Patent Pending intellectual property and protected trademarks located at http://www.researchaffiliates.com
Pages/ legal.aspx#d, which are fully incorporated herein.) Any use of these trademarks, logos, patented or patent pending methodologies without th
prior written permission of Research Affiliates, LLC, is expressly prohibited. Research Affiliates, LLC, reserves the right to take any and all necessary actio
to preserve all of its rights, title, and interest in and to these marks, patents or pending patents.
The views and opinions expressed are those of the author and not necessarily those of Research Affiliates, LLC. The opinions are subject to change withou


![The Gold Dinar Wipe Out the Impacts to the Flexible Model - Nuradli Ridzwan et al[1].pdf](https://static.documents.pub/doc/80x56/577cd66f1a28ab9e789c5f08/the-gold-dinar-wipe-out-the-impacts-to-the-flexible-model-nuradli-ridzwan.jpg)


