How Rents and Expenditures Depreciate: A Case of Tokyo Office Properties JIRO YOSHIDA (PENN STATE & UNIV. OF TOKYO) KOHEI KAWAI (XYMAX REAL ESTATE INSTITUTE) DAVID GELTNER (MIT) CHIHIRO SHIMIZU (NIHON UNIVERSITY) (DAVID GELTNER PRESENTING TODAY) March 27, 2018 Hitotsubashi-RIETI Workshop on Real Estate and the Macro Economy
Transcript
How Rents and Expenditures Depreciate: A Case of Tokyo Office Properties
JIRO YOSHIDA (PENN STATE & UNIV. OF TOKYO)KOHEI KAWAI (XYMAX REAL ESTATE INSTITUTE)DAVID GELTNER (MIT)CHIHIRO SHIMIZU (NIHON UNIVERSITY)
(DAVID GELTNER PRESENTING TODAY)
March 27, 2018Hitotsubashi-RIETI Workshop on Real Estate and the Macro Economy
MotivationRents (& resulting net income) measure the productivity of the physical capital represented by built commercial propertiesSuch productivity is fundamental economic reason why buildings are builtRents reflect value of the structure plus value of the location, for existing users (in existing building)Depreciation is important economic phenomenon, major impact on use of vital resources (construction), as depreciation ultimately leads to demolition & redevelopmentRent depreciation is rarely studied (worldwide). (Most studies are of structure value depreciation.)Unique, great database available from Xymax Corp in JapanCase of Tokyo office properties has global interest as an example of extremely high land value real estateFrom urban economics perspective, interesting comparisons possible with “land rich” country (relatively low land values) such as USA where recent depreciation studies of commercial properties have been made.
RENT AND EXPENDITURE DEPRECIATION 2
The “big picture”…Property value (including land) depreciates only down to 60% of starting value. ==> Land Value Fraction @Dvlpt = 60%.
How does this compare to low land value USA case?
RENT AND EXPENDITURE DEPRECIATION 3
Age profile of commercial property value in Tokyo (Yoshida, 2017)
Depreciation Rates: 5.3%/y for 1-5 years, 2.1%/y for 21-25 years, 0.9%/y for 41-45 years
The “big picture”…Property Value/Age Profile flattening at 30 years age ==> Building fully-depreciated at 30 yrs age (land does not depreciate). ==> Short avg building economic life.
How does this compare to low land value USA case?
RENT AND EXPENDITURE DEPRECIATION 4
Depreciation Rates: 5.3%/y for 1-5 years, 2.1%/y for 21-25 years, 0.9%/y for 41-45 years
The “big picture”…Here is corresponding USA case for commercial property. Value/Age Profile does not flatten until 100 yrs age, at 30% Land Value Fraction
This is for commercial property, national average.
RENT AND EXPENDITURE DEPRECIATION 5
0
0.1
0.2
0.3
0.4
0.5
0.6
0.7
0.8
0.9
1
0 10 20 30 40 50 60 70 80 90 100
Ratio
to N
ew P
rope
rty
Valu
e
Building Age (Yrs)
Property Value/Age Profile (including land): Non-Parametric & Geometric/Linear Fit(Based on hedonic price model of 80,431 transaction prices in property asset market)
Commercial Properties:
Net Depreciation (non-parametric) Net Depreciation (geometric fit) Land Value
3.1%/yr of remaining structvalue (1st 50 yrs)
LVF = 47% @median age
(23yrs)
LVF @ Redvlpt= 100% of old
30% of new
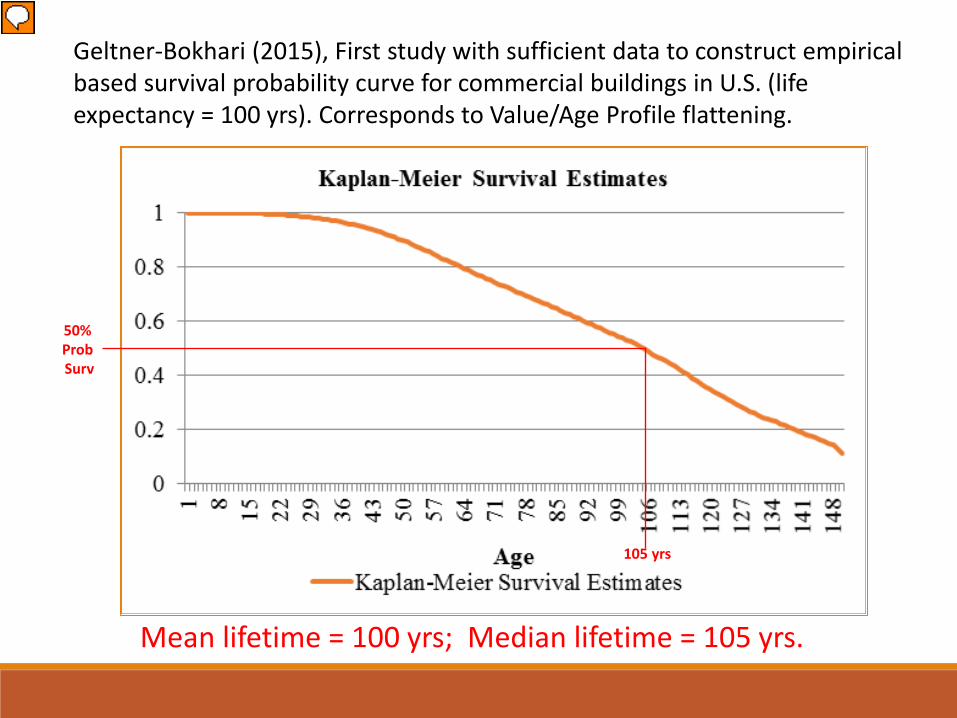
Geltner-Bokhari (2015), First study with sufficient data to construct empirical based survival probability curve for commercial buildings in U.S. (life expectancy = 100 yrs). Corresponds to Value/Age Profile flattening.
50% ProbSurv
105 yrs
Mean lifetime = 100 yrs; Median lifetime = 105 yrs.
Presenter
Presentation Notes
This slide shows our empirically estimated survival age probability curve that we have estimated in the study. This is another first in this study, that we are able to contribute, as the RCA dataset includes data on the ages of buildings when they’re demolished. This enables us to construct the survival probability curve shown in the chart, that is, an estimate of the probability that a building survives to a given age. The horizontal axis shows building ages, and the declining orange line shows the fraction of buildings that live at least as long as the age given on the horizontal axis. This provides an estimate of the “life expectancy” of commercial buildings. The data indicates that this life expectancy is 100 years. That is the mean of the survival probability curve that is estimated from the population of surviving and demolished buildings in the RCA database. The median, or “half life”, is 105 years.
How do we know relevant land value fractions (30% commercial, 20% apartments)? Two ways…1) Direct evidence from transaction prices of properties bought as “development sites” subsequently sold developed, Ratio of prices:
2) Survival analysis (ages of buildings @ demolition) life expectancy (100 yrs) combined with remaining property value fraction (30%, 20%) at age where non-parametric (flexible) value/age profile flattens out (80-110 yrs), indicating no further depreciation (just land value):
Mean NDLVF N Apartment 0.18 139 Commercial 0.32 691 Total 0.30 830
Presenter
Presentation Notes
In case we have time, and if people want to go into it, this slide shows how we estimate the land value fraction that is relevant for our computations of depreciation rates as a function of building age. Our fundamental estimate of the value/age profile is at the total property asset value level, based on the transaction prices reflecting the combined value of the structure and the land. To convert this property asset value/age profile to a structure value/age profile, we need to subtract out the land value. The estimated property value/age profile is an essentially cross-sectional analysis, comparing the prices at which properties are traded, as of the same point in time, with buildings of different ages. While our data spans 2001-14, the regression model controls for differences in the property market during that period by the use of time dummy variables. This makes the estimated value/age profile reflect purely the effect of age across properties, not across time. We then subtract the 30% land value fraction (as a fraction of the newly-built property) for commercial buildings and 20% for apartment buildings. These fractions are estimated by two different methods. First, we have direct evidence on the cost of the land as a fraction of the subsequently newly-developed property price that was sold shortly after the development. We have 691 commercial development observations and 139 apartment developments. These indicate an average new development land value fraction (NDLVF) of 32% for commercial and 18% for apartments. Second, we combine the evidence from our survival probability curve estimation about building life expectancy with indication from our directly-estimated property value/age profile about the property value fractions at which the value/age profiles stop declining and flatten out, indicating no further depreciation, i.e., fully-depreciated structure leaving the property value to represent purely land value. As noted, the non-parametric value/age profiles appear to approximately flatten out in an age range similar to the approximately 100-year life expectancy of buildings indicated by our survival probability curve. This flattening of the value/age profile at the building life expectancy occurs at property value fractions of approximately 30% for commercial and 20% for apartments as a fraction of the new-building property value. This result is therefore essentially consistent with the direct evidence, but based on many more price observations. In this way we can objectively identify and control for the effect of land value in the total property value, and thereby translate our directly-estimated property value/age profile into the implied structure value/age profile, on which we can then compute the net and gross depreciation rates reported in the previous slides.
The “big picture”…Here is picture for three different USA metros, with three different levels of land value… (Bokhari-Geltner, REE 2016)
New York flattens at 60% at 75 yrs age. Dallas at < 10% over 120 yrs.
RENT AND EXPENDITURE DEPRECIATION 8
0
0.1
0.2
0.3
0.4
0.5
0.6
0.7
0.8
0.9
1
0 10 20 30 40 50 60 70 80 90 100 110 120
Ratio
to Z
ero-
Age
Prop
erty
Val
ue
Property Age (yrs)
Cumulative Effect of Real Depreciation on Property Value (including land): Comparison of Several Metro Areas
NY Chi Dallas
New York
Chicago
Dallas
The “big picture”…We found “three stage” lifespan of USA buildings: Youth, Middle Age, Old Age…
RENT AND EXPENDITURE DEPRECIATION 9
New York
Chicago
Dallas
0
0.1
0.2
0.3
0.4
0.5
0.6
0.7
0.8
0.9
1
0 10 20 30 40 50 60 70 80 90 100
Ratio
to N
ew P
rope
rty
Valu
e
Building Age (Yrs)
Property Value/Age Profiles: Commercial & Apartment Properties(Property Asset Value Including Land)
Commercial (80,431 obs) Apartment (27,374 obs)
Youth (0-30yrs)(Loses "Class A") Middle Age (30-65yrs)
("Class B" absorbs CapEx)
Old Age (65-100yrs)(Declines to Land Value)
The “big picture”…This seems to exist in Japanese buildings too. Rapid depreciation in “Youth”… (But youth may be shorter.)
RENT AND EXPENDITURE DEPRECIATION 10
Age profile of commercial property value in Tokyo (Yoshida, 2017)
Depreciation Rates: 5.3%/y for 1-5 years, 2.1%/y for 21-25 years, 0.9%/y for 41-45 years
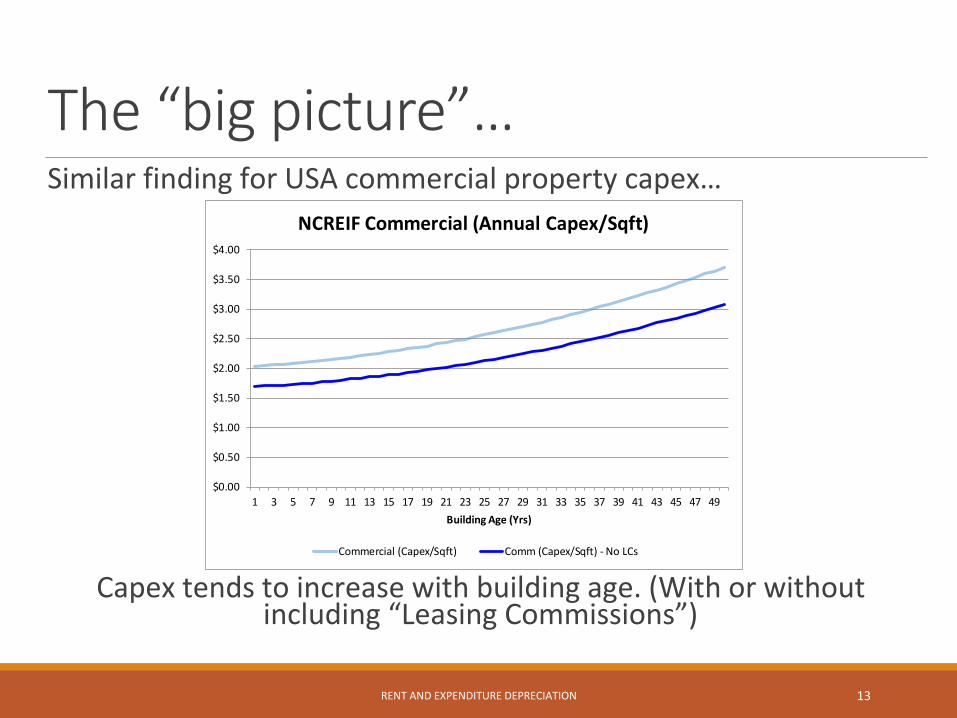
The “big picture”…Depreciation more broadly from economic perspective is “Capital Consumption”, which includes: (i) Net Depreciation, + (ii) Capital Improvement Expenditures (“Capex”)…
Depreciation rates can be measured either as fraction of total property value (including land), or as fraction just of remaining structure value (since structure is what depreciates).In the case of Rent Depreciation, we measure it as a fraction of itself (fraction of rent), but rent reflects land value (for existing bldg) as well as structure value. Rent is current productivity of the property, not Present Value of all future expected cash flows from property.
RENT AND EXPENDITURE DEPRECIATION 11
Tokyo Office Net Depreciation Rates, Fraction of Property Value Including Land: 5.3%/y for 1-5 years, 2.1%/y for 21-25 years, 0.9%/y for 41-45 years
Commercial (Capex/Sqft) Comm (Capex/Sqft) - No LCs
The “big picture”…Back to a key question… Why/How does the Value/Age Profile flatten out so early for Tokyo commercial properties? Why do Japanese buildings have such a short economic lifespan?...
RENT AND EXPENDITURE DEPRECIATION 14
Age profile of commercial property value in Tokyo (Yoshida, 2017)
Depreciation Rates: 5.3%/y for 1-5 years, 2.1%/y for 21-25 years, 0.9%/y for 41-45 years
The “big picture”…Is it because of decline in the productivity of the buildings? If so, this would be indicated by Rent Depreciation. Or is it because of “economic obsolescence” (Redevelopment Option Value)?...
RENT AND EXPENDITURE DEPRECIATION 15
Age profile of commercial property value in Tokyo (Yoshida, 2017)
Depreciation Rates: 5.3%/y for 1-5 years, 2.1%/y for 21-25 years, 0.9%/y for 41-45 years
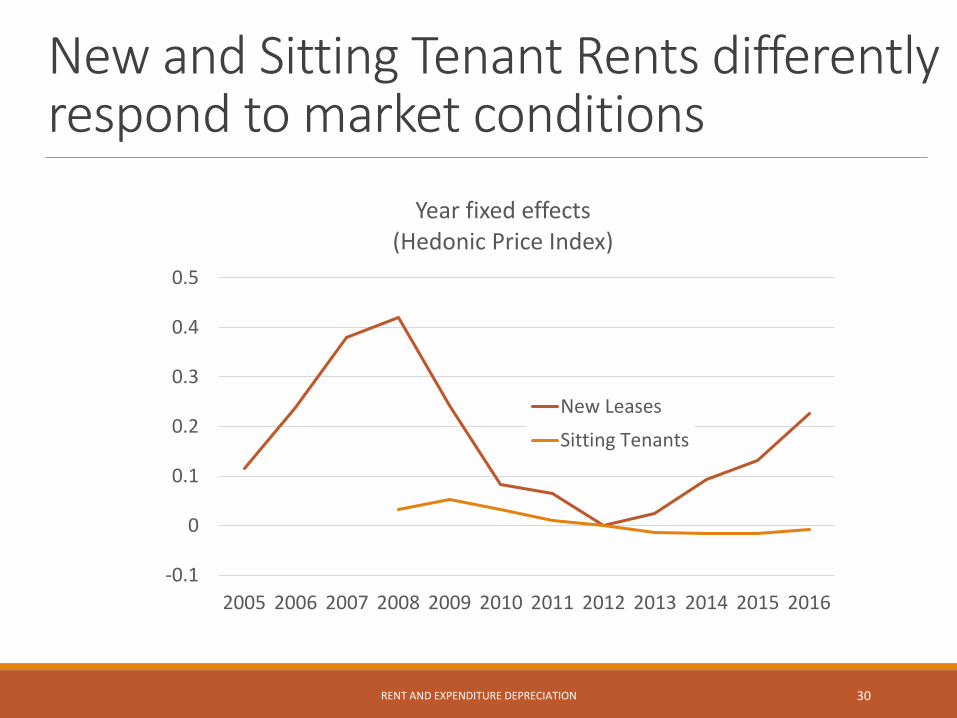
Newly Contracted Rents: Building Panel
Baseline Control Cohort
16RENT AND EXPENDITURE DEPRECIATION
1.4%/y for ages 0-100.9%/y for ages 11-200.8%/y for ages 21-300.6%/y for ages 31-400.3%/y for ages 41-50
This is may be our single most important empirical finding. Rents in Tokyo Office Properties decline with bldg age only very little, less than decline in property value…
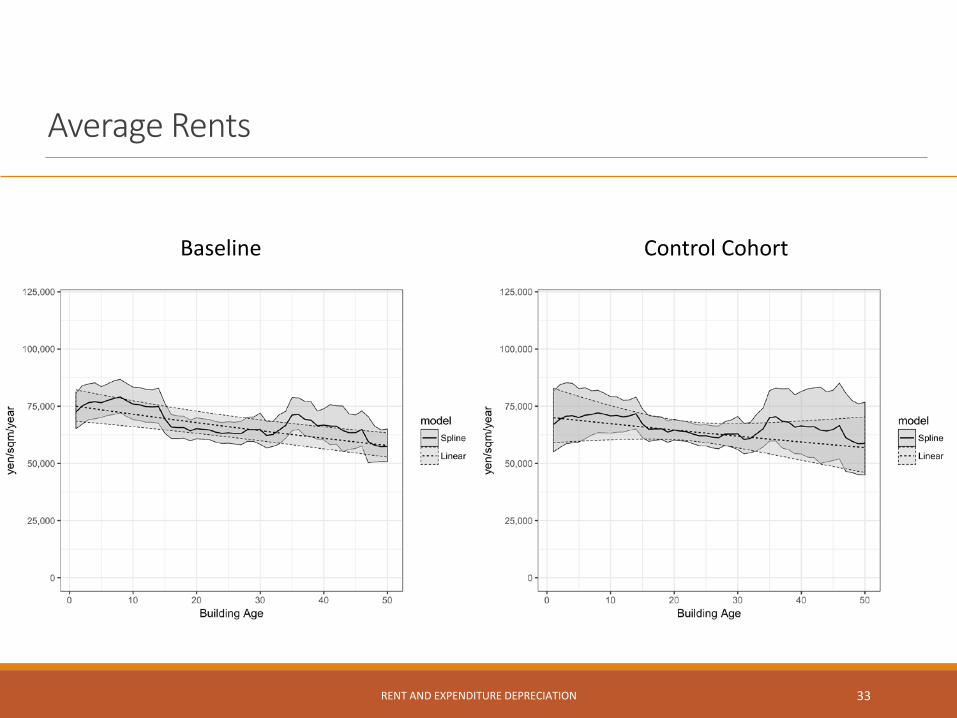
Baseline Control Cohort
RENT AND EXPENDITURE DEPRECIATION 17
1.4%/y for ages 0-100.9%/y for ages 11-200.8%/y for ages 21-300.6%/y for ages 31-400.3%/y for ages 41-50
Rent/Age Profile nearly flat. Declines with bldg age only about 30% to about 70% of original value. Then rent flattens, even though rents do not reflect the redevelopment option value in the land. ==> Buildings maintain very high productivity at age where economic obsolescence occurs.
This StudyWe do more than just study rents on new leases…Estimate age profiles of complete office cash flows◦ New rents, rents for sitting tenants, average rents, operating
expenses, net operating income, capital expenditures, and net cash flow
Proprietary data from Xymax, a major property management firm in Tokyo.
RENT AND EXPENDITURE DEPRECIATION 18
Main Results1. The rent depreciation rate is 0.8% for new leases, 0.4% for
sitting tenants, and 0.5% on average2. Rents depreciate at a declining rate.3. Smaller buildings experience larger rent depreciation.4. A tenant occupying a larger proportion of building
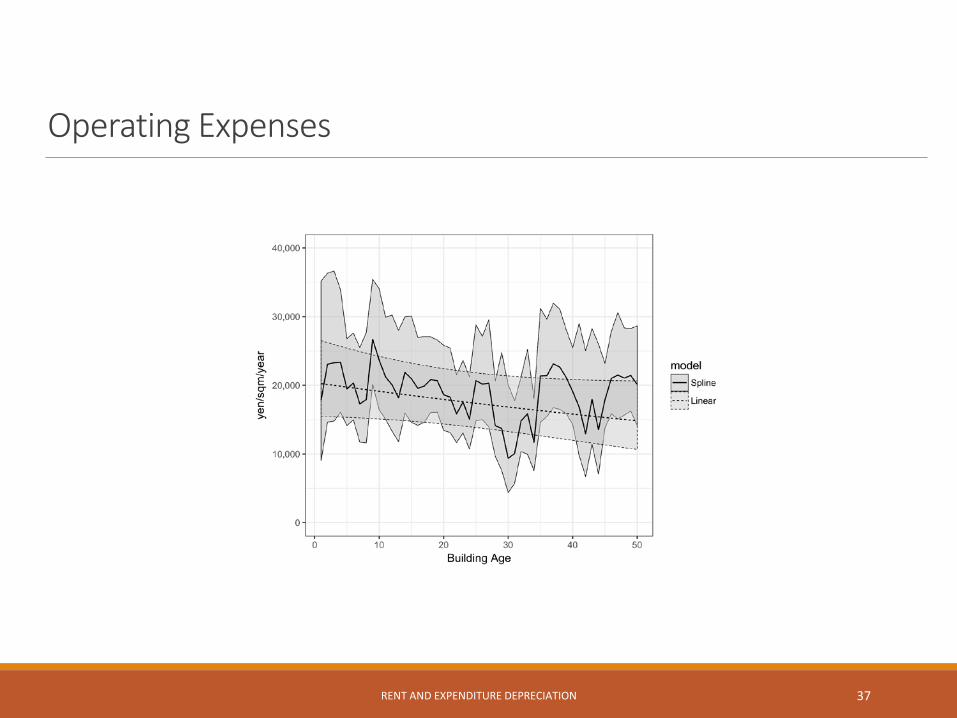
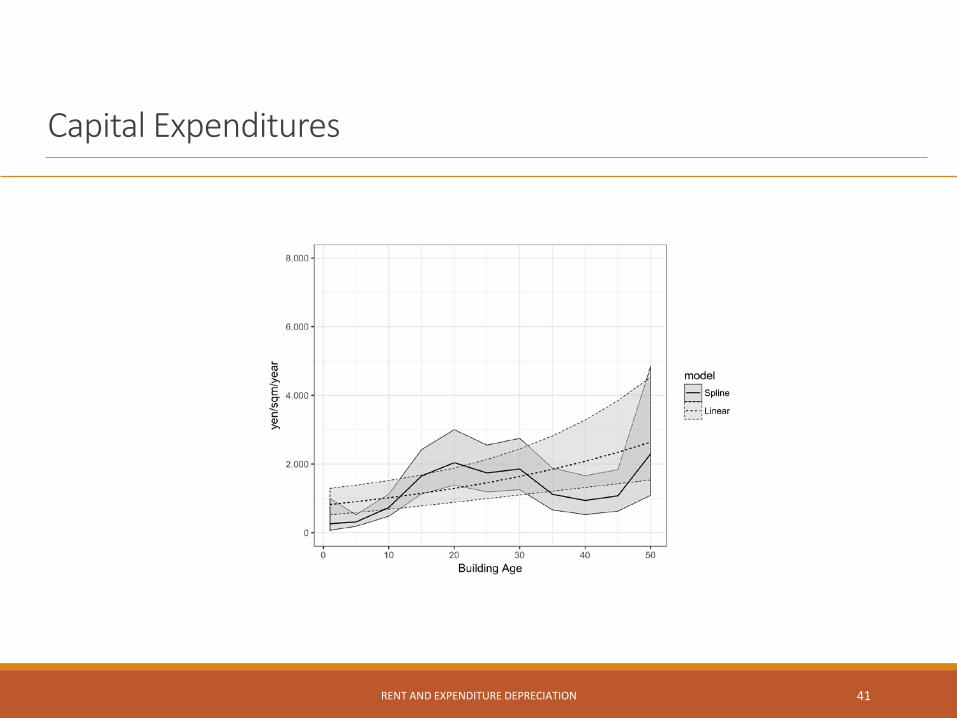
experiences larger rent depreciation.5. Operating expenses depreciate annually at 0.6%.6. Net operating income depreciates annually at 0.4%.7. Capital expenditures generally increase over time.8. Net cash flows depreciates at 0.6% per year.
RENT AND EXPENDITURE DEPRECIATION 19
Rent and Cash Flow Data
RENT AND EXPENDITURE DEPRECIATION 20
Unit-levelMonthlyPanel(162,559obs.)
Building-levelAnnualPanel(6159 bldgs.)
Tenants occupying
consecutive years
Average by year
& building
A chain-type index
Average by year
& building
New Rent
New Rent
AverageRent
Individual Lease Rates
Sitting TenantRent
Individual Lease Rates(sitting tenants)
OperatingExpenses
CapitalExpenses
Net Operating
Income
Net Cash Flow
Descriptive Statistics: Entire building panel (bldg. & year)
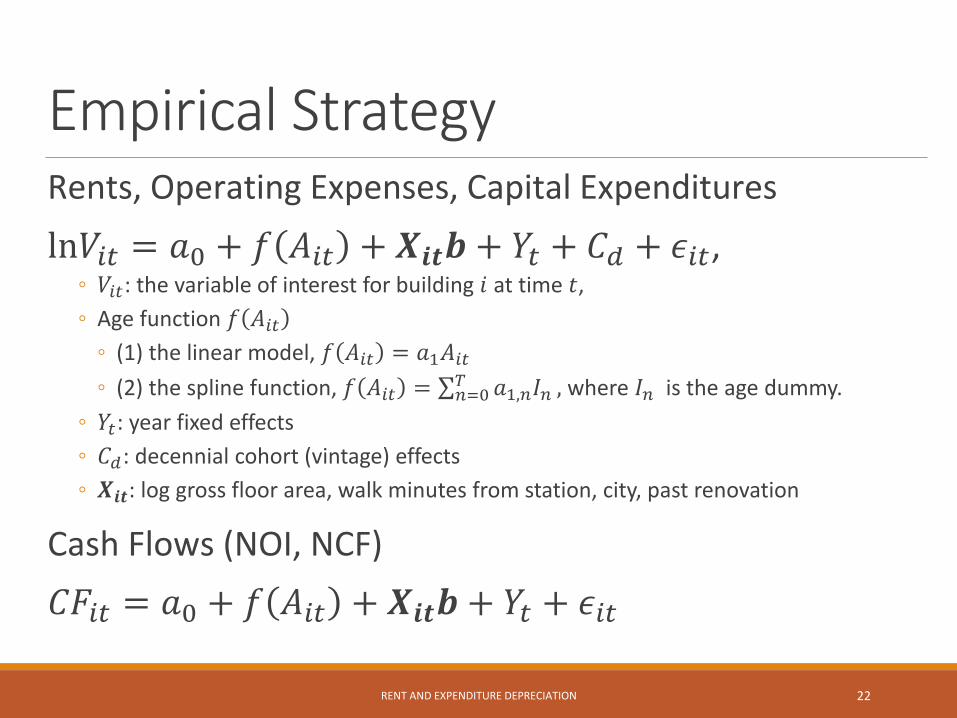
Empirical StrategyRents, Operating Expenses, Capital Expenditures
ln𝑉𝑉𝑖𝑖𝑖𝑖 = 𝑎𝑎0 + 𝑓𝑓 𝐴𝐴𝑖𝑖𝑖𝑖 + 𝑿𝑿𝒊𝒊𝒊𝒊𝒃𝒃 + 𝑌𝑌𝑖𝑖 + 𝐶𝐶𝑑𝑑 + 𝜖𝜖𝑖𝑖𝑖𝑖,◦ 𝑉𝑉𝑖𝑖𝑖𝑖: the variable of interest for building 𝑖𝑖 at time 𝑡𝑡, ◦ Age function 𝑓𝑓 𝐴𝐴𝑖𝑖𝑖𝑖◦ (1) the linear model, 𝑓𝑓 𝐴𝐴𝑖𝑖𝑖𝑖 = 𝑎𝑎1𝐴𝐴𝑖𝑖𝑖𝑖◦ (2) the spline function, 𝑓𝑓 𝐴𝐴𝑖𝑖𝑖𝑖 = ∑𝑛𝑛=0𝑇𝑇 𝑎𝑎1,𝑛𝑛𝐼𝐼𝑛𝑛 , where 𝐼𝐼𝑛𝑛 is the age dummy.
◦ 𝑌𝑌𝑖𝑖: year fixed effects◦ 𝐶𝐶𝑑𝑑: decennial cohort (vintage) effects◦ 𝑿𝑿𝒊𝒊𝒊𝒊: log gross floor area, walk minutes from station, city, past renovation
“Stickiness” in Sitting Tenants Rents. Tenants have less “holdup threat” than landlords, less negotiating leverage? Why?... (& bldg may retain greater functionality for sitting tenants)
This is “bottom line” of property current productivity with existing building. Profile almost flat. Maybe even evidence rises toward end (40-50 yrs age). Suggests economic (“external”) obsolescence is major reason for demolition & redevelopment in Tokyo.
ConclusionCash Flow (Building Productivity) depreciation rate is very small (0.4%-0.6%/year)
This rate is less than property value depreciation (Yoshida 2017)
This is the first study to uncover this point. Suggests Tokyo buildings demolished (redeveloped) when building still highly productive (economic obsolescence: redevelopment option value). But why so much more so in Japan compared to USA. Can land value difference fully explain it?...
We plan to conduct additional analysis by introducing rent uncertainty, etc.
RENT AND EXPENDITURE DEPRECIATION 44
Presenter
Presentation Notes
Cash flow depreciation greater than property value depreciation is same thing as property cap rate (cash yield) increasing with building age. This in itself is not remarkable, as may simply reflect greater investment risk in older built property. But flattening of property value/age profile at such a young age, combined with such high and nearly flat cash flow/age profile, raises some question about the phenomenal nature of economic obsolescence in Tokyo buildings.


![Flatt CV May 2020 - unifr.ch · • among the 100,000 most-cited scientists (~top 1%) across 26 fields (Ioannidis et al 2019, PLoS Biol.) In progress [91] Promislow, D.E.L., Flatt,](https://static.documents.pub/doc/80x56/5f74a7b7d3dad50db22a4a4c/flatt-cv-may-2020-unifrch-a-among-the-100000-most-cited-scientists-top-1.jpg)

![BRASS’ INSTRUMENTS - Oxford university Bate … Brass.pdf · 717 Philip Bate, London, Flatt trumpet after James Talbot manuscript Flatt trumpet [Bate] x703 Philip Bate, London,](https://static.documents.pub/doc/80x56/5b9f13dd09d3f2ab0b8cda0c/brass-instruments-oxford-university-bate-brasspdf-717-philip-bate-london.jpg)


