Page 1
HOW ROBUST ARE THE SMALL
SCALE TECHNOLOGY CERTIFICATES
CALCULATIONS FOR SOLAR HOT
WATER SYSTEMS DERIVED FROM
THE TRNSYS CALCULATIONS?
By
RUGHOONUNDUN Mavintah
PROJECT SUBMITTED IN PARTIAL FULFILMENT FOR THE
MASTERS OF SCIENCE IN RENEWABLE ENERGY
UNIVERSITY OF MURDOCH
SCHOOL OF ENERGY AND ENGINEERING
NOVEMBER 2012
Page 2
Dedicated to H.H. Satgurudev Shri Satpal Ji
Maharaj....
Page 3
Table of Contents
i
TABLE OF CONTENTS
Page
List of Tables........................................................................................................................ iii
List of figures ........................................................................................................................iv
ACKNOWLEDGEMENT ..................................................................................................... v
CERTIFICATION OF COMPLETION OF DISSERTATION ............................................vi
ABSTRACT ....................................................................................................................... viii
LIST OF ABBREVIATIONS ...............................................................................................ix
CHAPTER 1 INTRODUCTION ........................................................................................... 1
1.0 Introduction ....................................................................................................................... 1
1.1 Key research question ....................................................................................................... 3
CHAPTER 2 LITERATURE REVIEW ................................................................................ 4
2.0 Introduction ....................................................................................................................... 4
2.1 Solar Sector In Australia .................................................................................................. 4 2.1.1 Australia’s Solar Energy Resources .......................................................................................... 4 2.1.2 Location of the resource ............................................................................................................ 5 2.1.3 Australia’s Solar Energy market ................................................................................................ 6 2.1.4 Australia’s solar energy market future outlook ......................................................................... 7
2.2 Solar Hot Water systems .................................................................................................. 8 2.2.1 Types of solar water heaters ...................................................................................................... 8
2.2.1.1 Closed couple thermosyphon solar water heater .............................................................. 8
2.2.1.2 Remote thermosyhon system ............................................................................................ 9
2.2.1.3 Preheaters ........................................................................................................................ 10
2.2.1.4 Continuous flow instantaneous gas boosted system ....................................................... 10
2.2.1.5 Heat pumps ...................................................................................................................... 11
2.3 Concept of the Mandatory Renewable Energy Target in Australia ........................... 11
2.3 Renewable Energy Target .............................................................................................. 12 2.3.1 Large Scale Renewable Energy Target scheme (LRET) ......................................................... 13 2.3.2 Small Scale Renewable Energy scheme (SRES) ..................................................................... 14 2.3.3 Administration of the Renewable Energy Target .................................................................... 15
2.4 Small Scale technology certificates (STCs) ................................................................... 16 2.4.1 Eligibility ................................................................................................................................. 17 2.4.2 Solar credits ............................................................................................................................. 17 2.4.3 Small Scale Technology Certificate market ............................................................................ 18 2.4.4 Management of certificates ..................................................................................................... 19
2.4.4.1 REC registry ...................................................................................................................... 19
2.4.4.2 STC clearing house ........................................................................................................... 19
Page 4
Table of Contents
ii
2.5 Methodology for calculating STCs ................................................................................ 20 2.5.1 Australian Standards AS/NZS4234:2008. Heated Water Systems - Calculation of energy
consumption ..................................................................................................................................... 22 2.5.2 TRNSYS Simulation program ................................................................................................. 23
CHAPTER 3 METHODOLOGY ........................................................................................ 24
3.0 Introduction ..................................................................................................................... 24
3.1 Inputs for the simulation ................................................................................................ 24
3.2 Scope of the project ......................................................................................................... 26
3.3 Performance evaluation .................................................................................................. 27 3.3.1 Standard operating conditions ................................................................................................. 27 3.3.2 Component testing ................................................................................................................... 29 3.3.3 Displaced energy calculation ................................................................................................... 32
3.4 Presentation of results .................................................................................................... 33 3.4.1 Sensitivity analysis .................................................................................................................. 34 3.4.2 Presentation of results .............................................................................................................. 35
CHAPTER 4 RESULTS & DISCUSSION ......................................................................... 38
4.1 Introduction ..................................................................................................................... 38
4.2 Results .............................................................................................................................. 38 4.2.1 Pumped instantaneous gas booster (Zone 3)............................................................................ 38 4.2.2 Pumped instantaneous gas booster (Zone 4)............................................................................ 39 4.2.3Thermosyphon gas booster (Zone 3) ........................................................................................ 40 4.2.4 Thermosyphon gas booster (Zone 4) ....................................................................................... 41 4.2.5 Results from sensitivity analysis ............................................................................................. 44
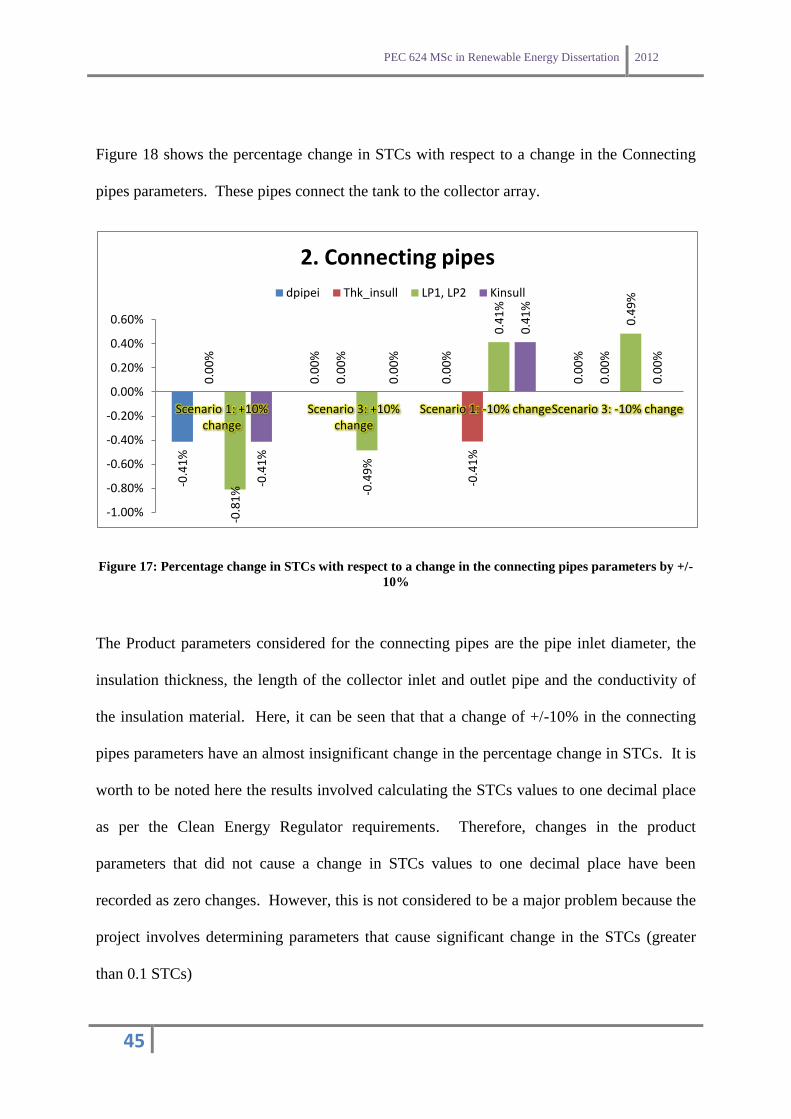
4.2.5.1 Scenario 1 and Scenario 3 (Pumped instantaneous gas booster system) ........................ 44
4.2.5.2 Scenario 2 and Scenario 4 (Thermosyphon gas booster system)..................................... 50
CHAPTER 5 CONCLUSION AND FUTURE WORK ...................................................... 56
REFERENCES ..................................................................................................................... 58
APPENDIX 1A - AS/NZS 4234: 2008
APPENDIX 1B- AS/NZS 4234: 2008/Amdt 1:2011
APPENDIX 2- Legislative Instrument F2012L00591.
APPENDIX 3- RESULTS
Page 5
iii
LIST OF TABLES
Page
Table 1 Weather Zones ............................................................................................................... 25
Table 2 Standardised collector installation conditions................................................................ 27
Table 3 Peak Daily Thermal Energy Loads for Australia ........................................................... 28
Table 4 Daily load multiplier ...................................................................................................... 28
Table 5 Seasonal load multiplier ................................................................................................. 29
Table 6 Components tested ......................................................................................................... 29
Table 7 Medium and Large loads Reference Electric Water Heater in Australia ....................... 32
Table 8 Energy consumption of reference solar water heaters in Australia ................................ 33
Table 9 System performance result Summary (System inputs) .................................................. 33
Table 10 System performance result Summary (System outputs) .............................................. 34
Table 11 Product parameters for pumped instantaneous solar water heater ............................... 35
Table 12 Product parameters for thermosyphon gas solar water heater ..................................... 36
Table 13 Detailed results of pumped instantaneous gas booster in Zone 3, system inputs......... 38
Table 14 Detailed results of pumped instantaneous gas booster in Zone 3, system outputs ....... 39
Table 15 Detailed results of pumped instantaneous gas booster in Zone 4 (System inputs) ...... 39
Table 16 Detailed results of pumped instantaneous gas booster in Zone 4, system outputs ....... 40
Table 17 Detailed results of pumped Thermosyphon gas booster in Zone 3, system inputs. ..... 40
Table 18 Detailed results of Thermosyphon gas booster in Zone 3, system outputs .................. 41
Table 19 Detailed results of pumped Thermosyphon gas booster in Zone 4, system inputs ...... 41
Table 20 Detailed results of Thermosyphon gas booster in Zone 4, system outputs .................. 42
Page 6
iv
LIST OF FIGURES
Page
Figure 1 Average Solar Energy Radiation in Australia ................................................................ 4
Figure 2 December average solar radiation across Australia ........................................................ 5
Figure 3 June average solar radiation across Australia ................................................................. 5
Figure 4 Solar Thermal energy consumption by state, 2007-2008 ............................................... 6
Figure 5 Closed loop thermosyphon solar water heater ................................................................ 9
Figure 6 Remote thermosyphon solar water heater..................................................................... 10
Figure 7 Continuous flow instantaneous gas boosted solar water heater .................................... 11
Figure 8 Large Scale generation certificate market .................................................................... 13
Figure 9 Figure 9: Annual Targets for 2011-2020 ...................................................................... 14
Figure 10 STC entry in REC registry database ........................................................................... 16
Figure 11 STC market ................................................................................................................. 18
Figure 12 Systems covered in the decks files ............................................................................. 25
Figure 13 Climate Zones ............................................................................................................. 26
Figure 14 Pumped instantaneous gas water heater components ................................................. 30
Figure 15 Thermosyphon gas solar water heater components .................................................... 31
Figure 16 STCs comparison of the systems ................................................................................ 43
Figure 17 Percentage change in STCs with respect to a change in the collector’s parameters by
+/-10% ........................................................................................................................................ 44
Figure 18 Percentage change in STCs with respect to a change in the connecting pipes
parameters by +/-10% ................................................................................................................. 45
Figure 19 Percentage change in STCs with respect to a change in the solar tank parameters by
+/-10% ........................................................................................................................................ 46
Figure 20 Percentage change in STCs with respect to a change in the pump & pump controller
parameters by +/-10% ................................................................................................................. 47
Figure 21 Figure 18: Percentage change in STCs with respect to a change in the parameters of
the pipe between the tank and gas booster by +/-10% ................................................................ 48
Figure 22 Percentage change in STCs with respect to a change in the parameters of the
instantaneous gas booster. ........................................................................................................... 49
Figure 23 Percentage change in STCs with respect to a change in the parameters of the collector
.................................................................................................................................................... 50
Figure 24 Percentage change in STCs with respect to a change in the parameters of the solar
tank .............................................................................................................................................. 51
Figure 25 Percentage change in STC with respect to a change in the parameters of the
Connecting pipes. ........................................................................................................................ 52
Figure 26 Percentage change in STC with respect to a change in the parameters of the pipe
connecting the tank and the gas booster. ..................................................................................... 53
Figure 27 Percentage change in STCs with respect to a change in the parameters of the
instantaneous gas booster. ........................................................................................................... 54
Page 7
v
ACKNOWLEDGEMENT
The realisation of this dissertation would not have been possible without the help of
many people to whom I am very thankful.
First and foremost, I would like to thank the Almighty for having always been by my
side. I thank Him for the good health he has given me to bring to completion my study.
I would like to express my heartfelt gratitude towards all my lectures who have done
the noble task of sharing their knowledge throughout my four years at the university.
I would sincerely like to thank my dissertation supervisor, Dr Trevor Pryor, to whom, I
am really indebted for the accomplishment of this dissertation, but also for her valuable
help, guidance, encouragement and advice throughout the dissertation.
My sincere gratitude goes to my mum, dad and my little brother Akshay for their love,
support and belief in me.
I would also like to thank Sooraj & Romesh for their immense help and support.
Page 8
vi
PEC624 RENEWABLE ENERGY DISSERTATION CERTIFICATION OF COMPLETION OF DISSERTATION
Form to be completed by the Supervisor and submitted to the Research and Teaching
Assistant with 2 copies of project to formally advise that the Masters Dissertation
is ready for examination.
STUDENT'S NAME: Enrolment: PEC624 8pts
SUPERVISOR'S NAME:
TITLE OF DISSERTATION:
OFFICIAL SUBMISSION DATE: ____________________
ACTUAL SUBMISSION DATE: _____________________
If these two dates are different, give a brief explanation
DISSERTATION APPROVAL DATE: _____________________
(Includes research plan)
SEMINAR PRESENTATION DATE: ____________________________________
Having completed the above, I certify that this Masters dissertation is ready for examination.
Date: _______________________
(Supervisor's signature)
Page 9
vii
Masters by Coursework Theses Deposit Form
Personal Information Last Name:
Other Names:
Student Number:
E-mail:
Faculty:
School:
Degree Program:
Document Information Title:
Year of Completion:
Supervisor's Name:
Supervisor's Email:
Availability Information
Public access to unpublished Masters by Coursework theses for the purposes of research and study is
granted by s.51(2) of the Copyright Act 1968. Murdoch University makes both print and electronic
forms of Masters by Coursework immediately available for public access unless the author requests
the University to restrict access.
Embargo Period: Prior approval from your supervisor is required. Can be either 12 or 24 months.
Please indicate the number of months the restriction applies _________
Copyright Statement Note: Murdoch University will make your thesis available online. If you have included copyright material which does not belong to you (e.g. pictures, tables, graphs, substantial amounts of text, etc), you must either obtain permission from the copyright owner to include that material, or omit it from the electronic version of your thesis. Please attach copies of any permissions granted; and a note in your report if material has been removed. Contact the Copyright Coordinator (email: [email protected] ; phone: 08 9360 7491) or see http://www.murdoch.edu.au/copyright for further details. This provision does not affect the printed version of your thesis.
I agree ________________________
Authenticity Statement I certify that the electronic version of my Masters by Coursework thesis, as provided, is a direct
equivalent of my printed thesis, subject to any exclusions made for copyright, confidentiality, or other
reasons.
I agree _________________________
Page 10
viii
ABSTRACT
The Mandatory Renewable Energy Target concept (MRET) operating under the Large Scale
Renewable Energy Target (LRET) and the Small Scale Renewable Energy Target Scheme
(SRES), as from January 2011, aims at reducing the carbon footprint of Australia by
harnessing the abundant renewable energy sources in the country. The method employed by
the two schemes to attain the goal is through the creation of certificates based on the amount
of electricity generated by renewable energy power sources or displaced by solar water
heaters and heat pumps. The certificates earned under the SRES is the small scale technology
certificates (STCs) and the approach used to evaluate the performance of solar water systems
under this scheme is as given in the AS 4234 which uses the TRNSYS simulation program to
determine the amount of STCS gained by these systems. The aim of this project was to
determine the performance of the pumped instantaneous gas solar water heater and the
thermosyphon gas solar water heater in zone 3 and 4 of Australia as per the AS 4234. The
project involved the use of the TRNSYS 15 simulation program to calculate the amount of
STCs gained by these two solar systems. The major inputs to the simulation namely the
TRNSYS deck files were provided at the Clean Energy Regulator website. A sensitivity
analysis was also carried out whereby the various input parameters of the two systems
considered were varied by +/-10% and their impact on the amount of STCs gained were
noted. The results of the study show that higher number of certificates would be produced in
Zone 3 compared to Zone 4 of Australia. The study also shows that the thermsyphon gas
system has a better performance than the pumped instantaneous gas system. The major
parameters found to be sensitive in the STCs calculations are the area of the collector, the
efficiency of the collector as well as the efficiency of the gas in the gas booster. Input
parameters such as the heat loss of the tank and the start up capacity of the gas in the gas
booster are also found to have considerable impact in the STCs calculations.
Page 11
ix
LIST OF ABBREVIATIONS
MRET Mandatory Renewable Energy Target
LRET Large Scale Renewable Energy Target
REC Renewable Energy Certificates
RET Renewable Energy Target
SRES Small Scale Renewable Energy Target Scheme
STCs Small Scale Renewable Energy Certificates
Page 12
PEC 624 MSc in Renewable Energy Dissertation 2012
1
CHAPTER 1 INTRODUCTION
1.0 Introduction
The last decade has seen the emergence of new economies such as China, India, Brazil
amongst others. These, together with developed countries, have seen their energy demand
rise continually as their economies kept on expanding. Since 2011, a global recession has
led to a reduction in the energy demand in most countries except for China and the Middle
East (http://www.eia.gov/countries/cab.cfm?fips=CH). This trend, however, is all set to
reverse in the months to come with a regain in economic activities and will result in an ever
increasing energy demand. As a direct consequence of human activities, huge amounts of
greenhouse gases have been emitted to the atmosphere in the past and with the expected
regain in momentum in global economic activities, even greater amounts of these gases are
expected to be released to the atmosphere. It is believed that these anthropogenic gases are
responsible for the worldwide climate changes that are being observed today, from flooding
in Australia to mega storms, like Sandy, in North America. The United Nations Framework
Convention on Climate Change (UNFCCC) has set up an objective which is to bring the level
of greenhouse gases to such a level so as not to have an impact on the climate. This objective
was given shape in the form of binding obligations to industrialised countries to reduce their
greenhouse gas emissions by an average of 5.2 % for the period 2008 to 2012 and came to be
known as the Kyoto protocol (http://www.enerdata.net). Australia signed and ratified the
Kyoto protocol in November 2007 which came into effect in March 2008. The Expanded
Mandatory Renewable Energy Target (EMRET) that was passed on 20 August 2009 by the
Australian government aims at reducing the amount of greenhouse gases emitted during
electricity production by harnessing the abundant renewable energy sources in Australia and
Page 13
PEC 624 MSc in Renewable Energy Dissertation 2012
2
is in line with the Kyoto protocol. The bill, which was adopted initially in 2001, had a target
to increase the amount of electricity generated from renewable sources by 4% by 2020 which
would have represented a doubling of electricity generated from renewable sources as
compared to the datum year which is 1997
(http://www.aph.gov.au/About_Parliament/Parliamentary_Departments/Parliamentary_Librar
y/Browse_by_Topic/ClimateChange/Governance/Domestic/national/Mandatory). This figure
was however revised in the EMRET and increased to 20% electricity production by
renewable sources representing approximately 45,000 gigawatt-hours by 2020
(http://www.aph.gov.au/About_Parliament/Parliamentary_Departments/Parliamentary_Librar
y/Browse_by_Topic/ClimateChange/Governance/Domestic/national/Mandatory). Since 1st
January 2011, the MRET has been operated in two parts namely the Large-Scale Renewable
Energy Target (LRET) and the Small-Scale Renewable Energy Scheme (SRES). LRET aims
at encouraging large scale electricity production with investments in wind and solar farms
while the SRES is basically for domestic purpose promoting setting up of small scale systems
such as solar panels and solar water heaters. Together these two schemes aim at encouraging
use of renewable sources for electricity production, decrease greenhouse gas emissions by the
electricity sector and ensure renewable energy sources are ecologically sustainable. The
method used to achieve this goal is to create certificates based on the amount of electricity
generated by renewable power sources or displaced by solar water heaters and heat pumps
which can be traded thus providing an incentive for individuals and companies to invest in
renewable technologies. The certificates earned under the SRES are called the small scale
technology certificates (STCS). The approach used to calculate the performance of solar hot
water systems under this scheme is as given in Australian Standard AS4234
(www.gbca.org.au). This standard uses the TRNSYS simulation program to evaluate the
performance of domestic solar hot water systems and hence the amount of STCS gained. The
Page 14
PEC 624 MSc in Renewable Energy Dissertation 2012
3
STC values are based on the energy saved by solar hot water systems compared to standard
hot water systems. TRNSYS simulations have also been used to determine the amount of
subsidy schemes which require a minimum solar contribution or solar fraction before
qualifying for such subsidies.
1.1 Key research question
TRNSYS simulation program determines the yearly performance of domestic solar and heat
water pump heaters by using test results from component performance testing. This implies
that there are many parameters for instance heat loss coefficients for tanks and connecting
pipes, characteristics of solar thermal collectors and lengths of pipework that are inputs to
this process. As such, the results of the simulations are very sensitive to errors in the input
data. This leads to the key research question which is as follows: How sensitive are the
results of the TRNSYS solar hot water system performance calculations to uncertainties
in the input data?
This project will set up a number of solar hot water systems in the TRNSYS software and
evaluate their performance. It will then vary the input parameters by certain percentages and
determine the sensitivity of the results to variations/errors in these input parameters.
Page 15
PEC 624 MSc in Renewable Energy Dissertation 2012
4
CHAPTER 2 LITERATURE REVIEW
2.0 INTRODUCTION
This chapter gives a brief description on the solar sector in Australia, the concept of
Mandatory renewable energy target, the renewable energy target scheme, the small scale
technology certificates, Australian standard AS/NZS 4234: 2008 and the TRNSYS simulation
program.
2.1 Solar Sector In Australia
2.1.1 Australia’s Solar Energy Resources
Australia has the highest solar radiation per square metre of any continent in the world (IEA
2009). Australia receives on average 58 million PJ of solar radiation per year which is
approximately 10,000 times larger than its total energy consumption in 2007-2008 which
amounted to 5772 PJ (ABARE 2010). Figure 1 shows the annual average solar radiation in
Australia.
Figure 1: Average Solar Energy Radiation in Australia
Source: (Australian solar energy resource assessment, ch10, 2010)
Page 16
PEC 624 MSc in Renewable Energy Dissertation 2012
5
Australia has significant seasonal variations in the amount of solar radiation reaching its
surfaces. Summer radiation levels in Australia are very high while the winter radiation
depends on the latitude. Figure 2 & 3 shows the December and the June average solar
radiation respectively across Australia.
Source: (Australian solar energy resource
assessment, ch10, 2010)
2.1.2 Location of the resource
In Australia, the best solar resource is distant from the national electricity market. This is a
challenge for the development of new solar power plants as the cost of connectivity to the
electricity grid is very high. However, there is the possibility for solar thermal energy
applications to provide base and intermediate load electricity in certain locations. Possible
locations in this case were found to be Alice Springs, Tennant creek and the Pilbara region
(Australian solar energy resource assessment, ch10, 2010).
Figure 2: June average solar radiation across
Australia
Figure 3: December average solar radiation across
Australia
Source: (Australian solar energy resource assessment,
ch10, 2010)
Page 17
PEC 624 MSc in Renewable Energy Dissertation 2012
6
2.1.3 Australia’s Solar Energy market
Australia’s prominent solar energy use is restricted to off grid and residential installations.
The most common form of solar energy use is solar water heating. However, electricity
production from the use of photovoltaic is increasing.
Solar Energy accounted for nearly 2.4% percent of all renewables use and around 0.1% of
primary energy consumption in 2007-2008 (ABARE 2010). Solar energy use in Australia
has been increasing at an average rate of 7.2% per annum over the last two decades (ABARE
2010), with the growth being in the form of solar thermal heating used for domestic water
heating purposes as well as electricity from PV. Western Australia has the highest solar
energy consumption contributing nearly about 40% of Australia’s total solar thermal use in
2007-2008 (ABARE 2010). A wide range of factors including the Solar Hot Water Rebate,
State Building Codes, the inclusion of solar hot water under the Renewable Energy Target
and the mandated phase out of electric hot water system by 2012 contributed to the rapid
uptake of solar hot water systems (ABARE 2010)
Figure 4: Solar Thermal energy consumption by state, 2007-2008
Source: (Australian solar energy resource assessment, ch10, 2010)
Page 18
PEC 624 MSc in Renewable Energy Dissertation 2012
7
Electricity generation from solar energy is typically sourced from photovoltaic system
especially for small off grid systems. Solar electricity generation in Australia has increased
rapidly over the last few years and in 2007-2008, 0.11 TWh of electricity was produced. This
increase was mainly driven by the Solar Homes and the Communities Plan for on-grid
applications and the Remote Renewable Power Generation program for off-grid applications
(Australian solar energy resource assessment, ch10, 2010).
2.1.4 Australia’s solar energy market future outlook
The uptake of solar energy technologies in Australia has been relatively low because of its
high cost. Hence, the outlook for Australia’s solar market depends on the cost of solar energy
compared to other technologies. At present, electricity generation from solar energy is more
expensive compared to other renewable energy resources such as hydro and wind. The
minimum cost of generating electricity in areas of high solar radiation is around $ 23 cents
per KWh (EIA 2009). Solar energy is also a viable option for off-grid electricity generation
purposes. Government policies aiming to increase the share of solar energy in its electricity
mix has been implemented at several stages. The Solar Homes and Communities Plan (2000-
2009) provided rebates for installing PV systems. The expanded Renewable Energy Target
scheme including the Solar Credit mechanism provided an upfront capital subsidy for
installing PV systems. Other policies include Australia’s 1.4 billion funding for the Solar
Flagship program (Australian solar energy resource assessment, ch10, 2010), feed in tariffs
and the establishment of the Australian Solar Institute for R&D projects.
Page 19
PEC 624 MSc in Renewable Energy Dissertation 2012
8
2.2 Solar Hot Water systems
Solar water heaters provide a clean, inexhaustible supply of energy that can help reduce its
dependence on fossil fuels. Solar hot water systems also help in conserving the natural
resources and the environment. Converting an electric water heater usage to a solar one
reduces as much greenhouse pollution as taking one car off the road every year
(http://www.sustainability.vic.gov.au/resources/documents/SHW_Factsheet_07.pdf)
Solar hot water systems heat water the same way as water on a lawn gets hot on a sunny day.
In direct heating systems, water is heated as it circulates through the solar collector and is
then stored in the storage tank located either directly above the collector or on the ground like
a conventional hot water systems. These systems are usually equipped with an auxiliary
heater to boost the water temperature on days of low radiation levels. Solar collectors consist
of a blackened metal absorber plate in an insulated metal box covered with a glass cover.
Collectors are usually positioned on a north facing roof no more than 45° east or west of
north and at a slope of between 15° and 50°
(http://www.sustainability.vic.gov.au/resources/documents/SHW_Factsheet_07.pdf).
2.2.1 Types of solar water heaters
2.2.1.1 Closed couple thermosyphon solar water heater
These types of systems consist of roof-mounted solar collectors, combined with a
horizontally mounted storage tank located above these collectors. These systems have no
pump. Heated water rises naturally by convection through the solar collector and enters the
storage tank while cooler water enters at the base of the storage tank is forced out and flows
to the bottom of the collectors.
Page 20
PEC 624 MSc in Renewable Energy Dissertation 2012
9
Figure 5: Closed loop thermosyphon solar water heater
Source: http://www.sustainability.vic.gov.au/resources/documents/SHW_Factsheet_07.pdf
2.2.1.2 Remote thermosyhon system
This system has the same principle as the close-coupled thermosyphon system, except that
the storage tank is located within the roof space. However, the base of the tank needs to be
situated at least 300mm above the collector as shown in the figure below.
Page 21
PEC 624 MSc in Renewable Energy Dissertation 2012
10
Figure 6: Remote thermosyphon solar water heater
Source: http://www.sustainability.vic.gov.au/resources/documents/SHW_Factsheet_07.pdf
2.2.1.3 Preheaters
Preheaters are used to maximise the solar gain of a system. A preheater is a storage tank with
solar collector that feeds water heated by the sun into a conventional water heater when hot
water is drawn from the system.
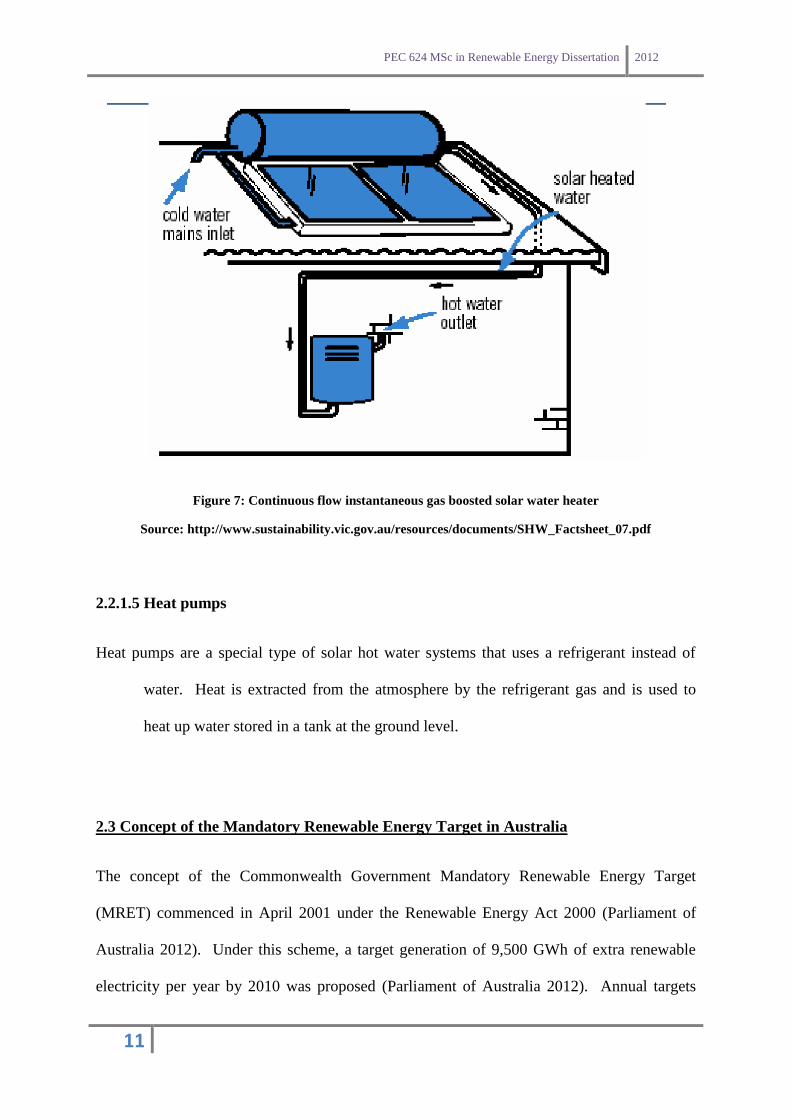
2.2.1.4 Continuous flow instantaneous gas boosted system
In these types of systems, a preheater feeds water heated by the sun into a continuous flow
instantaneous gas boosted hot water system. The continuous flow instantaneous gas boosted
system operates only when the temperature of water heated by the sun is below the set
temperature, thus minimising the amount of gas needed to heat water.
Page 22
PEC 624 MSc in Renewable Energy Dissertation 2012
11
Figure 7: Continuous flow instantaneous gas boosted solar water heater
Source: http://www.sustainability.vic.gov.au/resources/documents/SHW_Factsheet_07.pdf
2.2.1.5 Heat pumps
Heat pumps are a special type of solar hot water systems that uses a refrigerant instead of
water. Heat is extracted from the atmosphere by the refrigerant gas and is used to
heat up water stored in a tank at the ground level.
2.3 Concept of the Mandatory Renewable Energy Target in Australia
The concept of the Commonwealth Government Mandatory Renewable Energy Target
(MRET) commenced in April 2001 under the Renewable Energy Act 2000 (Parliament of
Australia 2012). Under this scheme, a target generation of 9,500 GWh of extra renewable
electricity per year by 2010 was proposed (Parliament of Australia 2012). Annual targets
Page 23
PEC 624 MSc in Renewable Energy Dissertation 2012
12
were set up in order to ensure the achievement of the target. However, in 2009, the
Renewable Energy Bill 2009 amended the scheme and replaced it with the Renewable
Energy Target (RET). An increase target of 45,000 GWh by 2020 was introduced instead of
9,500 GWh in 2010 and the solar credit scheme was put in place (Parliament of Australia
2012). However, immediately after the 2009 legislation, the REC prices fell due to the
intricacies and practicalities of the new scheme, hence threatening investment in large scale
renewable energy projects (Parliament of Australia 2012). The government amended the
RET legislation to a Large Scale Renewable Energy Target scheme (LRET) and a Small
Scale Renewable Energy Target scheme (SREs) following a series of review and consultation
papers.
2.3 Renewable Energy Target
The Renewable Energy Target scheme requires a production of 20% of Australia’s electricity
from renewable energy sources by 2020 (Australian Government Clean Energy Regulator,
2012). In order to achieve the target, the Australian government has set annual targets of the
scheme and requires electricity retailers or wholesale purchasers to meet those targets. The
main aim of the target is to encourage additional generation of electricity from renewable
energy sources, reduced greenhouse gases emissions and ensure that the renewable energy
sources are ecologically sustainable (Australian Government Clean Energy Regulator, 2012).
This is done through the creation of online certificates known as Renewable Energy
Certificates (REC) achieved by renewable energy sources based on the amount of electricity
generated (by a renewable energy power station), displaced by a solar water heater or by
placing a legal obligation on liable entities to purchase and surrender a certain amount of
these certificates annually (Australian Government Clean Energy Regulator, 2012). This
mechanism has boosted the number of renewable energy installations and by the end of 2011,
around 13,700 GWh of electricity was generated from renewable energy sources and more
Page 24
PEC 624 MSc in Renewable Energy Dissertation 2012
13
than 1,329,000 solar water heaters were installed (Australian Government Clean Energy
Regulator, 2012). Since the passage of a new legislation on 24th
of June 2010, two types of
schemes now exist namely the LRET and SRES. The requirements of both schemes are
defined in the Renewable Energy Act 2000 and the Renewable Energy Regulations 2001.
2.3.1 Large Scale Renewable Energy Target scheme (LRET)
The Large-scale Renewable Energy Target has a target of 41,000 giga-watt hours (GWh) by
2020 and is only applicable to large-scale renewable energy projects (Australian Government
Clean Energy Regulator, 2012). The large scale renewable energy target scheme provides
financial incentive for the development of renewable energy power stations by legislating
demand for large scale generation certificates (LCGs) whereby one LGC is equivalent to 1
MWh of electricity produced. Figure 8 shows the large scale generation certificate market.
Figure 8: Large Scale generation certificate market
Source: (Australian Government Clean Energy Regulator, 2012)
Page 25
PEC 624 MSc in Renewable Energy Dissertation 2012
14
The LRET scheme specifies the amount of energy to be generated by the power stations. The
annual targets for 2011-2020 are shown in the Figure below.
Figure 9: Annual Targets for 2011-2020
Source: (Australian Government Clean Energy Regulator, 2012)
The scheme places a legal requirement upon liable entities to purchase a set number of LCGS
who in turn purchase the LCGs directly from the renewable energy power stations or from an
agent who deals with the LCGs. The LCGs are surrendered to the clean energy regulator and
consequently in the REC registry with the price negotiated between the concerned parties
outside the REC registry. The price varied between $10- 20 in the past (Australian
Government Clean Energy Regulator, 2012). In case a liable entity is unsuccessful in
surrendering the required number of certifies, a fine of $65 per certificate is applied
(Australian Government Clean Energy Regulator, 2012). LCGS can also be surrendered
voluntarily at any time by liable entities, owners of LCGS and any other person or
organisation. This creates further demand in the market of renewable energy.
2.3.2 Small Scale Renewable Energy scheme (SRES)
The Small-scale Renewable Energy Scheme has a theoretical target of 4000 GWh annually
and is applicable only to small-scale or household installations (Australian Government
Clean Energy Regulator, 2012). The main objective of this scheme is to encourage small
Page 26
PEC 624 MSc in Renewable Energy Dissertation 2012
15
scale installations such as solar water heaters through legislating demand for small scale
technology certificates (STCs).
2.3.3 Administration of the Renewable Energy Target
Until April 2012, the Renewable Energy Act 2002 and Renewable Energy Regulations 2001
were administered by the Office of the Renewable Energy Regulator which was a statutory
agency under the department of Climate Change and Energy Efficiency. After this date, the
Acts came into the responsibility of the Clean Energy Regulator who is also responsible for
the administration of the Renewable Energy Target, the Carbon Pricing mechanism, the
National Greenhouse and Energy Reporting system and the Carbon Farming initiative. The
responsibility of the clean energy regulator is as follows:
Maintains several registers such as accredited power stations, small scale technology
certificates
Registers both certificates and manages the REC registry and STC clearing house.
Monitors compliance with the Act
Communicates the Act and its regulations
Updates and maintains the register of solar water heaters
Inspect the small RE scale technologies for which certificates have been created
Maintains and updates the register of solar water heaters
POWERS AND COMPLIANCE
The clean energy regulator also has the powers to prosecute any liable entity in case of non-
compliance with the requirements of the Act. This includes measures such as civil penalty
orders, enforceable undertakings, injunctions, fines, suspensions of registry accounts and
Page 27
PEC 624 MSc in Renewable Energy Dissertation 2012
16
public naming of staff. All participants in both schemes can also be audited any time by the
Clean Energy Regulator.
2.4 Small Scale technology certificates (STCs)
Small Scale technology certificates (as mentioned before) are a tradable commodity gained
by installing renewable energy systems such as solar water heaters and heat pumps under the
federal government Small Scale Renewable Energy scheme. The number of STCs gained
depends on the amount of power generated by small scale renewable energy system or power
displaced by the solar water heater or heat pump over the course of its lifetime whereby one
STC equals to one MWh of electricity generated or displaced. The number of STCs gained
depends on the capacity, location, type of system and eligibility for solar credits. STCS are
created online in the REC registry. Fig 10 shows an STC entry in the REC registry database.
Figure 9: STC entry in REC registry database
Source: (Australian Government Clean Energy Regulator, 2012)
Page 28
PEC 624 MSc in Renewable Energy Dissertation 2012
17
2.4.1 Eligibility
Solar water heaters or heat pump installations are eligible for the STCs if the system is new
and listed in the register of solar water heaters managed by the clean energy regulator
(Australian Government Clean Energy Regulator, 2012). Small scale solar, wind and hydro
systems are eligible if the system is new and its components are listed in the Clean Energy
Council list of accredited components. Moreover, the system should be installed by a Clean
Energy Council accredited installer on an eligible premise and it should comply with all
local, state and federal requirements.
2.4.2 Solar credits
Solar Credits is a mechanism which increases the number of STCs created through the
installation of small scale RE systems by multiplying the number of certificates that the
system is eligible to. The scheme has been able to generate up to five STCs per megawatt-
hour of electricity produced. Solar credit mechanism applies to the first 15 KW of on-grid
capacity installed on an eligible location or to the first 20 KW of capacity for off-grid system
(Parliament of Australia 2012). For bigger units, each megawatt-hour generated from the
extra capacity will gain only the standard 1 to 1 rate of SREC creation. The SREC 'multiplier'
was set at five until 2011, and then dropped to three on 1 July 2011 and by one for each year
after that until the Solar Credits scheme ends in 2013 (Clean Energy Regulator, 2012). The
government has recently announce that the SREC ‘multiplier’ will drop to one on the 1st of
January 2013 (Australian Government Clean Energy Regulator, 2012).
Page 29
PEC 624 MSc in Renewable Energy Dissertation 2012
18
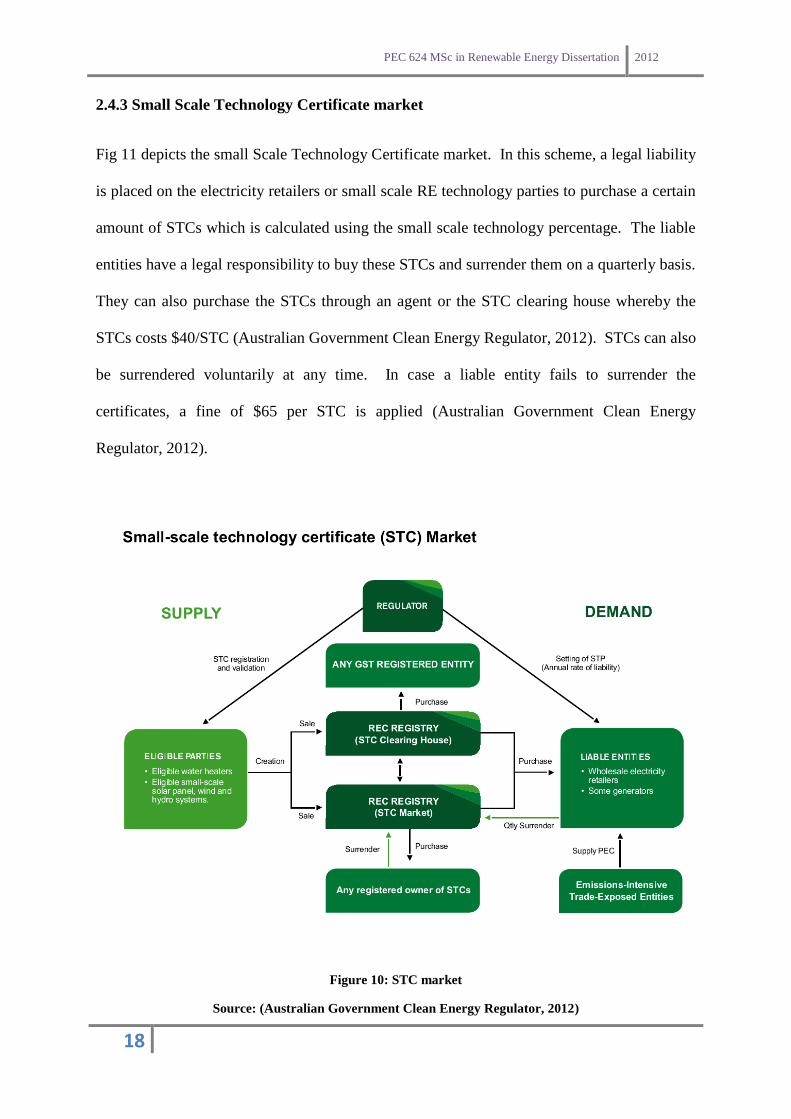
2.4.3 Small Scale Technology Certificate market
Fig 11 depicts the small Scale Technology Certificate market. In this scheme, a legal liability
is placed on the electricity retailers or small scale RE technology parties to purchase a certain
amount of STCs which is calculated using the small scale technology percentage. The liable
entities have a legal responsibility to buy these STCs and surrender them on a quarterly basis.
They can also purchase the STCs through an agent or the STC clearing house whereby the
STCs costs $40/STC (Australian Government Clean Energy Regulator, 2012). STCs can also
be surrendered voluntarily at any time. In case a liable entity fails to surrender the
certificates, a fine of $65 per STC is applied (Australian Government Clean Energy
Regulator, 2012).
Figure 10: STC market
Source: (Australian Government Clean Energy Regulator, 2012)
Page 30
PEC 624 MSc in Renewable Energy Dissertation 2012
19
2.4.4 Management of certificates
2.4.4.1 REC registry
The REC registry available at www.rec-registry.gov.au is an internet based registry system
which facilitates the creation, registration, transfer, surrender and tracking of LGCs and
STCs. It also provides access to the STC clearing house and maintains various public
registers that are detailed in the ACT. Both certificates must be created in the REC registry
before they can be surrendered or traded and usually require a fee. The REC registry is also
available for public access.
2.4.4.2 STC clearing house
The STC clearing house facilitates the exchange of only STCs between traders at a fixed
price of $40/STC and can be accessed through the REC registry with proof of identity
verification. STCs must first be created in the REC registry and once validated they can be
listed for sale in the STC house transfer list regardless of whether any buyers have
registration for purchasing the STCs. STCs can even be purchased when there is none listed
in the transfer list. In this case, the STCs are traded like ordinary STCs and are replaced once
they are available for sale in the STC clearing house. The status of the STC clearing house
transfer list is updated every hour and can be accessed by the public through the internet via
the link www.rec-registry.gov.au/clearingHouseTransferList.shtml.
Page 31
PEC 624 MSc in Renewable Energy Dissertation 2012
20
2.5 Methodology for calculating STCs
Solar water heaters and heat pump water are eligible under the SRES only if they are listed in
the register of solar water heaters. The STC entitlements for all models listed on Version 14,
15 and 16 of the Register must be calculated using the STC methodology in the Legislative
Instrument F2012L00591. The Legislative Instrument (Renewable Energy regulations 2001)
is available on the Common law website at
http://www.comlaw.gov.au/Details/F2012L00591. The methodology for determining the
number of STCs that can be earned by a solar water heater or heat pump is based on the
Australian Standards AS/NZS 4234:2008 and AS/NZS 4234:2008 Amendments 1 & 2 with
additional requirements specified in this document. Small solar water heaters are to be rated
for climate zones 1 to 4 whereas heat pump water heaters are to be rated for climate zones 1
to 5 based on the five heat pump climate zones HP1-Au to HP5-Au specified in AS/NZS
4234:2008 and AS/NZS 4234:2008 Amendments 1 & 2.
The methodology is as follows:
1. The ORER TRNSYS deck files (available at: www.orer.gov.au/forms/technical-swh.html)
which is also set out in the TRNSYS Modelling Guidelines in Part 4 of the Instrument are
formatted using version 15 to 16 of the TRNSYS computer modelling package.
2. The total annual auxiliary energy (MWh/Y) for the small water heaters or heat pump is
calculated using the TRNSYS computer modelling package. The TRNSYS input
parameters are:
Solar collector slope = 20°.
Solar collector azimuth = 45°.
Page 32
PEC 624 MSc in Renewable Energy Dissertation 2012
21
For the climatic zones, the weather data is downloaded from the ORER website
through the following link (www.orer.gov.au/forms/technical-swh.html).
An appropriate hot water load is selected for the small solar water heater (SWH)
or heat pump that uses ambient air (ASHP).
3. (a) For small solar hot water systems other than gas boosted solar hot water systems and
heat pumps , the total annual auxiliary energy used by the small SWH or ASHP is
subtracted from the energy use of the reference electric water heater in AS/NZS
4234:2008 supplying the same load to determine the displaced energy.
(b) For gas boosted SWHs, the displaced energy is calculated by using the following
formula as defined in the Appendix G of Amendment 1 to AS/NZS 4234:2008 to
determine the displaced energy.
Whereby,
Br is the annual electrical energy use of a reference electric heater in MJ/y
Bc is the annual electrical energy use by auxiliary equipment in MJ/y as calculated by
TRNSYS
ηref is the reference gas water heater thermal efficiency
Bg is the annual gas use by solar gas booster in a solar water heater (MJ/y) as calculated
by TRNSYS
A full version of the document is available in Appendix 2.
Page 33
PEC 624 MSc in Renewable Energy Dissertation 2012
22
4. The displaced energy is converted to MWh/y.
5. The displaced energy in MWh/y is multiplied by 10 to determine the 10 year MWh
savings.
6. The ten year MWh savings is then rounded to the nearest lower integer which is the
number of STCs created for the small solar water heater or heat pump in the relevant
zone.
A full version of the Methodology is provided in Appendix 1
2.5.1 Australian Standards AS/NZS4234:2008. Heated Water Systems - Calculation of
energy consumption
This Standard was prepared by the Standards Australia Committee CS/28 on Solar Water
Heaters. The standard sets out a method of determining the yearly performance of domestic
solar and heat water pump heaters. The standard uses a mathematical model known as the
TRNSYS simulation program for calculating the yearly performance of domestic solar and
heat water pump heaters. The Standard also defines a procedure for evaluating the
performance of conventional domestic water heaters so that the energy savings of solar and
heat pump water heaters can be evaluated relative to conventional water heaters operated
under the same annual load. The procedure set out in the standards is applicable to solar
water heaters with integral boosting or preheating into a conventional water heater and to heat
pump water heaters. This includes systems such as single tank solar water heaters with
electric or gas in tank boosting, solar preheater in series with instantaneous electric or gas
booster or with a conventional storage water heater and to heat pump water heaters. The
performance evaluation procedure defined in this Standard has been designed to provide a
Page 34
PEC 624 MSc in Renewable Energy Dissertation 2012
23
means of evaluating the annual performance of solar and heat pump water heaters and to
provide a means for quickly evaluating the performance of a series of products. A complete
version of the standard is provided in Appendix 1.
2.5.2 TRNSYS Simulation program
TRNSYS is an energy simulation program used in the field of Renewable Energy engineering
and is used to simulate the behaviour of transient systems. The principle of operation of the
program is to simulate the performance of the entire system by breaking it down into
individual black box components (Duffy et al 2009). The software was developed at the
University of Wisconsin and was originally used to simulate the performance of solar hot
water systems (http://sel.me.wisc.edu/trnsys/). TRNSYS is a flexible energy simulation
software package by facilitating the addition of mathematical models, the available add-on
components, and the ability to interface with other simulation programs (Duffy et al 2009).
TRNSYS has been used extensively to simulate solar energy applications, conventional
buildings, and even biological processes. TRNSYS is commercially available since 35 years
and still remain a flexible, component based software program for both researchers and
practitioners in the field of Energy.
TRNSYS simulations are also used to calculate the number of STCs earned by the systems
under the ERET scheme in Australia (Australian Government Clean Energy Regulator,
2012). The STC values are based on the energy saved by solar hot water systems compared
to standard hot water systems. Moreover, TRNSYS simulations have been used to determine
the amount of subsidy schemes which require a minimum solar contribution or solar fraction
before qualifying for such subsidies.
Page 35
PEC 624 MSc in Renewable Energy Dissertation 2012
24
CHAPTER 3 METHODOLOGY
3.0 Introduction
This section summarises the steps towards carrying out the project. The methodology
adopted in this project is consistent with the AS4234 as described before in the previous
chapter. The project involved the use of the TRNSYS 15 simulation program to evaluate the
performance of a number of solar water heating systems.
3.1 Inputs for the simulation
The sample TRNSYS deck files (Version 15) provided at the Clean Energy Regulator
website was downloaded through the link http://ret.cleanenergyregulator.gov.au/Forms-and-
Publications/Forms/Application-for-inclusion-in-the-register-of-solar-water-heaters.
The files provided include:
o Weather data. The weather data used for the simulation is the hourly Typical
Meteorological Year records Year (TMY) on the following variables (1) global
horizontal radiation (2) Ambient temperature (3) Wet bulb temperature (4) Wind
speed (5) Cloud cover (6) Beam irradiation at Alice spring, Melbourne,
Rockhampton and Sydney locations which are representative locations of the four
zones. Figure 13 shows the four zones and Table 1 shows the TMY data
representative for each climate zone.
o Include files. These files provide common inputs to all simulations and a link to the
weather files.
Page 36
PEC 624 MSc in Renewable Energy Dissertation 2012
25
o Standard System Input files. These files, often called the decks, provide the code
for modelling hot water systems. These files describe the systems to be modelled
and the simulation parameters. The systems covered include the following:
Contain a description of the following systems:
Figure 11: Systems covered in the decks files
Source: AS/NZS 4234:2008
Table 1: Weather Zones
Source: AS/NZS 4234: 2008
Page 37
PEC 624 MSc in Renewable Energy Dissertation 2012
26
Figure 12: Climate Zones
Source: AS/NZS 4234: 2008
3.2 Scope of the project
This project evaluated the performance of the pumped instantaneous gas solar water heater
and the thermosyphon gas solar water heater for zone 3 and 4 only. This covers most of the
southern half of Australia and includes the effects of the two different climate zones.
Page 38
PEC 624 MSc in Renewable Energy Dissertation 2012
27
3.3 Performance evaluation
TRNSYS 15 was used to evaluate the annual performance of the two solar water heaters in
the two different zones.
3.3.1 Standard operating conditions
AS/NZS 4234: 2008 defines two standardised collector installation conditions either of which
can be used to determine the annual performance of solar water heaters. Table 2 shows the
two standardised collector installation conditions.
Table 2: Standardised collector installation conditions
Source: AS/NZS 4234: 2008
The standard operating conditions assumed for the project were consistent with the STC
calculation methodology namely:
Solar Collector inclination: 200
Solar collector Azimuth: 450
Page 39
PEC 624 MSc in Renewable Energy Dissertation 2012
28
Hot water thermal Energy Loads
Table 3: Peak Daily Thermal Energy Loads for Australia
Source: AS/NZS 4234: 2008
For this project a medium system peak load system is chosen as the standard solar water
heaters’ tank capacity provided in the sample deck files is for Medium and Large loads.
The hourly load is determined by the following equation:
Hourly load = Peak daily load × seasonal load multiplier ×daily load multiplier
Table 4 and 5 shows the daily load multiplier and seasonal load multiplier respectively
Table 4: Daily load multiplier
Source: AS/NZS 4234: 2008
Page 40
PEC 624 MSc in Renewable Energy Dissertation 2012
29
Table 5: Seasonal load multiplier
Source : AS/NZS 4234: 2008
3.3.2 Component testing
The components being tested for each type of solar water heater is shown in the table below:
Table 6 Components tested
Pumped instantaneous gas water heater
components
Thermosyphon gas solar water heater
components
1. Collector 1. Collector
2. Connecting pipes 2. Connecting pipes
3. Solar tank 3. Solar tank
4. Pump & Pump controller 4. Pipe between tank and gas booster
5. Pipe between tank and gas booster 5. Instantaneous gas booster
6. Instantaneous gas booster
Page 41
PEC 624 MSc in Renewable Energy Dissertation 2012
30
Figure 13: Pumped instantaneous gas water heater components
Page 42
PEC 624 MSc in Renewable Energy Dissertation 2012
31
Figure 14: Thermosyphon gas solar water heater components
Page 43
PEC 624 MSc in Renewable Energy Dissertation 2012
32
3.3.3 Displaced energy calculation
The solar water heater energy savings relative to a conventional water heater was calculated
by the following equation as defined in AS/NZS 4234: 2008:
Whereby,
Br is the annual electrical energy use of a reference electric heater in MJ/y (Refer to table 7
and 8)
Be is the annual electrical energy use by auxiliary equipment in MJ/y as calculated by
TRNSYS
ηref is the reference gas water heater thermal efficiency (78.8%)
Bg is the annual gas use by solar gas booster in a solar water heater (MJ/y) as calculated by
TRNSYS
Based on the value of the displaced energy, the number of STCs was determined where 1
STC equals to 1 MWh of electricity produced.
Table 7: Medium and Large loads Reference Electric Water Heater in Australia
Source: AS/NZS 4234: 2008
Page 44
PEC 624 MSc in Renewable Energy Dissertation 2012
33
Table 8: Energy consumption of reference solar water heaters in Australia
Source: AS/NZS 4234: 2008
3.4 Presentation of results
For the standard base systems considered in this project, as supplied in the sample deck files,
the performance shall be reported for the two zones in the manner as shown in the following
tables:
Table 9 System performance result Summary (System inputs)
Month Time Gi (KJ) Ta
Jan
Feb
March
April
May
June
July
Aug
Sep
Oct
Nov
Dec
Page 45
PEC 624 MSc in Renewable Energy Dissertation 2012
34
Table 10 System performance result Summary (System outputs)
Month Time Load (KJ)
Gas energy
used from gas
booster
booster(KJ)
Pump+gas booster
electricity
consumption (KJ)
Jan
Feb
March
April
May
June
July
Aug
Sep
Oct
Nov
Dec
3.4.1 Sensitivity analysis
A sensitivity analysis was also conducted whereby the input parameters for the different
components of the two base systems as provided in the deck files were varied by +/- 10% and
the STCs were calculated. The analysis was performed for both zone 3 and zone 4. Table 8
&9 shows the different product parameters of the solar system considered with the base case
values. The percentage change in STC was then calculated through the following equation
% change in STC = S0-S/So
Where,
S0 is the original value of STC (to one decimal place)
S is the STC calculated (to one decimal place)
The values of the STCs were calculated to one decimal place as per the Clean Energy
Regulator requirements.
Page 46
PEC 624 MSc in Renewable Energy Dissertation 2012
35
3.4.2 Presentation of results
The results obtained (% change in STC obtained while changing the different product
parameters by +/-10%) were summarised according to their component.
Table 11: Product parameters for pumped instantaneous solar water heater
SYMBOLS BASE CASE VALUES
1.Collector
Acol 1.8 collector area in m2
a1 0.7 collector efficiency
a2 5*3.6 collector efficiency
a3 0.02*3.6 collector efficiency
b 0.06 collector efficiency
2. Connecting pipes
dpipei 0.01 collector inlet pipe inlet diameter, m
Thk_insull 0.01 insulation thickness in m
LP1, LP2 10 length of collector inlet pipe in m
LP2 10 length of collector outlet pipe in m
Kinsull 0.040*3.6 conductivity of insulation material
3. Solar tank
Voltot 315 Total volume in L
Volcolret 155
Volume above flow input from
collector in L
Volcolout 315
Volume above flow outlet to collector
in L
Volcold 315 Volume above cold water inlet in L
dia 0.59 Tank inner diameter in m
tnk_loss 2.93*1.1 Heat loss in KWh/d
t_wall 0.003 Thickness of wall in m
K_wall 50*3.6 Conductivity of wall, w/m.K
4. Pump& Pump
Controller
PFLOW 1.5*60 Pump flow rate in l/h
fpar 0.5
Fraction of pump electrical input
power converted to fluid thermal
energy
PPOWER 28*3.6
Pump input power consumption in
kJ/h
TON, TOFF 10,1
day time pump controller differential
temperature set points
Page 47
PEC 624 MSc in Renewable Energy Dissertation 2012
36
SYMBOLS BASE CASE VALUES
Ton_f, TOFF_f 2,4
Freeze protection pump controller set
points
5. Pipe between tank
and gas booster
Dpipe3 0.010 Diameter of pipe in m
Lpipe3 5.0 Length of pipe in m
Thk_insul3 0.01 Thickness of insulation in m
k_insul3 0.040*3.6
Thermal conductivity of insulation,
w/m.K
6. Instantaneous gas
booster
effgas 0.8 thermal eff (frac)
Gascap 180*1000 gas burner capacity (kJ/h)
Startup_cap 0.5*1000 Start up capacity (kJ)
Eoperate 10*3.6 Electric power consumption (kJ/h)
Estdby 50*3.6 Electric power consumption (kJ/h)
Table 12: Product parameters for thermosyphon gas solar water heater
SYMBOLS BASE CASE VALUES
1. Collector
Acol 1.8 collector area in m2
a1, 0.7 collector efficiency
a2 5*3.6 collector efficiency
a3 0.02*3.6 collector efficiency
b 0.06 collector efficiency
nr 7 Number of risers per collector
Dr 0.012 Diameter of risers in m
Lr 1.8 Length of risers in m
Dh 0.024 Diameter of collector header tube in m
Lhr 1.072 Length of header tube per collector in m
Hsep 0.1
Vertical separation between collector
outlet and cold tank outlet in m
2. Solar tank
dia 5 Diameter of tank in m
VOLtot 270 Total volume in L
Hr 0.24
Height of collector return to tank above
the bottom of the tank in m
Haux1 0.25
Height of auxiliary element above the
bottom of the tank in m
Hth1 0.26
Height of thermostat above the bottom
of the tank in m
Page 48
PEC 624 MSc in Renewable Energy Dissertation 2012
37
SYMBOLS BASE CASE VALUES
tnK-loss 2.20 Heat loss in KWh/d
t_wall 0.003 Insulation thickness in m
k_wall 50*3.6
Thermal conductivity of insulation in
W/m.K
3. Connecting pipes
dpipe1 0.016 Collector inlet pipe inner diameter in m
Lpipe1 3.1 Length of collector inlet pipe in m
Lpipe2 1.1 Length of collector outlet pipe in m
NB1 3
Number of right angle bends (or
equivalent) in collector inlet pipe
NB2 3
Number of right angle bends (or
equivalent) in collector outlet pipe
thk_insul1 0.01 Insulation thickness in m
k_insul1 0.04*3.6
Thermal conductivity of insulation in
W/m.K
4. Pipe between tank
and gas booster
Dpipe3 0.0127 Diameter of pipe in m
Lpipe3 10 Length of pipe in m
Thk_insul3 0.01 Thickness of insulation in m
k_insul3 0.04*3.6
Thermal conductivity of insulation
W/m.K
5. Instantaneous gas
booster
effgas 0.8 thermal eff (frac)
Gascap 180*1000 gas burner capacity (kJ/h)
Startup_cap = 0.5*1000 Start up capacity (kJ)
Tset-gas 70 gas preheating temperature
Estdby 10*3.6 standby electric power (KJ/h)
Eoperate 50*3.6 operating electric power (KJ/h)
Page 49
PEC 624 MSc in Renewable Energy Dissertation 2012
38
CHAPTER 4 RESULTS & DISCUSSION
4.1 Introduction
This chapter shows the results that have been obtained from the TRNSYS software followed
by brief discussions.
4.2 Results
The following section summarises the results obtained for the two base systems as supplied in
the sample deck files.
4.2.1 Pumped instantaneous gas booster (Zone 3)
The number of STCs obtained was 24.2. The table below shows the detailed results obtained
from the software for the system in zone 3.
Table 13: Detailed results of pumped instantaneous gas booster in Zone 3, system inputs
Month Time Gi Ta
Jan 744 6.846E+05 2.309E+01
Feb 1416 5.731E+05 2.227E+01
March 2160 5.577E+05 2.237E+01
April 2880 4.734E+05 1.898E+01
May 3624 3.464E+05 1.457E+01
June 4344 3.363E+05 1.260E+01
July 5088 4.219E+05 1.131E+01
Aug 5832 4.812E+05 1.363E+01
Sep 6552 5.478E+05 1.666E+01
Oct 7296 6.656E+05 1.680E+01
Nov 8016 7.028E+05 1.993E+01
Dec 8760 7.491E+05 2.227E+01
SUM 8760 6.540E+06 2.145E+02
Page 50
PEC 624 MSc in Renewable Energy Dissertation 2012
39
Table 14: Detailed results of pumped instantaneous gas booster in Zone 3, system outputs
Month Time
Energy
from
collector
(KJ)
Load (KJ)
Amount of
gas consumed
from the gas
booster (KJ)
Amount of
Electricity
consumed by
gas the and
pump (KJ)
Jan 744 9.760E+05 8.245E+05 2.417+05 5.429E+04
Feb 1416 8.916E+05 8.512E+05 3.306 E+05 5.032E+04
March 2160 8.973E+05 1.001E+06 4.93E+05 5.461E+04
April 2880 7.967E+05 1.026E+06 6.641E+05 5.239E+04
May 3624 5.690E+05 1.119E+06 1.053+06 5.008E+04
June 4344 5.870E+05 1.140E+06 1.096E+06 5.036E+04
July 5088 7.003E+05 1.178E+06 1.019E+06 5.383E+04
Aug 5832 8.240E+05 1.178E+06 8.682E+05 5.447E+04
Sep 6552 9.350+05 1.140E+06 6.722E+05 5.308E+04
Oct 7296 1.066E+06 1.119E+06 4.963E+05 5.615E+04
Nov 8016 1.080E+06 1.026E+06 3.670E+05 5.557E+04
Dec 8760 1.125E+06 9.422E+05 2.036E+05 5.664E+04
SUM 8760 1.045E+07 1.255E+07 7.51E+06 6.416E+05
4.2.2 Pumped instantaneous gas booster (Zone 4)
The number of STC obtained was 20.6. The table below shows the detailed results obtained
from the software.
Table 15: Detailed results of pumped instantaneous gas booster in Zone 4 (System inputs)
Month Time Gi (KJ) Ta
Jan 744 7.731E+05 1.809E+01
Feb 1416 6.337E+05 2.189E+01
March 2160 5.481E+05 1.776E+01
April 2880 3.758E+05 1.662E+01
May 3624 2.783E+05 1.281E+01
June 4344 2.204E+05 1.059E+01
July 5088 2.653E+05 9.648E+00
Aug 5832 3.155E+05 1.163E+01
Sep 6552 3.863E+05 1.272E+01
Oct 7296 5.440E+05 1.410E+01
Nov 8016 6.156E+05 1.612E+01
Dec 8760 7.089E+05 1.745E+01
SUM 8760 5.665E+06 1.794E+02
Page 51
PEC 624 MSc in Renewable Energy Dissertation 2012
40
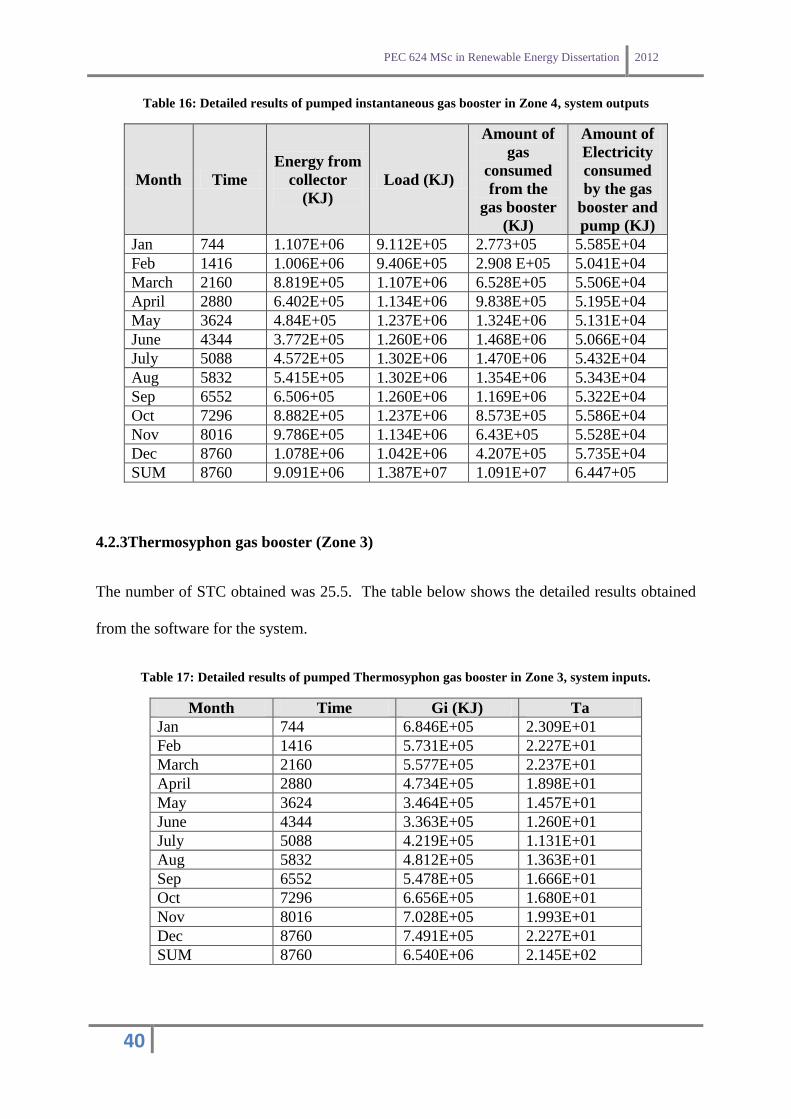
Table 16: Detailed results of pumped instantaneous gas booster in Zone 4, system outputs
Month Time
Energy from
collector
(KJ)
Load (KJ)
Amount of
gas
consumed
from the
gas booster
(KJ)
Amount of
Electricity
consumed
by the gas
booster and
pump (KJ)
Jan 744 1.107E+06 9.112E+05 2.773+05 5.585E+04
Feb 1416 1.006E+06 9.406E+05 2.908 E+05 5.041E+04
March 2160 8.819E+05 1.107E+06 6.528E+05 5.506E+04
April 2880 6.402E+05 1.134E+06 9.838E+05 5.195E+04
May 3624 4.84E+05 1.237E+06 1.324E+06 5.131E+04
June 4344 3.772E+05 1.260E+06 1.468E+06 5.066E+04
July 5088 4.572E+05 1.302E+06 1.470E+06 5.432E+04
Aug 5832 5.415E+05 1.302E+06 1.354E+06 5.343E+04
Sep 6552 6.506+05 1.260E+06 1.169E+06 5.322E+04
Oct 7296 8.882E+05 1.237E+06 8.573E+05 5.586E+04
Nov 8016 9.786E+05 1.134E+06 6.43E+05 5.528E+04
Dec 8760 1.078E+06 1.042E+06 4.207E+05 5.735E+04
SUM 8760 9.091E+06 1.387E+07 1.091E+07 6.447+05
4.2.3Thermosyphon gas booster (Zone 3)
The number of STC obtained was 25.5. The table below shows the detailed results obtained
from the software for the system.
Table 17: Detailed results of pumped Thermosyphon gas booster in Zone 3, system inputs.
Month Time Gi (KJ) Ta
Jan 744 6.846E+05 2.309E+01
Feb 1416 5.731E+05 2.227E+01
March 2160 5.577E+05 2.237E+01
April 2880 4.734E+05 1.898E+01
May 3624 3.464E+05 1.457E+01
June 4344 3.363E+05 1.260E+01
July 5088 4.219E+05 1.131E+01
Aug 5832 4.812E+05 1.363E+01
Sep 6552 5.478E+05 1.666E+01
Oct 7296 6.656E+05 1.680E+01
Nov 8016 7.028E+05 1.993E+01
Dec 8760 7.491E+05 2.227E+01
SUM 8760 6.540E+06 2.145E+02
Page 52
PEC 624 MSc in Renewable Energy Dissertation 2012
41
Table 18: Detailed results of Thermosyphon gas booster in Zone 3, system outputs
Month Time
Energy
from
collector
(KJ)
Load (KJ)
Amount of
gas
consumed
from the
gas booster
(KJ)
Amount of
Electricity
consumed
by the gas
booster
(KJ)
Jan 744 8.976E+05 8.239E+05 2.192+05 2.889E+04
Feb 1416 8.321E+05 8.507E+05 3.137 E+05 2.656E+04
March 2160 8.409E+05 1.101E+06 4.678E+05 2.988E+04
April 2880 7.544 E+05 1.026E+06 6.385E+05 2.938E+04
May 3624 5.331E+05 1.119E+06 1.044E+06 3.306E+04
June 4344 5.504E+05 1.14E+06 1.085E+06 2.938E+04
July 5088 6.621E+05 1.178E+06 9.967E+05 3.306E+04
Aug 5832 7.835E+05 1.178E+06 8.433E+05 3.306E+04
Sep 6552 8.866E+05 1.140E+06 6.425E+05 2.935E+04
Oct 7296 9.913E+05 1.119E+06 4.722E+05 2.971E+04
Nov 8016 1.003E+06 1.025E+06 3.410E+05 2.849E+04
Dec 8760 1.037E+06 9.415E+05 1.952E+05 2.880E+04
SUM 8760 9.772E+06 1.254E+07 1.091E+07 3.515+05
4.2.4 Thermosyphon gas booster (Zone 4)
The number of STC obtained was 21.8. The table below shows the detailed results obtained
from the software
Table 19: Detailed results of pumped Thermosyphon gas booster in Zone 4, system inputs
Month Time Gi Ta
Jan 744 7.731E+05 1.809E+01
Feb 1416 6.337E+05 2.189E+01
March 2160 5.481E+05 1.776E+01
April 2880 3.758E+05 1.662E+01
May 3624 2.783E+05 1.281E+01
June 4344 2.204E+05 1.059E+01
July 5088 2.653E+05 9.648E+00
Aug 5832 3.155E+05 1.163E+01
Sep 6552 3.863E+05 1.272E+01
Oct 7296 5.440E+05 1.410E+01
Nov 8016 6.156E+05 1.612E+01
Dec 8760 7.089E+05 1.745E+01
SUM 8760 5.665E+06 1.749E+02
Page 53
PEC 624 MSc in Renewable Energy Dissertation 2012
42
Table 20: Detailed results of Thermosyphon gas booster in Zone 4, system outputs
Month Time
Energy
from
collector
(KJ)
Load (KJ)
Amount of
gas
consumed
from the
gas booster
(KJ)
Amount of
Electricity
consumed
by the gas
booster
(KJ)
Jan 744 1.009E+06 9.106E+05 2.550+05 2.886E+04
Feb 1416 9.436E+05 9.401E+05 2.692E+05 2.619E+04
March 2160 8.276E+05 1.107E+06 6.250E+05 3.012E+04
April 2880 6.037 E+05 1.134E+06 9.678E+05 2.938E+04
May 3624 4.473E+05 1.257E+06 1.329E+06 3.306E+04
June 4344 3.414E+05 1.260E+06 1.485E+06 2.938E+04
July 5088 4.187E+05 1.302E+06 1.483E+06 3.306E+04
Aug 5832 5.064E+05 1.302E+06 1.354E+06 3.306E+04
Sep 6552 6.152E+05 1.260E+06 1.155E+06 2.938E+04
Oct 7296 8.359E+05 1.237E+06 8.333E+05 3.034E+04
Nov 8016 9.186E+05 1.134E+06 6.081E+05 2.912E+04
Dec 8760 9.976E+05 1.041E+06 3.934E+05 2.952E+04
SUM 8760 8.465E+06 1.386E+07 1.076E+07 3.5340+05
For simplicity in showing the results, the different solar water heating systems with their
original STCs values were grouped according to the following scenario:
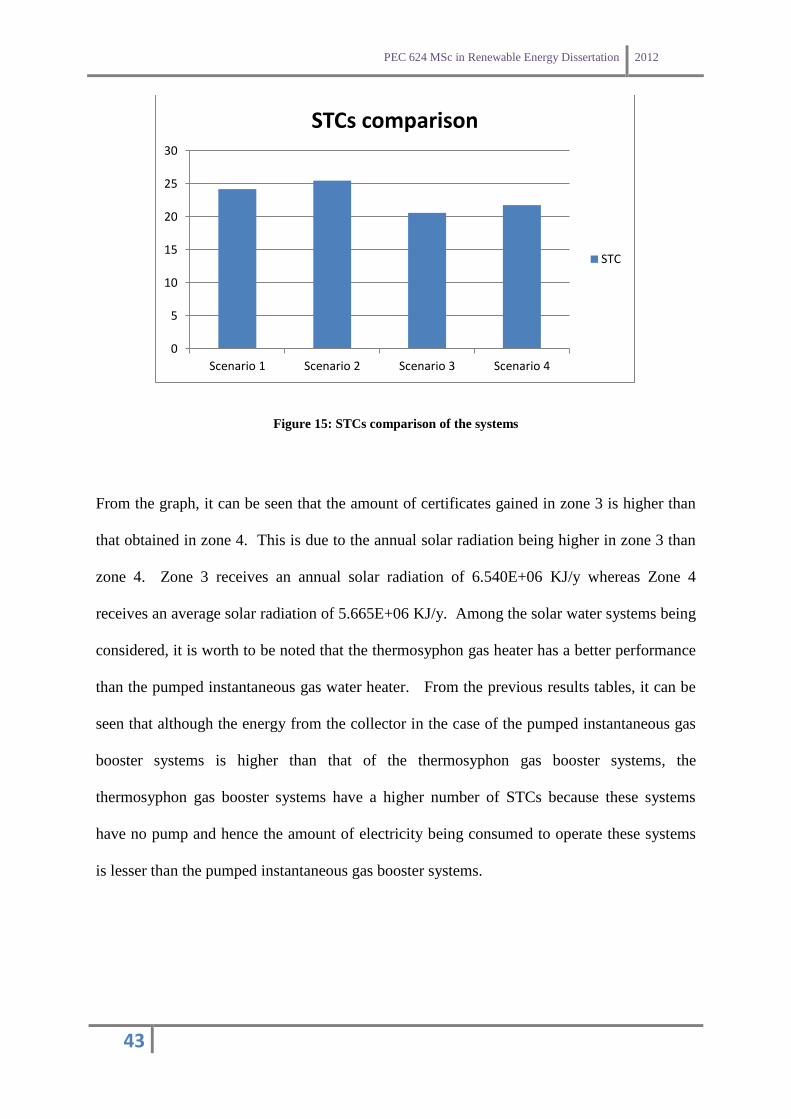
Scenario 1 Pumped instantaneous gas heater, Zone 3, STCs = 24.2
Scenario 2 Thermosyphon gas booster, Zone 3, STCs = 25.5
Scenario 3 Pumped instantaneous gas heater, Zone 4, STCs = 20.6
Scenario 4 Thermo syphon gas booster, Zone 4, STCs = 21.8
Page 54
PEC 624 MSc in Renewable Energy Dissertation 2012
43
Figure 15: STCs comparison of the systems
From the graph, it can be seen that the amount of certificates gained in zone 3 is higher than
that obtained in zone 4. This is due to the annual solar radiation being higher in zone 3 than
zone 4. Zone 3 receives an annual solar radiation of 6.540E+06 KJ/y whereas Zone 4
receives an average solar radiation of 5.665E+06 KJ/y. Among the solar water systems being
considered, it is worth to be noted that the thermosyphon gas heater has a better performance
than the pumped instantaneous gas water heater. From the previous results tables, it can be
seen that although the energy from the collector in the case of the pumped instantaneous gas
booster systems is higher than that of the thermosyphon gas booster systems, the
thermosyphon gas booster systems have a higher number of STCs because these systems
have no pump and hence the amount of electricity being consumed to operate these systems
is lesser than the pumped instantaneous gas booster systems.
0
5
10
15
20
25
30
Scenario 1 Scenario 2 Scenario 3 Scenario 4
STCs comparison
STC
Page 55
PEC 624 MSc in Renewable Energy Dissertation 2012
44
4.2.5 Results from sensitivity analysis
4.2.5.1 Scenario 1 and Scenario 3 (Pumped instantaneous gas booster system)
The following sections summarizes the results (% change in STCs) obtained by changing the
product parameters of the pumped instantaneous gas heater by +/-10%. These product
parameters have been grouped according to the components of the system. The results show
the changes in STCs for both zones.
Figure 17 shows the percentage change in STCs with respect to a change in the collector’s
parameters
Figure 16: Percentage change in STCs with respect to a change in the collector’s parameters by +/-10%
The Product parameters considered for the collector are the area of the collector and the
efficiency of the collector. It can be seen that a change of +/-10% in the collector parameters
have a significant change in the amount of certificates obtained (a change of 6-7%). The
efficiency of the collector is given by η= a1, a2, a3 and b. The values of a1, a2, a3 and b
were changed by +/-10% together and not individually.
6.2
0%
6.8
0%
-7.0
2%
-7.2
8%
5.7
9%
6.3
1%
-7.0
0%
-7.2
8%
-8.00%
-6.00%
-4.00%
-2.00%
0.00%
2.00%
4.00%
6.00%
8.00%
Scenario 1: +10%change
Scenario 3: +10%change
Scenario 1: -10% changeScenario 3: -10% change
1. Collector Acol a1,a2,a3,b
Page 56
PEC 624 MSc in Renewable Energy Dissertation 2012
45
Figure 18 shows the percentage change in STCs with respect to a change in the Connecting
pipes parameters. These pipes connect the tank to the collector array.
Figure 17: Percentage change in STCs with respect to a change in the connecting pipes parameters by +/-
10%
The Product parameters considered for the connecting pipes are the pipe inlet diameter, the
insulation thickness, the length of the collector inlet and outlet pipe and the conductivity of
the insulation material. Here, it can be seen that that a change of +/-10% in the connecting
pipes parameters have an almost insignificant change in the percentage change in STCs. It is
worth to be noted here the results involved calculating the STCs values to one decimal place
as per the Clean Energy Regulator requirements. Therefore, changes in the product
parameters that did not cause a change in STCs values to one decimal place have been
recorded as zero changes. However, this is not considered to be a major problem because the
project involves determining parameters that cause significant change in the STCs (greater
than 0.1 STCs)
-0.4
1%
0.0
0%
0.0
0%
0.0
0%
0.0
0%
0.0
0%
-0.4
1%
0.0
0%
-0.8
1%
-0.4
9%
0.4
1%
0.4
9%
-0.4
1%
0.0
0%
0.4
1%
0.0
0%
-1.00%
-0.80%
-0.60%
-0.40%
-0.20%
0.00%
0.20%
0.40%
0.60%
Scenario 1: +10%change
Scenario 3: +10%change
Scenario 1: -10% changeScenario 3: -10% change
2. Connecting pipes
dpipei Thk_insull LP1, LP2 Kinsull
Page 57
PEC 624 MSc in Renewable Energy Dissertation 2012
46
Figure 19 shows the percentage change in STCs with respect to a change in key solar tank
parameters.
Figure 18: Percentage change in STCs with respect to a change in the solar tank parameters by +/-10%
The Product parameters considered for the Solar tank are the total volume, the volume above
flow input from collector, the volume above flow outlet to collector, the volume above cold
water inlet, the tank inner diameter, the tank heat loss, the thickness of the wall and the
conductivity of the wall. Here, it can be seen that that a change of +/-10% in the inner
diameter of the tank, the thickness of the tank wall as well as the conductivity of the wall
have a negligible change in the percentage change STCs. A change of +/-10% of the heat
tank loss has an impact of nearly +/-1% in the STCs. It is worth to be noted here that
changing the volume above cold water inlet by 10% resulted in a percentage change in STCs
of 45-55%. However, this is an error as an increase in the volume above cold water means a
negative in height. In the standard pumped instantaneous gas system, the total volume, the
volume above flow input from collector, the volume above flow outlet to collector and the
volume above cold water inlet was 315 L. The height of the volume above cold water is:
Hcold = (Voltot-Volcold) /Voltot* height. Hence, increasing the Volcold by 10% but
0.0
0%
0.0
0%
0.0
0%
0.0
0%
43
.39
%
55
.83
%
0.0
0%
0.0
0%
-0.8
3%
-0.4
9%
0.4
1%
0.4
9%
-1.2
4%
-0.9
7%
1.2
4%
1.4
6%
0.0
0%
0.0
0%
0.0
0%
0.0
0%
-0.4
1%
0.0
0%
0.0
0%
0.0
0%
-0.4
1%
0.0
0%
0.0
0%
0.0
0%
-20.00%
0.00%
20.00%
40.00%
60.00%
Scenario 1: +10% change Scenario 3: +10% change Scenario 1: -10% change Scenario 3: -10% change
3. Solar tank
Volcolret Volcold dia tnk_loss t_wall K_wall
Page 58
PEC 624 MSc in Renewable Energy Dissertation 2012
47
keeping Voltot at the same value will give a negative Hcold, hence explaining the error in
simulation. Errors were also obtained when decreasing the total volume by 10% and
increasing the volume above flow outlet to collector by 10% for the same reasons. Hence,
these parameters were not shown in the graph (Refer to the results provided in Appendix 3)
Figure 20 shows the percentage change in STCs with respect to a change in pump and pump
controller.
Figure 19: Percentage change in STCs with respect to a change in the pump & pump controller
parameters by +/-10%
The Product parameters considered for the pump & pump controller are the pump flow rate,
the fraction of the pump electrical input power converted to fluid thermal energy, the pump
input power consumption, the day time pump controller differential temperature set points
and the freeze protection pump controller set points. It can be seen that that a change of +/-
10% in the pump & pump controller parameters such as the fraction of pump electrical input
power converted to fluid thermal energy, pump input power consumption, day time pump
controller differential temperature set points and freeze protection pump controller set points
have an almost insignificant change in the percentage change in STCs. The day time pump
-0.8
3%
-0.4
9%
0.8
3%
0.9
7%
0.0
0%
0.4
9%
-0.4
1%
0.0
0%
-0.4
1%
0.0
0%
0.0
0%
0.0
0%
-0.4
1%
0.0
0%
0.0
0%
0.0
0%
0.0
0%
0.0
0%
0.0
0%
0.0
0%
-1.00%
-0.50%
0.00%
0.50%
1.00%
1.50%
Scenario 1: +10% change Scenario 3: +10% change Scenario 1: -10% change Scenario 3: -10% change
4. PUMP & PUMP CONTROLLER
PFLOW fpar PPOWER TON, TOFF Ton_f, TOFF_f
Page 59
PEC 624 MSc in Renewable Energy Dissertation 2012
48
controller differential temperature set points and the freeze protection pump controller set
points were changed by +/-10% together and not individually. A change of +10% in the
pump flow rate have an impact of -1% in the STCs. This is due to the fact that an increase in
the pump flow rate implies that more water is being heated up to meet the load, hence
decreasing the STCs gained.
Figure 21 shows the percentage change in STCs with respect to a change in the pipe between
the tank and the gas booster.
Figure 20: Percentage change in STCs with respect to a change in the parameters of the pipe between the
tank and gas booster by +/-10%
The Product parameters considered for the pipe between the tank and the gas booster are the
diameter of the pipe, the length of the pipe, the thickness of insulation of the pipe and the
thermal conductivity of insulation. Here, it is again seen that that a change of +/-10% in the
pipe parameters have an almost insignificant change in the percentage change in STCs.
-0.4
1%
0.0
0%
0.4
1%
0.0
0%
-0.4
1%
0.0
0%
0.0
0%
0.0
0%
0.0
0%
0.0
0%
0.0
0%
0.0
0%
0.0
0%
0.0
0%
0.0
0%
0.0
0%
-0.60%
-0.40%
-0.20%
0.00%
0.20%
0.40%
0.60%
Scenario 1: +10% change Scenario 3: +10% change Scenario 1: -10% change Scenario 3: -10% change
5. Pipe between tank and gas booster
Dpipe3 Lpipe3 Thk_insul3 k_insul3
Page 60
PEC 624 MSc in Renewable Energy Dissertation 2012
49
Figure 22 shows the percentage change in STCs with respect to a change in the parameters of
the instantaneous gas booster.
Figure 21: Percentage change in STCs with respect to a change in the parameters of the instantaneous gas
booster.
The product parameters considered for the instantaneous gas booster are the thermal
efficiency of the gas burner, the gas burner capacity, the start up capacity of the gas burner,
the gas preheating temperature, the standby electric power and operating electric power. It
can be seen that a 10% increase in the thermal efficiency of the gas booster increases the
STCs gained by 6% in Zone 3 and 9% in zone 4. This can be explained through the equation
used to calculate the displaced energy
An increase in the efficiency of the gas (ηref) means that less gas (less Bg) is being used to
heat up the water so as to meet the load, hence increasing the STCs gained. In the case of
pumped instantaneous gas booster in zone 3, an increase in the efficiency lowered the gas
consumption from 7.51E+06 KJ/y to 6.996E+06 KJ/y.
6.2
0%
8.7
4%
-6.2
0%
-10
.19
%
0.0
0%
0.0
0%
0.0
0%
0.0
0%
-1.6
5%
-1.9
4%
1.2
4%
2.4
3%
-0.4
1%
0.0
0%
0.4
1%
0.0
0%
-15.00%
-10.00%
-5.00%
0.00%
5.00%
10.00%
Scenario 1: +10% change Scenario 3: +10% change Scenario 1: -10% change Scenario 3: -10% change
6. Instantaneous gas booster
effgas Gascap Startup_cap = Eoperate,Estdby
Page 61
PEC 624 MSc in Renewable Energy Dissertation 2012
50
An increase in the start up capacity of the gas booster decreases the % change in STCs by
2%. In the case of pumped instantaneous gas booster in zone 3, an increase in the start up
capacity of the gas increases the gas consumption from 7.51E+06 KJ/y to 7.662E+06 KJ/y.
The gas preheating temperature and standby electric power and operating electric power have
negligible impact in the change in STCs. These values were changed were changed by +/-
10% together and not individually.
4.2.5.2 Scenario 2 and Scenario 4 (Thermosyphon gas booster system)
Figure 23 shows the percentage change in STCs with respect to a change in the parameters of
the collector.
Figure 22: Percentage change in STCs with respect to a change in the parameters of the collector
5.4
9%
5.5
0%
-5.8
8%
-6.4
2%
5.1
0%
5.0
5%
-5.4
9%
-5.9
6%
0.0
0%
0.0
0%
0.0
0%
0.0
0%
0.0
0%
0.0
0%
0.0
0%
0.0
0%
0.0
0%
0.0
0%
0.0
0%
0.0
0%
0.0
0%
0.0
0%
0.0
0%
0.0
0%
0.0
0%
0.0
0%
0.0
0%
0.0
0%
0.0
0%
0.0
0%
0.0
0%
0.0
0%
-10.00%
-5.00%
0.00%
5.00%
10.00%
Scenario 2: +10% change Scenario 4: +10% change Scenario 2: -10% change Scenario 4: -10% change
1. Collector
Acol a1,a2,a3,b nr Dr Lr Dh Lhr Hsep
Page 62
PEC 624 MSc in Renewable Energy Dissertation 2012
51
The product parameters considered for the collector are the collector area, the collector
efficiency, the number of risers per collector, the diameter of risers, the length of risers, the
diameter of collector header tube, the length of header tube per collector and the vertical
separation between collector outlet and cold tank outlet. Here, it is again seen that the
parameters sensitive to STC calculations are the area of the collector and the efficiency of the
collector. The efficiency of the collector is again given by η= a1, a2, a3 and b. The values of
a1, a2, a3 and b were again changed by +/-10% together and not individually. Changes of +/-
10% of these parameters have an impact of +/- 5.5-6.5% change in the STCs. The parameters
of the risers such as the diameter and the length as well as the parameters of the header tube
have insignificant impact in the percentage change in STCs.
Figure 24 shows the percentage change in STCs with respect to a change in the parameters of
the solar tank.
Figure 23: Percentage change in STCs with respect to a change in the parameters of the solar tank
The product parameters considered for the solar tank are the diameter of the tank, the total
volume of the tank, the height of collector return to tank above the bottom of the tank, the
height of auxiliary element above the bottom of the tank, the height of thermostat above the
bottom of the tank, the tank heat loss, the thickness of the wall and the Conductivity of the
1.1
8%
0.9
2%
-1.1
8%
-1.8
3%
0.0
0%
0.0
0%
0.0
0%
0.0
0%
0.0
0%
0.0
0%
0.0
0%
0.0
0%
0.0
0%
0.0
0%
0.0
0%
0.0
0%
0.0
0%
0.0
0%
0.0
0%
0.0
0%
-0.7
8%
-0.9
2%
0.7
8%
0.9
2%
0.3
9%
0.0
0%
0.0
0%
0.0
0%
0.0
0%
0.0
0%
0.0
0%
0.0
0%
-0.3
9%
-0.4
6%
0.3
9%
0.4
6%
-2.00%
-1.00%
0.00%
1.00%
2.00%
Scenario 2: +10%change
Scenario 4: +10%change
Scenario 2: -10% changeScenario 4: -10% change
2. Solar tank
dia VOLtot Hr Haux1 Hth1 tnK-loss K t_wall
Page 63
PEC 624 MSc in Renewable Energy Dissertation 2012
52
wall. The major parameters sensitive to the STCs calculation are the diameter of the tank and
the tank heat loss. A change of +/-10% of the heat tank loss has an impact of nearly +/-1% in
the STCs which was similar to that obtained in the case of the pumped instantaneous gas
solar water heater.
Figure 25 shows the percentage change in STCs with respect to a change in the parameters of
the Connecting pipes. The pipes connect the tank to the collector array.
Figure 24: Percentage change in STC with respect to a change in the parameters of the Connecting pipes.
The product parameters considered for the connecting pipes are the collector inlet pipe inner
diameter, the length of collector inlet pipe, the length of collector outlet pipe, the number of
right angle bends in the collector inlet pipe, the number of right angle bends in the collector
outlet pipe, the insulation thickness and the thermal conductivity of insulation. Here, it can
be seen that that a change of +/-10% in the connecting pipes parameters have an almost
insignificant change in the percentage change in STCs. Similar results were obtained in the
case of the pumped instantaneous gas solar water heater.
0.0
0%
0.0
0%
0.0
0%
0.0
0%
0.0
0%
0.0
0%
0.0
0%
0.0
0%
0.0
0%
0.0
0%
0.0
0%
0.0
0%
0.0
0%
0.0
0%
0.0
0%
0.0
0%
0.0
0%
0.0
0%
0.0
0%
0.0
0%
0.0
0%
0.0
0%
0.0
0%
0.0
0%
0.0
0%
0.0
0%
0.0
0%
0.0
0%
0.00%
20.00%
40.00%
60.00%
80.00%
100.00%
Scenario 2: +10% changeScenario 4: +10% change Scenario 2: -10% change Scenario 4: -10% change
3. Connecting pipes
dpipe1 Lpipe1 Lpipe2 NB1 NB2 thk_insul1 k_insul1
Page 64
PEC 624 MSc in Renewable Energy Dissertation 2012
53
Figure 26 shows the percentage change in STCs with respect to a change in the parameters of
the pipe between tank and the gas booster.
Figure 25: Percentage change in STC with respect to a change in the parameters of the pipe connecting
the tank and the gas booster.
The product parameters considered for the pipe between the tank and the gas booster are the
diameter of pipe, the length of pipe, the thickness of insulation of the pipe and the thermal
conductivity of insulation. Here, it can be seen that the major parameters sensitive to the
STCs calculation are the diameter as well as the length of the pipe. This can be explained
through an increase in transmission losses. However, the losses are minimized by the
insulation on the pipe; hence the impact is not significant.
-1.1
8%
-1.3
8%
1.1
8%
0.9
2%
-0.7
8%
-0.9
2%
0.7
8%
0.4
6%
0.3
9%
0.0
0%
0.0
0%
0.0
0%
0.0
0%
0.0
0%
0.3
9%
0.0
0%
-2.00%
-1.50%
-1.00%
-0.50%
0.00%
0.50%
1.00%
1.50%
Scenario 2: +10% change Scenario 4: +10% change Scenario 2: -10% change Scenario 4: -10% change
4. Pipe between tank and gas booster
Dpipe3 Lpipe3 Thk_insul3 k_insul3
Page 65
PEC 624 MSc in Renewable Energy Dissertation 2012
54
Figure 27 shows the percentage change in STCs with respect to a change in the parameters of
the instantaneous gas booster
Figure 26: Percentage change in STCs with respect to a change in the parameters of the instantaneous gas
booster.
The product parameters considered for the instantaneous gas booster are the thermal
efficiency of the gas burner, the gas burner capacity, the Start up capacity of the gas burner,
the gas preheating temperature, the standby electric and operating electric power
consumption of the gas burner. The major parameters sensitive to the STCs calculations are
the thermal efficiency of the gas which can be explained by a decrease in the amount of gas
being used and hence an increased in STCs. The gas preheating temperature set point is also
noted to have significant impact in the STCs calculations. Although this is an unusual result,
the amount of gas used by the gas booster was found to be sensitive to the gas preheating
temperature set point which could explain the impact on the percentage change STCS. In
the case of the Thermosyphon system in zone 3, an decrease in the gas preheating
temperature set point decreases the amount of gas used by the gas booster from 1.091E+07
KJ/y to 6.22 E+06 KJ/y and in the case of the system in zone 4, a decrease gas preheating
4.7
1%
7.8
0%
-5.4
9%
-9.6
3%
0.0
0%
0.0
0%
0.0
0%
0.0
0%
-1.1
8%
-2.2
9%
1.1
8%
1.8
3%
-9.0
2%
-9.6
3%
9.0
2%
9.6
3%
-0.3
9%
0.0
0%
0.3
9%
0.0
0%
0.0
0%
0.0
0%
0.0
0%
0.0
0%
-15.00%
-10.00%
-5.00%
0.00%
5.00%
10.00%
15.00%
Scenario 2: +10% change Scenario 4: +10% change Scenario 2: -10% change Scenario 4: -10% change
5. Instantaneous gas booster
effgas Gascap Startup_cap = Tset-gas Estdby Eoperate
Page 66
PEC 624 MSc in Renewable Energy Dissertation 2012
55
temperature set point decreases the amount of gas used by the gas booster from 1.076 E+07
KJ to 9.812 E+06 KJ/y
Page 67
PEC 624 MSc in Renewable Energy Dissertation 2012
56
CHAPTER 5 CONCLUSION AND FUTURE WORK
This project involved determining the performances of the pumped instantaneous gas booster
solar water heater and the thermosyphon gas water heater in zone 3 and 4 of Australia using
the TRNSYS simulation program. It also involved changing the input parameters of the two
systems and determining their impact on STCs calculations. As such, the results of the
simulation were very sensitive to errors in the input data. Errors were minimized by rigorous
cross checking in the input data files. The study did confirm the results expected. Also, any
unusual results obtained could be explained. After analysis of the data obtained in the study a
number of conclusions could be drawn.
(1) The amount of certificates gained in Zone 3 was found to be higher than Zone 4 due
to the annual solar radiation being higher in Zone 3 than zone 4. Zone 3 receives an
annual solar radiation of 6.540E+06 KJ/y whereas Zone 4 receives an average solar
radiation of 5.665E+06 KJ/y
(2) Thermosyphon gas booster system was found to obtain a higher number of STCS than
the pumped instantaneous gas booster system although the energy from the collector
in the case of the pumped instantaneous gas booster systems was higher than that of
the thermosyphon gas booster systems as these systems have no pump and hence the
amount of electricity being consumed to operate these systems is less than the
pumped instantaneous gas booster systems.
(3) The major parameters found to be sensitive in the STCs calculations were the area of
the collector, the efficiency of the collector as well as the efficiency of the gas in the
gas booster.
Page 68
PEC 624 MSc in Renewable Energy Dissertation 2012
57
(4) Input parameters such as the heat loss of the tank and the start up capacity of the gas
in the gas booster were found to have considerable impact in the STCs calculations.
(5) The effect of the gas preheating temperature set point on the STCs calculations was
found to be an unusual result. However, it could be explained by lesser amount of gas
being used in the gas booster.
Future work
It is recommended that a study is carried out whereby all the parameters affecting the
volume of the solar tank such as the volume above flow input from collector, the
volume above flow outlet to collector and the volume above cold water inlet be
modelled properly so as to minimise the error results obtained during the course of the
study and also to determine the sensitivity of the parameters of the volume of the solar
tank on the STCs calculations.
It is also recommended that a study is carried out to take into account all the other
zones (Zone 1 & 2) which have been omitted during the course of this study, due to a
limited timeframe, so as to get a broader and more realistic overview of the impacts of
climatic conditions on the STCs calculations.
A study can be carried out whereby the performances of other solar water heating
systems such as a heat pump, a thermosyphon solar water heater with an electric
booster and a pumped circulation solar water heater with in tank electric booster
system can be modelled and the sensitivity of the input parameters of these systems in
the STCs calculations could be determined.
Page 69
PEC 624 MSc in Renewable Energy Dissertation 2012
58
REFERENCES
Australian Bureau of Agricultural and Resource Economics. 2010. Australian energy
projections to 2029-2030 ABARE research report 10.02. Canberra: Australian Bureau of
Agricultural and Resource Economics
http://www.adl.brs.gov.au/data/warehouse/...abarebrs99014434/energy_proj.pdf .
Australian Government Clean Energy Regulator. 2012. The Renewable Energy Target
scheme. Australia: Australian Government Clean Energy Regulator
http://www.cleanenergyregulator.gov.au/Renewable-Energy-Target/Pages/default.aspx
Australian Government Common Law. 2012. Renewable Energy (Electricity) Regulations
legislative instrument 2001. Australia: Australian Government.
http://www.comlaw.gov.au/Details/F2012L00591
Australian Government Parliament. 2012. Mandatory Renewable Energy Target. Australia:
Parliament of Australia
http://www.aph.gov.au/About_Parliament/Parliamentary_Departments/Parliamentary_Librar
y/Browse_by_Topic/ClimateChange/Governance/Domestic/national/Mandatory
Australian Solar Energy Resource Assessment, Ch10. 2010.
http://adl.brs.gov.au/data/warehouse/pe_aera_d9aae.../aeraCh_10.pdf
Duffy, Matthew;Marion Hiller;David E. Bradley;Werner Keilhol and Jeff W. Thornton.
2009. TRNSYS-Features and Functionality for building simulation. Scotland: Eleventh
International IBPSA Conference. http://werner.keilholz.free.fr/articles/BS09_1950_1954.pdf
Enerdata. 2012. Global energy market review. http://www .enerdata.net/enerdatauk/
Energy Information Administration of the United States. 2010. China energy sector.
Washington DC: Energy Information Administration of the US.
http://www.eia.gov/countries/analysisbriefs/China/china.pdf
Energy Information Administration of the United States. 2009. International Energy
Outlook 2009. Washington DC: Energy Information Administration of the US.
http://www.eia.gov/forecasts/ieo/
http://www.sustainability.vic.gov.au/resources/documents/SHW_Factsheet_07.pdf
Page 70
PEC 624 MSc in Renewable Energy Dissertation 2012
59
SAI Global Standards Australia. 2012. AS/NZS 4234: 2008. Heated water systems –
Calculations of energy Consumption.
SAI Global Standards Australia. 2012. AS/NZS 4234: 2008/Amdt 1:2011. Heated water
systems – Calculations of energy Consumption.
SAI Global Standards Australia. 2012. AS/NZS 4234: 2008/Amdt 2:2011. Heated water
systems – Calculations of energy Consumption.
http://0www.saiglobal.com.prospero.murdoch.edu.au/online/autologin.asp
University of Wisconsin 2012. TRNSYS 17- A Transient system Simulation Program.
Madison :University of Wisconsin. http://sel.me.wisc.edu/trnsys/