i How should Tanzania use its natural gas? Citizens’ views from a nationwide deliberative poll Nancy Birdsall, Center for Global Development James Fishkin, Center for Deliberative Democracy at Stanford University Faraz Haqqi, Center for Global Development Abel Kinyondo, REPOA Mujobu Moyo, Center for Global Development Jennifer Richmond, Center for Global Development Justin Sandefur, Center for Global Development Grantee Final Report Accepted by 3ie: April 2017
Transcript
i
How should Tanzania use its natural gas? Citizens’ views from a nationwide deliberative poll
Nancy Birdsall, Center for Global Development
James Fishkin, Center for Deliberative Democracy at Stanford University
Faraz Haqqi, Center for Global Development
Abel Kinyondo, REPOA
Mujobu Moyo, Center for Global Development
Jennifer Richmond, Center for Global Development
Justin Sandefur, Center for Global Development
Grantee Final Report
Accepted by 3ie: April 2017
ii
Note to readers This grantee final report has been submitted in partial fulfilment of the requirements of grant TW8.1001 issued under Transparency and Accountability thematic window. This report is being published online as it was received. 3ie will produce a copy-edited and formatted version in our impact evaluation report series the near future. All content is the sole responsibility of the authors and does not represent the opinions of 3ie, its donors or its board of commissioners. Any errors and omissions are the sole responsibility of the authors. All affiliations of the authors listed in the title page are those that were in effect at the time the report was accepted. Any comments or queries should be directed to the corresponding author, Justin Sandefur, at [email protected].
Suggested citation: Birdsall, N, Fishkin, J, Haqqi, F, Kinyondo, A, Moyo, M, Richmond, J and Sandefur, J, 2017. How should Tanzania use its natural gas? Citizens’ views from a nationwide deliberative poll, 3ie Grantee Final Report. New Delhi: International Initiative for Impact Evaluation (3ie)
Funding for this impact evaluation was provided by 3ie’s donors, which include UK aid, the Bill & Melinda Gates Foundation and the Hewlett Foundation. A complete listing of all of 3ie’s donors is available on the 3ie website.
Acknowledgements This project was led by Nancy Birdsall, Mujobu Moyo, and Justin Sandefur from CGD, and Samuel Wangwe and Abel Kinyondo from REPOA, with assistance from James Fishkin and Alice Siu of Stanford University, and Bobby Fishkin of Reframe It Inc.1 Jennifer Richmond and Faraz Haqqi from CGD helped to organize data collection and all of the project logistics, and contributed enormously to the data analysis and writing of this report. Data collection was conducted by Economic Development Initiatives (EDI) in Bukoba, Tanzania. Special thanks to Amy Kahn and Resphicius Mitti from EDI for ensuring accurate and timely data. EDI also organized the daunting task of getting 400 randomly chosen survey respondents from across Tanzania to convene in Dar es Salaam on the same day. The overall project was guided behind the scenes by a high-level study group (listed below) convened by REPOA and CGD on several occasions in Dar es Salaam. The individual members of the group do not necessarily endorse the conclusions of this report, but we thank them for their guidance in the design of the poll.
Generous funding for the project was provided by the Bill and Melinda Gates Foundation, the International Initiative for Impact Evaluation (3ie), and the International Growth Centre (IGC). We are also grateful to the International Development Research Council (IDRC) for funding Ms. Moyo’s fellowship at CGD to bring this project to fruition. Study Group members
I. Dr. Nancy Birdsall, Center for Global Development II. Prof. Samual Wangwe, (previously) REPOA
III. Dr. Abel Kinyondo, REPOA IV. Mr. Ali Mufuruki, Infotech Investment Group Ltd. V. Prof. Chris Adam, Oxford University
VI. Mr. Edward Furaha, Tanzania Private Sector Foundation VII. Eng. Happiness Mgalula, President’s Office, Planning Commission
VIII. Eng. Norbert Kahyoza, Tanzania Ministry of Energy and Minerals IX. Prof. Ibrahim Lipumba, Chairman, CUF X. Mr. Innocent Bash, Tanzania Extractive Industries Transparency Initiative
XI. Hon. January Makamba, Chama Cha Mapinduzi XII. Dr. Jehovaness Aikaeli, University of Dar es Salaam
XIII. Prof. Joseph Semboja, UONGOZI Institute XIV. Dr. Mark Henstridge, Oxford Policy Management XV. Amb. Mwanaidi Maajar, REX Attorneys
XVI. Mr. Peter Bofin, Martello Research XVII. Mr. Rakesh Rajani, (previously) Twaweza
1 The Reframe It team provided advisory support services for the Deliberative Poll.
iv
XVIII. Mr. Aidan Eyakuze, Twaweza XIX. Mr. Silas Olan’g, Natural Resource Governance Institute XX. Hon. Zitto Kabwe, ACT
XXI. Eng. Emmanuel Jengo, Tanzania Chamber of Mines and Minerals
v
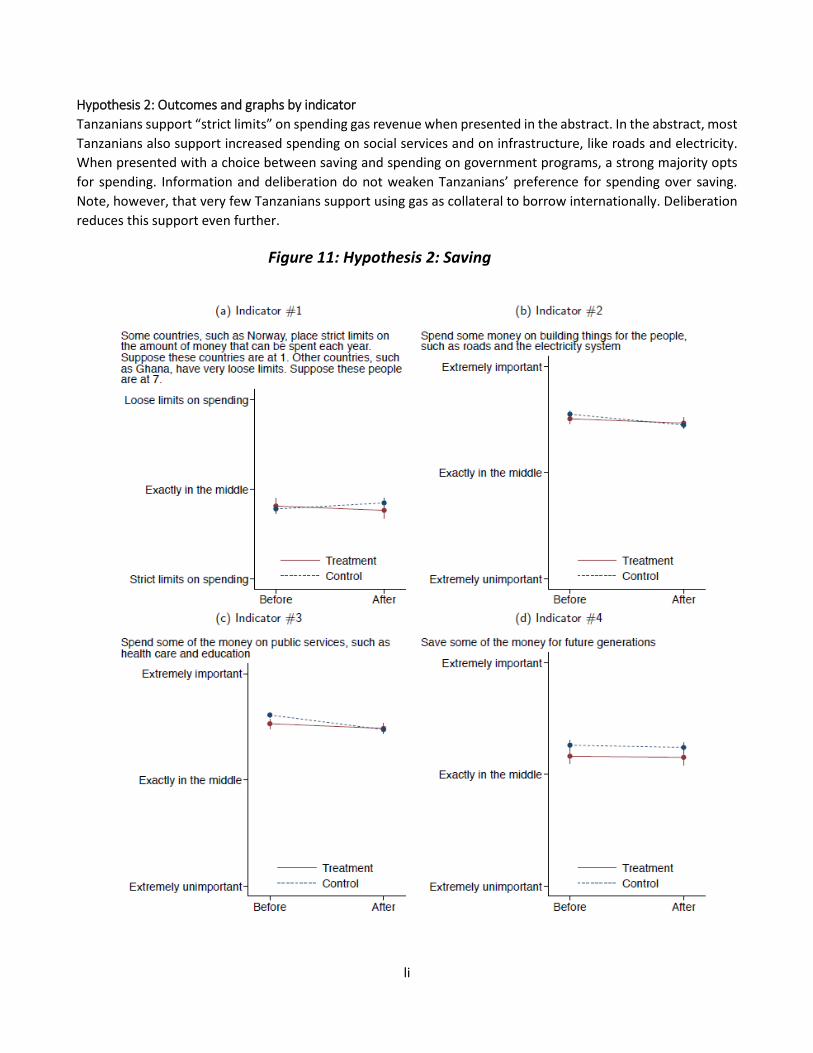
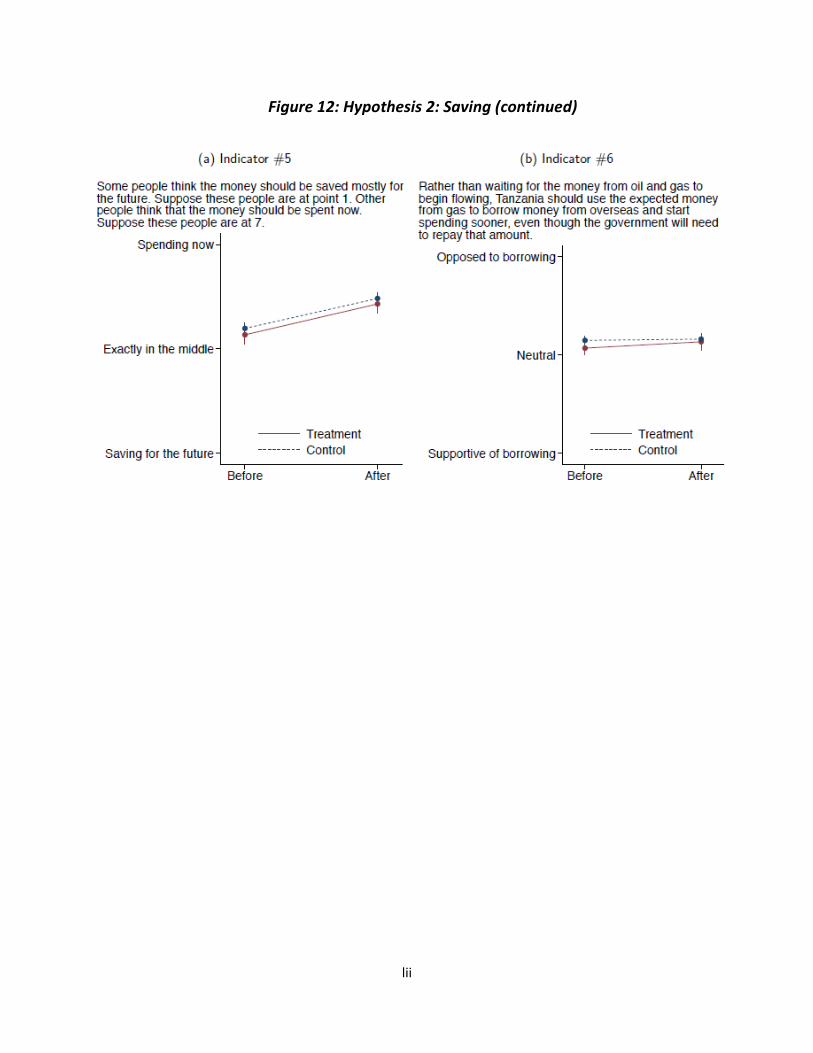
Abstract Public opinion is often treated as an obstacle to good governance in resource-rich developing countries, associated with populist policies and excess consumption. Can ordinary citizens in a low-income democracy make meaningful judgements about complex resource management issues? We report on a nationwide poll of voting-age adults in Tanzania, where large natural gas reserves were recently discovered. Results from a randomized experiment within our nationwide polling sample show that the combination of information and extended, structured, and participatory deliberation generated (i) a measurable increase in knowledge of the gas sector; (ii) increased support for sale of natural gas and reduced support for energy subsidies; (iii) no change in support for saving versus spending gas revenues; (iv) a sharp decline in support for direct cash distribution of resource rents to citizens; (v) increased support for spending on social services as opposed to infrastructure; and (vi) a marginally significant increase in support for transparency and oversight measures. Democratic deliberation appears to be the key to these changes; the information treatment alone produced no significant impacts, and impacts did not spill over onto individuals in the same community who did not participate in deliberation. As part of a second-order experiment to measure public accountability, we provided the citizens’ polling results to elites before polling them on a subset of the same questions. Our analysis indicates that elites demonstrate a tendency to align their views with public opinion on most major issues.
vi
Executive summary
Tanzania is preparing for a windfall of resource revenues from the country’s recently discovered natural gas. Previous research on the resource curse suggests that low-income countries are prone to corruption, conflict, opaque public management, and overdependence on resources with volatile international price fluctuations. One solution may be to amplify citizens’ voices within the country’s democratic system to create a channel of public accountability to help curb resource curse tendencies. Since public opinion polling in Tanzania is uncommon, we have conducted a series of polls among a randomized and nationally representative sample of 2,001 Tanzanians to reveal ordinary citizens’ preferences for managing revenues.
However, experts are hesitant to recommend that elites yield to populist opinion when Tanzania’s population is predominantly uneducated and uninformed. To bridge this information gap, we moved beyond simply collecting citizens’ latent views and designed a “treatment” in which we provided both information as well as a process for discussing and processing this information; we applied the treatment to a subgroup of our citizen sample who participated in the first nationally representative “Deliberative Poll” in Africa. This treatment subgroup was composed of nearly 400 Tanzanians from across the country. We transported these individuals to Dar es Salaam in April 2015 for a two-day public deliberation where they debated policy questions about natural gas in small groups, and participated in question-and-answer sessions with policymakers and gas experts. Deliberative polling addresses the concern that – although public opinion is central to any democracy – most ordinary Tanzanians may know very little about natural gas, and may not understand complex policy issues.
Our findings indicate that democratic deliberation rendered Tanzanians slightly more in line with orthodox economics’ prescriptions for using the gas: deliberation reduced support for fuel subsidies, and increased support for transparency and oversight. Deliberation also reduced support for direct distribution through cash transfers, but did not alter Tanzanians’ strong preference for spending over saving. Interestingly, when a separate group of respondents received information about natural gas policy – but did not participate in deliberation – they showed measurable increases in gas knowledge, but none of the changes in opinion caused by deliberation. Deliberation altered opinions, while information alone did not.
Finally, to test public accountability, we polled two groups of randomly chosen Tanzanian elites (nearly 125 in total) on the same questions posed to our citizen sample. One group of elites – the treatment group – was shown citizens’ answers to the questions before answering the questions themselves. The other group – the control – was simply asked to answer the questions without any knowledge of citizens’ preferences. Analysis reveals that elites generally align themselves marginally more with citizens’ view on nearly all issues. These findings provide evidence that there is appetite among elites to represent the views of informed citizens in managing public resource revenues.
vii
Contents Acknowledgements .......................................................................................................................... iii
Abstract ............................................................................................................................................. v
Appendix VII: Pre-analysis plan ................................................................................................. lxxxvii
1
1 Introduction In 2010, Tanzania discovered natural gas reserves off its southern coast that have been estimated to generate roughly fifteen times the country’s annual GDP.2 The large literature on the resource curse suggests this new gas discovery brings considerable risks to a low-income country with already weak governance institutions, including a greater propensity for authoritarian rule, corruption, and political violence.3 To avoid this curse, Tanzania’s democratically elected leaders are navigating a series of complex decisions related to concessions, licensing, and alternative proposals for the use of the revenues.
Will the views of ordinary Tanzanians be heard in this process? Should they be? Public opinion polling is rare in Tanzania. While Tanzania is a multi-party democracy, the ruling CCM party has never faced a serious challenge in a national election. Many experts doubt whether the Tanzanian electorate – largely uneducated, overwhelmingly rural, with limited media exposure – can grasp the issues Tanzania confronts in the natural gas sector.
This project aims to challenge these assumptions. To do so, we have conducted a series of public polls and a two-day deliberation among a nationally representative sample of ordinary Tanzanians, measuring their views both before and after exposure to expert information and public debate. This process, known as “Deliberative Polling”, has been implemented over 70 times in dozens of settings, on issues ranging from Korean reunification to the use of wind power in Texas.4
The evaluation tested the ability of Tanzanian voters to formulate coherent views on a range of options for the use of gas revenues – including transparent oversight, spending on infrastructure or services, subsidization of domestic fuel, and direct distribution in the form of cash transfers to households.
The experimental design tested two channels linking citizens’ views to policy change: political action and direct dissemination. First, using a mobile-phone survey platform, we tracked the longer-term impact of the treatments on participants and spillovers to their neighbors.
Second, using a targeted dissemination campaign of our polling results among elites in Dar es Salaam, we tested whether elites are responsive to polling information about the views of informed voters.
2 See IMF Country Report No. 14/121, May 2014. In recent years, oil and gas prices have declined due to increased global exploration and production. A more globalized market for crude oil has led to a stronger drop in the commodity price worldwide, whereas natural gas is bought and sold mainly within domestic and regional markets, helping to de-link regional prices from global trends. Therefore, the price of natural gas varies throughout different regions, but the overall trend has slightly depressed the expected revenues Tanzania hopes to collect. Current projections are lower than those based on an $11/MMBtu price in IMF Country Report No. 14/121, but it is also important to note that Tanzania does not intend to commercially develop its natural gas until 2020 or later, leaving open the possibility of further price fluctuations prior to extraction. 3 Michael Ross, “The Politics of the Resource Curse: A Review”, forthcoming in C. Lancaster and N. van de Walle (eds.), The Handbook on the Politics of Development, OUP.
4 Stanford Center for Deliberative Democracy, “Deliberative Polling: Executive Summary.”
1.1 What is Deliberative Polling? Deliberative Polling5 is a form of public consultation that attempts to assess what the public would think about policy choices both before and after it has had a good chance to engage with the issues and become more informed about them. Most citizens, most of the time are not really motivated to become informed about policy issues. After all, each citizen has only one voice in millions and many more pressing concerns, hence the incentives for “rational ignorance” (Anthony Downs 1957). It may not be reasonable for them to spend a lot of time and effort becoming informed. In thinking about forms of public consultation, self-selected forums are likely to represent mostly those who can be mobilized or who feel strongly. Conventional polls, if done well, are more representative, but they are unlikely, for the reasons just noted, to offer informed opinion about complex policy options.
Deliberative Polling combines the representativeness of a good opinion poll with the depth of discussion and opportunity for real deliberation found in discussion groups. It helps policymakers connect with a public voice on the issue after the people have really had a chance to engage with it in depth—through carefully balanced 6 briefing materials (in video form for this project), moderated small group discussions, and questions to competing experts representing different points of view in plenary sessions. In this case, after two days of deliberation the participants had the opportunity to come to an informed judgment and register those opinions in confidential questionnaires.
The result is an unprecedented national experiment in an African country. It is national, unlike previous Deliberative Polls the Center for Deliberative Democracy has conducted in Africa (in Uganda and Ghana in 2014). It is a controlled experiment, and it is on a complex set of policy topics with significance at the national level. Every indicator of success outlined in the Pre-analysis Plan was met. The sample was highly representative. The deliberation produced significant opinion changes as well as knowledge gains. The participants evaluated every component favorably, and they increased their sense of efficacy. The experimental design also demonstrates that deliberation, in the form of discussion produces the changes, not just provision of information. Discussion on the issues allows people to see the implications of what they are learning.
This experiment demonstrates that deliberative democracy can be applied in developing countries at the national level. It is proof of concept that the people who live with the policies chosen in developing countries can be consulted in a thoughtful and representative way. Not just stakeholders but random samples of the people themselves. There is a practical mechanism for expressing the public’s representative and informed views on complex issues, even those involving difficult tradeoffs. There were practical remedies for dealing with the difficulties of recruiting the national sample and engaging it in the issues despite the low levels of literacy.
This report will begin by explaining the project context and timeline. We will then elaborate on the details of the intervention, theory of change, and implementation. Finally, we will report the evaluated impact analysis and provide a discussion of the results.
5 Deliberative Polling is a trademark of James S. Fishkin. 6 All briefing materials and information materials were heavily vetted in several rounds of review and revisions by member of the Study Group, our partners at REPOA, our consultants at Stanford University, and staff internally at the Center for Global Development. After drafting a manuscript with our partners, we contracted a film company to create an informational video for non-literate individuals to be able to participate in treatment.
3
1.2 Literature review The politics of the resource curse Ross (1999) Ross distinguishes between economic and political explanations for the resource curse. Economic explanations include Dutch disease, as well as concerns about the declining terms of trade of commodity exports, negative growth consequences of commodity price volatility, and a “dynamic comparative advantage” argument in which commodity exports generate relatively little productivity growth or “linkages” to other sectors. But he cites a tentative consensus among economists that even small, open economies have considerable scope to control their economic destiny in the face of a commodity boom, but often seem to choose self-defeating policies. This puzzle of sophisticated policymakers in resource-rich economies making what appear, from the outside, to be myopic policy choices motivates the turn in Ross and much subsequent work from economic to political explanations of the resource curse. Cognitive explanations: resource booms lead to an “irrational exuberance”, a “get-rich-quick mentality” in both the private and public sector. As Ross notes, survey evidence suggests that policymakers in resource-rich economies are acutely aware of the risks of the resource curse, and it seems hard to justify an assumption of pure myopia.
Societal explanations stress that resources may strengthen the bargaining power of political groups who support policies that are inimical to growth including, for instance, trade protectionism. There is little a priori reason to assume that sovereign rents would weaken the state's power vis-a-vis special interest groups, and the historical correlations between resource wealth and trade protectionism is weak.
Statist explanations stress that when states get most of their revenue through sovereign rents, such as commodity exports or foreign aid, they no longer need to raise domestic revenues through taxation, and a crucial link of accountability to domestic society is broken. Brainstorming on our structure: Ross dismisses cognitive and societal explanations, and stresses the importance of the rentier state and the statist explanations. Much of the economics and political science literature since Ross has followed his lead, including CGD's interest in oil-to-cash: everybody's concern is the deleterious effects of sovereign rents. However, there is a separate, quite prominent literature that looks a lot like Ross's cognitive or societal explanations. This is the literature on clientelism, populism, and the governance syndromes of low-income democracies. The same broad theory is reflected in economists' outrage and bewilderment at fuel subsidies.
van der Ploeg (2011) van der Ploeg focuses on the disparity of economic and political outcomes among resource-rich countries. Particular countries, such as Botswana and Norway, have enjoyed overwhelmingly positive returns from their natural resource capital. However, van der Ploeg explains that this is the exception rather than the rule. The majority of resource-rich developing countries (e.g. Nigeria, Venezuela, Algeria, etc.) actually perform worse economically than their resource-poor neighbors while controlling for a number of factors, such as institutional quality and rule of law. This evidence is consistent with the seminal work done by Sachs and Warner (1997), which revealed an inverse relationship between resource intensity and economic growth within countries. van der Ploeg explores several hypotheses to understand the seemingly paradoxical outcomes of countries with abundant natural resources.
4
First, he illustrates elements of Dutch disease, in which countries that absorb resource windfalls experience (at least short-term) “appreciation of the real exchange rate, decline of the traded sector, and expansion of the non-traded sector.” Basically, a “resource bonanza” may cause capital investment and labor to concentrate within the resource sector, leading to high unemployment, inflation, and an overall drop in economic diversification and competitiveness. Saving a majority of resource revenue offshore, typically in a sovereign wealth fund, can help prevent over-saturation of foreign currency and shield non-resource sectors, but saving is not always a pragmatic approach for low-income countries with burdensome debt and capital scarcity.
van der Ploeg turns to evidence in Sachs and Warner (1997) to establish the link between economic growth and a country’s quality of governance and institutions. Unsurprisingly, countries with poor governance and institutions tend to fare worse during resource booms in terms of economic and political outcomes. Interestingly, presidential democracies were less likely to experience growth as opposed to parliamentary democracies because presidential democracies are “less accountable and less representative” (Jorgen Juel Andersen and Silje Aslaksen 2008), suggesting that democratization may reduce the threat of the resource curse.
Second, supported by Ross (1999), resource booms induce rent seeking, corruption, and violence. Ambiguous or non-existent property rights can lead to a “commons problem” of land grabbing and rent seeking. This “voracity effect” is used to explain a higher propensity of conflict and war among resource-rich countries (e.g. Angola, South Sudan, Nigeria, Bolivia, etc.). Resource revenues may be pilfered by leaders, captured by rebel groups, or targeted by external forces.
Finally, van der Ploeg addresses resource-rich countries’ inability to convert windfall revenues into positive savings. Currently, resource-rich countries actually grow “poorer each year” by not re-investing resource revenues into productive capital and foreign assets, as recommended by the Hartwick rule. Recognizing developing countries’ urgent spending needs, leaders may instead choose to optimize revenues by borrowing prior to a boom, spending intensely leading up to the windfall, repaying the debt as revenues begin flowing, and eventually saving the remaining revenues in a sovereign wealth fund as “permanent income” once the resource has been depleted.
Collier et al. (2010) Collier immediately points to the importance of politics in determining economic performance in resource-rich countries. Accepting the premise that political systems and institutions play an integral role in preventing the resource curse, Collier gives credence to the global transparency movement. He suggests that initiatives and policies at both the international and domestic levels can improve transparency, and this will in turn lessen the risk of the resource curse.
Collier provides specific recommendations for transparency, such as becoming a party to the Extractive Industries Transparency Initiative or mandating competitive bidding to auction property rights to extraction zones (a pillar of the Natural Resource Charter). The latter would “reveal the true value of a right to extract by placing them [companies] in competition.”
Another concern among leaders in resource-rich countries is the potential for policy change during the next administration. To prevent a policy reversal in future administrations, leaders may be able to institute policies that pre-commit governments to certain fiscal requirements. Former finance minister of Nigeria, Ngozi Nkonjo-Iweala, has ensured a certain amount of annual oil revenue savings through her Fiscal Responsibility Act
5
Experimental work on deliberative democracy in the developing world Fujiwara and Wantchekon (2013) Clientelism – “the practice of garnering the vote of constituencies through gifts and the promise of favors and patronage” – often plagues elections in developing country politics. This is especially relevant to our research in Tanzania’s dominant-party democracy. Fujiwara and Wantchekon have engineered an experimental treatment design to measure voter turnout and vote shares within villages in Benin. Political candidates were randomized at the village level into control and treatment groups; control candidates ran electoral campaigns using typical clientelist strategies, but treatment candidates ran alternative campaigns by inviting villagers to deliberate on policy issues at town hall meetings.
Following the 2006 presidential election in Benin, voter turnout was unaffected in treatment villages with alternative, non-clientelist campaigners. The authors posit that unchanged turnout supports cheaper methods of information sharing as opposed to more costly clientelist methods to spur turnout, such as cash distribution. This has direct policy implications for increasing voter participation in nascent democracies.
Vote share outcomes present a more nuanced evaluation of the treatment’s impact. Non-clientelist campaigns saw a drop in vote share within villages where the candidate was dominant, and an increase in vote share in villages where the candidate did not have a stronghold. In other words, as more candidates adopt non-clientelist strategies, we would expect to see more competitive elections as vote share converges. In order to maximize voter turnout and vote share, “self-interested” candidates may choose to adopt the most “optimal” campaign strategies by remaining clientelist in their opponents’ stronghold regions and by using more deliberative, information-sharing tactics in regions where they are dominant.
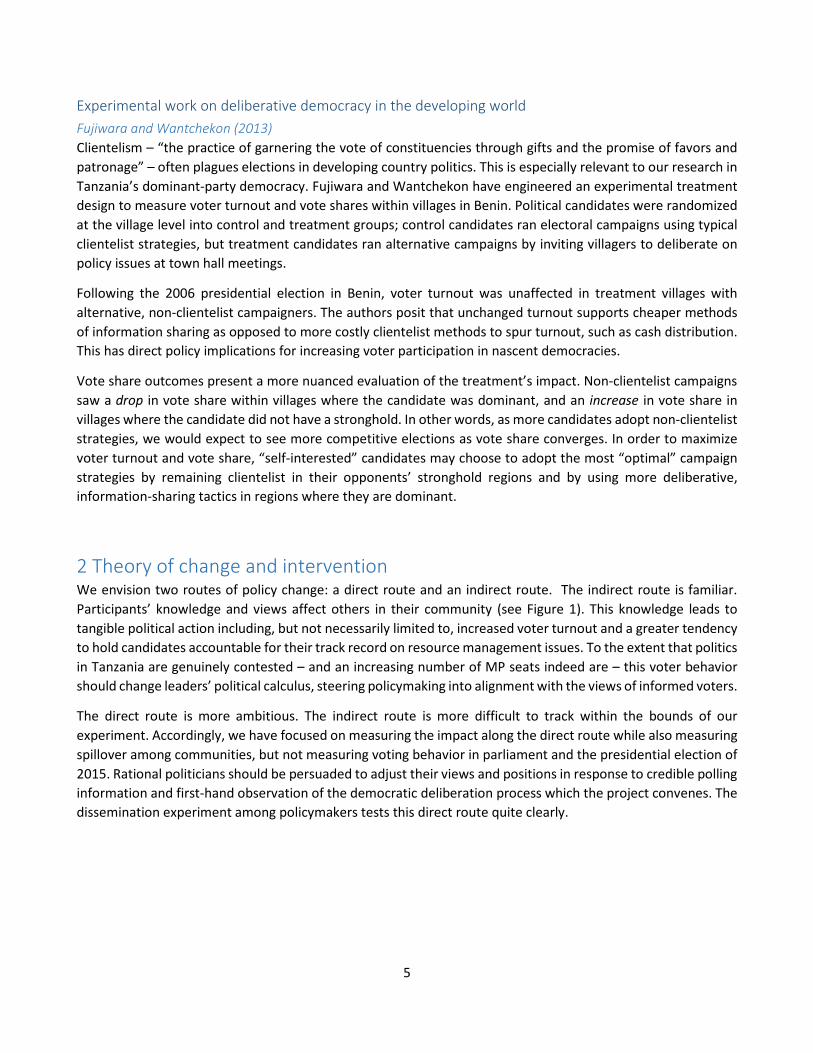
2 Theory of change and intervention We envision two routes of policy change: a direct route and an indirect route. The indirect route is familiar. Participants’ knowledge and views affect others in their community (see Figure 1). This knowledge leads to tangible political action including, but not necessarily limited to, increased voter turnout and a greater tendency to hold candidates accountable for their track record on resource management issues. To the extent that politics in Tanzania are genuinely contested – and an increasing number of MP seats indeed are – this voter behavior should change leaders’ political calculus, steering policymaking into alignment with the views of informed voters.
The direct route is more ambitious. The indirect route is more difficult to track within the bounds of our experiment. Accordingly, we have focused on measuring the impact along the direct route while also measuring spillover among communities, but not measuring voting behavior in parliament and the presidential election of 2015. Rational politicians should be persuaded to adjust their views and positions in response to credible polling information and first-hand observation of the democratic deliberation process which the project convenes. The dissemination experiment among policymakers tests this direct route quite clearly.
6
Figure 1: Theory of change
2.1 Intervention The experiment includes two interventions: an information treatment7 administered to a random subset of individuals in a random subset of clusters immediately after baseline surveying, and a deliberation treatment to which a sub-set of the information treatment group were invited.
Information treatment: A random subset of poll respondents will receive detailed information about the natural gas discovery, and the pros and cons of various gas policy options. The information will be provided in the form of a roughly thirty-minute video, screened in the field by survey teams after the baseline poll. The video aims to provide a balanced view of controversial alternatives, and is based on a script written with input and approval from a panel of researchers, Tanzanian industry representatives, civil society leaders, and politicians spanning all three major political parties as well as relevant government agencies.
Deliberation treatment: A randomly drawn subset of 400 individuals receiving the information treatment will be invited to a national deliberative event. The event was held over two days in April 2015, in Dar es Salaam, with travel and accommodation provided by the project. At the event, poll respondents participated in small group deliberations about specific gas policy options, followed by question and answer sessions with experts. Each of the small group discussions were led by hired and trained moderators. We held a two-day training for moderators, along with administrators from the Center for Deliberative Democracy at Stanford University, to instruct and practice appropriate and objective group moderation techniques with the moderators.
7 The information treatment was the shown to the information-only group as well as the treatment group that attended the deliberation. We created a treatment video (to access non-literate audiences) with extensive help and guidance to ensure its balance from our partners in Tanzania, our Study Group, consultants at Stanford University’s Center for Deliberative Democracy, and our colleagues at CGD. The informational video covered topics matching each of our six hypotheses (listed below) and is less than a half an hour in length. Our survey firm showed the video to participants in their villages on laptop computer screens. Participants who went attended the Deliberative Poll were shown the treatment video a second time before the deliberation began.
7
Discussion prompts were chosen in coordination with our partners and Study Group. The four prompts bridge the information in our treatment video (shown just prior to the deliberations) and correspond to our six hypotheses. Since transparency and knowledge are cross-topical issue areas, we did not have separate sessions for these topics. For instance, discussing savings inevitably lends itself to discussing transparency because choosing between domestic savings versus saving in a sovereign wealth fund with international oversight has different implications for transparency. The following questions were used as prompts for the small group discussions:
1. Should Tanzania extract and sell its natural gas in international markets or use it exclusively for discounting fuel for Tanzanian citizens and industry?
2. If Tanzania earns revenue from selling natural gas, should that money be saved for the future or spent now?
3. Should the government spend natural gas money on social goods, such as schools and roads, or give it directly to Tanzanians to spend?
4. If the government spends the money, what should be the priority areas for spending?
Each group discussion was followed by a plenary session in which participants posed questions to panels of policy experts.8
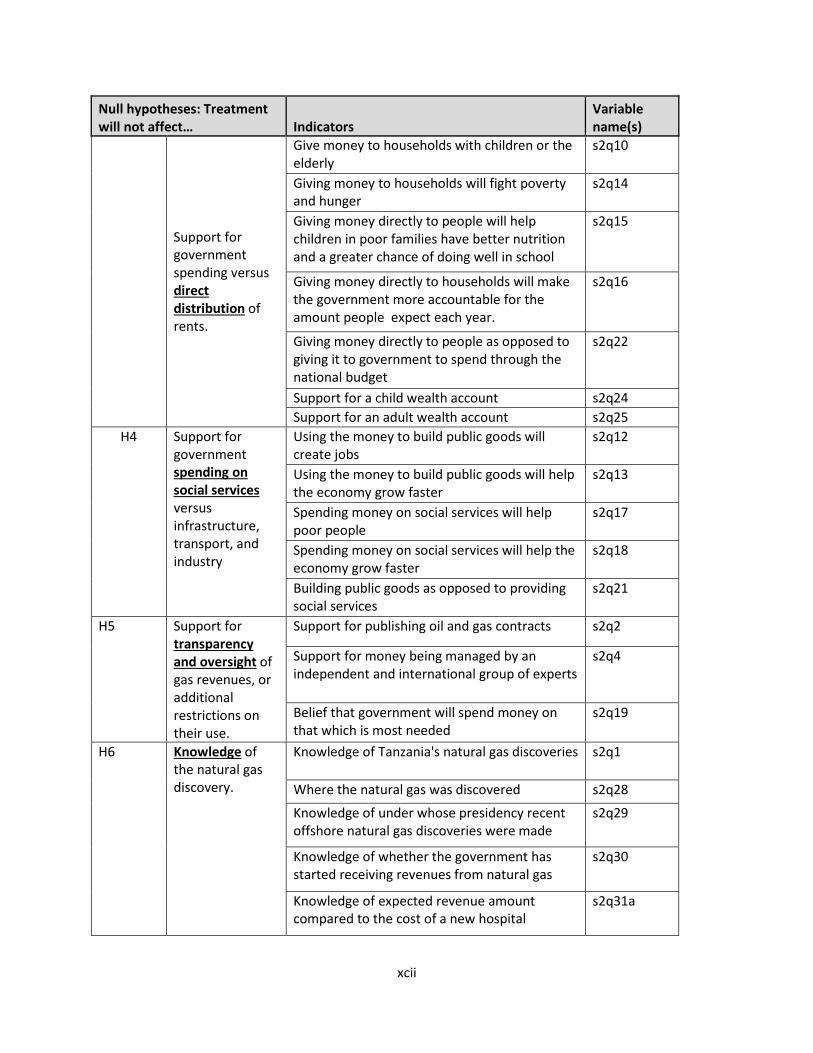
2.2 Outcomes and hypotheses The main outcome variables are based on poll responses about preferences for how to manage or spend natural gas revenues. We test six substantive hypotheses about the e_ect of information and deliberation treatments on natural gas policy preferences and knowledge, which correspond to six broad outcomes. In each case we test the null hypothesis that each treatment will have no impact on the following six outcomes.
Table 1: Hypotheses
Number Hypotheses
H1
Support for extracting and exporting natural gas.
H2
Support for saving rather than spending gas revenue.
H3
Support for direct distribution of rents versus government spending.
H4
Preference for government spending on social services versus infrastructure, transport, and industry.
H5
Support for transparency and oversight of gas revenues.
H6
Knowledge of the natural gas discovery
8 The following experts served as panelists: Abel Kinyondo (REPOA), Aiden Eyakuze (Twaweza), Innocent Bash (Tanzania Extractive Industries Transparency Initiative), Fortunata Songora (REPOA), Happiness Mgalula (President’s Office, Planning Commission), January Makamba (Chama Cha Mapinduzi), Silas Olan’g (NRGI), Lorah Madete (President’s Office, Planning Commission), Johnson Nyella (Bank of Tanzania), Dennis Rweyemamu (UONGOZI Institute).
8
Each outcome will be measured by the mean of the standardized responses to several survey questions. The components of each index are listed in the pre-analysis plan in Appendix VII. Full question wording and variable names from the microdata are available in the pre-analysis plan uploaded to the American Economic Association's RCT registry prior to the deliberative event and follow-up data collection (Birdsall et al., 2015).
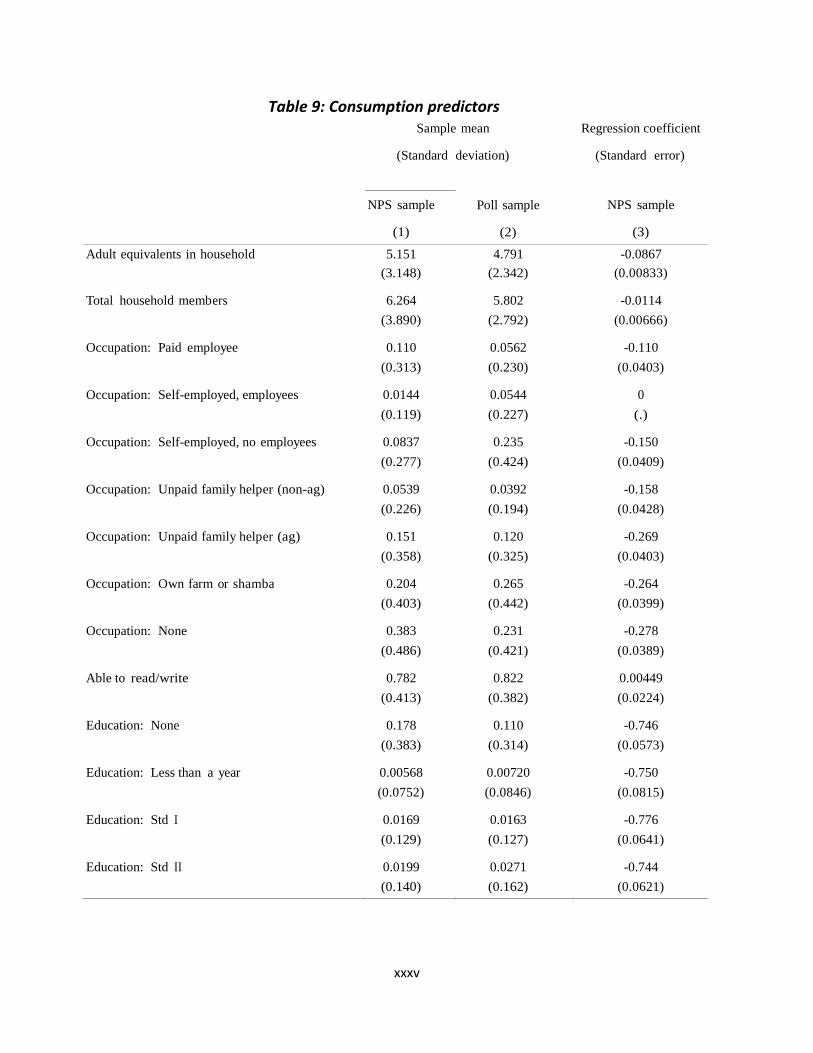
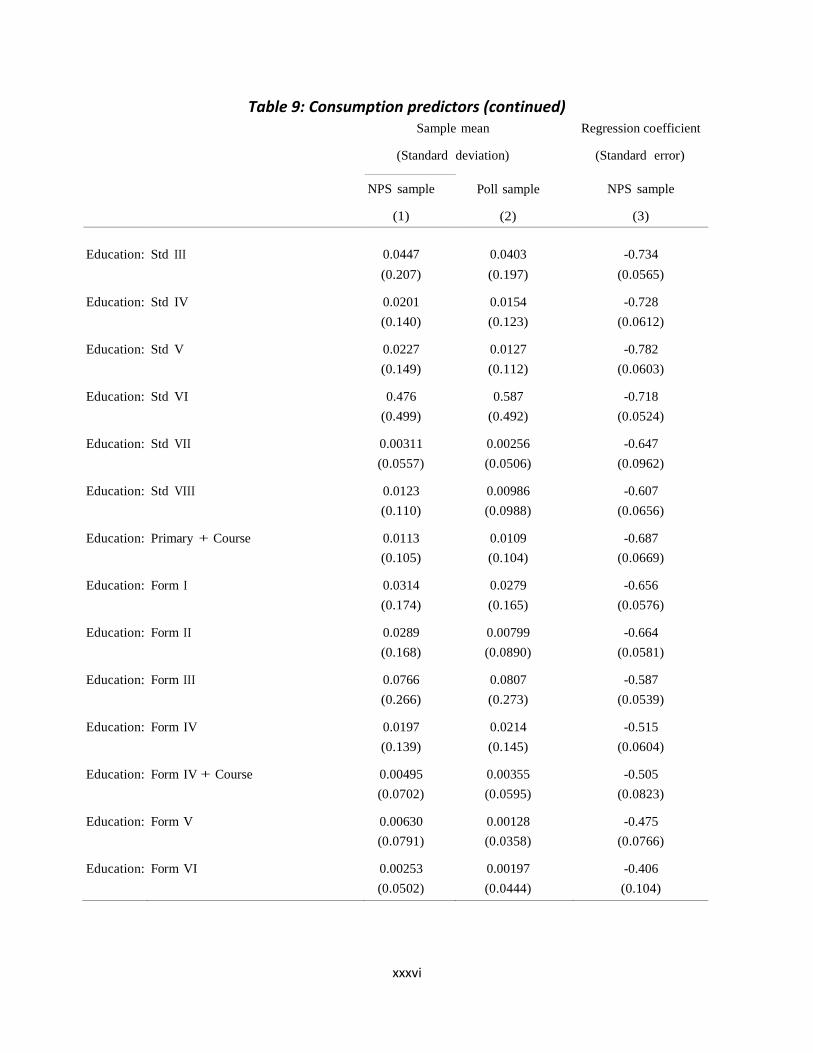
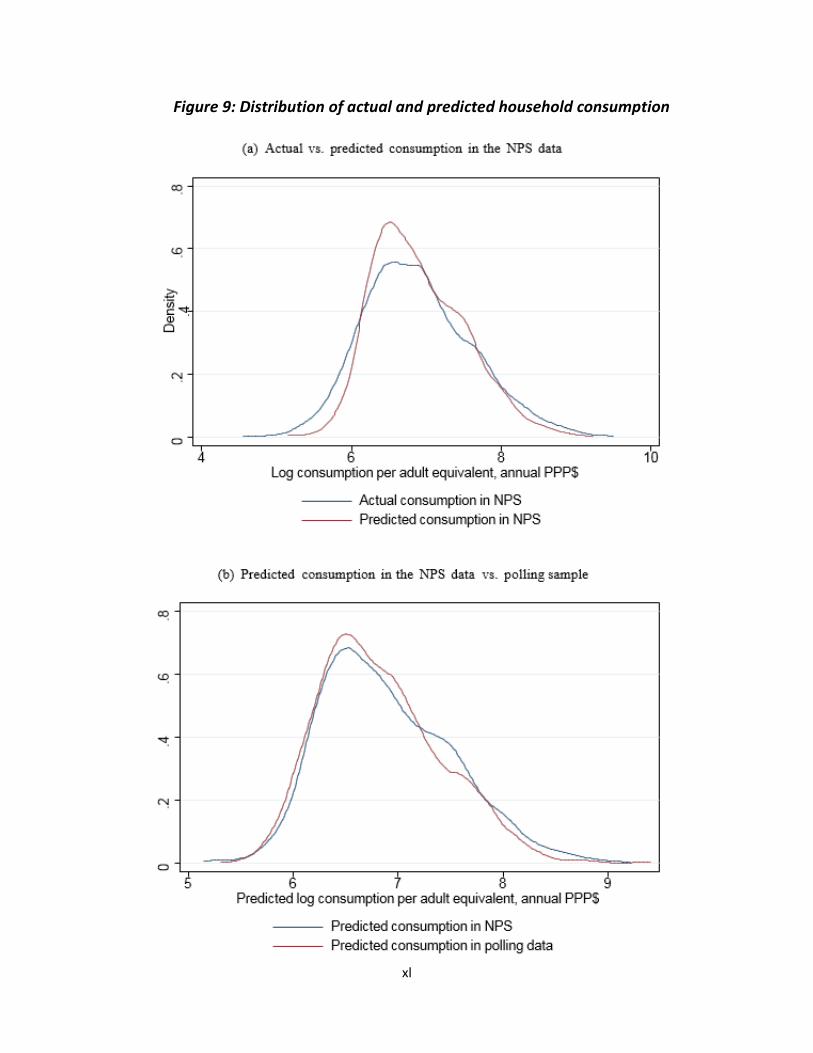
We will also test heterogeneous effects for each of these hypotheses along four dimensions: education and knowledge; wealth; trust in government; and gender. The components of the first three measures of heterogeneity are also described in the table at the end. For education and knowledge, the mean effects index will combine just two components the total number of correct answers on the knowledge and literacy test, and years of schooling. For wealth, we use a predicted consumption measure, based on the coefficients on a regression of household consumption on survey items in National Panel Survey that overlap with our questionnaire (these items were included in the questionnaire for this purpose). For trust in government, we propose to use a simple mean effects index of the relevant items in the questionnaire, as listed in the pre-analysis plan (Birdsall et al., 2015).
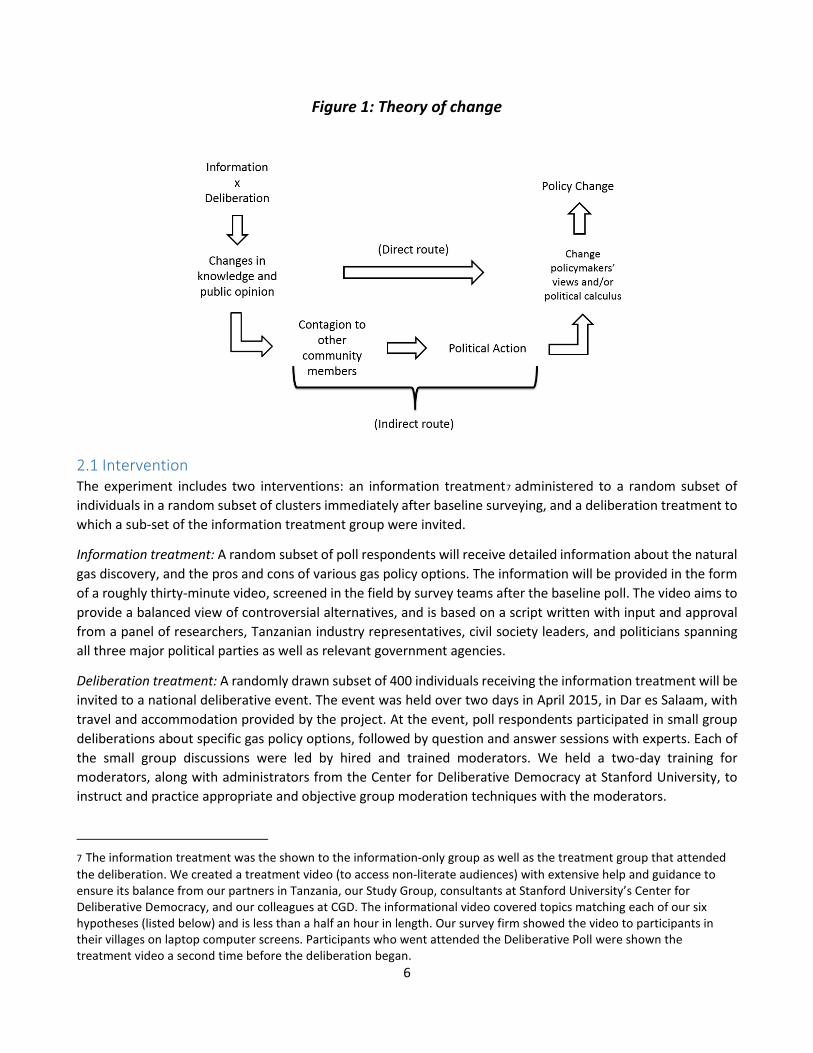
3 Sampling and random assignment A nationally representative baseline poll asked a target sample of 2,001 adult Tanzanians in 200 rural and urban clusters spread across twenty districts about their knowledge and policy preferences regarding Tanzania's recent natural gas discovery and the use of any future revenues.
Sampling was done in multiple stages. Twenty districts were randomly selected using probability proportional to size (PPS) sampling based on district population from the 2012 Tanzania Population and Housing Census. Within each district, ten clusters were selected, also by PPS sampling. In rural areas, clusters are de_ned as a sub-village or hamlet (kitongoji ). In urban areas, clusters are defined as a block or sub-ward (mtaa). Within each cluster, ten households were selected using a random walk method. Within households, one adult respondent was chosen from the household roster; this respondent was randomly selected electronically within the survey software on mobile computers in the field. All respondents received a free mobile phone to enable follow-up polling by phone.
In each of 100 randomly selected survey clusters, 7 of 10 respondents were invited to view a documentary video presenting pros and cons of various gas policy options (the information treatment). Of the respondents who were invited to the information treatment, 4 individuals were invited to a democratic deliberation about the use of the natural gas.
The 400 invitees to the deliberative event will be divided into 25 randomly assigned small groups to discuss a sequence of gas policy options. The discussions will be broken into four rounds, and groups will be randomly reassigned after each round.
Follow-up polling will measure the medium term (i.e., weeks rather than hours after treatment) impact of information and deliberation on respondents' knowledge and policy preferences. Follow-up polling will be conducted by phone and broken into multiple rounds, due to limitations on respondents' attention span on the phone.
9
Figure 2: Twenty sampled districts
Both clusters and individuals were randomly assigned to treatment arms by one of the principal investigators on a computer in the office using Stata. In the first step, the 200 survey clusters The survey spans 200 clusters or primary sampling units (PSUs). We use the terms cluster and PSU interchangeably here. Of these 100 clusters, individuals chosen to participate in the information and deliberation treatments will be drawn exclusively from 100 treatment clusters. Ten individual poll respondents were sampled from each PSU. 2. Individual level randomization: Within the 100 treatment clusters, individual participants for the information treatment and deliberation treatment will be drawn at random. (For the information treatment, this will include 7 of 10 individuals in each treatment cluster. For the deliberation treatment, this will include 4 of 10 individuals in each treatment cluster, a strict subset of the information treatment group.) 3. Random formation of deliberative groups. The 400 individuals to be invited to the deliberative event will be assigned to small groups to deliberate on policy options. Assuming perfect compliance (i.e., all invitees attend the event), participants will be assigned to 25 groups of 16 people. The event will span four rounds of deliberation. Groups will be randomly reassigned for each of the four rounds. The random assignment of moderators to deliberative groups is implicit in this design.
3.1 Timeline The evaluation took place over a period of about 18 months. Planning and preparation took place over the course of a few months in late 2014. This included refining the intervention design, designing the survey instrument, and recruiting members of the project’s Study Group of experts to preside over all aspects of the work. In early 2015, the project team began the baseline household survey, which lasted for two months. During this time, the team also continued planning its intervention along with its Study Group, research partner REPOA, and consultants at Stanford University’s Center for Deliberative Democracy. The team held the Deliberative Poll intervention in April 2015, and follow-up mobile phone polling to collect endline data began shortly after the intervention in May 2015 and continued through July 2015. In August 2015, the team polled elites and disseminated the results from the citizen experiment at an event in Dar es Salaam, just prior to the October 2015 presidential election.
Note that we randomly selected 20 districts in Tanzania from which to draw a 2,000-person sample (100 individuals per district).
10
Figure 3: Timeline of polling among three separate groups
Poll 1* Treatment Poll 2
Group A: 400 people Deliberation and 96% of sample (February 2015) information (April 2015) re-surveyed (June 2015) Group B: 300 people Information only 93% of sample (February 2015) (April 2015) re-surveyed (June 2015)
Group C: 1,300 people Nothing 92% of sample (February 2015) re-surveyed (June 2015)
*All three groups were polled twice as a nationally representative sample, before and after treatment.
4 Evaluation: design, methods, and implementation The research proposal was designed in concert with Tanzanian research partners at REPOA as well as with Study Group experts who oversaw each step the process. Tanzania’s Commission for Science and Technology (COSTECH) formally approved the research design, which remained unchanged from the time of approval.
Participation in the survey and intervention was entirely voluntary, and all identities have been kept anonymous. The topics covered in the opinion poll concerned public policy issues on non-sensitive topics (i.e. management of natural gas resources) and did not require respondents to divulge any personal information beyond basic socioeconomic details used for correlational analysis (i.e. education attainment).
The deliberation process is by necessity a group process in which anonymity was not possible. Furthermore, we filmed portions of the deliberation. All participants were asked to sign a consent form before the process began; those who do not consent will not forfeit any of their travel allowance or stipend for the event. All survey and poll responses will be strictly confidential.
4.1 Identification strategy Causal effects have been identified through random assignment. Randomization took place at three distinct levels. The first three are nested within each other:
1. Community-level treatment effects and spillovers. Primary sampling units (PSUs, rural villages or urban sub-wards) have been randomly assigned to either treatment or control status. Control PSUs were surveyed, but no respondents were invited to the deliberative polling exercise. Comparing these control PSUs to control individuals in the treatment PSUs enabled us to measure spillover effects of the deliberative polling exercise on broader public opinion and political action within the community to which poll participants returned.
11
2. Individual-level treatment effects. Within treatment PSUs, a random sub-set of individual survey respondents was invited to the deliberative polling event. Comparing invitees to individuals in the control PSUs allowed us to calculate the total treatment effect of the deliberative polling exercise.
3. Effects of alternative treatments. Within the set of invitees to the deliberative polling exercise, individuals were randomly assigned to alternative sessions with distinct information treatments and/or alternative deliberation protocols and moderators. The “sectoral” and “distributional” information treatments were delivered in isolation and in combination with each other, as well as in combination with deliberation. Deliberation was not practical without an overlapping information treatment, so we measured the marginal effect of deliberation over and above the information treatments (and the total effect of their combination). These variations of the treatment allowed us to unpack the treatment and look at the underlying causal mechanisms. This fine-grained information is also crucial to designing better deliberative protocols in the future.
Finally, we disseminated the deliberative polling results to a to a group of nearly 125 elites in Dar es Salaam. The target group of elites was selected from organizational mailing lists used by NGOs and government offices with which we had contact. Within this group of about 125 elites, we randomly selected treatment and control individuals as part of our elite accountability experiment.
Sampling considerations are explained under the following sub-section, and the rationale for sample sizes is explained in the sub-section on power calculations.
4.2 Data collection CGD hired a survey firm, EDI, Ltd., which specializes in household surveys in East Africa. EDI trained supervisors and enumerators in separate groups in the classroom and field to ensure competence and optimum operations. Regular data collection updates and general weekly updates were shared between EDI and CGD to ensure quality training and performance in conducting the field surveys. CGD’s RA stationed in Dar es Salaam was also able to observe part of training as well as part of the baseline survey administration in order to ensure proper implementation. EDI delivered all raw data to CGD to be cleaned and coded accordingly.
Baseline and multiple rounds of follow-up data were collected in both treatment and control PSUs, and on treatment and control individuals in treatment PSUs. The logic of the data collection strategy was to obtain socio-economic information at baseline, as well political opinions at both baseline and various intervals after treatment for all treatment and control groups.
a. Baseline data collection The initial baseline data collection consisted of a face-to-face household survey and public opinion poll. The baseline survey instrument was modeled on Tanzania's National Panel Survey (NPS), which is a longitudinal LSMS-type household socio-economic survey conducted by the Tanzanian government with technical assistance from the World Bank. By replicating modules from the NPS, the baseline household survey will not only provide a robust set of demographic and socio-economic controls and potential interaction terms for the public opinion analysis, but also allow us to benchmark our sample to the nationally representative NPS data both now and in future rounds.
b. Longitudinal polling
12
After the baseline, data collection shifted to a mobile phone platform. This design borrowed from the innovative work done by our colleagues at Twaweza, whose longitudinal mobile phone survey "Sauti za Wananchi" (Voice of the People) has established the technological infrastructure and proof of concept for conducting relatively low-cost, high-frequency polling among a nationally representative sample of Tanzanians. For this project, we relied on an independent sample and separate survey instrument, but replicate the Sauti za Wananchi model to collect follow-up data on political opinions of both treatment and control individuals. The content of the poll replicated the outcome variables collected at baseline, though not the full set of demographic and socio-economic variables. The primary goals of the longitudinal data collection were to (i) test the durability of treatment effects from the democratic deliberation, and (ii) see how and whether treatment and control respondents reacted differently to evolving news and information about natural gas revenues over a short period of time.
c. Elite polling Unlike the baseline and follow-up mobile phone surveys, CGD administered the elite poll instead of EDI. This was simply due to timing and budget constraints, but the elite survey was much shorter and more easily administrated. We began elite polling at a dissemination event in Dar es Salaam in early September 2015. In an effort to boost the response rate beyond the number of respondents who were able to attend the dissemination event, we conducted a second round of elite polling online by sending a digital version of the survey to respondents. We constructed the elite survey by selecting tradeoff questions verbatim from each of our six hypothesis sections of our baseline survey instrument. The sub-sample was selected from multiple mailing lists from our research partner REPOA, as well as through our Study Group members and our other funders. Individuals were randomly assigned to treatment and control groups. We administered a standard survey of select questions to control respondents, but treatment respondents completed surveys that displayed the percentage of citizens who chose each answer. Comparing the treatment responses to the control responses allows us to identify the propensity for elites to align themselves with a nationally representative sample’s views, essentially evaluating elite accountability to the public.
d. Attrition concerns We patterned our longitudinal polling on Twaweza’s Sauti za Wananchi mobile phone survey. Their experience provided a useful guide for the anticipated scale of attrition problems. Croke et al (2013) reported initial challenges with attrition in the pilot for the Twaweza survey. Technical problems led to high attrition after the initial household survey, and Croke et al (2013) and Twaweza’s technical documents on Sauti za Wananchi present solutions and lessons learned. Attrition is a major hurdle for any panel survey due to migration and other issues of social and geographical mobility, but it is especially a problem in a mobile phone survey in which the respondents may be contacted at several instances over a period of 12 months. Attrition may be caused by a several possible variables, including the following:
Household wealth is correlated with survey participation, meaning that greater wealth may aid in ownership of mobile phones, having access to a premium mobile phone network, and having reliable access to electricity to charge mobile phones, all of which contribute to higher survey response rates. Those respondents who had access to the premium network responded more often, 20.1 times, while those with a different network responded 16.9 times (Croke et al. 2013). Not owning a mobile phone
13
and simply having access to a friend’s or relative’s phone may also lower the response rate, in which case distributing phones or providing an incentive would help. (Croke et al. 2013) To safeguard against these attrition risks, CGD provided mobile phones to all survey participants and an incentive of air time credits to respondents. The credit amounted to approximately USD 2.00 per respondent upon completion of each 30-minute mobile phone interview and helped to ensure a greater response rate.
Leaving too much lag time between the initial face-to-face interviews and the follow-up mobile phone interviews may increase attrition and response drops. In the Kagera Health and Development survey, 31% of the respondents were lost between 1994 and 2004. However, prioritization to track respondents over time can greatly reduce attrition (Croke et al. 2013). We reduced lag time as much as possible by beginning follow-up mobile phone polling two weeks after respondents returned to their homes. Tracking was done by collecting mobile phone numbers, physical addresses, and email addresses when possible. Additionally, mobile phone numbers, physical addresses, and email addresses were collected from three other individuals who have regular contact with the respondent, i.e. relatives, neighbors, friends. This will provide a set of checks to further enhance response rates.
EDI, in coordination with village chairmen, contacted the respondents regularly to remind them of upcoming polling. Insufficient enumerator and field supervisor training is also an issue that leads to attrition, and so, it was imperative that we hired a reputable survey firm with a strong field team (Croke et al. 2013).
Attrition is discussed more comprehensively in the conclusions section of this report.
4.3 Sampling design Sampling prior to the baseline was conducted in three stages:
a. First-stage sampling of PSUs. A nationally representative sample of PSUs (kitongoji) was drawn through probability-proportional-to-size (PPS) sampling based on 2012 population census figures provided by the National Bureau of Statistics.
b. Second-stage sampling of households within the PSU was done through simple random sampling (SRS). Our initial proposal included a random walk method of selecting households during the baseline survey because a household listing seemed too costly relative to the overall budget of the project. After further discussion, we have found a cost-effective way of performing household listings using the sub-village chairperson’s existing household listing. If a household listing is unavailable, the interviewer used the random walk technique along with the chairman at the kitongoji level.
c. Third-stage sampling of an individual among the adults in the household was done through SRS using a Kish methodology from the household roster.
We constructed the sampling design and provided the design to our survey firm to implement in conjunction with village and sub-village chairmen in the field. Our target sample was 2,000 individuals, and our final achieved sample is 2,001. This includes 100 interviews per district across 20 districts. In one district, Misungwi, only 99 interviews were recorded, while in another, Geita, 102 interviews were conducted.
Individuals were required to be at least 18 years old and were informed that they were participating in a research study. Participants who were assigned to the control group, however, were not informed about the deliberative
14
polling intervention. Individuals were also required to speak Kiswahili in order to participate in the survey and potentially the information and/or the deliberation treatment(s).
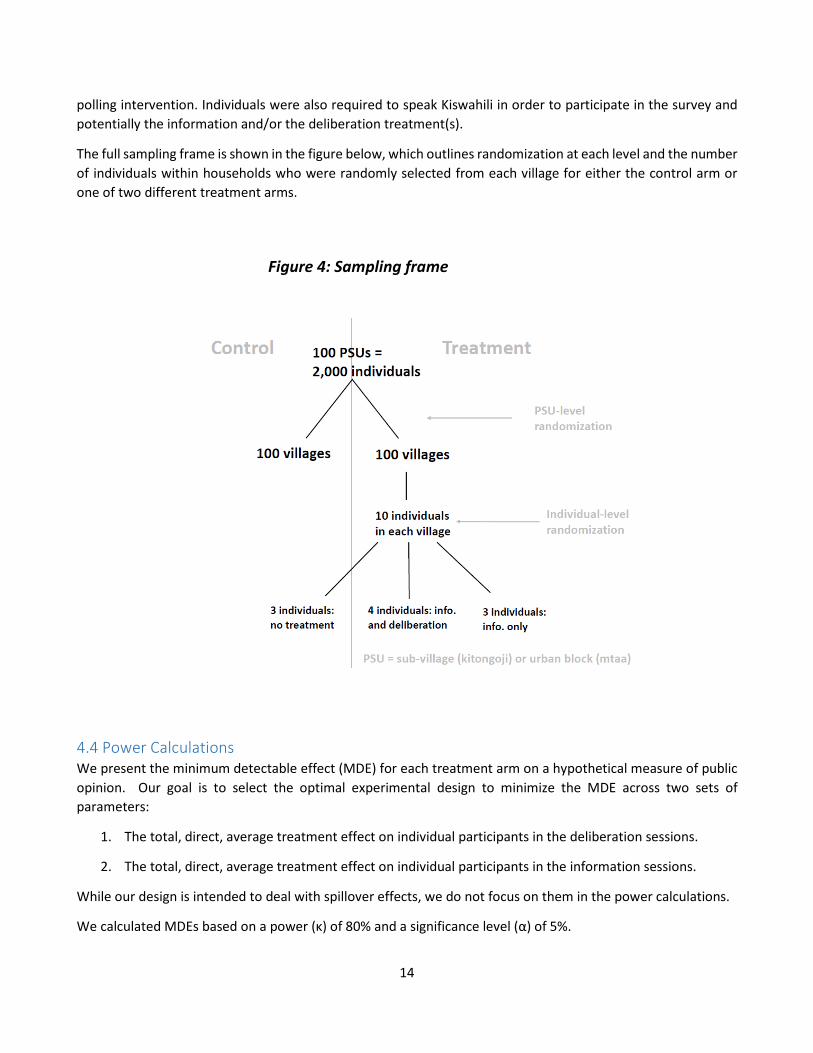
The full sampling frame is shown in the figure below, which outlines randomization at each level and the number of individuals within households who were randomly selected from each village for either the control arm or one of two different treatment arms.
Figure 4: Sampling frame
4.4 Power Calculations We present the minimum detectable effect (MDE) for each treatment arm on a hypothetical measure of public opinion. Our goal is to select the optimal experimental design to minimize the MDE across two sets of parameters:
1. The total, direct, average treatment effect on individual participants in the deliberation sessions.
2. The total, direct, average treatment effect on individual participants in the information sessions.
While our design is intended to deal with spillover effects, we do not focus on them in the power calculations.
We calculated MDEs based on a power (κ) of 80% and a significance level (α) of 5%.
15
A key unknown parameter was the intraclass correlation of responses within the PSUs of our clustered random sample. We estimated this correlation using data from Tanzania’s National Panel Survey (NPS), rounds 1 and 2. The NPS is uniquely suited to our purposes here, in that it (a) has a clustered sample design, (b) collects information on public opinion, in this case support for the respondent’s member of parliament, and (c) follows the same respondent over time to enable us to calculate variances and intraclass correlations in terms of both levels and changes. Using the NPS data, we conducted power calculations using a variety of possible outcome measures: MDEs in terms of a binary response variable, and levels and changes of both variables. Measuring impacts on the levels or changes in a binary response (approve/disapprove of MP) appears to be the most challenging benchmark for the MDE calculations with an intraclass correlation of approximately 0.16 in both cases. All calculations below use this parameter value as a conservative estimate of our anticipated MDE.
Because the experimental design proposed above involves unequal divisions of both PSUs and individuals between treatment and control groups (and between various treatment arms), the formulae listed above are not precise, and we know of no analytical solution for the MDE in this case. As a check, we performed simulations in Stata based on randomly generated numbers with the intraclass correlation found in the NPS and the sample design described above. Each repetition of the simulation produces slightly different standard errors and thus MDEs. We repeated the simulation 20 times and averaged the MDEs over all iterations.
As seen in the figure below, with 200 clusters we anticipate that we will be able to detect impacts on public opinion of roughly 7-8 percentage points in either direction on a binary outcome.
With regard to the analysis of heterogeneous effects on sub-groups described in a later section, we calculate the MDE for the subsample of respondents of a single gender. This amounts to reducing the sample size per cluster (from 10 to 5 on average) but keeping the number of clusters unchanged. Calculations show an MDE for the total effects of the deliberation treatment at approximately 10% for the single-gender sub-group and 14% for the information treatment.
Based on an earlier iteration of these power calculations, we opted to combine the two proposed information treatments to increase power (at the cost of the inability to distinguish between variants of information provision).
16
Figure 5: MDE power calcuations
5 Impact analysis and results We first present the results from the deliberative polling experiment conducted among a nationally representative sample of Tanzanian citizens, beginning with correlations, balance testing, and intent-to-treat effects before presenting the heterogenous treatment effects. We then overlay the elite polling results in a more simplified comparison of outcomes to the citizen polling results on select questions. Please note that coding for analysis was verified by multiple coders at CGD.
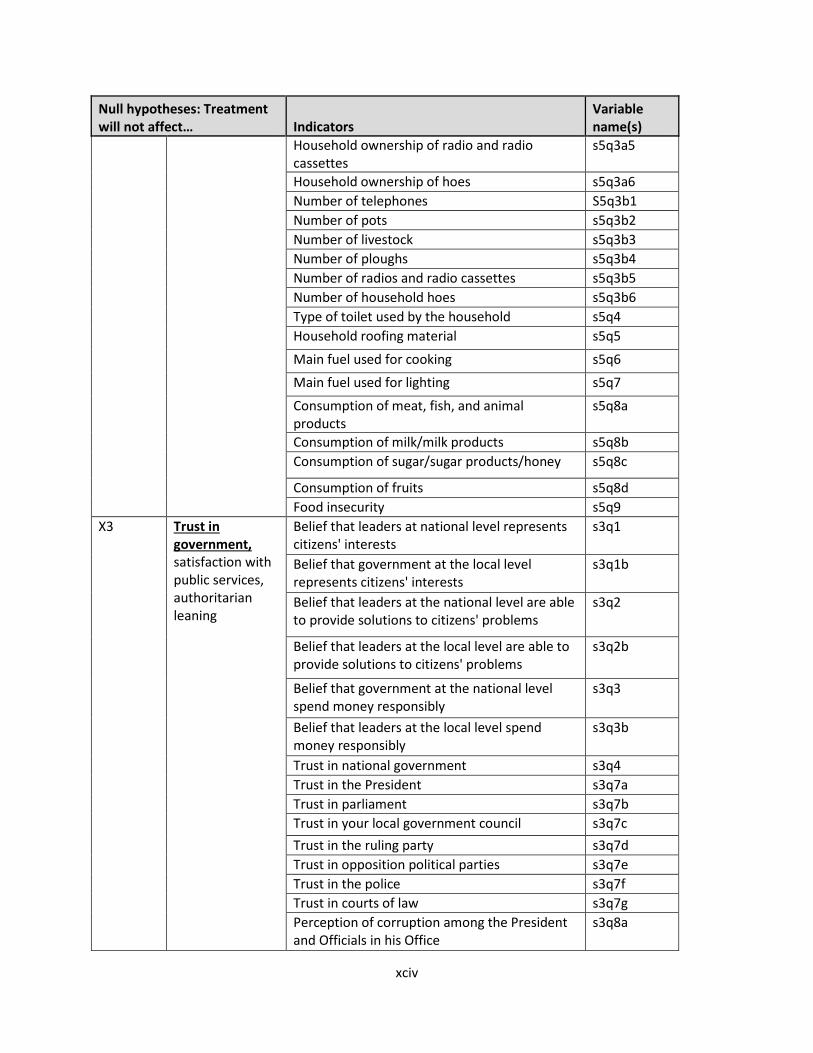
5.1 Correlations Before turning to the experimental results, we examine correlations between citizens' policy preferences at baseline and four covariates: gender, education, wealth, and trust in government.9 The results are presented in Table 2. Each column reports a separate multivariate regression, where each of our six main outcome indices is separately regressed on all four covariates. We find no statistically significant gender differences in opinion or knowledge at baseline. This is noteworthy, as the effects of the intervention do appear to vary somewhat by gender, as we explore below.
9 A full list of descriptive statistics of our full citizen sample is presented in Appendix I. Due to time constraints, we were not able to collect the same depth of descriptive statistics among the elite sample.
17
Educated respondents are more knowledgeable about gas, unsurprisingly, but also more opposed to cash transfers and more supportive of transparency measures.
Wealthier individuals also tend to oppose cash transfers, favor infrastructure over social services spending, and have lower demand for transparency measures.10 Trust in government is the only dimension (positively) correlated with support for commercialization of gas and with support for saving. More trusting individuals are also more likely to support cash transfers and have lower demand for transparency measures. These latter findings are interesting relative to the political discourse around cash transfers in Dar es Salaam, where they are often promoted by opposition politicians as a means of diverting resources away from the central government and ruling party. In addition to the data for the nationally representative sample of 2,001 adult Tanzanians, we also include 40 observations collected at baseline from the moderators at our deliberative event. We include a dummy in the regressions to control for differences between moderators and the general population. These differences are large. Moderators are significantly more in favor of saving, opposed to cash distribution, favor infrastructure spending over social spending, and have relatively little knowledge of the gas sector. On the last point, is important to keep in mind that this statement is true after controlling for education and wealth; almost all moderators have university degrees, while almost none of the broader sample does.
Note that each column reports a separate regression. Dependent variables are listed in the top row. Each dependent variable is the pre-treatment value of a mean effect index combining multiple survey responses, with mean zero and standard deviation of one at baseline. Standard errors are clustered at the level of the primary sampling unit (i.e., a village or urban block).
10 Note that the wealth measure here is not, at present, the measure proposed in our pre-analysis plan. The metric indicated in the PAP is under construction and will appear in future drafts.
18
5.2 Balance Given the logistics of the experiment, baseline data was not available at the time of randomization.11 Thus it is particularly important to verify that randomization did not produce any large discrepancies in outcomes between treatment groups. To test for balance, we regress the baseline values of our six main outcome indices on the various random assignment indicators.
In this notation j indexes clusters and i indexes individuals. The variable Zdelib equals one if the respondent was
invited to the information treatment and the deliberation treatment; Zinfo equals one if the respondent was
invited only to the information session; and Zspill equals one if the respondent was not personally assigned to any treatment, but resides in a village or urban block where other individuals were treated.
Turning to the results, there is no evidence of statistically significant imbalance on any of these six main outcomes, as reported in Table 3. In all cases, the differences between treatment arms are less than 0.1 standard deviation and insignificant at conventional levels.
Table 3: Balance test at baseline across six outcome indices
Each column reports a separate regression. Dependent variables are listed in the top row. Each dependent variable is the pre-treatment value of a mean effect index combining multiple survey responses, with mean zero and standard deviation of one at baseline. Standard errors are clustered at the level of the primary sampling unit (i.e., a village or urban block).
11 Cluster-level and individual-level randomization was programmed by the researchers in the once before baseline data collection commenced. Cluster-level assignment was known to the survey teams at the time of the baseline fieldwork.
19
5.3 Treatment effects We measure impacts on six outcome indices, listed below. In each case we regress the outcome variable in the follow-up poll on baseline responses and the set of random assignments.12
Subscripts 0 and 1 refer to the pre- and post-treatment rounds of data collection, respectively. Based on these variable definitions, β2 provides a measure of the total impact of information and deliberation combined; β3
measures the impact of information alone; and β4 measures spillovers within the village or urban block.
Given the length of the questionnaire, an obvious concern is that we will spuriously reject the null hypothesis of no treatment effect in some instances, i.e., multiple comparisons will generate false discovery. We deal with this multiple comparisons problem two ways, following standard practice in the social science experimental literature. First, we group outcomes into indices based on a priori judgments to reduce the total number of statistical tests. The definition of these six indices was pre-registered before the deliberation treatment and follow-up data collection. We calculate the indices following Kling et al. (2007) by (i) rescaling each indicator so that higher values indicate support for the hypothesis, (ii) computing z-scores for each indicator, (iii) averaging the indicators within an index, and (iv) creating z-scores for this composite index.
Second, because our analysis still involves at least six comparisons for each component of the experiment, we control the false discovery rate (FDR) using the procedure suggested by Anderson (2008) to calculate Benjamini et al. (2006) q-values, which we report in lieu of naive p-values where relevant.
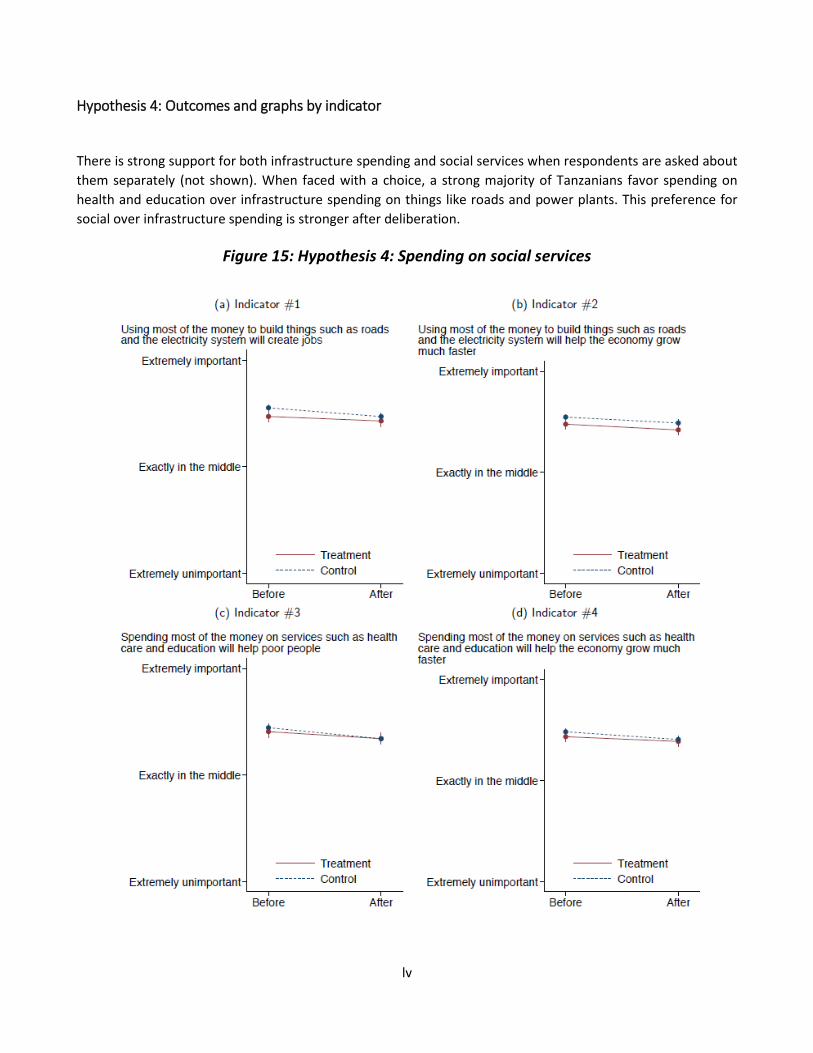
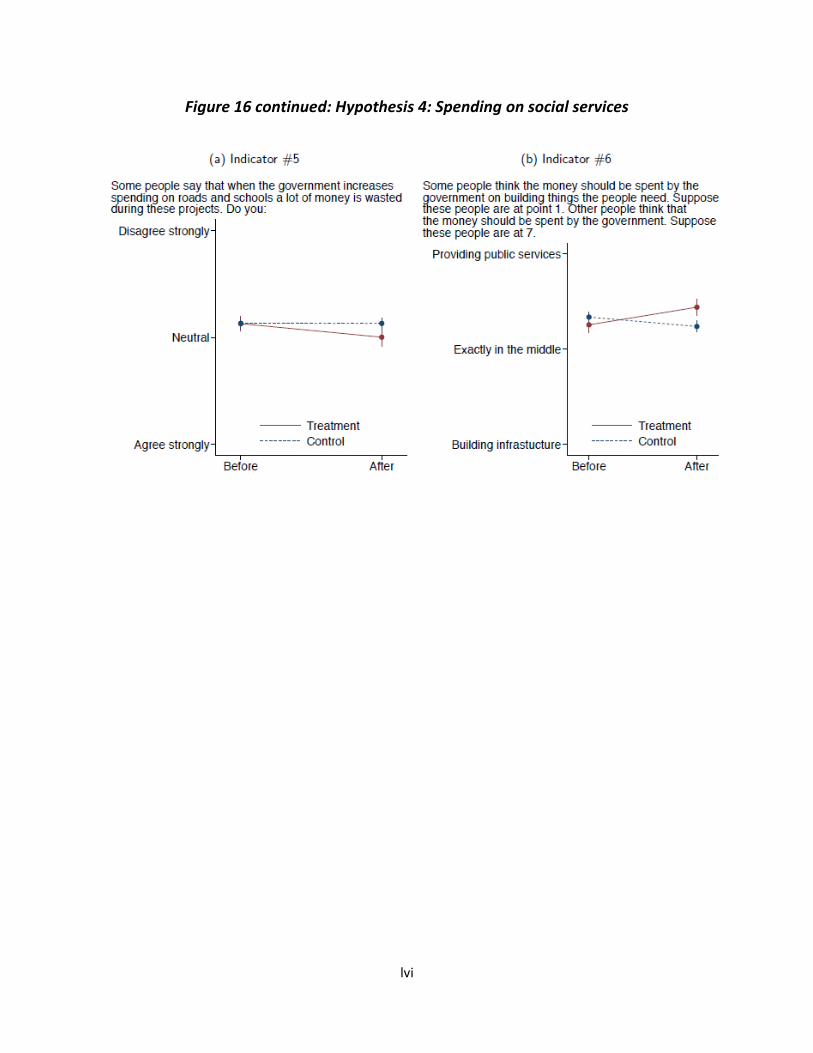
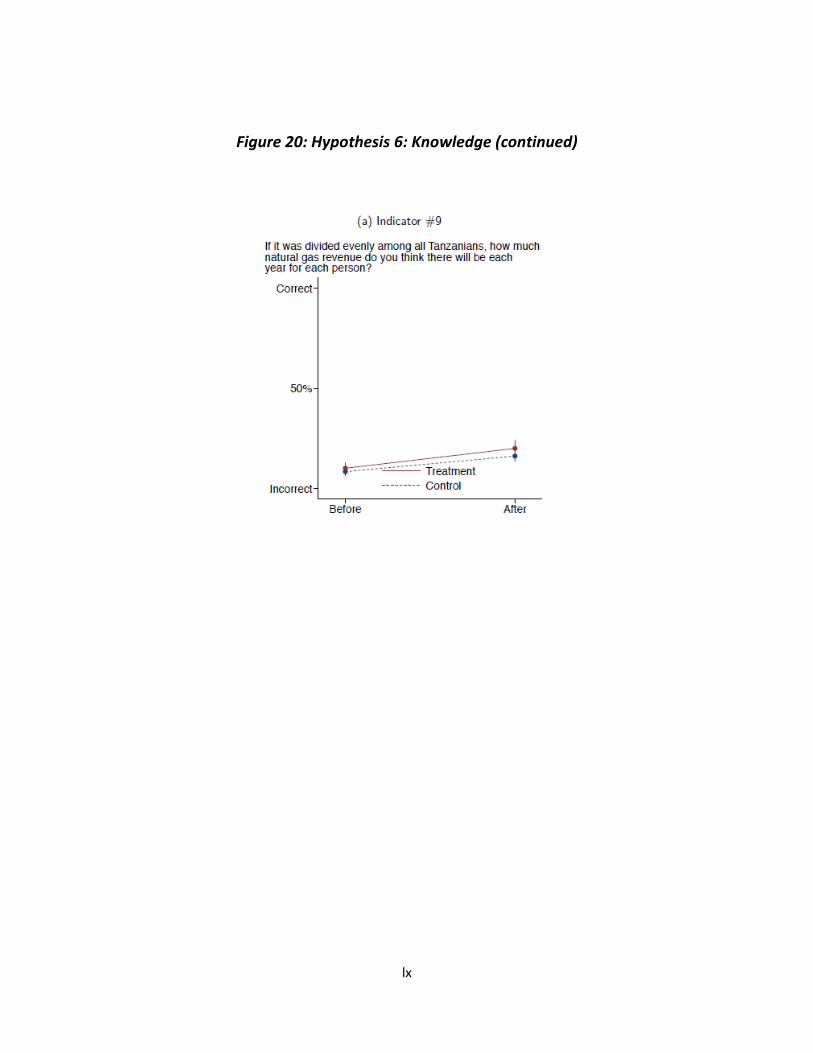
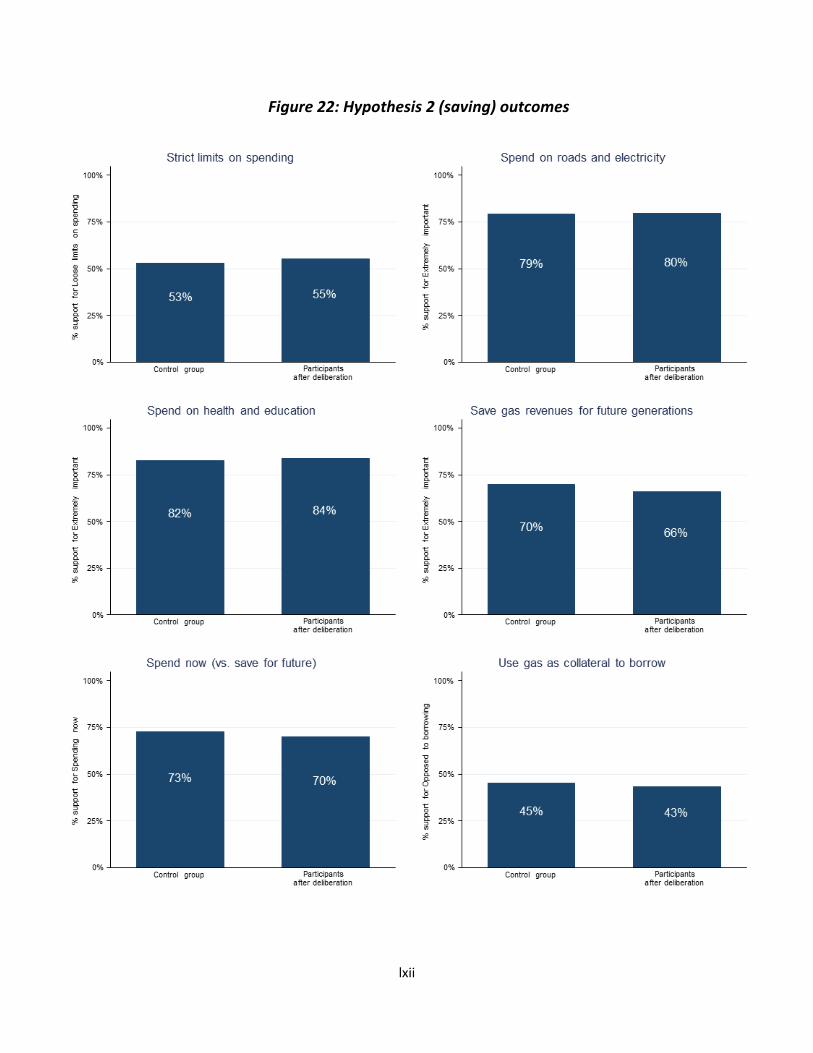
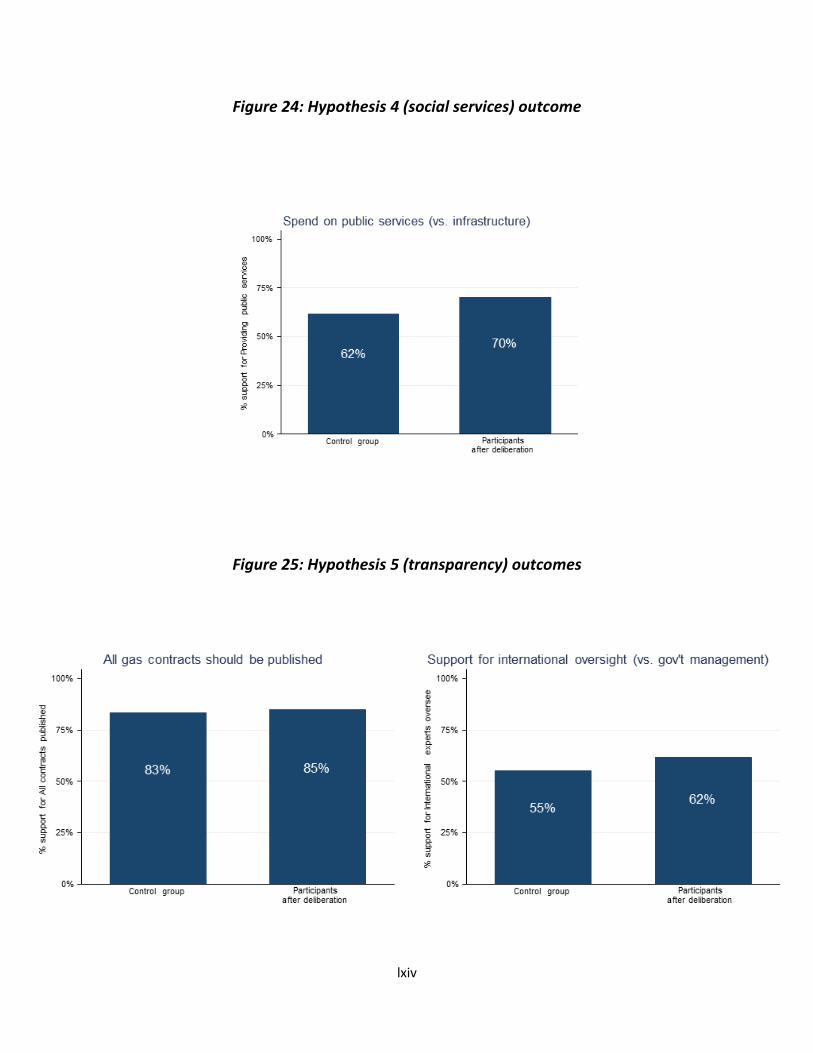
The results in Table 4 suggest that the information treatment alone had no detectable impact whatsoever on any outcome. In contrast, the combination of information and deliberation produced strong effects. The combined treatment increased support for extracting and selling the gas by nearly 0.3 standard deviations; did not affect support for saving gas revenues; reduced support for direct cash distribution by roughly 0.3 standard deviations; increased support for spending on social services rather than infrastructure by about 0.3 standard deviations; increased support for transparency and oversight by just under 0.2 standard deviations; and increased knowledge of the natural gas discovery by about 0.4 standard deviations. The only sign of a significant spillover effect is in the support for social services spending, where the positive effect of deliberation appears to have carried over to untreated individuals in the same cluster with roughly half of the magnitude of the main effect.13 Heterogenous treatment effects are presented below in Table 5.
12 Individual-level randomization was not known to the surveyors at the time of interview, and was automatically revealed by the survey software at the end of each interview. 13 Examining the q-values at the bottom of Table 4, the correction for multiple comparisons does not substantively affect our conclusions: effects on selling gas, cash distribution, social services, and knowledge remain significant at the 1% level, while effects on transparency remain only marginally significant.
20
Table 4: Summary of intent-to-treat (ITT) effects across six outcome indices
Obs. Add’l stats for info + delib.: BKY (2006) q-value
1857
1858
1857
1857
1858
1858
Horowitz-Manski-Lee bounds Lower
0.10
-0.38
-0.45
0.10
0.12
0.44
Upper 0.36 -0.04 -0.22 0.18 0.24 0.57
Note that each column reports a separate regression. Dependent variables are listed in the top row. Each dependent variable is the post-treatment value of a mean effect index combining multiple survey responses, with mean zero and standard deviation of one at baseline. Standard errors are clustered at the level of the primary sampling unit (i.e., a village or urban block).
Each column reports a separate regression. Dependent variables are listed in the top row. Each dependent variable is the post-treatment value of a mean effect index combining multiple survey responses, with mean zero and standard deviation of one at baseline. Standard errors are clustered at the level of the primary sampling unit (i.e., a village or urban block).
5.4 External validity As Tanzania realizes the potential of its newfound resource of natural gas, several other developing countries, in Sub-Saharan Africa in particular (e.g. , are making large discoveries of oil, gas, and minerals. Whether these resources create a platform for economic growth or lead countries into the resource curse trap depends heavily on institutional management and transparency and accountability. Deliberative
22
polling may be one way to effectively bridge the information and accountability gap between elites and largely uneducated and remote populations in similar developing country contexts.
Qualitative analysis The deliberative polling process is, by its very nature, quantitative. However, we integrated qualitative analysis within three components in the project. First, focus group discussions among our Study Group members and research partners reviewed and provided input for the design of the questions used in the survey instrument. Second, qualitative accounts of the deliberative process – captured in tape and video recordings – provided input into the dissemination of results, providing policymakers with a richer account of citizens’ views and rationales for their responses in the polling data. Third, qualitative analysis by the research team aided in understanding certain shifts in opinion from baseline to endline polling.
Cost-effectiveness The cost-effectiveness of providing informed citizen feedback to policymakers hinges on a few parameters that may help determine the feasibility of future projects. Perhaps unsurprisingly, we found that providing only information without deliberation had no significant impact beyond marginal knowledge gains. Deliberation was the key to changing participants’ perspectives. Information campaigns are far less costly than nationally representative deliberative polls, so the cost of intervention in this case can be relatively high. However, it is important to note that we found that policymakers did respond simply to the opinions of a nationally representative sample of citizens. Therefore, an intervention with only a nationally representative sample of the population may be cost-effective considering the potential impact on the policy process.
5.5 Elite results The outcomes from the citizen survey – summarized above – were used as input into a survey among a sample of Tanzanian elites in Dar es Salaam. Individuals in this elite sample were selected from mailing lists and event invitation lists at CSOs, NGOs, development banks, academia, and government offices in Dar es Salaam. All individuals were invited to a dissemination event in Dar es Salaam in early September 2015. We had over 50 individuals attend the event from an invitation list of about 280 elites in Dar es Salaam. We administered an abbreviated version of the full citizen survey to 44 individuals at this event. To expand our reach, we sent a digital version of the survey via email to about 230 additional individuals who were unable to attend the event.
A total of 124 individuals completed the survey: 44 completed the survey at the dissemination event and the remaining 80 individuals completed the digital version. Individuals within the sample – though they clearly self-selected when deciding to attend the event – were then randomized into control and treatment groups: 67 individuals were sampled for the control group, and 56 were sampled for the treatment group.
While the citizen survey included several questions on each of the five main issue areas, the elite survey was designed to present only a select list of questions to respect participants’ limited amount of time to participate in the survey. Questions which were considered to be core indicators for each of our five topical hypotheses (not including change in knowledge) were chosen for the elite survey. Questions from the elite survey are listed in Appendix VI.
Shown in the figure below are the treatment effects of showing elites the polling results from the deliberative polling experiment with citizens. The blue arrows connect the average citizen response in the control group to the average response among participants in the deliberation. The red arrows do the same for the elite sample, representing the effect of exposure to citizen poll results.
23
Figure 6: Treatment effects of providing polling evident to elites
Citizens: effect of deliberation Elites: effect of poll results
National gov’t spends responsibly 0.308*** -0.103 109 (0.055) (0.086)
Local gov’t spends responsibly 0.231*** 0.058 110 (0.054) (0.085)
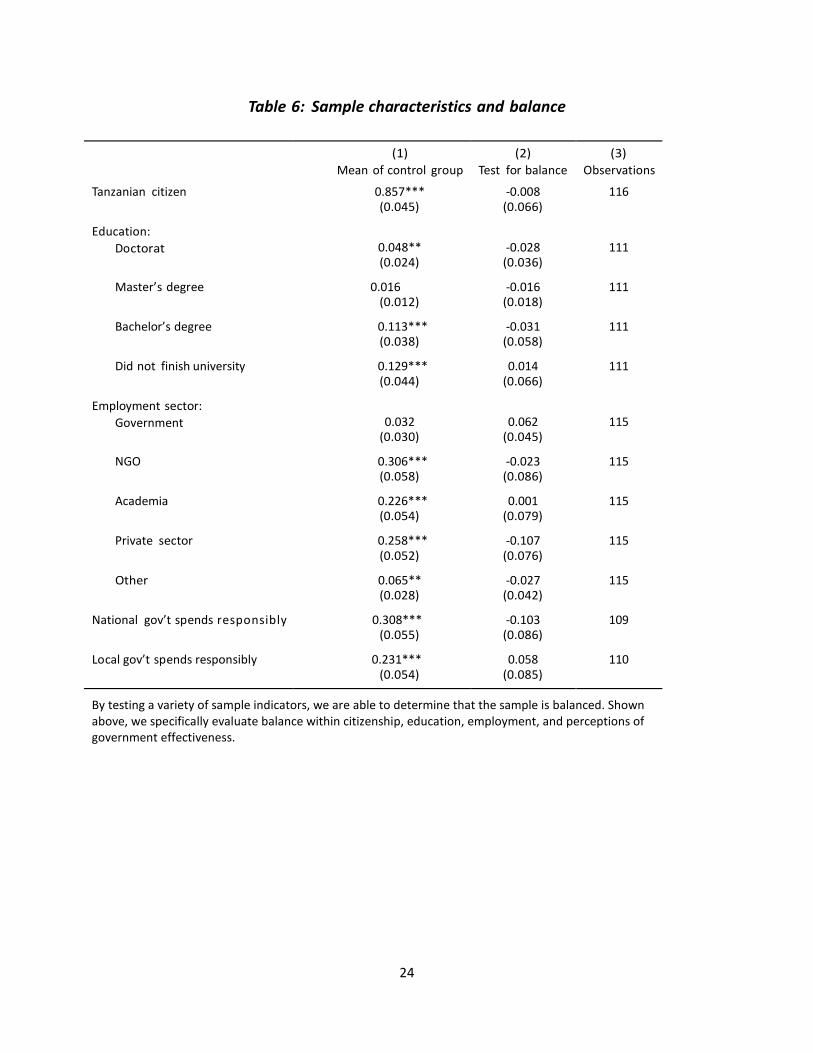
By testing a variety of sample indicators, we are able to determine that the sample is balanced. Shown above, we specifically evaluate balance within citizenship, education, employment, and perceptions of government effectiveness.
25
Table 7: Elite versus citizen views
Mean of control group Gap Treatment effect
(1)
Citizens
(2)
Elites
(3)
=(2)-(1)
(4)
On citizens
(5)
On elites
Sell gas versus use for energy 0.16*** 0.09* -0.07 0.10*** 0.10 (0.03) (0.05) (0.04) (0.03) (0.07)
Save for future versus spend now -0.26*** 0.01 0.17*** 0.03 -0.19*** (0.02) (0.04) (0.04) (0.03) (0.06)
Don’t use gas as collateral to borrow 0.01 0.20*** 0.19*** -0.01 0.15*** (0.03) (0.03) (0.03) (0.03) (0.05)
Distribute revenue directly to people -0.25*** -0.32*** -0.09*** -0.06** -0.04 (0.02) (0.03) (0.03) (0.03) (0.05)
Distribute revenue in personal savings accounts -0.32*** 0.09* 0.33*** 0.04* 0.03 (0.02) (0.05) (0.04) (0.02) (0.07)
Spend on public services versis infrastructure 0.09*** 0.05 -0.02 0.10*** 0.12* (0.03) (0.04) (0.04) (0.03) (0.07)
Publish all gas contracts 0.26*** 0.41*** 0.03 0.02 -0.07 (0.03) (0.03) (0.03) (0.02) (0.05)
Independent, international oversight of gas 0.01 -0.08* -0.10** 0.07** 0.09 (0.03) (0.05) (0.04) (0.03) (0.08)
The nine questions that were administered to both the citizen- and elite-samples are listed in the left column. All survey responses have been rescaled with a mean of zero and range of one, [−0.5, 0.5]. The first two columns show simple averages (with corresponding standard errors) from the control groups. Significance stars represent a test that the mean is zero, i.e., perfect indifference. The third column tests the hypothesis that elites and citizens agree, on average. Column 4 reports the treatment effect of deliberation on the citizen sample; column 5 reports the treatment effect of exposure to the citizen poll results on elite responses. For all statistics using the citizen sample, standard errors are clustered at the level of the primary sampling unit (i.e., a village or urban block).
6 Attrition The baseline survey interviewed 2,001 individuals. Post-treatment interviews for all treatment groups and the control groups were conducted by mobile phone. In total, we were able to interview 1,669 respondents during the post-treatment poll, or 83.5% of the baseline sample.
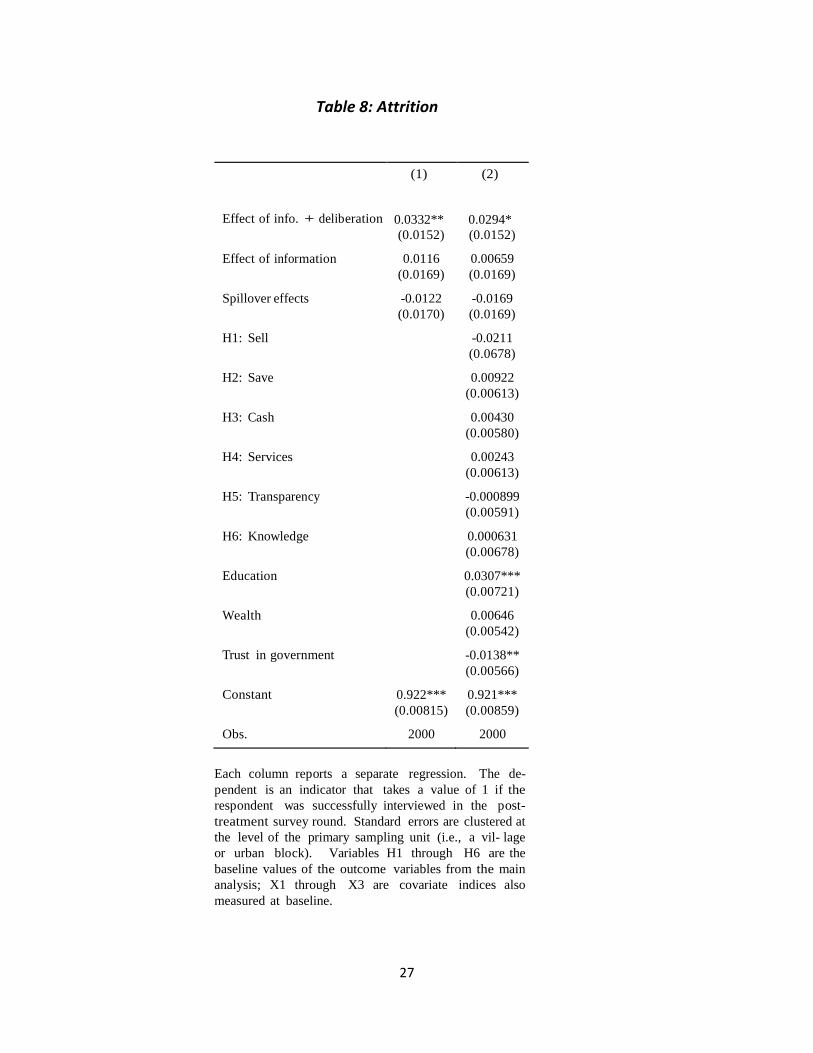
The attrition of the remaining 16.5% of the sample introduces the possibility of bias in our experimental estimates. To examine this possibility, we first measure the observable correlates of attrition in our baseline data. Results in Table 8 show that we were about 3% more likely to interview respondents in treatment villages
26
relative to control villages, though this difference is not significant. However, respondents who were invited to the deliberation were significantly (8.7%) more likely to be interviewed post-treatment relative to control individuals.
Baseline outcome variables have limited predictive power in the attrition regression, with the exception of support for direct cash distribution, which positively predicts inclusion in the post-treatment sample. The other baseline covariates are better predictors of attrition. Individuals who are more educated or have more information, wealthier, and less trusting of government are more likely to be included in the post-treatment sample.
These results cannot be definitive as to whether attrition introduces bias in our treatment effect estimates, as attriters may also differ on unobserved dimensions. To address this possibility, we estimate non-parametric bounds (Horowitz and Manski, 2000; Lee, 2009) on our main treatment effects. These bounds are reported at the bottom of Table 4. We focus on bounding the total effect of information and deliberation combined, as this is the only treatment arm where we find large and robust treatment effects across multiple outcome measures.
27
Table 8: Attrition
Effect of info. + deliberation
(1)
0.0332**
(2)
0.0294* (0.0152) (0.0152)
Effect of information 0.0116 0.00659 (0.0169) (0.0169)
Each column reports a separate regression. The de- pendent is an indicator that takes a value of 1 if the respondent was successfully interviewed in the post- treatment survey round. Standard errors are clustered at the level of the primary sampling unit (i.e., a vil- lage or urban block). Variables H1 through H6 are the baseline values of the outcome variables from the main analysis; X1 through X3 are covariate indices also measured at baseline.
28
7 Conclusions and recommendations The previous sections summarized results for individuals who were or were not invited to participate in the information and deliberation sessions. Because people were randomly assigned to the groups, comparing their responses provides an unbiased measure of the impact of information and deliberation on public opinion. The figure below summarizes all of these findings. To simplify, we have combined all the responses under each of the five headings discussed above into an index. The details of these indices are discussed in the companion CGD working paper, and in the pre-analysis plan registered at the American Economic Association website (https://www.socialscienceregistry.org/trials/689.). In addition to the five policy topics discussed above, we also report on a measure of knowledge about natural gas, based on a respondent’s awareness of where gas is located, when it was discovered, etc. Results show that the combination of information and extended, structured, participatory deliberation generated (i) a measurable increase in knowledge of the gas sector; (ii) increased support for sale of natural gas and reduced support for energy subsidies; (iii) no change in support for saving versus spending gas revenues; (iv) a decline in support for direct cash distribution of resource rents to citizens; (v) increased support for spending on social services as opposed to infrastructure; and (vi) a marginally significant increase in support for transparency and oversight measures. Democratic deliberation appears to be the key to these changes; the information treatment alone produced no significant impacts, and impacts did not spill over onto individuals in the same community who did not participate in deliberation.
Elite polling results reveal a propensity among elites in Dar es Salaam to align their views with citizens. On nearly every question, the treatment group of elites expressed similar preferences to the treatment group of citizens, which suggests that deliberative polling may aid in creating an accountability loop in which elites who are more informed of citizens’ views may make decisions that more closely resemble the majority of citizen preferences.
In terms of external validity, experimental evidence from this study as well as Fujiwara and Wantchekon (2013), Wantchekon (2015), and Humphreys et al. (2007) demonstrates the potential power of deliberative exercises in transforming people’s opinions and impacting the political process. This is especially true from democratic societies, which benefit from and allow direct citizen participation.
29
Figure 7: The impact of information & deliberation on knowledge and public opinion
Note: Each cell shows the impact of information alone, or information plus deliberation on the outcome listed in the top row. The symbol (+) denotes a significant positive effect, (-) a significant negative effect, and “x” no significant effect.
7.1 Differences in opinion by demographic and socio-economic groups In addition to measuring the impact of the experimental treatments – i.e. information and deliberation – it is also informative to see whether standard demographic and socio-economic variables are associated with differences in knowledge or opinion about natural gas.
We examine four factors that might influence knowledge and opinion: gender, education, wealth, and individuals’ prior levels of trust in government.
For each of the six indices used above (a measure of gas knowledge, plus the five policy indices) we regress the index on these four variables. For instance, in the first column of the graph, we regress an individual’s knowledge on their gender, education, wealth, and trust, and find that only education has a statistically significant – and as it happens, positive – association with knowledge about gas. This positive association is denoted with a green plus sign.
We find no statistically significant gender differences in opinion or knowledge at baseline. This is noteworthy, as the effects of the intervention do appear to vary somewhat by gender, as we explore below.
Educated respondents are more knowledgeable about gas, unsurprisingly, but also more opposed to cash transfers and more supportive of transparency measures.
30
Wealthier individuals also tend to oppose cash transfers, favor infrastructure over social services spending, and have lower demand for transparency measures.14
Trust in government is the only dimension (positively) correlated with support for commercialization of gas and with support for saving. More trusting individuals are also more likely to support cash transfers and have lower demand for transparency measures. These latter findings are interesting relative to the political discourse around cash transfers in Dar es Salaam, where they are often promoted by opposition politicians as a means of diverting resources away from the central government and ruling party.
14 Note that the wealth measure here is not, at present, the measure proposed in our pre-analysis plan. The metric indicated in the PAP is under construction and will appear in future drafts.
31
Figure 8: Individual characteristics associated with knowledge and opinions about gas
Note: Each column shows a separate, multivariate regression. The dependent variable is listed along the top row. Each cell shows the relationship between the independent variable in the first column and the outcome listed in the top row. The symbol (+) denotes a significant positive relationship, (-) a significant negative relationship, and “x” no significant relationship.
32
8 References
Anderson, M. L. (2008). Multiple inference and gender differences in the effects of early intervention: A reevaluation of the abecedarian, perry preschool, and early training projects. Journal of the American Statistical Association 103(484).
Benjamini, Y., A. M. Krieger, and D. Yekutieli (2006). Adaptive linear step-up procedures that control the false discovery rate. Biometrika 93(3), 491-507.
Birdsall, N., J. Fishkin, M. Moyo, and J. Sandefur (2015). Deliberative democracy and resource rents in Tanzania. AEA RCT Registry, https://www.socialscienceregistry.org/trials/689.
Casey, K. E., R. Glennerster, and K. Bidwell (2014). Debates: The impact of voter knowledge initiatives in Sierra Leone. Stanford, Graduate School of Business, Working Paper No. 3066.
Collier, P., R. Van Der Ploeg, M. Spence, and A. J. Venables (2010). Managing resource revenues in developing economies. IMF Staff Papers 57(1), 84-118.
de la Cuesta, B., H. V. Milner, D. Nielson, and S. Knack (2015). No greater representation with taxation: Experimental evidence from Ghana and Uganda on citizen action toward oil, aid, and taxes. Downloaded on January 4, 2016 at http://goo.gl/uljhCT.
Fujiwara, T. and L. Wantchekon (2013). Can informed public deliberation overcome clientelism? Experimental evidence from Benin. American Economic Journal: Applied Economics 5(4), 241-255.
Horowitz, J. L. and C. F. Manski (2000). Nonparametric analysis of randomized experiments with missing covariate and outcome data. Journal of the American Statistical Association 95(449), 77-84.
Humphreys, M., W. A. Masters, and M. E. Sandbu (2006). The role of leaders in democratic deliberations: Results from a field experiment in São Tome and Principe. World Politics 58(04), 583-622.
Kling, J. R., J. B. Liebman, and L. F. Katz (2007). Experimental analysis of neighborhood effects. Econometrica 75(1), 83-119.
Lee, D. S. (2009). Training, wages, and sample selection: Estimating sharp bounds on treatment effects. The Review of Economic Studies 76(3), 1071-1102.
Paler, L. (2013). Keeping the public purse: An experiment in windfalls, taxes, and the incentives to restrain government. American Political Science Review 107(04), 706-725.
Ross, M. L. (1999). The political economy of the resource curse. World Politics 51(02), 297-322. Van der Ploeg, F. (2011). Natural resources: Curse or blessing? Journal of Economic Literature, 366-420. Wantchekon, L., G. L_opez-Moctezuma, T. Fujiwara, C. P. Lero, and D. Rubenson (2014). Policy deliberation and
voting behavior: A campaign experiment in the Philippines. Downloaded on January 4, 2016 at http://scholar.princeton.edu/sites/default/_les/lopezmoctezuma/_les/philippines apsa.pdf.
xxxiv
Appendix I: Measuring household socio-economic status
Household consumption is the basis for official poverty and inequality estimates in Tanzania. To measure the socio-economic status of our poll respondents, we rely on a predicted measure of household consumption expenditure, using sixty-four consumption predictors in our poll data. These sixty-four predictors are based on questions borrowed from the questionnaire for Tanzania's National Panel Survey (NPS round 2, 2010/11), a nationally representative household survey conducted by Tanzania's National Bureau of Statistics to produce poverty estimates. We constructed our consumption prediction as follows:
1. As preparation for the poll, we used the existing NPS data to perform a stepwise regression of consumption on dozens of candidate predictors. Our consumption measure is the natural logarithm of total household consumption per annum per adult equivalent, measured in 2011 PPP dollars (henceforth C). Questions were selected for inclusion in the poll based on their predictive power in the stepwise regression and the ease of administering them in the field.
2. We use the final set of sixty-four indicators that overlap between the NPS and the poll to fit a simple regression model of C in the NPS data. The regression is performed at the level of the individual household member, with a sample size of 9,015 individuals, and predictors are a combination of household and individual characteristics. Results are shown in Table 9. The R-squared of the model is fairly high, at 0.64. Inevitably, the variance of the predicted values (0.61) is somewhat lower than the actual consumption data (0.73), but as seen in Figure 9a, the distributions correspond fairly closely.
3. Finally, we apply the regression parameters from the model of C in the NPS data to the individuals in the polling data, generating our measure of predicted consumption, Ĉ. As seen in Figure 9b, the distribution of Ĉ in the polling data corresponds quite closely to the distribution of Ĉ in the NPS sample, suggesting the poll achieved a relatively representative national sample and that questions were administered and understood consistently across the two samples. The mean and standard deviation of Ĉ are 6.9 and 0.61 in the NPS sample and 6.8 and 0.57 in the poll data.
In the main text we refer to this measure of Ĉ simply as `consumption.'
xxxv
Table 9: Consumption predictors Sample mean Regression coefficient
Hunger during a week 1.656 0.395 0.0657 (0.475) (0.489) (0.0101)
Constant 7.405 (0.0728)
R-squared 0.64 Obs. 9008
Column 1 reports the mean of each varialbe in the NPS sample, with standard deviations in parentheses. Col- umn 2 reports the same statistics for the poll sample. Column 3 reports coefficients on these same variables from a regression of log household consumption per adult equivalent per annum (in 2011 PPP dollars) us- ing the NPS data. The set of independent variables consists of demographic and other indicators that were measured in both the NPS and the polling data at baseline.
xl
Figure 9: Distribution of actual and predicted household consumption
xli
Appendix II: Descriptive statistics
Shown below are basic tabulations of several socioeconomic and substantive survey variables. Listed are the number of observations, mean, standard deviation, minimum response, and maximum response.
Table 10: Descriptive statistics of socioeconomic and trust variables
(1) (2) (3) (4) (5) VARIABLES N mean sd min max
Personal Characteristics male 2,001 0.474 0.499 0 1 age 2,001 35.94 11.07 18 60 can read/write? 2,001 0.812 0.391 0 1 years of schooling 2,001 6.591 3.418 0 18 work in last 7 days? 2,001 0.775 0.418 0 1 Trust in institutions interests well represented by nat’l govt.? 1,907 0.421 0.494 0 1 nat’l leaders help solve your problems? 1,939 0.473 0.499 0 1 nat’l govt. spends money responsibly? 2,001 0.307 0.462 0 1 interests well represented by loc. govt.? 1,917 0.541 0.498 0 1 local leaders help solve your problems? 1,942 0.582 0.493 0 1 local govt. spends money responsibly? 2,001 0.378 0.485 0 1 trust nat’l govt. to do things right? 1,989 5.858 3.371 0 10 trust the President? 1,935 2.944 1.036 1 4 trust the Parliament? 1,956 2.874 1.029 1 4 trust your Local Government Council? 1,937 2.783 1.012 1 4 trust the ruling party? 1,971 2.774 1.116 1 4 trust opposition political parties? 1,945 2.434 1.131 1 4 trust the police? 1,974 2.772 1.051 1 4 trust the courts of law? 1,967 2.927 1.014 1 4 Assessment of corruption (How many involved in corruption?) president and officials in his office 1,664 1.956 0.760 1 4 members of parliament 1,749 1.997 0.674 1 4 your Local Government Council 1,738 2.015 0.714 1 4 the ruling party 1,767 2.059 0.770 1 4 opposition political parties 1,689 1.961 0.763 1 4 the police 1,805 2.310 0.839 1 4 courts of law 1,772 2.182 0.806 1 4
Ownership of assets telephone owner 2,001 0.789 0.408 0 1
xlii
stove owner 2,001 0.514 0.500 0 1 livestock owner 2,001 0.496 0.500 0 1 plough owner 2,001 0.111 0.315 0 1 radio and radio cassette owner 2,001 0.577 0.494 0 1 hoe owner 2,001 0.817 0.387 0 1 Consumption over the past 7 days: how many days out of 7 were these consumed? meat/fish/animal products 2,001 1.874 2.083 0 7 milk/milk products 2,001 1.340 2.262 0 7 sugar/sugar products/honey 2,001 3.900 3.089 0 7 fruits 2,001 2.299 2.658 0 7 worry about not enough food? 2,001 0.403 0.491 0 1
xliii
Appendix III: Results
Table 11: Levels and changes by indicator and treatment group Control Information Info. + Deliberation Balance Diff-in-Diff
All variables are rescaled so that the midpoint, representing in- difference, is zero. The range of each variable is one, extending from -0.5 to 0.5. Column 1 shows the average value for the control group of each indicator in the baseline survey, and column 2 for the follow-up survey. Column 3 shows the change between periods. Columns 4 to 6 repeat this for the information only treatment group, and columns 7 to 9 for the group assigned to information plus deliberation. Columns 10 and 11 report balance tests at baseline. Columns 12 and 13 report difference-in- differences, comparing changes over time in each treatment group to changes in the control group. Standard errors, clustered at the village level, are reported in parentheses.
xlvii
Appendix IV continued: ITT effects
Table 15: ITT effects by indicator
Info + delib
(1)
Info
(2)
Spillovers
(3)
Baseline value
(4)
Constant
(5)
N
(6)
H1: Sell
Sell gas (vs use for energy) 0.087*** 0.016 -0.003 0.043* 0.713*** 1854.000
(0.025) (0.029) (0.030) (0.024) (0.025)
Do not subsidize energy 0.060** -0.026 0.021 -0.014 0.346*** 1856.000
(0.025) (0.026) (0.027) (0.023) (0.017)
Extract vs leave in ground -0.010 -0.030 -0.020 0.857*** 1857.000
(0.019) (0.023) (0.022) (0.012)
Sell gas vs fuel (2) 0.067** 0.014 -0.044 0.583*** 1857.000
(0.027) (0.028) (0.029) (0.017)
Do not subsidize energy (2) 0.030 -0.010 -0.012 0.263*** 1855.000
(0.022) (0.024) (0.023) (0.014)
H2: Save
Strict limits on spending 0.035 0.044 -0.019 0.007 0.632*** 1856.000
(0.025) (0.029) (0.029) (0.026) (0.023)
Don’t spend on infrastructure -0.010 -0.003 0.008 0.029 0.172*** 1855.000
(0.018) (0.020) (0.021) (0.028) (0.012)
Don’t spend on health & educ. -0.009 -0.004 0.018 0.075*** 0.156*** 1857.000
(0.017) (0.017) (0.019) (0.029) (0.011)
Save for future generations -0.040* -0.033 -0.050** 0.085*** 0.658*** 1857.000
(0.022) (0.023) (0.025) (0.021) (0.019)
Save for future vs spend now 0.022 0.015 0.000 0.025 0.352*** 1857.000
(0.024) (0.028) (0.026) (0.022) (0.019)
Don’t use gas as collateral -0.009 0.001 -0.017 0.081*** 0.611*** 1857.000
(0.024) (0.025) (0.027) (0.030) (0.025)
H3: Direct distribution
Give money to all -0.104*** -0.033 -0.014 0.160*** 0.542*** 1857.000
(0.025) (0.026) (0.026) (0.023) (0.021)
Give money to needy -0.092*** 0.008 -0.020 0.120*** 0.615*** 1855.000
...the entire government budget? 0.022 0.047 -0.080** 0.101* 0.158*** 527.000
(0.046) (0.050) (0.041) (0.052) (0.025)
...the entire national economy? -0.034 0.038 0.090 -0.095** 0.140*** 325.000
(0.046) (0.072) (0.063) (0.041) (0.030)
How much if divided equally? 0.037 0.019 0.002 0.068* 0.157*** 1857.000
(0.024) (0.027) (0.026) (0.035) (0.013) Note that each row is a separate regression.
l
Appendix IV continued: Outcome graphs by indicator Hypothesis 1
When not presented with any alternative policy options, a majority of Tanzanians support using gas revenue to reduce the cost of electricity or subsidize fuel. The picture changes when respondents are faced with a trade-off. A majority of Tanzanians supports selling natural gas, rather than using it to make electricity cheaper for all Tanzanians. This support is weaker (but still a majority) when compared to subsidizing fuel specifically (see figure below). However, only a minority supports selling the gas when the alternative policy option is discounting electricity for local industry. Information and deliberation move public opinion in favor of selling gas and away from both fuel and industry subsidies.
Figure 10: Hypothesis 1: Extraction and sale
li
Hypothesis 2: Outcomes and graphs by indicator Tanzanians support “strict limits” on spending gas revenue when presented in the abstract. In the abstract, most Tanzanians also support increased spending on social services and on infrastructure, like roads and electricity. When presented with a choice between saving and spending on government programs, a strong majority opts for spending. Information and deliberation do not weaken Tanzanians’ preference for spending over saving. Note, however, that very few Tanzanians support using gas as collateral to borrow internationally. Deliberation reduces this support even further.
Figure 11: Hypothesis 2: Saving
lii
Figure 12: Hypothesis 2: Saving (continued)
liii
Hypothesis 3: Outcomes and graphs by indicator
A majority of Tanzanians support direct distribution of resource rents. (Note that a majority also support spending on government programs. Support is much stronger for transfers targeting households with children or the elderly. An even stronger majority supports transferring revenue to child savings accounts and retirement accounts. However, when posed with a trade-off between cash transfers and government programs, a large majority of Tanzanians choose government programs. Support for direct distribution falls after the information and deliberation treatments.
Figure 13: Hypothesis 3: Direct distribution through cash transfers
liv
Figure 14: Hypothesis 3: Direct distribution through cash transfers (continued)
lv
Hypothesis 4: Outcomes and graphs by indicator
There is strong support for both infrastructure spending and social services when respondents are asked about them separately (not shown). When faced with a choice, a strong majority of Tanzanians favor spending on health and education over infrastructure spending on things like roads and power plants. This preference for social over infrastructure spending is stronger after deliberation.
Figure 15: Hypothesis 4: Spending on social services
lvi
Figure 16 continued: Hypothesis 4: Spending on social services
lvii
Hypothesis 5: Outcomes and graphs by indicator
An overwhelming majority of Tanzanians supports publishing all natural gas contracts. This is true with or without deliberation. A majority of Tanzanians supports a role for international oversight of Tanzanians’ gas revenue, and this majority grows after receiving more information and participating in deliberation. It is notable that wealthier and more educated Tanzanians have little trust in government, as opposed to those less wealthy and less educated who demonstrate a greater trust in government. This could help to explain why citizens showed less preference for receiving cash transfers from the government after information and deliberation treatments.
Figure 17: Hypothesis 5: Transparency
lviii
Hypothesis 6: Outcomes and graphs by indicator
The hypothesis index for knowledge was the only index that was significantly impacted by providing only information to people. All other indices remained relatively unchanged by the treatment without deliberation treatment. Overall, knowledge increased for individuals in both treatment groups, but more so for those in the deliberation treatment group.
Figure 18: Hypothesis 6: Knowledge
lix
Figure 19: Hypothesis 6: Knowledge (continued)
lx
Figure 20: Hypothesis 6: Knowledge (continued)
lxi
Appendix IV continued: outcomes, bar graphs
Figure 21: Hypothesis 1 (extraction and sale) outcomes
On the following page you will find the primary survey instrument used during baseline and follow-up mobile phone polling among the nationally representative sample. However, three questions in the instrument below were not included in the baseline survey: questions #5*, 6*, and 14*. These questions were only asked during follow-up polling.
EDI reformatted this version of the survey in their licensed Surveybe software to administer on tablets and to expedite data collection and coding. The content of the survey remained the same.
lxvi
# QUESTION
ANSWER PRE-INTERVIEW (POSSIBLY DIFFERENT
RESPONDENT)
ID & LOGISTICS i. Interviewer's name: MENU
ii. Head of household's/Respondent name: FREE TEXT
iii. District: MENU
iv. Cluster (three boxes with drop-down bubble number 0-9)
3-DIGITS
v. Household (three boxes with drop-down bubble numbers 0-9)
3-DIGITS
vi. Respondent (member number two boxes with drop-down bubble numbers)
2-DIGITS
vii. Interviewer (three boxes with drop-down bubble numbers 0-9)
3-DIGITS
viii. Results a COMPLETE WITH SELECTED HOUSEHOLD b REFUSAL - COMPLETED WITH REPLACEMENT c NOT FOUND - COMPLETED WITH REPLACEMENT d INCOMPLETE
ix. Date (two boxes for date with drop-down bubble numbers for 0-3 and 0-9; two boxes with drop-down bubble numbers for 0-1 and 0-9; two boxes for year with 0-9 drop-down bubble numbers
DD/MM/YYYY
x. Start time (two boxes for 0-1 and 0-9 for hour and then 0-5 and 0-9 for minutes drop-down bubble numbers; also include AM and PM bubbles)
HH:MM (AM/PM)
xi. End time HH:MM (AM/PM)
ROSTER
xii. Write down the names of all persons who normally live and eat together in this household starting with the head
[MARK "HEAD" AND "MAIN RESPONDENT" AND RECORD NAMES IN COLUMNS THAT CAN CONTINUE THROUGHOUT THE INTERVIEW SHEETS]
xiii. Is [NAME] male, female or other? a MALE b FEMALE
xiv. How long has [NAME] been away in the last 12 months? [FOR HOUSEHOLD MEMBERS 1 YEAR OF AGE OR OLDER ONLY]
a Never b Less than 6 months c 6 months or more
xv. What is [NAME]'s relationship to the head of household?
a HEAD b SPOUSE c CHILD d PARENT e OTHER RELATIVE f NOT RELATED
xvi. How old was [NAME] at last birthday? 2 DIGIT NUMBER
xvii. What is [NAME]'s marital status? [RESPONDENTS 12 YEARS OF AGE OR OLDER ONLY]
a Never married b Married c Divorced d Separated e Widowed
xviii. 0 NONE
lxvii
What is the highest grade [NAME] has completed? [FOR HOUSEHOLD MEMBERS 3 YEARS OF AGE OR OLDER ONLY]
1 Pre-Primary 2 Adult 11 Standard I 12 Standard II 13 Standard III 14 Standard IV 15 Standard V 16 Standard VI 17 Standard VII 18 Standard VIII 19 Primary + Course 20 Form I 21 Form II 22 Form III 23 Form IV 24 Form IV + Course 25 Form V 26 Form VI 27 Form VI + Course 28 Ordinary diploma 41 University I 42 University II 43 University III 44 University IV 45 University V &+ -99 DON'T KNOW
xix. Write down all phone numbers in the household
10-DIGIT NUMBER
xx. Record phone number for phone provided to household
xxi. Record phone numbers and addresses of two references
NATURAL GAS
TRANSPARENCY & ACCOUNTABILITY
1 What, if anything, have you heard about Tanzania's recent natural gas discoveries? Tanzania has…
a Not begun extracting or exporting the gas
b Begun extracting the gas but not exporting it
c Begun extracting and exporting the gas
d I haven't heard anything about the natural gas
e DON'T KNOW
[PREPARATORY STATEMENT] The following questions will ask you to choose between two scenarios. People who strongly support the first option are at 1. People who strongly support the second option are at 7. People who are in the middle are at 4. Ask yourself, from 1 to 7, where would you place yourself according to each question?
lxviii
2 Some people think that the government should be able to keep the oil and gas contracts with companies private and not allow citizens access to them so that sensitive information between companies and the government is kept private. Suppose these people are at 1 on the scale. Other people think that all oil and gas contracts should be published for citizens to access them so that citizens know how much money the government is receiving from oil and gas companies. Suppose these people are at 7 on the scale. Those who are exactly in the middle are at 4. Where would you place yourself?
1 All contracts should be kept private 2 3 4 Exactly in the middle 5 6 7 All contracts should be published 98 REFUSED 99 NO OPINION
3 Some countries, such as Norway, place strict limits on the amount of money that can be spent each year from oil and gas revenues so that the money can be used over a longer period of time. Suppose these countries are at 1 on the scale. Other countries, such as Ghana, have very loose limits on how much money is spent from oil and gas revenues so that more money can be spent immediately to help Ghana's economy. Suppose these countries are at 7 on the scale. Those who are exactly in the middle are at 4. What do you think is the right solution for Tanzania? Strict limits on spending like Norway or loose limits like Ghana or somewhere in between? Please choose a number between 1 and 7 if 1 is for very strict limits and 7 is for very loose limits.
1 Strict limits on spending 2 3 4 Exactly in the middle 5 6 7 Loose limits on spending 98 REFUSED 99 NO OPINION
4 Some people think the government should decide how to spend most of the money from natural gas over the years since the government is elected by the people. Suppose these people are at 1 on the
1 Government should decide how to spend the money 2 3 4 Exactly in the middle 5 6
lxix
scale. Other people think most of the money should be managed by an independent and international group of experts appointed by government, to help ensure the money is not wasted or stolen over the years. Suppose these people are at 7. Those who are exactly in the middle are at 4.
7 Money should be managed by an independent and international group of experts
98 REFUSED 99 NO OPINION
COMMERCIALIZATION & FOREIGN INVOLVEMENT
[PREPARATORY STATEMENT] I am going to read some statements about what to do with the natural gas. After I have read the statement, I would like you to rate on a 0 to 10 scale, where 0 is an extremely unimportant priority and 10 is an extremely important priority and 5 is exactly in the middle. Please reserve 10 only for the highest possible rating. It is for what you think has the highest possible importance.
5* Some people think that Tanzania should leave the natural gas in the ground, to save for the future and avoid trouble. Suppose these people are at 1 on the scale. Other people think the gas should be extracted to provide fuel and make money. Suppose these people are at 7 on the scale. Those who are exactly in the middle are at 4. Where would you place yourself?
1 Leave the gas in the ground 2 3 4 Exactly in the middle 5 6 7 Extract the gas for fuel and money 98 REFUSED 99 NO OPINION
6* 1 Use the gas for fuel in Tanzania 2
lxx
Some people think that Tanzania should use the gas for fuel for Tanzanians. Suppose these people are at 1 on the scale. Other people think Tanzania should sell the gas to earn money. Suppose these people are at 7 on the scale. Those who are exactly in the middle are at 4. Where would you place yourself?
3 4 Exactly in the middle 5 6 7 Sell the gas to make money 98 REFUSED 99 NO OPINION
7 Some people think that Tanzanians should pay the full price for energy so that the earnings from selling natural gas can be used for roads, schools, clinics, and electricity lines. Suppose these people are at 1 on the scale. Other people think the gas should be used mostly to produce electricity so that electricity would be very cheap for all Tanzanians. Suppose these people are at 7 on the scale. Those who are exactly in the middle are at 4. Where would you place yourself?
1 Using earning from selling gas for roads, schools, clinics, and electricity lines
2 3 4 Exactly in the middle 5 6 7 Tanzania's gas can be used to generate electricity 98 REFUSED 99 NO OPINION
8 Some people think that all of the gas should be sold at the highest possible price to get the most money for Tanzania. Suppose these people are 1 on the scale. Other people think that some of the gas should be discounted to help local industry grow, even if this means that Tanzania receives less money from the sale of gas. Suppose these people are at 7 on the scale. Those who are exactly in the middle are at 4. Where would you place yourself?
1 All the gas should be sold at the highest price 2 3 4 Exactly in the middle 5 6 7 Some gas should be discounted to help local industry 98 REFUSED 99 NO OPINION
SAVING VS SPENDING
[PREPARATORY STATEMENT] I am going to read some statements about what to do with the money from natural gas. After I have read the statement, I would like you to rate on a 0 to 10 scale, where 0 is an extremely unimportant priority and 10 is an extremely important priority and 5 is exactly in the middle. Please reserve 10 only for the highest possible rating. It is for what you think has the highest possible importance.
QUESTION SCALE
lxxi
9 Spend some money on building things for the people, such as roads and the electricity system
0 Extremely unimportant 1 2 3 4 5 Exactly in the middle 6 7 8 9 10 Extremely important 98 REFUSED 99 NO OPINION
10 Spend some of the money on public services, such as health care and education
0 Extremely unimportant 1 2 3 4 5 Exactly in the middle 6 7 8 9 10 Extremely important 98 REFUSED 99 NO OPINION
11 Give some money directly to households to spend for their own needs however they want
0 Extremely unimportant 1 2 3 4 5 Exactly in the middle 6 7 8 9 10 Extremely important 98 REFUSED 99 NO OPINION
12 Give some money directly to those households with children or the elderly
0 Extremely unimportant 1 2 3 4 5 Exactly in the middle 6 7 8 9 10 Extremely important 98 REFUSED 99 NO OPINION
13 Save some of the money for future generations
0 Extremely unimportant 1 2 3
lxxii
4 5 Exactly in the middle 6 7 8 9 10 Extremely important 98 REFUSED 99 NO OPINION
14* Use the gas to reduce the price of fuel. 0 Extremely unimportant 1 2 3 4 5 Exactly in the middle 6 7 8 9 10 Extremely important 98 REFUSED 99 NO OPINION
[PREPARATORY STATEMENT] Here are some reasons people might consider in deciding what to do with the money from natural gas. On a scale from 0 to 10 where 0 is an extremely unimportant reason and 10 is an extremely important reason and 5 is exactly in the middle, where would you put each of the following? 0 is the least important possible and 10 is the most important possible.
15 Using most of the money to build things such as roads and the electricity system will create jobs
0 Extremely unimportant 1 2 3 4 5 Exactly in the middle 6 7 8 9 10 Extremely important 98 REFUSED 99 NO OPINION
16 Using most of the money to build things such as roads and the electricity system will help the economy grow much faster
0 Extremely unimportant 1 2 3 4 5 Exactly in the middle
lxxiii
6 7 8 9 10 Extremely important 98 REFUSED 99 NO OPINION
17 Giving most of the money directly to households will fight poverty and hunger
0 Extremely unimportant 1 2 3 4 5 Exactly in the middle 6 7 8 9 10 Extremely important 98 REFUSED 99 NO OPINION
18 Giving most of the money directly to the people will help children in poor families have better nutrition and a greater chance of doing well in school
0 Extremely unimportant 1 2 3 4 5 Exactly in the middle 6 7 8 9 10 Extremely important 98 REFUSED 99 NO OPINION
19 Giving most of the money directly to households will make the government more accountable for the amount people expect each year
0 Extremely unimportant 1 2 3 4 5 Exactly in the middle 6 7 8 9 10 Extremely important 98 REFUSED 99 NO OPINION
20 Spending most of the money on services such as health care and education will help poor people
0 Extremely unimportant 1 2 3 4 5 Exactly in the middle 6 7 8 9
lxxiv
10 Extremely important 98 REFUSED 99 NO OPINION
21 Spending most of the money on services such as health care and education will help the economy grow much faster
0 Extremely unimportant 1 2 3 4 5 Exactly in the middle 6 7 8 9 10 Extremely important 98 REFUSED 99 NO OPINION
22 Entrusting most of the money to the national government will ensure it is spent where it is most needed
0 Extremely unimportant 1 2 3 4 5 Exactly in the middle 6 7 8 9 10 Extremely important 98 REFUSED 99 NO OPINION
[PREPARATORY STATEMENT] Now I'm going to ask you some questions on the previous 1-7 scale. The following questions will ask you to choose between two scenarios. People who strongly support the first option are at 1. People who strongly support the second option are at 7. People who support both options equally are at 4. Ask yourself, from 1 to 7, where would you place yourself according to each question?
24 Some people think the money should be saved mostly for the future even if that means there is not much of an increase in spending now. Suppose these people are at point 1 on the scale. Other people think that the money should be spent now even
1 Saving for the future 2 3 4 Exactly in the middle 5 6 7 Spending now
lxxv
if that means that in the future there will be nothing left. Suppose these people are at point 7 on the scale. Those who are exactly in the middle are at 4. Where would you place yourself?
98 REFUSED 99 NO OPINION
25 Some people think the money should be spent by the government on building things the people need, such as roads or the electricity system even if that means there will be no extra money for public services. Suppose these people are at point 1 on the scale. Other people think the money should be spent on improving public services such as health care and education even if that means there will be no extra money for building things such as roads or the electricity system. Suppose these people are at 7. Those who are exactly in the middle are at 4. Where would you place yourself?
1 Building things, such as roads and the electricity system 2 3 4 Exactly in the middle 5 6 7 Providing public services, such as health care and education 98 REFUSED 99 NO OPINION
26 Some people think that the money should be given directly to households even if that means there will be no increased money for the government to spend on what the public needs. Suppose these people are at 1 on a scale from 1 to 7. Other people think that the money should be spent by the government for what the public needs even if that means there will be no extra money to give directly to the people. Suppose these people are at 7 on the scale. Those who are exactly in the middle are at 4. Where would you place yourself?
1 Give directly to the people 2 3 4 Exactly in the middle 5 6 7 Give to government to spend for the people 98 REFUSED 99 NO OPINION
27 Some people think that the money that is saved from oil and gas should be saved and invested in an international account where it can make the most money for the country. Suppose these people are at point 1 on a scale from 1 to 7. Other
1 Save in an account that invests internationally 2 3 4 Exactly in the middle 5 6 7 Save in an account that invests in Tanzania
lxxvi
people think that the money that is saved should be invested in an account that only invests money in Tanzania. Suppose these people are at 7 on the scale. Those who are exactly in the middle are at 4. Where would you place yourself?
98 REFUSED 99 NO OPINION
28 What if some money is put into a savings or wealth account for every child at birth with each child having access to the resulting money at age 18?
1 Yes, strongly supportive child wealth account 2 Yes, supportive of child wealth account 3 Neutral 4 No, opposed to child wealth account 5 No, strongly opposed to child wealth account 6 DON'T KNOW
29 What if some money is put into a savings or wealth account for every adult starting at age 40 with each adult having access to the resulting money at age 60?
1 Yes, strongly supportive of adult wealth account 2 Yes, supportive of adult wealth account 3 Neutral 4 No, opposed to adult wealth account 5 No, strongly opposed to adult 6 DON'T KNOW
30 Some people say that when the government increases spending on roads and schools a lot of money is wasted during these projects. Do you:
31 Rather than waiting for the money from oil and gas to begin flowing, Tanzania should use the expected money from gas to borrow money from overseas and start spending sooner, even though the government will need to repay more than the original amount borrowed. [READ OUT OPTIONS]
1 Yes, strongly supportive of borrowing 2 Yes, supportive of borrowing 3 Neutral 4 No, opposed to borrowing 5 No, strongly opposed to borrowing 6 DON'T KNOW
GAS KNOWLEDGE
32 Where was the natural gas discovered? [READ OUT OPTIONS]
a Near Arusha b Under Lake Victoria c Offshore near Mtwara d Morogoro e OTHER, SPECIFY: _____ f DON'T KNOW
33 During whose presidency were recent offshore natural gas discoveries made?
a DURING NYERERE'S PRESIDENCY b DURING MWINYI'S PRESIDENCY c DURING MKAPA'S PRESIDENCY d DURING KIKWETE'S PRESIDENCY e OTHER f DON'T KNOW
34 Do you think that the government has started receiving revenues from the recent discoveries of natural gas?
a Yes, they have begun receiving a small portion of revenues b Yes, they have begun receiving a large portion of revenues c No, they have not begun receiving any revenues d DON'T KNOW
35 a The cost of building a new regional hospital. (More or less?)
lxxvii
Do you think the revenue the government will receive each year from natural gas will be more or less than… [READ OUT OPTIONS]
b The cost of building 10 new regional hospitals. (More or less?)
c The size of the entire national government budget. (More or less?)
d The size of the whole national economy. (More or less?) e DON'T KNOW
36 If it was divided evenly among all Tanzanians, how much natural gas revenue do you think there will be each year for each person? [READ OUT OPTIONS]
a Less than 1,000 shillings b 1,000 to 10,000 shillings c 10,000 to 100,000 shillings d 100,000 to 1m shillings e Over TSh 1m f DON'T KNOW
VISUAL AID 37
Did you use the question scale sheet that was provided to you at your home to answer any of the questions during this phone interview?
a Yes
b No
c DON'T KNOW
GENERAL GOVERNANCE QUESTIONS
GOVERNANCE
38 Do you think leaders at these levels represent your citizen interests effectively?
a YES
National government b NO
Local government c DON'T KNOW
39 Are leaders able to provide solutions to your problems?
a YES
National government b NO
Local government c DON'T KNOW
40 Do you think the government at this level spends its money responsibly?
National government a YES
Local government b NO
41 On a 0 to 10 scale, where 0 is distrust completely, 10 is trust completely, and 5 is exactly in the middle, how much do you trust the national government to do what is right?
0 Distrust completely
1
2
3
4
5 Exactly in the middle
6
7
8
9
10 Trust completely
98 REFUSED
99 NO OPINION
42 Please indicate how strongly you agree or disagree with the following statement:
1 Agree strongly
2 Agree somewhat
lxxviii
Most public policy issues are so complicated that a person like me can't really understand what's going on.
3 Neither well nor badly
4 Disagree somewhat
5 Disagree strongly
99 NO OPINION
43 Do you think the government would perform better if the new constitution would allow: [READ OUT OPTIONS]
a One government
b Two governments
c Three governments
44 How much do you trust each of the following, or haven’t you heard enough about them to say? [READ OUT OPTIONS]
The President a
Not at all Parliament b
Just a little Local Government Councilors c
Somewhat The Ruling Party d
A lot Opposition Political Parties e
DON'T KNOW/HAVEN'T HEARD [DO NOT READ] The Police
Courts of law
45 How many of the following people do you think are involved in corruption, or haven’t you heard enough about them to say? [READ OUT OPTIONS]
The President and Officials in his
Office a
None Members of Parliament b
Some of them Your Local Government Council c
Most of them The Ruling Party d
All of them Opposition Political Parties e
DON'T KNOW/HAVEN'T HEARD [DO NOT READ] Police
Courts of law
46 How well or badly does your municipal or local govt. handle the following matters? [READ OUT OPTIONS]
…maintaining local roads a Very well
…maintaining local market places b Well
…maintaining local schools c Neither well nor badly
…maintaining health clinics d Badly
…managing the use of land e Very badly
f DON'T KNOW
47 a Very easy
lxxix
Based on your experience, how easy or difficult is it to find out how government uses the revenue from people's taxes and fees?
b Easy c Difficult d Very difficult e DON'T KNOW
48 Are you satisfied with your MP's performance?
a YES b NO
TRUST IN INSTITUTIONS
49 With regard to the most recent village election, which statement is true for you? [READ OUT OPTIONS]
a You were not registered or you were too young to vote
b You voted in the elections
c You decided not to vote
d You could not find the polling station
e You were prevented from voting
f You did not have time to vote
g Did not vote for some other reason
h DON'T KNOW/CAN'T REMEMBER [DO NOT READ]
50 With regard to the most recent (2010) national election, which statement is true for you? [READ OUT OPTIONS]
a You were not registered or you were too young to vote
b You voted in the elections
c You decided not to vote
d You could not find the polling station
e You were prevented from voting
f You did not have time to vote
g Did not vote for some other reason
h DON'T KNOW/CAN'T REMEMBER [DO NOT READ]
51 In the past year, have you contacted any of the following persons about some important problem or to give them your views? [READ OUT OPTIONS]
A Local Government Councilor a Never
A Member of Parliament b Only once
An official of a government agency c A few times
A political party official d Often
Village chairman e DON'T KNOW
A minister
52 If a presidential election were held tomorrow, which party's candidate would you vote for?
1 CHAMA CHA MAPINDUZI (CCM) 2 THE CIVIC UNITED FRONT (CUF) 3 CHAMA CHA DEMOKRASIA NA MAENDELEO (CHADEMA) 4 THE UNION FOR MULTIPARTY DEMOCRACY OF TANZANIA
(UMD) 5 NATIONAL CONVENTION FOR CONSTRUCTION AND
REFORM (NCCR-MAGEUZI) 6 THE NATIONAL LEAGUE FOR DEMOCRACY (NLD) 7 UNITED PEOPLE'S DEMOCRATIC PARTY (UPDP) 8 THE NATIONAL RECONSTRUCTION ALLIANCE (NRA) 9 TANZANIA DEMOCRATIC ALLIANCE (TADEA) 10 TANZANIA LABOUR PARTY (TLP) 11 UNITED DEMOCRATIC PARTY (UDP)
lxxx
12 DEMOKRASIA MAKINI 13 CHAMA CHA HAKI NA USTAWI (CHAUSTA) 14 THE FORUM FOR RESTORATION OF DEMOCRACY (FORD) 15 DEMOCRATIC PARTY (DP) 16 THE PROGRESSIVE PARTY OF TANZANIA (PPT-MAENDELEO) 17 JAHAZI ASILIA 18 SAUTI YA UMMA (SAU) 96 OTHER: _____ 97 WOULD NOT VOTE 98 REFUSED TO ANSWER 99 DON'T KNOW
PUBLIC ENGAGEMENT
KNOWLEDGE QUIZ
53 Who is the current Prime Minister of Tanzania?
a. MIZENGO PINDA b. EDWARD LOWASSA (OLD PM) c. OTHER: _____ d DON'T KNOW
54 Who is the current Minister of Finance of Tanzania?
a. SAADA SALUM b. WILLIAM MGIMWA (OLD MINISTER) c. OTHER: _____ d DON'T KNOW
55 Who is your Member of Parliament currently?
a. CORRECT ANSWER [DEPENDING ON DISTRICT] b. INCORRECT ANSWER [DEPENDING ON DISTRICT] c. DON'T KNOW
56 When is the next national election in Tanzania? (MONTH AND YEAR)
a. MONTH: b. YEAR: d DON'T KNOW
57 What is the total population of Tanzania? [DO NOT READ OPTIONS]
a. LESS THAN ONE MILLION b. 1 MILLION TO 10 MILLION c. 10 MILLION TO 40 MILLION d. 40 MILLION TO 50 MILLION e. 50 MILLION TO 100 MILLION f. MORE THAN 100 MILLION g. DON'T KNOW
58 Do you agree or disagree with the following statement: the president has formed a commission to review the Constitution.
a Agree b. Disagree e DON'T KNOW
59 Which constitution will be used to guide the upcoming national elections?
a. Old constitution b. New consitution c. DON'T KNOW
60 Which industry in Tanzania has been criticized most in the past for providing overly favorable contract terms to foreign companies?
a. Fishing b. Sugar production c. Tourism d. Gold mining e. Fertilizer production f OTHER g DON'T KNOW
61 How many regions are there in Tanzania? [DO NOT READ OPTIONS]
a 0 TO 9 b 10 TO 14 c 15 TO 19 d 20 TO 24 e 25 TO 29
lxxxi
f 30 OR MORE g DON'T KNOW
62 Which lake forms the border between Tanzania and Malawi?
a Lake Natron b Lake Victoria c Lake Nyasa d Lake Manyara e DON'T KNOW
63 In what sector do most citizens in Tanzania work?
a Mining b Agriculture c Education d Tourism e OTHER f DON'T KNOW
SECTION: EDUCATION, INCOME, ASSETS
EDUCATION
64 Can you read and write? a YES b NO
65 What is the highest grade you have completed?
0 NONE 1 Pre-Primary 2 Adult 11 Standard I 12 Standard II 13 Standard III 14 Standard IV 15 Standard V 16 Standard VI 17 Standard VII 18 Standard VIII 19 Primary + Course 20 Form I 21 Form II 22 Form III 23 Form IV 24 Form IV + Course 25 Form V 26 Form VI 27 Form VI + Course 28 Ordinary diploma 41 University I 42 University II 43 University III 44 University IV 45 University V &+ 99 DON'T KNOW
66 Did you attend school last year? a YES b NO
67 Are you currently in school? a YES b NO
68 What is the current grade you are attending?
a NONE b N1 c N2 d P1 e P3 f P4
lxxxii
g P5 h P6 i P7 j O-LEVEL SS1 k O-LEVEL SS2 l O-LEVEL SS3 m O-LEVEL SS4 n A-LEVEL SS5 o A-LEVEL SS6 p TEACHER TRAINING q VOCATIONAL r TECHNICAL s POLY/PROF. t UNIVERSITY
69 Why are you not currently in school? a TOO OLD/COMPLETED SCHOOL b TOO FAR AWAY c TOO EXPENSIVE d IS WORKING (HOME OR JOB) e USELESS/UNINTERESTING f ILLNESS/PREGNANCY g FAILED EXAM h GOT MARRIED i OTHER: _____
EMPLOYMENT AND ASSETS
70 Did you do any work of any type for pay, profit, barter or home use during the last 7 days?
a YES b NO
71 The following question refers to the economic activity on which you spend most of your time if you have more than one activity: Are you working as: [READ OUT OPTIONS]
a Paid employee b Self-employed (non-agriculture) with employees c Self-employed (non-agriculture) without employees d Unpaid family helper (non-agricultural) e Unpaid family helper (agricultural) f On your own farm or shamba
72 Does your household own any of the following? [READ OUT OPTIONS]
Telephone a YES, Specify how many: _____
Livestock b NO
Plough
Radio and radio casette
Cooking pots
Hoes
73 What is the type of toilet used by the household? [READ OUT OPTIONS]
1 Flush / Pour Flush: to Piped Sewer System 2 Flush / Pour Flush: to Septic Tank 3 Flush / Pour Flush: to Pit Latrine 4 Flush / Pour Flush: to Elsewhere 5 Flush / Pour Flush: to Don't Know Where 6 Ventilated Improved Pit Latrine (VIP) 7 Pit Latrine with Slab
lxxxiii
8 Composting Latrine 9 Pit Latrine without Slab / Open Pit 10 Bucket Latrine 11 Hanging Toilet 12 No Facilities (Bush, Open Field, River) 96 OTHER, SPECIFY: _____
74 The roof of the main dwelling is predominantly made of what materials? [READ OUT OPTIONS]
a Grass, leaves, bamboo b Mud and grass c Concrete, cement d Metal sheets (GCI) e Asbestos sheets f Tiles e OTHER, SPECIFY: _____
75 What is the main fuel used for cooking? [READ OUT OPTIONS]
a Firewood b Charcoal c Kerosene/oil d Gas e Electricity f Crop residue/sawdust g Animal waste h OTHER, SPECIFY: _____
76 What is the main fuel used for lighting? [READ OUT OPTIONS]
a Kerosene/paraffin b Gas c Main electricity d Solar panels/generator e Battery f Candles g Firewood h OTHER, SPECIFY: _____
77 Over the past one week (7 days), how many days did you or others in your household consume any […]? [READ OUT OPTIONS] [PROMPT: Please only count foods consumed in your home and not foods consumed elsewhere]
Meat, Fish, and Animal Products
(Egg; Dried/Fresh/Smoked Fish (Excluding Fish Sauce/Powder); Beef; Goat Meat; Pork; Poultry; Other Meat)
a NUMBER OF DAYS, PLEASE SPECIFY: _____
Milk/Milk Products (Fresh/Powdered/Soured Milk; Yogurt; Cheese; Other Milk Product - Excluding Margarine/Butter or Small Amounts of Milk for Tea/Coffee)
Appendix VI: Policymaker survey instrument The questions below have been reformatted to abbreviate the answer choices for brevity. On the actual survey, answer choices were provided in multiple choice form.
1. Some people think that Tanzanians should pay the full price for energy so that the earnings from selling natural gas can be used for roads, schools, clinics, and electricity lines. Suppose these people are at 1 on the scale. Other people think the gas should be used mostly to produce electricity so that electricity would be very cheap for all Tanzanians. Suppose these people are at 7 on the scale. Those who are exactly in the middle are at 4. Where would you place yourself?
(Question scale similar to 1-7 scale in questions in Appendix V.)
2. Some people think the money should be saved mostly for the future even if that means there is not much of an increase in spending now. Suppose these people are at point 1 on the scale. Other people think that the money should be spent now even if that means that in the future there will be nothing left. Suppose these people are at point 7 on the scale. Those who are exactly in the middle are at 4. Where would you place yourself?
In the past 7 days, did you worry that your household would not have enough food?
a YES b NO
lxxxv
(Question scale similar to 1-7 scale in questions in Appendix V.)
3. Rather than waiting for the money from oil and gas to begin flowing, Tanzania should use the expected money from gas to borrow money from overseas and start spending sooner, even though the government will need to repay more than the original amount borrowed.
(Question scale similar to 1-5 scale in questions in Appendix V.)
4. Some people think that the money should be given directly to households even if that means there will be no increased money for the government to spend on what the public needs. Suppose these people are at 1 on a scale from 1 to 7. Other people think that the money should be spent by the government for what the public needs even if that means there will be no extra money to give directly to the people. Suppose these people are at 7 on the scale. Those who are exactly in the middle are at 4. Where would you place yourself?
(Question scale similar to 1-7 scale in questions in Appendix V.)
5. What if some money is put into a savings account for every child at birth with each child having access to
the resulting money at age 18?
(Question scale similar to 1-5 scale in questions in Appendix V.)
6. Some people think the money should be spent by the government on building things the people need, such as roads or the electricity system even if that means there will be no extra money for public services. Suppose these people are at point 1 on the scale. Other people think the money should be spent on improving public services such as health care and education even if that means there will be no extra money for building things such as roads or the electricity system. Suppose these people are at 7. Those who are exactly in the middle are at 4. Where would you place yourself?
(Question scale similar to 1-7 scale in questions in Appendix V.)
7. Some people think that the government should be able to keep the oil and gas contracts with companies private and not allow citizens access to them so that sensitive information between companies and the government is kept private. Suppose these people are at 1 on the scale. Other people think that all oil and gas contracts should be published for citizens to access them so that citizens know how much money the government is receiving from oil and gas companies. Suppose these people are at 7 on the scale. Those who are exactly in the middle are at 4. Where would you place yourself?
(Question scale similar to 1-7 scale in questions in Appendix V.)
8. Some people think the government should decide how to spend most of the money from natural gas over the years since the government is elected by the people. Suppose these people are at 1 on the scale. Other people think most of the money should be managed by an independent and international group of experts appointed by government, to help ensure the money is not wasted or stolen over the years. Suppose these people are at 7. Those who are exactly in the middle are at 4. Where would you place yourself?
(Question scale similar to 1-7 scale in questions in Appendix V.)
lxxxvi
9. Some people say that when the government increases spending on roads and schools a lot of money is wasted during these projects. Do you:
(Answer scale similar to 1-5 scale in questions in Appendix V.)
10. Do you think the government at the national level spends its money responsibly?
(Answer choices of yes and no.)
11. Do you think the government at the local level spends its money responsibly?
(Answer choices of yes and no.)
12. Are you a Tanzanian citizen?
(Answer choices of yes and no.)
13. In what sector do you work?
(Answers including answers of government ministry/agency, parliament, NGO, academia, private industry, student, self-employed, unemployed, or other.)
14. What is the highest grade you have completed?
(Answer scale including all primary, secondary, and post-secondary levels.)
lxxxvii
Appendix VII: Pre-analysis plan
Resource Rents and Deliberative Democracy in Tanzania
Pre-analysis Plan15
Nancy Birdsall, James Fishkin, Mujobu Moyo, Justin Sandefur16
April 12, 2015
Abstract
In 2010, Tanzania discovered natural gas reserves off its southern coast worth roughly fifteen times its annual GDP at prevailing prices. The large literature on the resource curse suggests this new gas discovery brings considerable risks to a low-income country with already weak governance institutions. How should Tanzania manage this new revenue to avoid the traditional resource curse? We will report on multiple rounds of a nationally representative opinion poll soliciting ordinary Tanzanians' views on how to manage and spend gas revenues. Between polling rounds, a random subset of poll respondents will receive detailed information about the natural gas discovery, and the pros and cons of various gas policy options. A randomly drawn subset of individuals receiving the information treatment will be invited to a national deliberative event, where they will debate gas policy options and participate in question and answer sessions with experts. We will report treatment effects of information and deliberation on support for alternative uses of gas revenue, including saving versus spending, and direct distribution of resource rents. We will also test a number of hypotheses about the process of deliberation itself, related to peer effects, leader effects, and polarization.
1 Summary of experimental design & interventions
A nationally representative baseline poll conducted between February and April, 2015 asked a target of 2,001 adult Tanzanians in 200 rural and urban clusters about their knowledge and policy preferences regarding Tanzania's recent natural gas discovery and the use of any future revenues. All respondents received a mobile phone to facilitate follow-up polling by phone.
In each of 100 randomly selected survey clusters, 7 of 10 respondents were invited to view a documentary video presenting pros and cons of various gas policy options (the information treatment). Of the respondents who were invited to the information treatment, 4 individuals were invited to a democratic deliberation about the use of the natural gas.
The basic design is presented in the figure below. (The graph uses “villages” and PSUs interchangeably, though some PSUs are in fact urban.)
15 Note that this draft of the analysis plan was completed and registered after baseline data collection was completed, but before the main intervention described here (i.e., the deliberative event) and before any follow-up data has been collected. Further details of this experiment are available at the American Economic Association RCT registry at http://www.socialscienceregistry.org/trials/689. 16 Bobby Fishkin, Faraz Haqqi, Jen Richmond, and Alice Siu have contributed enormously to the design of this project.
The 400 invitees to the deliberative event will be divided into 25 randomly assigned small groups to discuss a sequence of gas policy options, followed by plenary Q and A sessions with a panel of policymakers and experts in the natural gas sector. The discussions will be broken into four rounds over two days, and groups will be randomly reassigned after the first day.
Follow-up polling will measure the medium-term impact (i.e., weeks rather than hours after treatment) of information and deliberation on respondents' knowledge and policy preferences. Follow-up polling will be conducted by phone and broken into multiple rounds, due to limitations on respondents' attention span on the phone. See the entry for this study in the AEA RCT registry for further details.
2 Hypotheses about natural gas policy preferences and knowledge
Data analysis of survey results will test a total of six substantive hypotheses about the effect of information and deliberation treatments on natural gas policy preferences and knowledge.
In each case we test the null hypothesis that each treatment will have no impact on the following outcomes.
H1: Support for extracting and exporting natural gas. H2: Support for saving rather than spending gas revenue. H3: Support for government spending versus direct distribution of rents. H4: Preference for government spending on social services versus infrastructure, transport, and industry. H5: Support for transparency and oversight of gas revenues, H6: Knowledge of the natural gas discovery
lxxxix
Each outcome will be measured by the mean of the standardized responses to several survey questions. Full details are found in the hypothesis table below.
We will also test heterogeneous effects for each of these hypotheses along four dimensions: education and knowledge; wealth; trust in government; and gender. The components of the first three measures of heterogeneity are also described in the table at the end. For education and knowledge, the mean effects index will combine just two components – the total number of correct answers on the knowledge and literacy test, and years of schooling. For wealth, we use a predicted consumption measure, based on the coefficients on a regression of household consumption on survey items in National Panel Survey that overlap with our questionnaire (these items were included in the questionnaire for this purpose). For trust in government, we propose to use a simple mean effects index of the items listed in the table below.
3 Hypotheses about the process of deliberation
In this section we specify three hypotheses related to the process of deliberation itself. The analysis will exploit the random assignment of participants to 25 deliberative groups with a target size of 16 people each (we anticipate some drop-off between the baseline and deliberation).
Note that groups will be reassigned between day 1 and day 2 of deliberations, creating a total of 50 exogenous groupings. The topic of deliberation will differ between days 1 and 2, and deliberation topics correspond to different sets of outcome variables. We anticipate the strongest effect of group assignment to be on questions related to the topics covered by that group that day, but will also test whether day 1 groups affect responses on questions related to day 2 topics and vice versa.
H7. Peer effects: Individual responses will be (unequally) influenced by the views of other participants in the deliberation..
We expect social interactions to be a key component of deliberation. Peers, by which we mean members of the same small group in deliberation, will influence each other. But a large literature on, e.g., jury deliberations implies that certain disadvantaged groups may be drowned out. Also related to the role of peer effects, Sunstein (1999) predicts that deliberation will “move groups, and the individuals who compose them, toward a more extreme point in the direction indicated by their own pre deliberation judgments." To test these broad theories, we hypothesize:
• 7a. Group-level polarization: Participants’ views will change in the direction of their peers' average views at baseline. Thus deliberation will increase the strength of majorities within deliberative groups.
• 7b. Individual-level polarization: Deliberation will move participants’ views away from neutrality, toward the extremes relative to their pre-deliberation responses.
• 7c. Members of disadvantaged groups (women, the uneducated, the poor) will participate less in deliberation, as measured by frequency of comments. [We will test this hypothesis only if data on participation is successfully collected for at least 80% of groups – there is some uncertainty about the available technology to capture this information in our venue.]
• 7d. Members of disadvantaged groups will exert less influence on the post-deliberation opinions of their fellow group members, i.e., the coefficient on average baseline views of female peers will be smaller than that of male peers.
H8. Leader effects: Leaders' views will determine the outcome of deliberation.
We will test for "leader effects" (Humphreys, Masters, and Sandbu, 2006) by regressing respondent preferences post-deliberation on baseline preferences of the moderator in each respondent's randomly assigned deliberation group together with our standard controls.
NB: Because moderators only moderate a single session on a given topic, we cannot measure leader effects through a leader fixed effects regression a la Humphreys et al.
We will also test three mechanisms underlying leader effects described in Humphreys et al., which we specify as sub-hypotheses:
• 8a. Suasion: Participants' poll response will move in the direction of leaders' views. • 8b. Self-censorship: Opinions expressed during deliberation will conform to leaders' views. • 8c. False relay: Leaders will exaggerate the extent to which deliberation conformed to their own views.
To test these mechanisms, we will measure leader effects on three outcome indicators: (i) participants' post-deliberation poll responses, (ii) leaders' assessment of the outcome of deliberation, and (iii) a separate assessment of the outcome of deliberation by an independent observer. Hypothesis 1a can be measured by impacts on (i). Hypothesis 1b implies that leaders' effect on (iii) will be greater than their effect on (ii). Hypothesis 1c implies leader effects on (iii) will be smaller than their effects on (ii).
4 Data Collection
Data will be collected at two main stages: the baseline and follow-up polls, with the later broken into two rounds of (mostly) non-overlapping questions.
a. Baseline survey. This survey will be conducted face-to-face in randomly-sampled respondents’ houses throughout the country. We will ask a series of socioeconomic questions based on questions asked in Tanzanian versions of the Afrobarometer and CWIQ surveys. These questions will be divided into modules that address the following: demographic details, education level, employment status, ownership of assets and amenities, governance, public engagement, and trust in institutions. In addition to these questions, we have created a new module of natural resource questions regarding Tanzania’s impending natural gas revenues.
b. Follow-up mobile phone surveys. We will leave out the socioeconomic questions during follow-up surveys since the outcomes we want to measure concern the natural resource questions. Therefore, we will instead ask only the questions in the natural resources module.
In addition, auxiliary data collection will include: (i) subjective assessment of the outcome of deliberation by moderators (“leaders”) and note takers; and (ii) tabulations of the frequency of participation in deliberation by each participant.
5 Econometric specification and data analysis
Intent-to-treat analysis: All treatment effects will be calculated on the basis of intention to treat, i.e., examining the impact of random assignment, regardless of compliance with that assignment. If compliance fall below 80% for any treatment, we will also report average treatment effects on the treated, using random assignment as an instrumental variable.
Specification: We will estimate the impact of treatments on follow-up poll responses in an analysis of covariance (ANCOVA) specification, regressing post-treatment responses on pre-treatment responses and the treatment dummy (McKenzie 2012). We will report results both with and without additional demographic and geographic controls (gender, age, district dummies).
Multiple comparisons: The main hypothesis table lists six main hypotheses. Each of these consists of several survey questions. We will measure treatment effects on a mean effects index (Kling et al 2007) for each of these main hypotheses. We will also report results for each of the constituent variables in the indices, with p-values corrected for multiple comparison.
Attrition: We will report Lee (2009) bounds on any statistically significant treatment effects on our main hypotheses.
Null hypotheses: Treatment will not affect… Indicators
Variable name(s)
H1 Support for extracting and exporting natural gas
Support for extracting gas No baseline Support for using gas for domestic energy consumption
No baseline
Support for using gas to subsidize domestic energy versus exporting to earn government revenue
No baseline
Support for exporting gas and paying the full price for gas and using earnings from selling gas to spend on public goods
s2q5
Support for exporting the gas at the highest possible price
s2q6
H2 Support for saving rather than spending gas revenue.
Support for strict limits on spending s2q3
Aversion to spending money on building things for the people, such as roads and the electricity system
s2q7
Aversion to spending money on public services, such as health care and education
s2q8
Save money for future generations s2q11 Support for saving the majority of money for the future as opposed to spending more money now
s2q20
Support for saving as opposed to using expected money from gas to borrow money and spend on domestic needs sooner
s2q27
Belief that when government increases spending on schools & roads a lot of money is wasted.
Null hypotheses: Treatment will not affect… Indicators
Variable name(s)
Support for government spending versus direct distribution of rents.
Give money to households with children or the elderly
s2q10
Giving money to households will fight poverty and hunger
s2q14
Giving money directly to people will help children in poor families have better nutrition and a greater chance of doing well in school
s2q15
Giving money directly to households will make the government more accountable for the amount people expect each year.
s2q16
Giving money directly to people as opposed to giving it to government to spend through the national budget
s2q22
Support for a child wealth account s2q24 Support for an adult wealth account s2q25
H4 Support for government spending on social services versus infrastructure, transport, and industry
Using the money to build public goods will create jobs
s2q12
Using the money to build public goods will help the economy grow faster
s2q13
Spending money on social services will help poor people
s2q17
Spending money on social services will help the economy grow faster
s2q18
Building public goods as opposed to providing social services
s2q21
H5 Support for transparency and oversight of gas revenues, or additional restrictions on their use.
Support for publishing oil and gas contracts s2q2
Support for money being managed by an independent and international group of experts
s2q4
Belief that government will spend money on that which is most needed
s2q19
H6 Knowledge of the natural gas discovery.
Knowledge of Tanzania's natural gas discoveries s2q1
Where the natural gas was discovered s2q28
Knowledge of under whose presidency recent offshore natural gas discoveries were made
s2q29
Knowledge of whether the government has started receiving revenues from natural gas
s2q30
Knowledge of expected revenue amount compared to the cost of a new hospital
s2q31a
xciii
Null hypotheses: Treatment will not affect… Indicators
Variable name(s)
Knowledge of expected revenue amount compared to the cost of 10 new regional hospitals
s2q31b
Knowledge of expected revenue amount compared to the entire national government budget
s2q31c
Knowledge of expected revenue amount compared to the size of the whole national economy
s2q31d
Knowledge of expected annual revenue divided equally among Tanzanian citizens
s2q32
Covariate index
Indicators Variable name(s)
X1 Education and general knowledge
Knowledge of current Prime Minister s3q16 Knowledge of current Minister of Finance s3q17
Knowledge of current member of parliament s3q18 Knowledge of next national election year s3q19y Knowledge of next national election month s3q19m
Knowledge of the total population of Tanzania s3q20 Knowledge the president's commission to review the Constitution
s3q21
Knowledge of which constitution will guide the upcoming national elections
s3q22
Knowledge of Tanzanian industry that has been criticized in the past for providing favorable contracts to companies
s3q23
Knowledge of number of regions in Tanzania s3q24
Knowledge of which lake forms the border between Tanzania and Malawi
s3q25
Knowledge of the sector in which most Tanzanian citizens work
s3q26
Ability to read and write s4q1 Highest grade completed s4q2
X2 Wealth, exposure to markets
Employment in past seven days s5q1
Economic activity on which you spend most of your time
s5q2
Household ownership of telephone s5q3a1 Household ownership of stove s5q3a2 Household ownership of livestock s5q3a3 Household ownership of plough s5q3a4
xciv
Null hypotheses: Treatment will not affect… Indicators
Variable name(s)
Household ownership of radio and radio cassettes
s5q3a5
Household ownership of hoes s5q3a6 Number of telephones S5q3b1 Number of pots s5q3b2 Number of livestock s5q3b3 Number of ploughs s5q3b4 Number of radios and radio cassettes s5q3b5 Number of household hoes s5q3b6 Type of toilet used by the household s5q4 Household roofing material s5q5
Main fuel used for cooking s5q6 Main fuel used for lighting s5q7
Consumption of meat, fish, and animal products
s5q8a
Consumption of milk/milk products s5q8b Consumption of sugar/sugar products/honey s5q8c
Consumption of fruits s5q8d Food insecurity s5q9
X3 Trust in government, satisfaction with public services, authoritarian leaning
Belief that leaders at national level represents citizens' interests
s3q1
Belief that government at the local level represents citizens' interests
s3q1b
Belief that leaders at the national level are able to provide solutions to citizens' problems
s3q2
Belief that leaders at the local level are able to provide solutions to citizens' problems
s3q2b
Belief that government at the national level spend money responsibly
s3q3
Belief that leaders at the local level spend money responsibly
s3q3b
Trust in national government s3q4 Trust in the President s3q7a Trust in parliament s3q7b Trust in your local government council s3q7c Trust in the ruling party s3q7d Trust in opposition political parties s3q7e Trust in the police s3q7f Trust in courts of law s3q7g Perception of corruption among the President and Officials in his Office
s3q8a
xcv
Null hypotheses: Treatment will not affect… Indicators
Variable name(s)
Perception of corruption among members of parliament
s3q8b
Perception of corruption among your local government council
s3q8c
Perception of corruption among the ruling party
s3q8d
Perception of corruption among opposition political parties
s3q8e
Perception of corruption among the police s3q8f
Perception of corruption in the courts of law s3q8g
Perception of municipal/local government's ability to maintain local roads
s3q9a
Perception of municipal/local government's ability to maintain local market places
s3q9b
Perception of municipal/local government's ability to maintain local schools
s3q9c
Perception of municipal/local government's ability to maintain health clinics
s3q9d
Perception of municipal/local government's ability to manage the use of the land
s3q9e
Perception of ease to find out how government uses revenues from people's taxes and fees
s3q10
Satisfaction with MP's performance s3q11 Vote share for the ruling party s3q15