47
HOW THE ECONOMIC CRISIS IN GREECE HAS AFFECTED THE PATIENT FLOW BETWEEN PUBLIC HOSPITALS AND PRIVATE CLINICS
| Date post: | 10-Jun-2018 |
| Category: |
Documents |
| Upload: | nguyendang |
| View: | 214 times |
| Download: | 0 times |
HOW THE ECONOMIC CRISIS IN GREECE HAS AFFECTED THE PATIENT FLOW BETWEEN PUBLIC HOSPITALS AND PRIVATE CLINICS

2 HOW THE ECONOMIC CRISIS IN GREECE HAS AFFECTED THE PATIENT FLOW BETWEEN PUBLIC HOSPITALS AND PRIVATE CLINICS
Contents
ACKNOWLEDGEMENTS...................................................................................................................3
ABSTRACT........................................................................................................................................4
1. INTRODUCTION......................................................................................................................4
2. INEQUITY IN HEALTHCARE.....................................................................................................5
3. AN OVERVIEW OF THE GREEK HEALTHCARE SYSTEM............................................................6
I. THE ROLE OF PRIVATE HEALTH INSURANCE......................................................................7
II. TAXATION..........................................................................................................................7
III. SOCIAL INSURANCE-Sickness Funds...................................................................................7
IV. OUT-OF-POCKET-PAYMENTS.............................................................................................7
V. PAYMENT OF HEALTHCARE PROVIDERS.............................................................................8
VI. PAYMENT OF HEALTH PROFFESIONALS.............................................................................9
VII. PROVISION OF SERVICES....................................................................................................9
VIII. THE ROLE OF PRIVATE SECTOR....................................................................................10
IX. PUBLIC AND PRIVATE MIX................................................................................................10
X. INFORMAL PAYMENTS.....................................................................................................10
XI. QUALITY OF CARE............................................................................................................11
4. CHALLENGES IN THE PRIVATE-PUBLIC HEALTHCARE FLOW IN 2007-2011...........................11
I. INFORMAL PAYMENTS.....................................................................................................11
II. WAITING TIMES...............................................................................................................13
III. SUPPLY SIDE OF HOSPITALS AND CLINICS........................................................................14
5. DATA ANALYSIS....................................................................................................................15
I. SICKNESS FUNDS..............................................................................................................15
II. HOSPITALS & CLINICS.......................................................................................................16
III. SURGERIES.......................................................................................................................18
6. EMPIRICAL ANALYSIS...........................................................................................................22
7. CONCLUSIONS......................................................................................................................25
8. REFERENCES.........................................................................................................................26
9. ANNEX..................................................................................................................................29
Erasmus University of Rotterdam Naoum Anastasia May 2013

3 HOW THE ECONOMIC CRISIS IN GREECE HAS AFFECTED THE PATIENT FLOW BETWEEN PUBLIC HOSPITALS AND PRIVATE CLINICS
ACKNOWLEDGEMENTS
This Thesis represents not only my work at a personal level, but also a group commitment. My experience in Erasmus University of Rotterdam worked as catalysis for my life, not only from an academic scope but also in a personal level.
First and foremost I wish to thank my supervisor, Professor Tom Van Ourti, also professor of the “Research Topics in Health Economics” course. He has been supportive since the days I began working on my Thesis and during the most difficult times when writing this thesis, he gave me the moral support and the freedom I needed to move on.
I would also like to give many thanks to my colleague Theodoros Chatzivasileiadis, who has assist me in many ways during the entire Master and also gave me valuable feedback for my Thesis.
Furthermore, I would like to thank the directors of the clinics and hospitals of Thessaloniki , Dimosthenis Katsarkas (Agios Loukas), Ioakim Sigalas (Diavalkaniko), Stella Tsipanidou (Euromedica), Konstantinos Karamosxos (Papageorgiou), Charalampos Lazaridis (Papanikolaou), Spyros Papavramidis (Axepa) for their contribution to share their data, without which this Thesis would never have been started.
Last but not least, I would like to thank my parents, who have been emotionally and financially supportive from the beginning of my Master.
Erasmus University of Rotterdam Naoum Anastasia May 2013
4 HOW THE ECONOMIC CRISIS IN GREECE HAS AFFECTED THE PATIENT FLOW BETWEEN PUBLIC HOSPITALS AND PRIVATE CLINICS
ABSTRACT
Objectives: The economic crisis has devastated the Greek healthcare system, with austerity measures which were introduced by the government resulting in significant budget cuts for hospitals. The Greek hospitals always had trouble with waiting times and lower quality compared to the private clinics, however, the public health system provided free or low-cost care service to residents and their dependents, contributing to the social security. The main goal of this Thesis is to evaluate the impact of economic crisis on the patient flow between public hospitals and private clinics.
Data: In order for that goal to be achieved, a dataset which contains the total number of the three surgeries, LAPAROSCOPIC CHOLECYSTECTOMY, SIGMOEIDECTOMY AND TOTAL GASTRECTOMY for the period 2007-2011 for each of the three hospitals and the three clinics accordingly was obtained. Furthermore, it contains the characteristics of each patient who underwent each surgery, which include; age, gender, marital status, sickness fund, cost of surgery, number of hospital days. This kind of dataset has never been obtained before in Greece and this is the most interesting and unique part in this analysis.
Methods: First a desk research was conducted to present qualitatively how the Greek health system works and how it has been affected by the economic crisis. Next, using the statistical program Stata, graphs depicting the dataset and the impact of economic crisis on the patient shift between the public and private sector are presented and analyzed. Furthermore, there is an empirical analysis of the dataset, using three logistic regressions for each of the three specific surgeries, where the effect of the economic crisis on the patient flow between the public hospitals and private clinics, as well as which patient characteristics are important is interpreted.
Results: The findings suggest that indeed there is an impact of the economic crisis in the healthcare, with the costs of the surgeries decreasing dramatically in the years of 2010 and 2011 compared to the previous years and most importantly, a patient shift from the private clinics to the public hospitals after 2009. However, this Thesis represents only an indication of the potential shift of patients in the public/private healthcare mix. A more concrete data containing also information about the type of the room and the physicians’ fee is needed as well as a qualitative research on patient choice could provide more insight on the matter of the patient choice.
1. INTRODUCTION
According to the OECD classification (OECD 1992), it could be argued that the Greek health care system is a mixture of the public integrated, public contract and public reimbursement systems, incorporating principles of different organizational patterns. The existence of different subsystems and organizational models, combined with a lack of coordination mechanisms, results in fragmentation and overlaps in care, while it creates significant difficulties in the management, the planning and the implementation of a national health policy. The Greek health care system is composed of elements from both the public and private sectors. In relation to the public sector, elements of the Bismarck and the
Erasmus University of Rotterdam Naoum Anastasia May 2013

5 HOW THE ECONOMIC CRISIS IN GREECE HAS AFFECTED THE PATIENT FLOW BETWEEN PUBLIC HOSPITALS AND PRIVATE CLINICS
Beveridge models coexist1. Greece has been affected more by the financial turmoil beginning in year 2007 than any other European country, since the 15 years of consecutive growth in the Greek economy have been reversed. The unemployment rate has risen from 6.6% to 16.6% in three years’ time (2008-2011)2, as the debt grew between 2007 and 2010 from 105.4% to 142.8% of gross domestic product (GDP; €239.4 billion to €328.6 billion) compared with the average change in the EU-15 from 66.2% to 85.1% of GDP during the same period (€6.0 trillion to €7.8 trillion)3. In order to finance its debts, Greece had to borrow €110 billion from the International Monetary Fund and Euro zone partners, under strict conditions that included drastic abbreviation of government spending. Whereas other countries in Europe, for instance France or Germany ,now show signs of economic recovery, the crisis continues to evolve in Greece; industrial production fell by 8% in 20104.
2. INEQUITY IN HEALTHCARE
The theoretical and empirical evidence suggests that health care systems that are financed via taxation and social insurance are more progressive and equitable than those financed via private insurance and out-of-pocket payments5 . In Greece, coverage for health services by social insurance organizations and the ESY (National Health System) is ostensibly full and universal. Moreover, it is assumed that access is free and equal, and that patients pay no official fees at the point of use, with the exception of small user charges for services provided by hospital outpatient departments and for the cost of medication. In reality, however, these aspects of public health care are significantly distorted. The high level of official and unofficial private spending on health is a factor which negates the principle of equity and the principle of zero prices at the point of use. In effect, private spending and the hidden economy constitute a kind of informal co-insurance and co-payments which are among the highest in OECD countries6 . This behavior is encouraged by low pay in the public sector. As a result, it has been estimated that, on average, patients pay additional fees of approximately €5300 for heart operations for which the reimbursement is €88007. As a consequence, it can be argued that the financing of the health system today is more inequitable than it was in the early 1980s8. The extent of the problem is reflected in the results of a study conducted in 2002. This study, applying WHO approach to fairness in financial contributions to the health system, concluded that the funding system in 1998 was regressive given that low-income households paid a higher proportion of their income towards health care than the rich. The second finding of the study was that 2.44% of households in Greece face the danger of having to make catastrophic payments for health care; that is, incurring unexpected expenses exceeding 40% of their disposable income9.
There are strong indications that inequalities exist. They derive from differences in relation to social health insurance coverage, high out-of-pocket payments and uneven regional distribution of human resources and health infrastructure. As a consequence,
1 Economou (2010)2 Hellenic Statistical Authority (2011)3 Eurostat (2011)4 Hellenic Statistical Authority (2011)5 Mossialos & Dixon (2002)6 Kyriopoulos, Economou & Dolgeras (2001)7 Siskou et al. (2008)8 Liaropoulos & Tragakes (1998)9 Economou et al. (2004)
Erasmus University of Rotterdam Naoum Anastasia May 2013
6 HOW THE ECONOMIC CRISIS IN GREECE HAS AFFECTED THE PATIENT FLOW BETWEEN PUBLIC HOSPITALS AND PRIVATE CLINICS
certain regions are incapable of meeting the health needs of their populations, resulting in a flow of patients to the major urban centers of Athens and Thessaloniki10. According to the results of a study concerning equity in the use of physician visits in OECD countries, there is significant horizontal inequity in total physician visits in Greece, with the standardized doctor use of the poorest quintile being about 20% lower than that of the richest quintile. However, when data is disaggregated, it is found that the use of GP visits is related to need and only specialist service utilization is inequitable in favor of the rich. In addition, the income-related inequities in specialist use are associated with regional differences in access to such care11. The Greek health care system suffers from inefficiencies which can be summarized as follows:
• A high degree of centralization in decision-making and administrative processes;• Ineffective managerial structures which lack information management systems and, in
many cases, are staffed by inappropriate and unqualified personnel, without adequate managerial skills;
• Lack of planning and coordination, and limited managerial and administrative capacity;• Unequal and inefficient allocation of human and economic resources, based on
historical and political criteria and regional disparities, due to the absence of pooling of health resources, a lack of coordination among the large number of payers, an absence of adequate financial management and accounting systems, and a lack of monitoring processes;
• Fragmentation of coverage and an absence of a referral system based on GPs or group practice to support primary health care development and to act as a gatekeeper, meaning that there is no continuity of care and no control of interregional patient flows;
• Inequalities in access to services derived from differences in social health insurance coverage, high out-of-pocket payments and uneven regional distribution of human resources and health infrastructure;
• Underdevelopment of needs assessment and priority-setting mechanisms;• Regressive funding mechanisms due to the existence of high private spending, under-
the-table payments, widespread tax evasion, a high proportion of indirect taxation and social security contribution evasion;
• An anachronistic retrospective reimbursement system according to which providers’ payments are not related to their performance, resulting in the absence of incentives to improve efficiency and quality
• An absence of a health technology assessment system, quality assurance and economic evaluation processes, leading to an excess of heavy medical equipment.
These shortcomings resulted in low levels of satisfaction with the healthcare system expressed by citizens and the “epidemic” of short-lived health care reform proposals12 .
3. AN OVERVIEW OF THE GREEK HEALTHCARE SYSTEM
The health care system in Greece is financed by a mix of public and private resources. Public statutory financing is based on social insurance and tax. The primary source of
10 Kyriopoulos, Gregory & Economou (2003)11 Van Doorslaer, Koolman & Puffer (2002)12 Stambolovic (2003)
Erasmus University of Rotterdam Naoum Anastasia May 2013

7 HOW THE ECONOMIC CRISIS IN GREECE HAS AFFECTED THE PATIENT FLOW BETWEEN PUBLIC HOSPITALS AND PRIVATE CLINICS
revenue for the social insurance funds is the contributions of employees and employers (including state contributions as an employer). The state budget, via direct and indirect tax revenues, is responsible for covering administration expenditures, funding health centers and rural surgeries, providing subsidies to public hospitals and insurance funds, investing in capital stock and funding medical education. The third important source of health care financing is private expenses, taking the form mainly of out-of-pocket payments for services not covered by social insurance, payments for services covered by social insurance but bought outside the system for reasons related to time, cost and quality, co-payments and various payments made unethically for reasons such as bypassing waiting lists or ensuring more attention on the part of the doctor13. A significant characteristic of the mixed financial resources of the Greek health care system is the very high percentage of private expenses. Overall, fairness in health care financing is not achieved, with health expenditure disproportionately burdening the lower socioeconomic classes14.
I. THE ROLE OF PRIVATE HEALTH INSURANCE
In 2008, the private health insurance in Greece does not play an important role in the overall health system, since it offers coverage to no more than 12% of the population. It mostly takes the form of supplementary insurance, profit-making schemes providing cover for faster access, better quality of services and increased consumer choice15.
II. TAXATION
Tax revenues in Greece are derived from direct taxes, mainly on income, and indirect taxes on goods and services. An interesting feature of the Greek tax system is that indirect taxes represent approximately 60% of total tax revenue. Thus, the dependence on indirect taxes, which are regressive, undermines horizontal and vertical equity16.
III. SOCIAL INSURANCE-Sickness Funds
In 2007, the revenues from social health insurance accounted for 31.2% of total health expenditure. The main source of finance for the social insurance funds is mandatory contributions by employers and employees, the level of which vary among different insurance organizations. For instance, the contribution rate for medical care in IKA is 7.65% of gross salary (2.55% for employees and 5.10% for employers). Sickness benefits under OGA are financed through the contributions of the insured, which pay up to 1.5% of the rates that correspond to seven insurance classes they can choose from and 1.5% contributed by the state. In the case of OPAD, civil servants’ contributions are 2.55% of their gross income, with the state budget subsidizing the expenses that exceed total contribution revenues.17
IV. OUT-OF-POCKET-PAYMENTS
Out-of-pocket payments represent a high percentage of health expenditure in Greece, accounting for more than half of total health expenditure. The most common cost-sharing arrangements are structured as follows:
13 Economou(2010)14 Ballas A, Tsoukas H (2004)15 Economou, (2008)16 Bronchi (2001)17 Economou (2010)
Erasmus University of Rotterdam Naoum Anastasia May 2013

8 HOW THE ECONOMIC CRISIS IN GREECE HAS AFFECTED THE PATIENT FLOW BETWEEN PUBLIC HOSPITALS AND PRIVATE CLINICS
Co-payments in public hospitals (outpatient departments). A charge of €3 is imposed in the outpatient clinics of ESY hospitals for a physician visit. This amount, paid directly by the user, is reimbursed by some of the social security funds (only in case of emergencies). In all other cases, this fixed amount constitutes a user’s charge. It should be noted that OGA members (agricultural workers mostly) and the economically non-active population are excluded from the above payment.
Direct payments in public hospitals. Although there are no user charges for hospital treatment in the public sector, there are some out-of-pocket payments in public hospitals, which include: hospital charges for medical care (e.g. an extra charge for hospitalization days in rooms with luxurious hotel facilities which are not reimbursed by the health insurance fund), payments for some pharmaceuticals, direct payments and co-payments for other health care services (e.g. laboratory or diagnostic tests).18
V. PAYMENT OF HEALTHCARE PROVIDERS
Since January 2002, the government has allowed private practice for doctors employed by the ESY within ESY hospital outpatient clinics. Doctors are paid on a fee-for-service basis with flat rates ranging from €25 to €90, depending on physicians’ grades. These payments are distributed between the hospital (40%) and the physicians (60%).19
Table 1: Payment of healthcare unitsHealth Provider Payment Method PayerESY hospitals Fixed budgets and subsidies
– Per diem fees– Fixed payment per case-mix group(e.g. cardiovascular surgeries)– Fee for service for diagnostic tests and afternoon outpatientclinics (fees are determined by a fixed price index)
– State budget– Social insurance funds– Private insurance– Household budgets
Rural health centres Annual budgets State budgetSocial Insurance fundhospitals
Annual budgets Social Insurance funds
Profit-making privatehospitals
Per diem fees– Fixed payment per case-mix group(e.g. cardiovascular surgeries)– Fee for service for diagnostic tests, surgical proceduresand outpatient services
– Social insurance funds– Private insurance– Household budgets– Donations by philanthropicand other sources
18 Economou(2010)19 Economou(2010)
Erasmus University of Rotterdam Naoum Anastasia May 2013

9 HOW THE ECONOMIC CRISIS IN GREECE HAS AFFECTED THE PATIENT FLOW BETWEEN PUBLIC HOSPITALS AND PRIVATE CLINICS
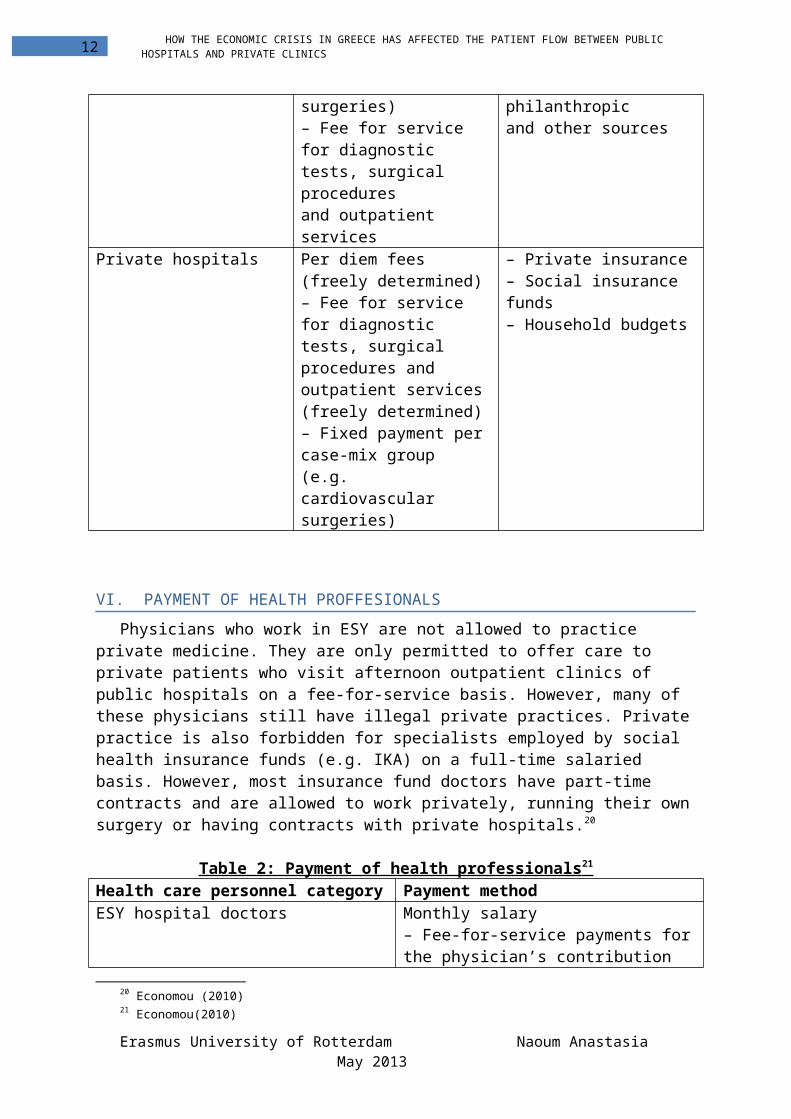
Private hospitals Per diem fees (freely determined)– Fee for service for diagnostic tests, surgicalprocedures and outpatient services (freely determined)– Fixed payment per case-mix group(e.g. cardiovascular surgeries)
– Private insurance– Social insurance funds– Household budgets
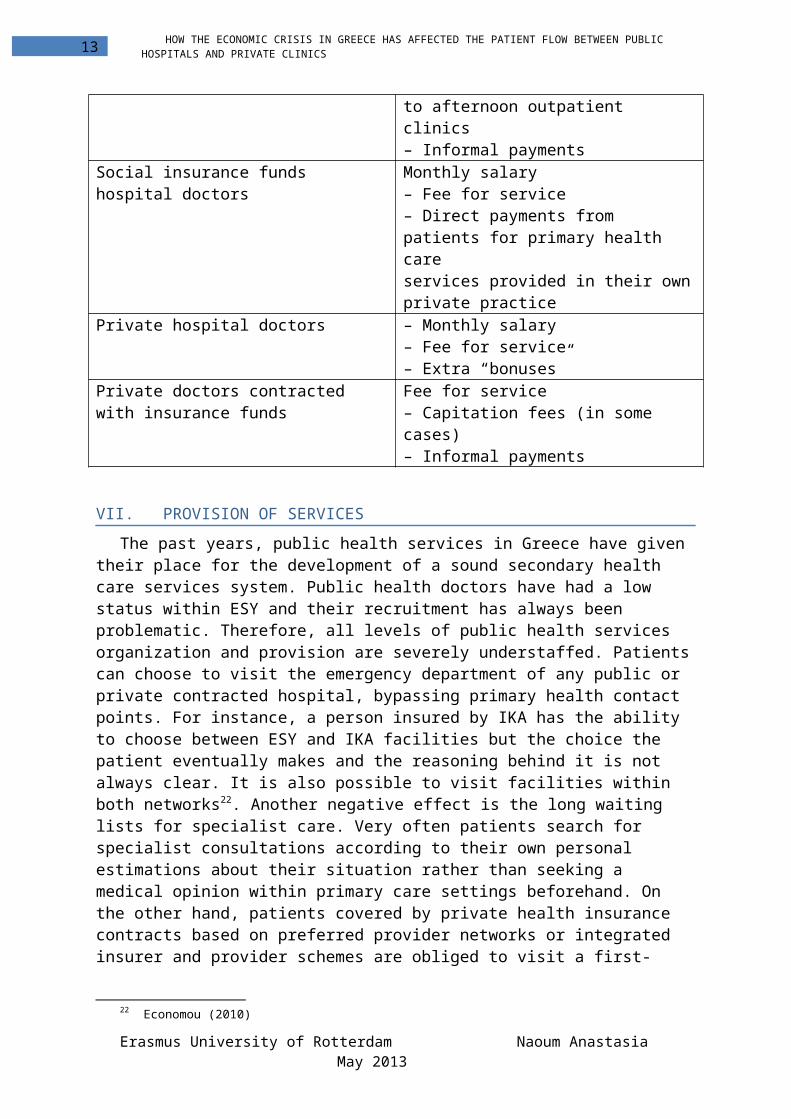
VI. PAYMENT OF HEALTH PROFFESIONALS
Physicians who work in ESY are not allowed to practice private medicine. They are only permitted to offer care to private patients who visit afternoon outpatient clinics of public hospitals on a fee-for-service basis. However, many of these physicians still have illegal private practices. Private practice is also forbidden for specialists employed by social health insurance funds (e.g. IKA) on a full-time salaried basis. However, most insurance fund doctors have part-time contracts and are allowed to work privately, running their own surgery or having contracts with private hospitals.20
Table 2: Payment of health professionals 21 Health care personnel category Payment methodESY hospital doctors Monthly salary
– Fee-for-service payments for the physician’s contributionto afternoon outpatient clinics– Informal payments
Social insurance funds hospital doctors Monthly salary– Fee for service– Direct payments from patients for primary health careservices provided in their own private practice
Private hospital doctors – Monthly salary– Fee for service– Extra “bonuses”
Private doctors contracted with insurance funds
Fee for service– Capitation fees (in some cases)– Informal payments
VII. PROVISION OF SERVICES
20 Economou (2010)21 Economou(2010)
Erasmus University of Rotterdam Naoum Anastasia May 2013

10 HOW THE ECONOMIC CRISIS IN GREECE HAS AFFECTED THE PATIENT FLOW BETWEEN PUBLIC HOSPITALS AND PRIVATE CLINICS
The past years, public health services in Greece have given their place for the development of a sound secondary health care services system. Public health doctors have had a low status within ESY and their recruitment has always been problematic. Therefore, all levels of public health services organization and provision are severely understaffed. Patients can choose to visit the emergency department of any public or private contracted hospital, bypassing primary health contact points. For instance, a person insured by IKA has the ability to choose between ESY and IKA facilities but the choice the patient eventually makes and the reasoning behind it is not always clear. It is also possible to visit facilities within both networks22. Another negative effect is the long waiting lists for specialist care. Very often patients search for specialist consultations according to their own personal estimations about their situation rather than seeking a medical opinion within primary care settings beforehand. On the other hand, patients covered by private health insurance contracts based on preferred provider networks or integrated insurer and provider schemes are obliged to visit a first-contact service that will subsequently refer them to specialist or hospital care.23
VIII. THE ROLE OF PRIVATE SECTOR
The private sector plays an important role in the provision of health services, although it does not have any direct involvement in the planning, financing and regulation of the public system. It is mainly financed through social insurance funds, which enter into contracts with the private sector to provide services that meet the health care needs of their beneficiaries. In the period 1983–1992 the establishment of new private hospitals was prohibited and efforts were made to absorb at least a portion of private hospitals into the public sector. While most of the small clinics were closed down, some of them, as well as private hospitals with luxury facilities, survived by signing contracts with private insurance companies and, more recently, also with the social insurance funds. These are mainly general and maternity hospitals. In 1992, the restriction on the establishment of private hospitals was removed. Since 1985, there has been a significant growth in the establishment of private diagnostic centers by doctors and other health care professionals. In addition, a significant portion of specialist care is offered by physicians in private practice, who are either contracted by various social insurance funds or paid directly by the patient on a private basis. Rehabilitation services (physiotherapists etc.) and services for the elderly (geriatric homes) are predominantly offered by the private sector24.
IX. PUBLIC AND PRIVATE MIX
Despite the rapid growth of the private sector during the last decade, public hospitals are used more than private hospitals by the population because of:
(a) Easier access in districts outside of Athens and ThessalonikiKI,(b) The provision of free services for insured people (c) Their better scientific reputation in many medical specialties. However, over the past ten years, lengthy waiting lists in the ESY or low-quality services
have led patients to seek care in the private sector.25
22 Economou (2010)23 Athanassopoulos A, Gounaris C, Sissouras A (1999)24 Economou (2010)25 Economou (2010)
Erasmus University of Rotterdam Naoum Anastasia May 2013

11 HOW THE ECONOMIC CRISIS IN GREECE HAS AFFECTED THE PATIENT FLOW BETWEEN PUBLIC HOSPITALS AND PRIVATE CLINICS
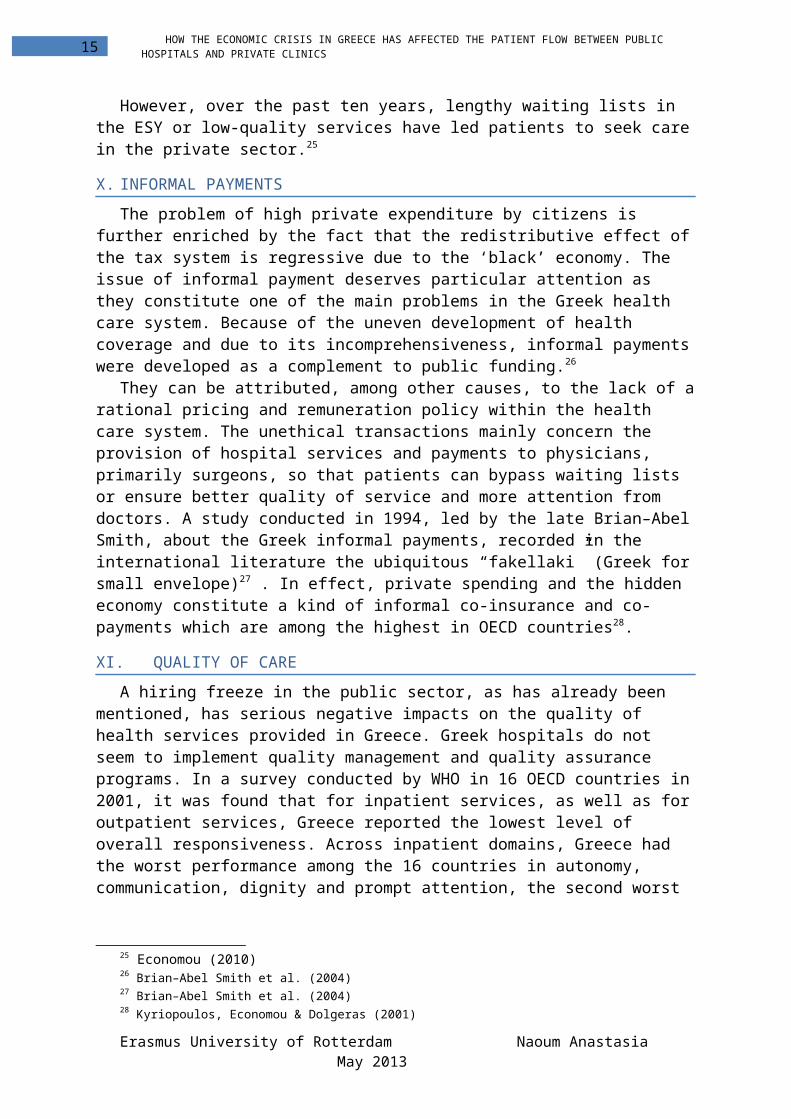
X. INFORMAL PAYMENTS
The problem of high private expenditure by citizens is further enriched by the fact that the redistributive effect of the tax system is regressive due to the ‘black’ economy. The issue of informal payment deserves particular attention as they constitute one of the main problems in the Greek health care system. Because of the uneven development of health coverage and due to its incomprehensiveness, informal payments were developed as a complement to public funding.26
They can be attributed, among other causes, to the lack of a rational pricing and remuneration policy within the health care system. The unethical transactions mainly concern the provision of hospital services and payments to physicians, primarily surgeons, so that patients can bypass waiting lists or ensure better quality of service and more attention from doctors. A study conducted in 1994, led by the late Brian–Abel Smith, about the Greek informal payments, recorded in the international literature the ubiquitous “fakellaki” (Greek for small envelope)27 . In effect, private spending and the hidden economy constitute a kind of informal co-insurance and co-payments which are among the highest in OECD countries28.
XI. QUALITY OF CARE
A hiring freeze in the public sector, as has already been mentioned, has serious negative impacts on the quality of health services provided in Greece. Greek hospitals do not seem to implement quality management and quality assurance programs. In a survey conducted by WHO in 16 OECD countries in 2001, it was found that for inpatient services, as well as for outpatient services, Greece reported the lowest level of overall responsiveness. Across inpatient domains, Greece had the worst performance among the 16 countries in autonomy, communication, dignity and prompt attention, the second worst performance in choice and social support and the fourth worst performance in confidentiality29.
4. CHALLENGES IN THE PRIVATE-PUBLIC HEALTHCARE FLOW IN 2007-2011
The economic crisis creates major problems in the financial situation of the healthcare systems, threatens the survival of the insurance companies and surcharges the function and credibility of the public healthcare sector due to the over-demand for healthcare. This results not only to the effectiveness being decreased but also to lower quality of healthcare services which has a direct impact on the patients, who may postpone their admission to the hospitals due to the extras costs that occur and to the lower quality of the services30.
I. INFORMAL PAYMENTS
According to a study31 conducted in Greece, where representative samples of 12,346 and 15,045 respondents were recruited in 2007 and 2009, respectively, by use of consistent methods, findings showed that there was a significant increase in people reporting that they did not go to a doctor or dentist despite feeling that it was necessary (odds ratio 1·15, 95%
26 Brian–Abel Smith et al. (2004)27 Brian–Abel Smith et al. (2004)28 Kyriopoulos, Economou & Dolgeras (2001)29 Mossialos,Allin,Davaki,(2005)30 Stuckler et al. (2009)31 Kentikelenis A. et al (2011)
Erasmus University of Rotterdam Naoum Anastasia May 2013
12 HOW THE ECONOMIC CRISIS IN GREECE HAS AFFECTED THE PATIENT FLOW BETWEEN PUBLIC HOSPITALS AND PRIVATE CLINICS
CI 1·02–1·30 for doctors’ visits, after correcting for differences in survey respondents including age, sex, marital status, educational attainment, and urban or rural residence. The main reasons for not seeking medical care did not seem significantly linked to an inability to afford care (0·87, 0·74–1·02), but to long waiting times (1·83, 1·26–2·64), travel distance to care (2·50, 1·35–4·63), waiting to feel better (1·93, 1·26–2·96), and other reasons not captured by the survey. There were also reported supply-side problems: there were about 40% cuts in hospital budgets, understaffing, reported occasional shortages of medical supplies, and bribes given to medical staff to jump queues in overstretched hospitals32.Although people were less likely to visit GPs and outpatient facilities, there was a rise in admissions to public hospitals of 24% in 2010 compared with 200933 and of 8% in the first half of 2011 compared with the same period of 201034.Major private health providers, although comprising a smaller proportion of care delivery than public providers, were also hit by pressure on personal budgets and registered losses after the onset of the crisis. A 2010 study reported a 25–30% decline in admissions to private hospitals35.The number of people able to obtain sickness benefits declined (0·61, 0·38–0·98) between 2007 and 2009, probably due to budget cuts and further reductions to access, since austerity measures were fully implemented.36
A more recent survey, based on a sample of 4738 individual observations, concluded that 36% of patients treated in public hospitals had made at least one informal payment37. For 19%, these payments were additional fees asked by salaried doctors, while for 17% they were “voluntary gratuities”. The probability of making such payments was 72% greater for people wishing to avoid a waiting list as compared to those following standard admission procedures and 13.7% higher for patients requiring surgery. According to the National Statistical Service data, concerning the 2007 recalculation of the national GDP figures, private current health expenditure was revised upwards from D 7128 million to D 10,981 in 200438. The inclusion of part of the previously unrecorded expenditure, often referred to the “black” economy, raised the share of private payments in health in 2004 from 46.1% to 55.4% after the revision. Informal payments in public hospitals amount to about 10% of the total “black” or “underground” economy” in the Greek health care system39, although these payments constitute the most unacceptable form, from the ethical point of view. According to a study about Greek informal payments, concerning patients in the Greater Athens Area where per capita incomes are higher, findings showed that the 48% of inpatients were involved in informal payments40. The most frequently firm reasons for informal payments are related to the quality of care, “because of the fear that I will receive sub-standard care, if I don’t pay”—42%, and a request by the doctor, “he asked me to operate on me—20%. Only 18% of those reporting an informal payment expressed it as “gratitude”41.
32 Telloglou T (2011)33 Liakopoulou T (2011)34 Polyzos N (2011)35 Hellastat (2010)36 Avgenakis E (2011)37 Liaropoulos et al. (2008)38 Ensor T (2004)39 Liaropoulos et al (2008)40 Siskou O (2006)41 Tountas Y, Karnaki P, Pavi E, Souliotis K (2005)
Erasmus University of Rotterdam Naoum Anastasia May 2013
13 HOW THE ECONOMIC CRISIS IN GREECE HAS AFFECTED THE PATIENT FLOW BETWEEN PUBLIC HOSPITALS AND PRIVATE CLINICS
Table 3-Percentage of corruption in Greece in the years 2007-2011 in the healthcare sector 42
Years
Hospitals (% by the total corruption)
Hospitals (% by the corruption cases)
Surgery(% by the corruption cases)
Informal payment to the physician(% by the corruption cases)
301€-1000€ (amount of informal payments, to people who were asked to pay)
301€-1000€ (amount of informal payments, to people who answered specific amount)
Public hospital sector2007 2.9 34.2 56.3 2.3 28.4 422008 3.3 34.5 61.5 3 32.5 50.42009 3.1 33.5 65.8 4.2 29.5 44.42010 2.5 35.4 61.9 6.5 36.1 49.62011 3.1 41.5 60.6 3 36.9 45.8
Private hospital sector2007 19.9 42 2.5 13.62008 22.8 46.8 0 13.82009 19.2 61.3 1.1 292010 22.5 47.1 4.7 22.42011 21.1 54.3 2.2 26.8
The table above confirms the theoretical analysis so far by providing mathematical and empirical proof not only on the existence of informal payments and corruption in the Greek healthcare sector but also a concrete idea about the magnitude of the effect.
This table presents the percentage of corruption in the Greek healthcare sector in the years examined, 2007-2011. The difference in the percentages of informal payments between the public and private sector can be easily observed, as well as the impact of the economic crisis. More concretely, in 2008-the beginning of the economic crisis, an increase in the corruption can be noted. Regarding the public healthcare sector, the percentage of corruption in surgeries is increased from 56.3% to 61.5% in 2008 and to 65.8% in 2009, whereas in 2010 and 2011 a decline can be noted. In the private healthcare sector, the same pattern applies with the corruption increasing in 2008 and 2009 and declining in 2010; however in 2011 the percentage of corruption in surgeries is increased by 7%. What is most interesting though, is that the higher percentages of corruption and informal payments can be observed in the public healthcare sector and more prominent, in the amount of informal payments, whereas there are huge disparities between the public hospitals and the private clinics.
II. WAITING TIMES
42 Transparency International Greece (2012)
Erasmus University of Rotterdam Naoum Anastasia May 2013

14 HOW THE ECONOMIC CRISIS IN GREECE HAS AFFECTED THE PATIENT FLOW BETWEEN PUBLIC HOSPITALS AND PRIVATE CLINICS
The waiting times in Greek hospitals are often very long, which means costs for the patient. The patient’s cost of the queue is the postponement in recovery. A related possibility is that after experiencing a particular health defect for some time, a patient finds it less unpleasant than they initially find it. If medical treatment (e.g. an operation) has some risk of actually making the condition worse, this may imply that after a period of waiting the patient prefers to exit from the queue and accept the health defect. An alternative explanation is that waiting time induces some people to never join the queue for treatment, due to the existence of costs incurred at the time one joins the queue43. Patients who enter into such a queue for medical treatment sometimes have the option of using a private alternative to the public health care, thus avoiding the queue. The longer the waiting time, the more people choose the private alternative. Evidence show that increases in long-term NHS waiting lists are linked to increases in private health insurance purchases. The evidence also suggests that there is a positive relation between the private insurance demand and a high-income patient44. The most frequent method of “jumping the queue” was putting the patient on an “emergency” list. It is, therefore, not surprising that 48.5% of admissions were labelled as emergencies45.
III. SUPPLY SIDE OF HOSPITALS AND CLINICS
Currently, many public hospitals face deficits as a result of: The absence of real incentives for hospitals to stay within their budgets Delays in reimbursement by social insurance funds Low statutory fees for hospital services, in comparison to actual per diem costs Services offered free of charge to immigrants and the indigent population46. Moreover, all the healthcare system faces difficulties due to three main reasons: Lower profit due to the lower prices of the pharmaceutical products Dept of ESY (National Health System) A newly created National Organization for Providing Health Services (EOPYY) which will
merge all the sickness funds together.47
However, the situation is even worse for the private clinics. Before 2011, all the private clinics had a contract with a specific pharmacy, where they purchased all their necessary medication and made profit of that arrangement. After 2011, though, that regulation changed and the private clinics are responsible to purchase the pharmaceuticals on their own and own their own pharmacy. That new regulation, combined with the lower prices of the pharmaceutical products due to the economic crisis has decreased the income of the private clinics. Furthermore, due to the economic crisis, the admissions in the private healthcare sector have declined by 30-40%, which adds up to the lower income for the private clinics. It is expected that many small and medium size private clinics will be forced to shut down due to insufficient financial resources.48 The National Health System ESY faces currently a lot of difficulties due to the economic crisis, such as the healthcare inequities, the lack of primary health services, the over-demand due to the ageing society, the high inflation rates, the lack of nurses, the decreasing
43 Lindsay and Feigenbaum (1984)44 Liaropoulos L, Tragakes, E (1998)45 Sox CM, Bursin HR, Edwards RA, O’Neil AC, Brennan TA (1998)46 Economou (2010)47 Bouloutza (2011)48 Liakopoulou (2011)
Erasmus University of Rotterdam Naoum Anastasia May 2013
15 HOW THE ECONOMIC CRISIS IN GREECE HAS AFFECTED THE PATIENT FLOW BETWEEN PUBLIC HOSPITALS AND PRIVATE CLINICS
quality of services which all contribute to the huge depts of the public hospitals and the sickness funds. The budget cut of around one billion Euros of the hospital budgets will only make matters worse, since the decrease of the income will result into an increase of hospital submissions, since the public healthcare services are covered by the insurance funds49. According to a study in 2010, the visits in public hospitals have increased by 30% whereas the visits in the private healthcare facilities have decreased enormously.50
5. DATA ANALYSIS
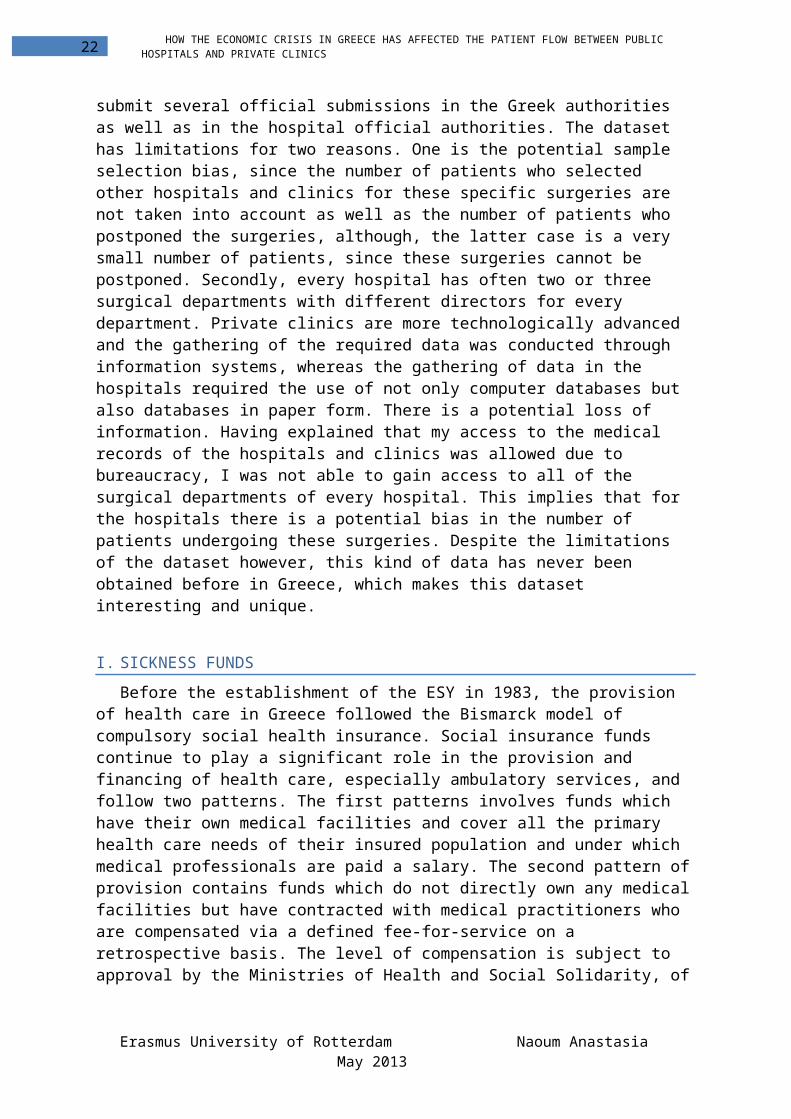
The data was the most difficult task to be undertaken. The data contains the total number of the three surgeries, LAPAROSCOPIC CHOLECYSTECTOMY, SIGMOEIDECTOMY AND TOTAL GASTRECTOMY for the period 2007-2011 for each of the three hospitals and the three clinics accordingly. Furthermore, it contains the characteristics of each patient who underwent each surgery, which include; age, gender, marital status, sickness fund, cost of surgery, number of hospital days.
In most public hospitals in Greece there are no automatic computerized databases, therefore I personally had to write manually all the characteristics for every patient who underwent these three surgeries for every year. Moreover, in order to be allowed to obtain that kind of data I had to submit several official submissions in the Greek authorities as well as in the hospital official authorities. The dataset has limitations for two reasons. One is the potential sample selection bias, since the number of patients who selected other hospitals and clinics for these specific surgeries are not taken into account as well as the number of patients who postponed the surgeries, although, the latter case is a very small number of patients, since these surgeries cannot be postponed. Secondly, every hospital has often two or three surgical departments with different directors for every department. Private clinics are more technologically advanced and the gathering of the required data was conducted through information systems, whereas the gathering of data in the hospitals required the use of not only computer databases but also databases in paper form. There is a potential loss of information. Having explained that my access to the medical records of the hospitals and clinics was allowed due to bureaucracy, I was not able to gain access to all of the surgical departments of every hospital. This implies that for the hospitals there is a potential bias in the number of patients undergoing these surgeries. Despite the limitations of the dataset however, this kind of data has never been obtained before in Greece, which makes this dataset interesting and unique.
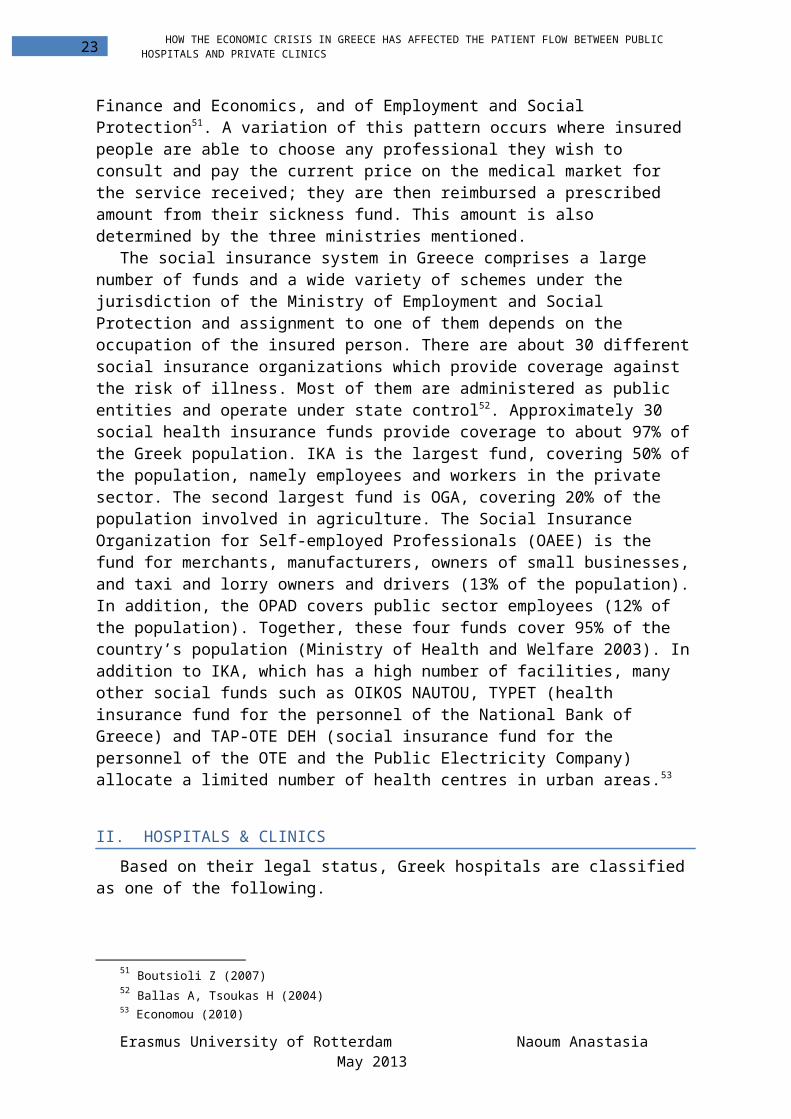
I. SICKNESS FUNDS
Before the establishment of the ESY in 1983, the provision of health care in Greece followed the Bismarck model of compulsory social health insurance. Social insurance funds continue to play a significant role in the provision and financing of health care, especially ambulatory services, and follow two patterns. The first patterns involves funds which have their own medical facilities and cover all the primary health care needs of their insured population and under which medical professionals are paid a salary. The second pattern of provision contains funds which do not directly own any medical facilities but have contracted with medical practitioners who are compensated via a defined fee-for-service on
49 Karaiskou A (2012)50 Kyriopoulos (2010)
Erasmus University of Rotterdam Naoum Anastasia May 2013

16 HOW THE ECONOMIC CRISIS IN GREECE HAS AFFECTED THE PATIENT FLOW BETWEEN PUBLIC HOSPITALS AND PRIVATE CLINICS
a retrospective basis. The level of compensation is subject to approval by the Ministries of Health and Social Solidarity, of Finance and Economics, and of Employment and Social Protection51. A variation of this pattern occurs where insured people are able to choose any professional they wish to consult and pay the current price on the medical market for the service received; they are then reimbursed a prescribed amount from their sickness fund. This amount is also determined by the three ministries mentioned.
The social insurance system in Greece comprises a large number of funds and a wide variety of schemes under the jurisdiction of the Ministry of Employment and Social Protection and assignment to one of them depends on the occupation of the insured person. There are about 30 different social insurance organizations which provide coverage against the risk of illness. Most of them are administered as public entities and operate under state control52. Approximately 30 social health insurance funds provide coverage to about 97% of the Greek population. IKA is the largest fund, covering 50% of the population, namely employees and workers in the private sector. The second largest fund is OGA, covering 20% of the population involved in agriculture. The Social Insurance Organization for Self-employed Professionals (OAEE) is the fund for merchants, manufacturers, owners of small businesses, and taxi and lorry owners and drivers (13% of the population). In addition, the OPAD covers public sector employees (12% of the population). Together, these four funds cover 95% of the country’s population (Ministry of Health and Welfare 2003). In addition to IKA, which has a high number of facilities, many other social funds such as OIKOS NAUTOU, TYPET (health insurance fund for the personnel of the National Bank of Greece) and TAP-OTE DEH (social insurance fund for the personnel of the OTE and the Public Electricity Company) allocate a limited number of health centres in urban areas.53
II. HOSPITALS & CLINICS
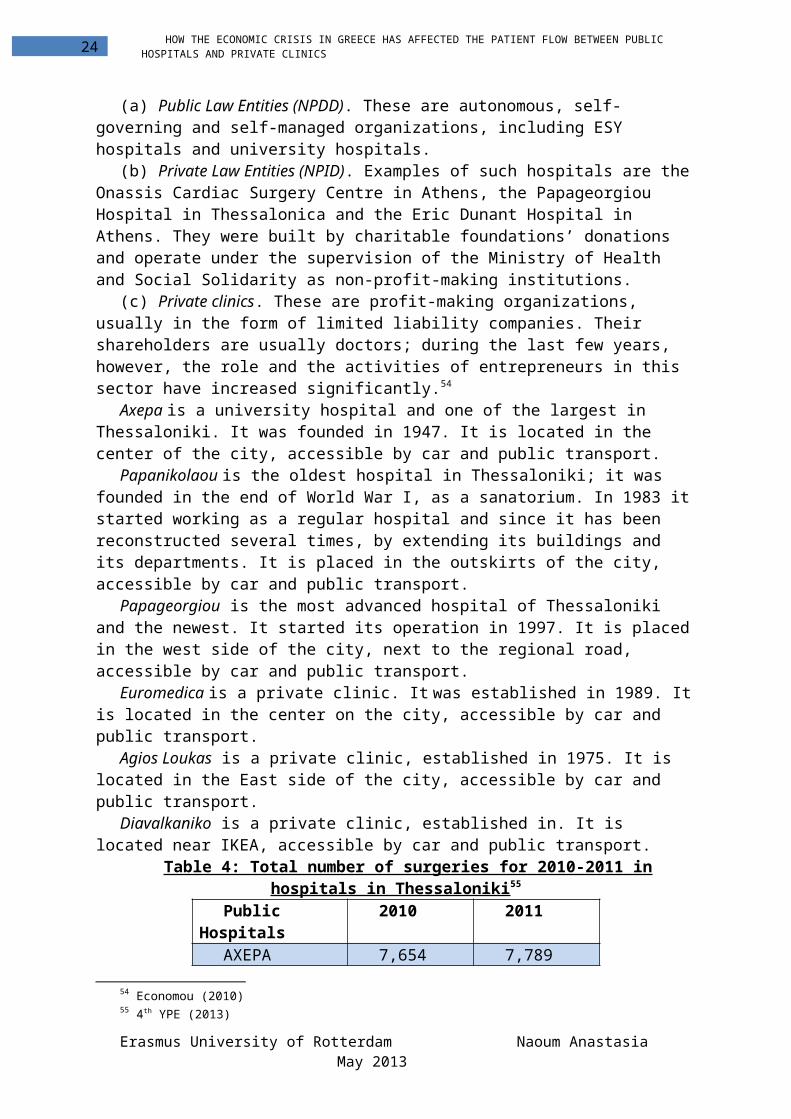
Based on their legal status, Greek hospitals are classified as one of the following.(a) Public Law Entities (NPDD). These are autonomous, self-governing and self-managed
organizations, including ESY hospitals and university hospitals.(b) Private Law Entities (NPID). Examples of such hospitals are the Onassis Cardiac
Surgery Centre in Athens, the Papageorgiou Hospital in Thessalonica and the Eric Dunant Hospital in Athens. They were built by charitable foundations’ donations and operate under the supervision of the Ministry of Health and Social Solidarity as non-profit-making institutions.
(c) Private clinics. These are profit-making organizations, usually in the form of limited liability companies. Their shareholders are usually doctors; during the last few years, however, the role and the activities of entrepreneurs in this sector have increased significantly.54
Axepa is a university hospital and one of the largest in Thessaloniki. It was founded in 1947. It is located in the center of the city, accessible by car and public transport.
Papanikolaou is the oldest hospital in Thessaloniki; it was founded in the end of World War I, as a sanatorium. In 1983 it started working as a regular hospital and since it has been
51 Boutsioli Z (2007)52 Ballas A, Tsoukas H (2004)53 Economou (2010)54 Economou (2010)
Erasmus University of Rotterdam Naoum Anastasia May 2013

17 HOW THE ECONOMIC CRISIS IN GREECE HAS AFFECTED THE PATIENT FLOW BETWEEN PUBLIC HOSPITALS AND PRIVATE CLINICS
reconstructed several times, by extending its buildings and its departments. It is placed in the outskirts of the city, accessible by car and public transport.
Papageorgiou is the most advanced hospital of Thessaloniki and the newest. It started its operation in 1997. It is placed in the west side of the city, next to the regional road, accessible by car and public transport.
Euromedica is a private clinic. It was established in 1989. It is located in the center on the city, accessible by car and public transport.
Agios Loukas is a private clinic, established in 1975. It is located in the East side of the city, accessible by car and public transport.
Diavalkaniko is a private clinic, established in. It is located near IKEA, accessible by car and public transport.
Table 4: Total number of surgeries for 2010-2011 in hospitals in Thessaloniki55
Public Hospitals 2010 2011
AXEPA 7,654 7,789IPPOKRATEIO 11,940 12,025AGIOS PAULOS 1,559 1,569PANAGIA 3,902 3,912PAPAGEORGIOU 16,155 16,653PAPANIKOLAOU 9,971 10,837AGIOS DIMITRIOS 5,133 6,037
GENNIMATAS 3,721 4,071Total 60,035 62,893
As it can be easily derived from the table above, the three hospitals -highlighted in blue- which were chosen for our dataset have a rather large market share. For the years 2010 and 2011, the hospitals Axepa, Papageorgiou and Papanikolaou are responsible for the 56% of the total surgeries in the Thessaloniki region. It can be assumed that the findings derived from these hospitals are able to provide concrete outcomes.
Table 5: Total number of surgeries of the private clinicsPrivate
Clinics2007 2008 2009 2010 2011
DIAVALKANIKO56
17663 17315 16701 16134 15876
AGIOS LOUKAS57
18179 20190 22132 22290 23301
EUROMEDICA58
7956 8326 7819 6462 7063
These three private clinics hold the largest share of market in the Thessaloniki region, since the rest of the private clinics are specialized in the gynecological sector of the psychiatric region.
55 4th YPE (2013)56 DIAVALKANIKO (2013)57 AGIOS LOUKAS (2013)58 EUROMEDICA (2013)
Erasmus University of Rotterdam Naoum Anastasia May 2013

18 HOW THE ECONOMIC CRISIS IN GREECE HAS AFFECTED THE PATIENT FLOW BETWEEN PUBLIC HOSPITALS AND PRIVATE CLINICS
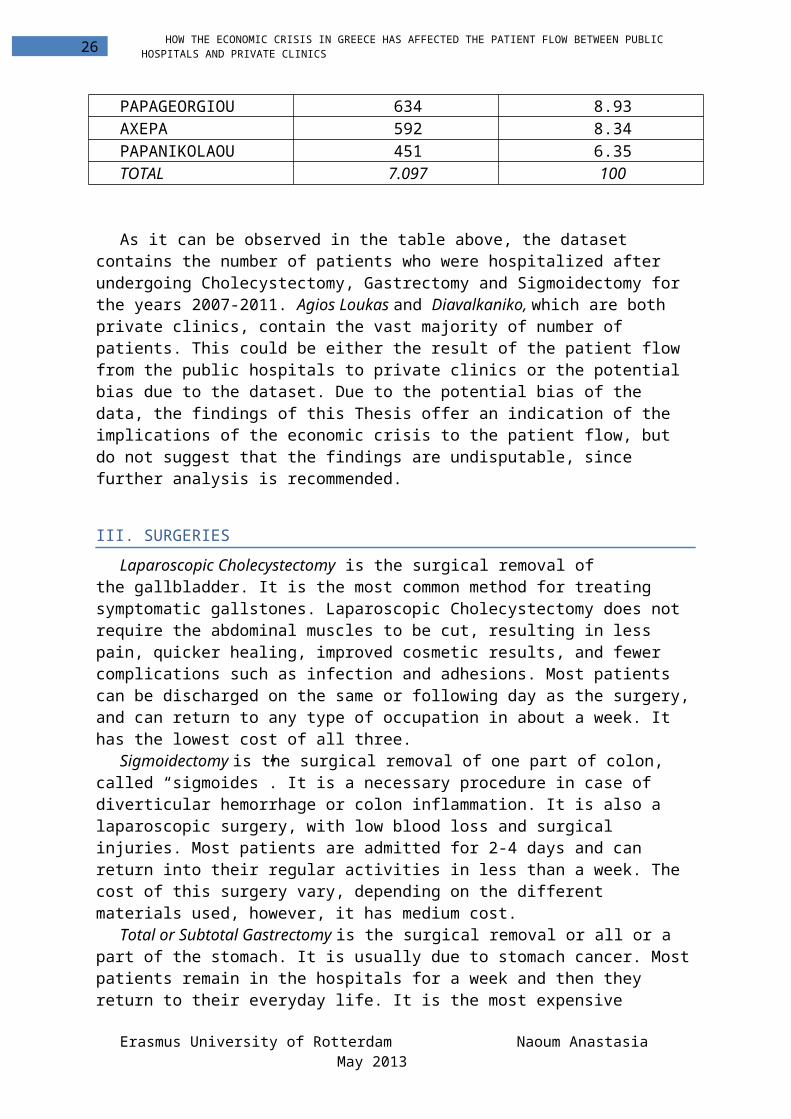
Table 6: Hospitals and clinics for 2007-2011Hospitals & Clinics Frequency Per cent
DIAVALKANIKO 2.149 34.08AGIOS LOUKAS 2,143 30.20EUROMEDICA 858 12.09PAPAGEORGIOU 634 8.93AXEPA 592 8.34PAPANIKOLAOU 451 6.35TOTAL 7.097 100
As it can be observed in the table above, the dataset contains the number of patients who were hospitalized after undergoing Cholecystectomy, Gastrectomy and Sigmoidectomy for the years 2007-2011. Agios Loukas and Diavalkaniko, which are both private clinics, contain the vast majority of number of patients. This could be either the result of the patient flow from the public hospitals to private clinics or the potential bias due to the dataset. Due to the potential bias of the data, the findings of this Thesis offer an indication of the implications of the economic crisis to the patient flow, but do not suggest that the findings are undisputable, since further analysis is recommended.
III. SURGERIES
Laparoscopic Cholecystectomy is the surgical removal of the gallbladder. It is the most common method for treating symptomatic gallstones. Laparoscopic Cholecystectomy does not require the abdominal muscles to be cut, resulting in less pain, quicker healing, improved cosmetic results, and fewer complications such as infection and adhesions. Most patients can be discharged on the same or following day as the surgery, and can return to any type of occupation in about a week. It has the lowest cost of all three.
Sigmoidectomy is the surgical removal of one part of colon, called “sigmoides”. It is a necessary procedure in case of diverticular hemorrhage or colon inflammation. It is also a laparoscopic surgery, with low blood loss and surgical injuries. Most patients are admitted for 2-4 days and can return into their regular activities in less than a week. The cost of this surgery vary, depending on the different materials used, however, it has medium cost.
Total or Subtotal Gastrectomy is the surgical removal or all or a part of the stomach. It is usually due to stomach cancer. Most patients remain in the hospitals for a week and then they return to their everyday life. It is the most expensive procedure of all three due to the higher number of hospital days, but also due to the increased difficulty of this surgery.59
These three surgeries are clustered in general laparoscopic surgeries. Since this Thesis deals with comparison between public hospitals and private clinics, the goal was to choose surgeries that are common, are divided in low, medium and high cost procedures and also necessary to be performed, considering the fact that the medical implications would be great if these surgeries were not performed.
59 Interviews with the hospitals’ managers
Erasmus University of Rotterdam Naoum Anastasia May 2013

19 HOW THE ECONOMIC CRISIS IN GREECE HAS AFFECTED THE PATIENT FLOW BETWEEN PUBLIC HOSPITALS AND PRIVATE CLINICS
Table 7: Number of patients for each surgery for 2007-2011Surgeries Frequency Per cent
CHOLECYSTECTOMY 6,192 87.25GASTRECTOMY 278 3.92SIGMOIDECTOMY 627 8.83TOTAL 7,097 100
As it was expected, the majority of the patients in our dataset underwent Cholecystectomy, the surgery with the lowest cost and surgical severity. However, the percent of the patients is overwhelming, which does not allow us to run separate regression models for each surgery. However, we are able to run separate regressions for every surgery, which provide us with very interesting results, analyzed in the ‘Empirical Analysis’ part of this study. In the case of Gastrectomy we were unable to provide very concrete results due to the very small number of observations, but still the logistic outcomes support our theory on the patient flow.
Graph 1: The mean cost of surgery Cholocystectomy separately for private and public sector in the years 2007-2011
050
01,
000
1,50
02,
000
2,50
0m
ean
of c
ost
Private Public2007 2008 2009 2010 2011 2007 2008 2009 2010 2011
Cholecystectomy
Graph 2: The mean cost of surgery Sigmoidectomy separately for private and public sector in the years 2007-2011
Erasmus University of Rotterdam Naoum Anastasia May 2013

20 HOW THE ECONOMIC CRISIS IN GREECE HAS AFFECTED THE PATIENT FLOW BETWEEN PUBLIC HOSPITALS AND PRIVATE CLINICS
02,
000
4,00
06,
000
8,00
0m
ean
of c
ost
Private Public2007 2008 2009 2010 2011 2007 2008 2009 2010 2011
Sigmoidectomy
Graph 3: The mean cost of surgery Gastrectomy separately for private and public sector in the years 2007-2011
02,
000
4,00
06,
000
8,00
0m
ean
of c
ost
Private Public2007 2008 2009 2010 2011 2007 2008 2009 2010 2011
Gastrectomy
In the tables above there are presented for each surgery, the cost per year for the private and the public sector respectively. As expected, the costs of the private clinics for all the surgeries are much higher compared to the public sector’s expenditure.
Erasmus University of Rotterdam Naoum Anastasia May 2013

21 HOW THE ECONOMIC CRISIS IN GREECE HAS AFFECTED THE PATIENT FLOW BETWEEN PUBLIC HOSPITALS AND PRIVATE CLINICS
Regarding the Cholecystectomy, a pattern can be observed, in both the private and the public sector. There is an increase in the healthcare cost in 2009 and then a sudden decrease during the years 2010 and 2011. As far as Sigmoidectomy is concerned, there are huge disparities between the private and the public sector. However, the same pattern is shown here, with higher costs during 2008 and 2009 and a sudden decline in the years after the economic crisis has appeared-i.e. 2010 and 2011. This is an indication of the economic crisis, due to the budget cuts and the understaffing. According to various articles as well as personal conversations with the directors of clinics and hospitals, one major impact of the economic crisis was the supply of cheap medical equipment. Due to the budget cuts, a measure taken was to substitute German medical equipment with Chinese equipment which is less costly. What is interesting however, is the vast decrease of the cost in the private sector. A plausible explanation is that the public hospitals are state funded and therefore, the private ones have more degrees of freedom to change their prices compared to the public sector. The price of a surgery does not involve only the cost of the surgery but also the cost of hospitalization days. The type of room is essential, as there are different prices depending if it a double, triple or private, with private room being the most expensive one. However, this dataset does not contain information on the type of room, so a plausible assumption is that the private clinics are able to change their prices more freely than the public hospitals, which potentially explains the vast decrease of the private cost.
Interestingly enough, Gastrectomy shows a completely different pattern. There is a decrease on costs in 2009, an increase in 2010 and then a decrease in 2011.Especially in the private clinics, the healthcare costs decrease at that point that are similar to the public sector expenditure. It has to be mentioned here, that Gastrectomy is one very severe surgery, not very common and also not possible to be postponed. Due to the very small number of observations though (278), the graph is not analyzed any further.
Table 8: The number of male and female patients enrolled in the sickness funds in 2007-2011
Sickness Funds per genderSICKNESS FUNDS FEMALE MALE TOTALDEI 28 38 66TPDI 11 13 24ETAA 85 70 155IKA 1701 1250 2951INSURANCE 115 86 201NAT 10 8 18OAEE 618 492 1110OGA 399 261 660OPAD 460 299 759TAPOTE 108 94 202TIPET 34 16 50TSAI 45 37 82TSMEDE 284 234 518WELFARE 15 22 37
Erasmus University of Rotterdam Naoum Anastasia May 2013
22 HOW THE ECONOMIC CRISIS IN GREECE HAS AFFECTED THE PATIENT FLOW BETWEEN PUBLIC HOSPITALS AND PRIVATE CLINICS
EDOEAP 8 2 10TOTAL 3920 2922 6842
In the table 7 (annex, table 2) is a detailed composition of the sickness funds for all the period we examine, 2007-2011. As expected, the largest sickness fund is IKA and the 2nd largest being OAEE, the sickness fund for the freelancers. OGA, the sickness fund for the farmers and OPAD, the sickness fund where all the public employees are enrolled are also 4th and 3rd respectively. The sickness fund INSURANCE is composed from all the patients who pay a private insurance, without that necessarily mean higher out-of-pocket expenses, since many private clinics have contracts with private insurers. TSMEDE is the sickness fund for engineers, has 518 patients involved.
6. EMPIRICAL ANALYSIS
This section provides the econometric analysis of the dataset with the goal to obtain results and possible explanations for the potential flow of patients between the public and the private healthcare sector. The model chosen are logistic regressions.The main reason for using a logistic regression is that there are many important research topics for which the dependent variable is "limited." For example: voting morbidity or mortality, and participation data is not continuous or distributed normally. Binary logistic regression is a type of regression analysis where the dependent variable is a dummy variable: coded 0 (private) or 1(public).
As it was analyzed in the theoretical part, the economic crisis in Greece has affected not only the financial situation of Greek citizens, but also the organization of the healthcare, the provision of healthcare services, the waiting times and the cost of healthcare. The dataset contains only information about the cost of the surgeries, the type of the surgery, the type of the hospitals (public and private), and the patients’ characteristics of age, sickness fund and gender as well as the years examined, the period 2007-2011.
First, the independent variable is defined, which is named “public”, a variable which takes the value 0 when the patients choose a private clinic and value 1 where the patients choose a public hospital. Next, the focus is on the years before and after the crisis. The years examined are 2007, 2008, 2009 2010 and 2011, considering 2008 being the beginning year of the crisis. Therefore, time dummies are included to the model since different outcomes between different years are expected. More specifically, what is expected is, that patient’ preferences being the same for 2007 and 2008 and completely different in 2010 and 2011. For instance, patients will prefer the private hospitals in 2007 and 2008 but in 2010 and 2011 they will be more probable to visit public ones.
Moreover, in order to examine which patient characteristics impact the patient’s choice, explanatory variables of sickness fund, age and marital status are tested. The variable marital status is also a dummy variable, where value 1 equals to the patient being married and value 3 to the patient being widower. There was also a value of 2 which equalled single, but the observations were too little and were constantly omitted, therefore there were deleted. Last but not least, the sickness funds are 13 in total and do not only provide information about the health insurance schemes of the patients, but also provide an insight on their occupation and income, since different professionals are enrolled in different sickness funds. The variable of age is an explanatory variable which contains the age of the patient when he/she underwent the surgery.
Erasmus University of Rotterdam Naoum Anastasia May 2013
23 HOW THE ECONOMIC CRISIS IN GREECE HAS AFFECTED THE PATIENT FLOW BETWEEN PUBLIC HOSPITALS AND PRIVATE CLINICS
One of the most intriguing variables is the variable of cost. The def_cost is the cost each patient paid for the surgery he/she underwent, so it is a different value per patient, per surgery, per hospital, per year. Moreover, it is deflated according to the inflation of each year.
The analysis starts with adding one by one the variables to the logit model, by testing the accuracy of my model with the command “fitstat”. The final model has a independent variable the dummy variable “public”, whereas the explanatory variables are the ones of def_cost, age, marital status, sickness fund and time dummies. Next, the logit model is tested against the probit model, but the difference of 214.519 in BIC' provides very strong support for saved model (logit).Therefore, the general model is the logit model. Furthermore, the jointly significance of the variables year, marital status and sickness funds is tested and shows that the variables are jointly statistically significant.
Fearing that the deflated cost may be endogenous, since the cost differs between the public hospitals and the private clinics, a Wald test of exogeneity is performed. In this relation, the command “ivprobit” is used, as in the Stata there is no option for using an instrumental variable with the logit model. “Hospital days” are used as an instrumental variable for the deflated cost. The rationale behind this choice is that hospitals days-the days a patient is hospitalized due to the surgery- are dependent with the cost of the surgery but independent of the type of the care, since the hospitals days are determined from the surgery and not from the type of the hospital. The ivprobit model provides a test of endogeneity (the null is exogeneity) of the regressors that are instrumented. The Wald test shows that the deflated cost is indeed endogenous, therefore the hospital days are used as a proxy (annex, tables 1-3).
As analyzed before, the three surgeries have different costs and severity, which imply different patterns for the patient choice on the public and private healthcare. The first attempt is to run three separate models, one for each surgery. However, this is not an option, since all the interactions are being backed up, irrelevant of the choice of the explanatory variables. Therefore, the variable “surgery” is included once with only the Sigmoidectomy and once with only Gastrectomy, in order to examine the different impact of each surgery using as base the other two surgeries (annex, tables 4-9)
The probit models provide information on the sign and the significance of the coefficient but on the magnitude. In order to examine the magnitude of each coefficient, the command “margins, dydx (*) atmeans” is used. With that command, variables whose values are not explicitly fixed are set equal to their means when computing the marginal effects. Below the coefficients of the variables are presented, as well as the significance at 5% and 10% is indicated with the *.
Table 9: Margins of the probit regressions for every surgeryVARIABLES INCLUDE ONLY
GASTRECTOMYINCLUDE ONLY
SIGMOEIDECTOMYDEFLATED COST 0.0000105* 0.0000108*AGE -0.0042944* -0.0030339*2007 -0.1721061* -0.1998234*2009 -1.815066* -1.831857 *2010 0.0905778* 0.0972916 *2011 0.0187495 0.0254505DEI -0.1413353 -0.0954276
Erasmus University of Rotterdam Naoum Anastasia May 2013
24 HOW THE ECONOMIC CRISIS IN GREECE HAS AFFECTED THE PATIENT FLOW BETWEEN PUBLIC HOSPITALS AND PRIVATE CLINICS
ETAA 0.3160513* 0.284249*INSURANCE -0.5611116 -0.1070604NAT -0.496858* -0.430987 *OAEE -0.1011344* -0.0971584 *OGA 0.5267202* 0.4538088 *OPAD -0.4660331* -0.437176 *TAPOTE 0.1301575* 0.1074994*TIPET -0.2452598 -0.1967827TSAI -0.3567394* - 0.339146 *TSMEDE -0.0066239 -0.0002169WELFARE 0.7305156* 0.6457348 *GASTRECTOMY -1.291892*
SIGMOEIDECTOMY -1.073243 *
The most interesting outcome of the margins presented above, is the negative relation between cost and choice of private hospital care. When the cost rises, patients tend to choose public healthcare for their surgeries. This is expected, since the rational behaviour of the patients is to choose more affordable care-implying public care, when the cost rises. As is it could be easily seen, especially in the cases of Cholecystectomy and Sigmoidectomy, using the 2008 as the base year, we could observe a difference in patients’ behaviour. Compared to 2008, in 2007 and 2009 patients are more probable to choose the private care opposed to public care, whereas in 2010–the year when the economic crisis is already established- patients are more probable to choose public care. This is also supported by the graphs depicting the difference in costs between years for every surgery, where there is a decrease of the costs in the years of 2010 and 2011.
In the case of Cholecystectomy, all the interactions are backed up regardless of which variables are included to the model, therefore it is not possible to analyze the impact of the crisis for that surgery alone, only in comparison to the Sigmoidectomy and Gastrectomy. As it can be easily seen, in both cases, a patient undergoing Sigmoidectomy compared to Cholecystectomy and Gastrectomy is more probable to choose private care. The same pattern applies to patient undergoing Gastrectomy respectively. Given the limitations of the data which does not allow the analysis of the impact of Cholecystectomy in the patient choice, the results provided above are merely assumptions. However, it can be assumed that since Gastrectomy and Sigmoidectomy are both severer surgeries compared to Cholecystectomy, patients tend to choose private care in grounds of better care in terms of quality.
Regarding the marital status and the gender of the patients, both their coefficients are statistically insignificant, therefore they are not included in the regressions. The variable of age however, is statistically significant and more importantly, it has a negative relation with the patient choice over public healthcare. This effect was expected primarily for two reasons. Firstly, people tend to become more financially stable and independent when they grow older, which also allows the assumption of being able to afford more expensive healthcare. Secondly, under the assumption of people growing older and therefore more probable to become widowers/widows, this effect could be contributed to psychological factors. Studies have shown that widows/widowers who have lost their loved ones to public hospitals avoid the hospital care. Another possible explanation is that due to their grief of death that relatives inevitably suffer from, the living ones tend to choose the best care,
Erasmus University of Rotterdam Naoum Anastasia May 2013

25 HOW THE ECONOMIC CRISIS IN GREECE HAS AFFECTED THE PATIENT FLOW BETWEEN PUBLIC HOSPITALS AND PRIVATE CLINICS
implying the private care. However, due to lack of qualitative data, these are merely assumptions.
Regarding the sickness funds, the effect are as expected.IKA, as already mentioned, is the largest sickness fund with the most national coverage; is used as a baseline for the regressions. Therefore, what is expected is for most of the sickness funds to have a negative relation with the public care compared to IKA. For instance, OAEE is the sickness fund for freelancers and opposed to IKA, covers less for public care. As expected, patients enrolled to OAEE tend to choose private care. The same applies for NAT, OPAD, TAPOTE and TSAI. What is interesting though, are the sickness funds which have a positive relation with the public healthcare; ETAA, OGA and WELFARE. OGA is the sickness fund for the farmers and also one of the sickness funds which covers all the cost of public care. Therefore, patients enrolled in OGA compared to IKA tend to choose public care. Moreover, farmers in Greece are low-paid, so public care is most often the best care they can afford. ETAA has 85 observations therefore, it is not analyzed. WELFARE is the sickness fund which the state provides free healthcare to the destitute, homeless and unemployed people. As expected, people enrolled in the state welfare tend to choose public care since they are not able to afford more expensive care, especially in the economic crisis.
7. CONCLUSIONS
After our descriptive statistic and empirical analysis, it can be conclusive that indeed 2008 was the beginning of economic crisis in Greece and after that year many changes occurred. Budget cuts, understaffed hospitals, prolonged waiting lists, unemployment and –the main focus of this study- a patient shift from private clinics to public hospitals. Marital status appears to be an insignificant factor as well as the gender of the patients. Age on the other hand, plays a major role and more concretely implies a negative relation between a person growing older and choosing public care. The sickness funds also play a role, since each fund has different contracts with different hospitals and clinics, which mean that even in this period of financial crisis, a private clinic may be a more suitable choice for specific sickness funds in Greece. What needs to be highlighted is the cost of the surgery. The cost of the surgery contains not only the cost of the surgery alone, but also the cost of the hospital room. Due to the endogeneity of the cost of the surgery, though, the number of hospitalization days is used as an instrumental variable. Using the hospital days as a proxy, it can be clearly seen that the increase of the cost increase the probability of the patient choosing public healthcare over private healthcare. This Thesis has severe limitations; the dataset has potential bias, due to the lack of the percentage of patients postponing the surgeries as well as of the percentage of patients choosing other hospitals or clinics. Moreover, there is no information on the informal payments or the type of the hospital room. However, this dataset has never been obtained before .Furthermore, this kind of analysis has not been conducted before, which makes this Thesis a unique and a first example of econometric analysis in the surgical sector.This study is only an indication, regarding only three surgeries in three clinics and three hospitals in Thessaloniki. It is important to emphasize that these findings are not meant to be generalized to the city or country as a whole. The patient flow is still a major issue, which should be examined by all the perspectives, both economic but also from an ethical and societal perspective. Patient choice may be explained with the use of the econometric methods, but patients are still
Erasmus University of Rotterdam Naoum Anastasia May 2013
26 HOW THE ECONOMIC CRISIS IN GREECE HAS AFFECTED THE PATIENT FLOW BETWEEN PUBLIC HOSPITALS AND PRIVATE CLINICS
individuals and their rationale may be not so easily captured by the statistically significance of the variables used. Therefore, a qualitative analysis is also needed in order to better explain the shift of patient flow from private sector to public sector.
8. REFERENCES
4th Ype (2013) Agios Loukas offices (2013) Athanassopoulos A, Gounaris C, Sissouras A (1999),.A descriptive assessment of the
production and cost efficiency of general hospitals in Greece. Health Care Management Science, 2(2):97–106
Avgenakis E (2011).Question: dramatic increase in the number of suicides due to the economic crisis and rumors on the operation of networks of usurers and blackmailers. Reference number: 16171. Athens: Hellenic Parliament
Bago d’Uva T, A Jones, E van Doorslaer(2009).Measurement of Horizontal Inequity in Health Care Utilisation using European Panel Data. Journal of Health Economics; 28(2): 280-289.
Ballas A, Tsoukas H (2004). Measuring nothing: the case of the Greek National Health System. Human Relations, 57(6):661–690.
Bank of Greece (2010a). Annual report 2009. Athens, Bank of Greece. Beazoglou T, Heffley D, Kyriopoulos J (1997). Human resources supply and cost
containment in the health system. Athens: Exandas Bouloutza P (2011). Τρια ανοιχτα μέτωπα στην Υγεία-Καθοριστικός μήνας ο
Δεκέμβριος. Kathimerini 2 (464358) Boutsioli Z (2007). Concentration in the Greek private hospital sector: A descriptive
analysis. Health Policy, 82(2):212 225. Brian–Abel Smith et al. (2004). Restructuring the Greek NHS. The Report of the
Experts, Ministry of Health, Athens. Bronchi C (2001), Options for reforming the tax system in Greece. Paris, Organisation
for Economic Co-operation and Development (OECD Economics Department Working Papers No. 291).
Davaki K, Mossialos E (2005). Plus can Change: health sector reforms in Greece. Journal of Health Politics, Policy and Law; 30(1–2):143–68.
Davaki K, Mossialos E (2006), Financing and delivering health care, In: Petmesidou M, Mossialos E, eds. Social policy developments in Greece. Aldershot, Ashgate.
Diavalkaniko offices (2013) Economou Ch (2004). Πολιτικές υγείας στην Ελλάδα και τις Ευρωπαϊκές κοινωνίες
[Health policies in Greece and the European societies]. Athens, Dionikos. Economou Ch (2008). Country report: Private health insurance in Greece. Athens. Economou Ch, Giorno C (2009). Improving the performance of the public health care
system in Greece. Paris, Organisation for Economic Co-operation and Development.(OECD Economics Department Working Papers No. 722)
Economou ,C(2010).Health Systems in Transitions: Greece. WHO Ensor T. (2004). Informal payments for health care in transition economies, Social
Science & Medicine; 58:23746. Eurobarometer (2007), (2009), (2011)
Erasmus University of Rotterdam Naoum Anastasia May 2013

27 HOW THE ECONOMIC CRISIS IN GREECE HAS AFFECTED THE PATIENT FLOW BETWEEN PUBLIC HOSPITALS AND PRIVATE CLINICS
Euromedica offices (2013) Eurostat (2011).Euro area and EU27 government deficit at 6·0% and 6·4% of GDP
respectively, Luxembourg: Eurostat Hellastat (2010). Sector study: health services. Athens. Hellenic Statistical Authority (2011).Unemployment rate at 16·6% in May 2011.
Piraeus: Hellenic Statistical Authority Hellenic Statistical Authority (2011).The production index in industry recorded a
decline of 8·0% in March 2011 compared with March 2010. Piraeus: Hellenic Statistical Authority
Institute for Social and Preventive Medicine (2006) Kentikelenis A. et al (2011).Health effects of financial crisis: omens of a Greek
tragedy, Lancet, Vol 378 Karaiskou A, Malliarou M and Sarafis P (2012).Οικονομική κρίση: Επίδραση στην
υγεία των πολιτών και επιπτώσεις στα Συστήματα Υγείας. Διεπιστημονική Φροντίδα Υγείας 4(3):49-54
Kyriopoulos I (2010). Lecture: Οι επιπτώσεις της οικονομικής κρίσης στην υγεία και την ιατρική περίθαλψη. Αρχεία Ελληνικής Ιατρικής 27(5):834-840
Kyriopoulos, Gregory & Economou (2003).Health and Health Services in the Greek populations, Athens: Papazisis (in Greek)
Kyriopoulos J., Economou C., Dolgeras A., (2001) Side Payments in the Greek Health Sector: The Dilemma of Equity and Efficiency. In: Kyriopoulos J., Beazoglou T., Heffley D., (Eds.), Health Economics in the New Era. FICOSSER/Exandas, Athens, 107-122
Kyriopoulos J (2004). Informal payments in the health sector: Some evidence and research issues. In Kyriopoulos J, ed. Health systems in the world: From evidence to policy, Athens, Papazisis Publishers.
Kyriopoulos J, Ktenas E (1994).Factors affecting additional out of pocket payment in health services. Society Economy and Health; 3(4):185–95 [in Greek]
Liakopoulou T (2011). Since last year private hospitals are in trouble while NHS is doing better, Kathimerini.
Liakopoulou T (2011). Η οικονομική κρίση απειλεί νοσοκομεία και βάζει λουκέτα σε ιδιωτικές κλινικές. Kathimerini 1 (439956)
Liaropoulos L (1995).Health services financing in Greece: A role for private health insurance. Health Policy, 34(1):53–62.
Liaropoulos L, Kaitelidou D. (1998), Changing the public–private mix: an assessment of the health reforms in Greece, Health Care Anal; 6:277–85.
Liaropoulos et al (2008).Informal payments in public hospitals in Greece, Health Policy, 87(1):72–81.
Liaropoulos L, Tragakes, E (1998). Public/private financing in the Greek health care system: implications for equity. Health Policy 43; 153–169
Lindsay & Feigenbaum (1984). Rationing the waiting Lists. The American Economic Review (AER);74(3);404-17
Moschuris S, Kondylis M (2006). Outsourcing in public hospitals: A Greek perspective. Journal of Health Organization and Management, 20(1):4–14.
Mossialos, Allin, Davaki (2005).Analyzing the Greek health system: A tale of fragmentation and inertia, Health Econ. 14: S151–S168
Mossialos E, Davaki D (2002).Health care developments in Greece: looking back to see forward? LSE Health and Social Care
Erasmus University of Rotterdam Naoum Anastasia May 2013

28 HOW THE ECONOMIC CRISIS IN GREECE HAS AFFECTED THE PATIENT FLOW BETWEEN PUBLIC HOSPITALS AND PRIVATE CLINICS
Mossialos E, Dixon A (2002). Funding health care in Europe: Weighing up the options.In: Mossialos E et al., eds. Funding health care: Options for Europe. Buckingham, Open University Press: 272–300.
Mossialos E, Thomson S (2004). Voluntary health insurance in the European Union. Copenhagen, WHO Regional Office for Europe on behalf of the European Observatory on Health Systems and Policies.
OECD Health Data (Various years). Organization for Economic Co-operation and Development. Paris
Polyzos N (2011). Presentation of the Secretary General of the Ministry of Health and Social Solidarity. ESY.net, Athens: Ministry of Health and Social Solidarity
Siskou O (2006). An Analysis of Private Health Expenditure in Greece, Ph.D. dissertation. Department of Nursing. University of Athens (in Greek).
Siskou O et al. (2008). Private health expenditure in the Greek health care system: Where truth ends and the myth begins. Health Policy, 88:282–293.
Sissouras A, Karokis A, Mossialos E (1999). Health care and cost containment in Greece. In: Mossialos E, Le Grand J, eds. Health care and cost containment in the European Union.Aldershot, Ashgate:341–400.
Sox CM, Bursin HR, Edwards RA, O’Neil AC, Brennan TA (1998).Hospital admissions through the emergency department: does insurance status matter? The American Journal of Medicine; 105(6):506–12.
Stambolovic V (2003). Epidemic of health care reforms. European Journal of Public Health, 13(1):77–79.
Stuckler,D (2009) et al. The public health effect of economic crises and alternative policy responses in Europe: an empirical analysis. Lancet, 374:315-23
Tatsos N (2001). Net expenditure for social protection. Study conducted for the National Statistical Service of Greece. Athens, National Statistical Service of Greece.
Telloglou T, Kakaounaki M (2011). Three weeks and one night on duty. In: Papahelas A, Telloglou T, Papaioannou S, eds. Folders. Greece: Skai TV
Telloglou T (2011). Interview with Minister of Health Andreas Loverdos. In: Papahelas A, Telloglou T, Papaioannou S, eds. Folders. Greece: Skai TV
Theodorokioglou Y & Tsiotras, G (2000). The need for the introduction of quality management into Greek health care. Total Quality Management and Business Excellence 11, 8: 1153-1165.
The Economist (2012), http://www.economist.com/blogs/graphicdetail/2013/02/european-economy-guide?zid=307&ah=5e80419d1bc9821ebe173f4f0f060a07
Tountas Y, Karnaki P, Pavi E, Souliotis K. (2005). The “unexpected” growth of the private health sector in Greece. Health Policy; 74(2):167–80
Transparency International Greece (2013). Accessed at : http://en.transparency.gr/Content.aspx?page=15
Van Doorslaer E, Koolman X, Puffer F (2002). Equity in the use of physician visits in OECD countries: Has equal treatment for equal need been achieved? In: Smith P, ed. Measuring up: Improving health system performance in OECD countries. Paris, Organisation for Economic Co-operation and Development: 225–248.
Zsolt Darvas (2010).The Impact of the Crisis on Budget Policy in Central and Eastern Europe, OECD Journal on Budgeting Volume 2010/1, OECD
Erasmus University of Rotterdam Naoum Anastasia May 2013

29 HOW THE ECONOMIC CRISIS IN GREECE HAS AFFECTED THE PATIENT FLOW BETWEEN PUBLIC HOSPITALS AND PRIVATE CLINICS
9. ANNEX
Table 1-General Probit model
_cons -.7373271 .0914544 -8.06 0.000 -.9165744 -.5580798 15 2.175471 .3457592 6.29 0.000 1.497795 2.853146 14 -1.855678 .1862968 -9.96 0.000 -2.220813 -1.490543 13 -.6590084 .1939458 -3.40 0.001 -1.039135 -.2788816 11 -1.178628 .3246974 -3.63 0.000 -1.815023 -.5422328 10 -.4032219 .1103714 -3.65 0.000 -.6195458 -.186898 9 -.4803291 .0648764 -7.40 0.000 -.6074845 -.3531738 8 .9784058 .0577211 16.95 0.000 .8652745 1.091537 7 -.3610611 .053437 -6.76 0.000 -.4657957 -.2563264 6 -.2182291 .3339862 -0.65 0.513 -.8728301 .4363719 5 -.9691839 .1570006 -6.17 0.000 -1.276899 -.6614683 3 .1140007 .1101443 1.04 0.301 -.1018782 .3298796 1 .0461857 .1697781 0.27 0.786 -.2865732 .3789446 sicknessfund1 2011 -.0788655 .0666621 -1.18 0.237 -.2095207 .0517898 2010 -.2257061 .0685452 -3.29 0.001 -.3600523 -.0913599 2008 -.0260819 .0642066 -0.41 0.685 -.1519245 .0997607 2007 .1736582 .0684675 2.54 0.011 .0394645 .307852 year 3.maritalsta~1 -1.205863 .1450702 -8.31 0.000 -1.490195 -.9215303 def_cost -1.26e-06 2.12e-07 -5.93 0.000 -1.68e-06 -8.43e-07 age .0058179 .0011771 4.94 0.000 .0035108 .0081251 public Coef. Std. Err. z P>|z| [95% Conf. Interval]
Log likelihood = -3145.2053 Pseudo R2 = 0.1614 Prob > chi2 = 0.0000 LR chi2(19) = 1210.91Probit regression Number of obs = 6645
Erasmus University of Rotterdam Naoum Anastasia May 2013

30 HOW THE ECONOMIC CRISIS IN GREECE HAS AFFECTED THE PATIENT FLOW BETWEEN PUBLIC HOSPITALS AND PRIVATE CLINICS
Table 2- General IV Probit Model
Wald test of exogeneity (/athrho = 0): chi2(1) = 2137.37 Prob > chi2 = 0.0000 14.sicknessfund1 15.sicknessfund1 hospitaldays 10.sicknessfund1 11.sicknessfund1 13.sicknessfund1 7.sicknessfund1 8.sicknessfund1 9.sicknessfund1 3.sicknessfund1 5.sicknessfund1 6.sicknessfund1Instruments: age 2007.year 2009.year 2010.year 2011.year 1.sicknessfund1Instrumented: def_cost sigma 86161.33 747.396 84708.84 87638.72 rho -.9743766 .002377 -.9786408 -.9692742 /lnsigma 11.36398 .0086744 1310.06 0.000 11.34698 11.38098 /athrho -2.17225 .0469861 -46.23 0.000 -2.264341 -2.080159 _cons -.4587346 .0569135 -8.06 0.000 -.570283 -.3471862 15 .7623394 .1890894 4.03 0.000 .391731 1.132948 14 -.0779251 .0713821 -1.09 0.275 -.2178314 .0619812 13 -.3826825 .1212221 -3.16 0.002 -.6202735 -.1450915 11 -.2570423 .1602294 -1.60 0.109 -.5710861 .0570015 10 .1096857 .0774036 1.42 0.156 -.0420226 .261394 9 -.4623067 .0445325 -10.38 0.000 -.5495888 -.3750245 8 .5163558 .0466762 11.06 0.000 .4248721 .6078395 7 -.1049771 .03813 -2.75 0.006 -.1797105 -.0302437 6 -.5051819 .2457378 -2.06 0.040 -.9868192 -.0235446 5 -.142688 .0870633 -1.64 0.101 -.313329 .0279529 3 .2963953 .0848511 3.49 0.000 .1300902 .4627004 1 -.1578486 .1321556 -1.19 0.232 -.4168689 .1011717sicknessfund1 2011 .0100768 .0383965 0.26 0.793 -.065179 .0853326 2010 .0639005 .0384843 1.66 0.097 -.0115273 .1393284 2009 -1.717791 .0426326 -40.29 0.000 -1.801349 -1.634233 2007 -.1691208 .043545 -3.88 0.000 -.2544675 -.0837742 year age -.0055226 .0008257 -6.69 0.000 -.0071409 -.0039043 def_cost 9.73e-06 1.28e-07 76.04 0.000 9.48e-06 9.98e-06 Coef. Std. Err. z P>|z| [95% Conf. Interval]
Log likelihood = -87224.466 Prob > chi2 = 0.0000 Wald chi2(18) = 6787.57Probit model with endogenous regressors Number of obs = 6645
Table 3- Classification of the General IV Probit Model
Erasmus University of Rotterdam Naoum Anastasia May 2013
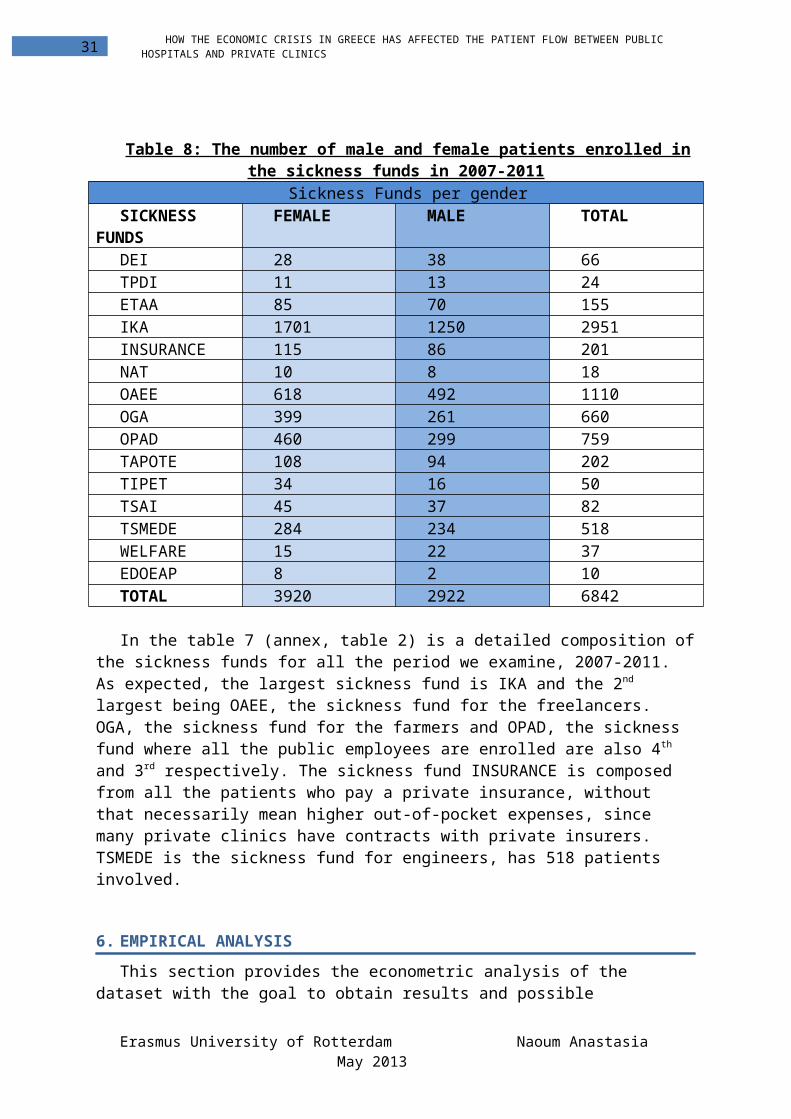
31 HOW THE ECONOMIC CRISIS IN GREECE HAS AFFECTED THE PATIENT FLOW BETWEEN PUBLIC HOSPITALS AND PRIVATE CLINICS
Correctly classified 63.48% False - rate for classified - Pr( D| -) 24.18%False + rate for classified + Pr(~D| +) 71.90%False - rate for true D Pr( -| D) 71.15%False + rate for true ~D Pr( +|~D) 24.86% Negative predictive value Pr(~D| -) 75.82%Positive predictive value Pr( D| +) 28.10%Specificity Pr( -|~D) 75.14%Sensitivity Pr( +| D) 28.85% True D defined as public != 0Classified + if predicted Pr(D) >= .5
Total 1674 4971 6645 - 1191 3735 4926 + 483 1236 1719 Classified D ~D Total True
Probit model for public
Table 4-IV Probit Model with only Gastrectomy included
Wald test of exogeneity (/athrho = 0): chi2(1) = 1870.09 Prob > chi2 = 0.0000 14.sicknessfund1 15.sicknessfund1 2.surgery1 hospitaldays 10.sicknessfund1 11.sicknessfund1 13.sicknessfund1 7.sicknessfund1 8.sicknessfund1 9.sicknessfund1 3.sicknessfund1 5.sicknessfund1 6.sicknessfund1Instruments: age 2007.year 2009.year 2010.year 2011.year 1.sicknessfund1Instrumented: def_cost sigma 84028.55 728.8957 82612.02 85469.37 rho -.9835629 .0018069 -.9867512 -.9796153 /lnsigma 11.33891 .0086744 1307.17 0.000 11.32191 11.35591 /athrho -2.396554 .0554186 -43.24 0.000 -2.505173 -2.287936 _cons -.5071154 .056146 -9.03 0.000 -.6171595 -.3970713 2.surgery1 -1.291892 .0677262 -19.08 0.000 -1.424633 -1.159151 15 .7305156 .1832312 3.99 0.000 .3713891 1.089642 14 -.0066293 .0649817 -0.10 0.919 -.1339911 .1207325 13 -.3567394 .1189064 -3.00 0.003 -.5897917 -.1236871 11 -.2452598 .154443 -1.59 0.112 -.5479625 .057443 10 .1301575 .0760967 1.71 0.087 -.0189892 .2793043 9 -.4660331 .0437647 -10.65 0.000 -.5518103 -.3802558 8 .5267202 .0461965 11.40 0.000 .4361767 .6172636 7 -.1011344 .0375579 -2.69 0.007 -.1747465 -.0275222 6 -.496858 .2426579 -2.05 0.041 -.9724586 -.0212573 5 -.0561116 .0843715 -0.67 0.506 -.2214767 .1092535 3 .3160513 .0841314 3.76 0.000 .1511568 .4809458 1 -.1413353 .1304874 -1.08 0.279 -.3970859 .1144153sicknessfund1 2011 .0187495 .0378594 0.50 0.620 -.0554535 .0929525 2010 .0905778 .0378922 2.39 0.017 .0163104 .1648452 2009 -1.815066 .0420674 -43.15 0.000 -1.897517 -1.732616 2007 -.1721061 .0429603 -4.01 0.000 -.2563068 -.0879055 year age -.0042944 .0008155 -5.27 0.000 -.0058928 -.002696 def_cost .0000105 1.27e-07 82.59 0.000 .0000102 .0000107 Coef. Std. Err. z P>|z| [95% Conf. Interval]
Log likelihood = -87045.672 Prob > chi2 = 0.0000 Wald chi2(19) = 7814.11Probit model with endogenous regressors Number of obs = 6645
Table 5- Classification of the IV Probit Model with only Gastrectomy included
Erasmus University of Rotterdam Naoum Anastasia May 2013

32 HOW THE ECONOMIC CRISIS IN GREECE HAS AFFECTED THE PATIENT FLOW BETWEEN PUBLIC HOSPITALS AND PRIVATE CLINICS
Correctly classified 57.94% False - rate for classified - Pr( D| -) 26.00%False + rate for classified + Pr(~D| +) 76.55%False - rate for true D Pr( -| D) 70.43%False + rate for true ~D Pr( +|~D) 32.51% Negative predictive value Pr(~D| -) 74.00%Positive predictive value Pr( D| +) 23.45%Specificity Pr( -|~D) 67.49%Sensitivity Pr( +| D) 29.57% True D defined as public != 0Classified + if predicted Pr(D) >= .5
Total 1674 4971 6645 - 1179 3355 4534 + 495 1616 2111 Classified D ~D Total True
Probit model for public
Table 6-Margins of IV Probit Model with only Gastrectomy included
hospitaldays 0 (omitted) 2.surgery1 -1.291892 .0677262 -19.08 0.000 -1.424633 -1.159151 15 .7305156 .1832312 3.99 0.000 .3713891 1.089642 14 -.0066293 .0649817 -0.10 0.919 -.1339911 .1207325 13 -.3567394 .1189064 -3.00 0.003 -.5897917 -.1236871 11 -.2452598 .154443 -1.59 0.112 -.5479625 .057443 10 .1301575 .0760967 1.71 0.087 -.0189892 .2793043 9 -.4660331 .0437647 -10.65 0.000 -.5518103 -.3802558 8 .5267202 .0461965 11.40 0.000 .4361767 .6172636 7 -.1011344 .0375579 -2.69 0.007 -.1747465 -.0275222 6 -.496858 .2426579 -2.05 0.041 -.9724586 -.0212573 5 -.0561116 .0843715 -0.67 0.506 -.2214767 .1092535 3 .3160513 .0841314 3.76 0.000 .1511568 .4809458 1 -.1413353 .1304874 -1.08 0.279 -.3970859 .1144153sicknessfund1 2011 .0187495 .0378594 0.50 0.620 -.0554535 .0929525 2010 .0905778 .0378922 2.39 0.017 .0163104 .1648452 2009 -1.815066 .0420674 -43.15 0.000 -1.897517 -1.732616 2007 -.1721061 .0429603 -4.01 0.000 -.2563068 -.0879055 year age -.0042944 .0008155 -5.27 0.000 -.0058928 -.002696 def_cost .0000105 1.27e-07 82.59 0.000 .0000102 .0000107 dy/dx Std. Err. z P>|z| [95% Conf. Interval] Delta-method
Table 7-IV Probit Model with only Sigmoidectomy included
Erasmus University of Rotterdam Naoum Anastasia May 2013
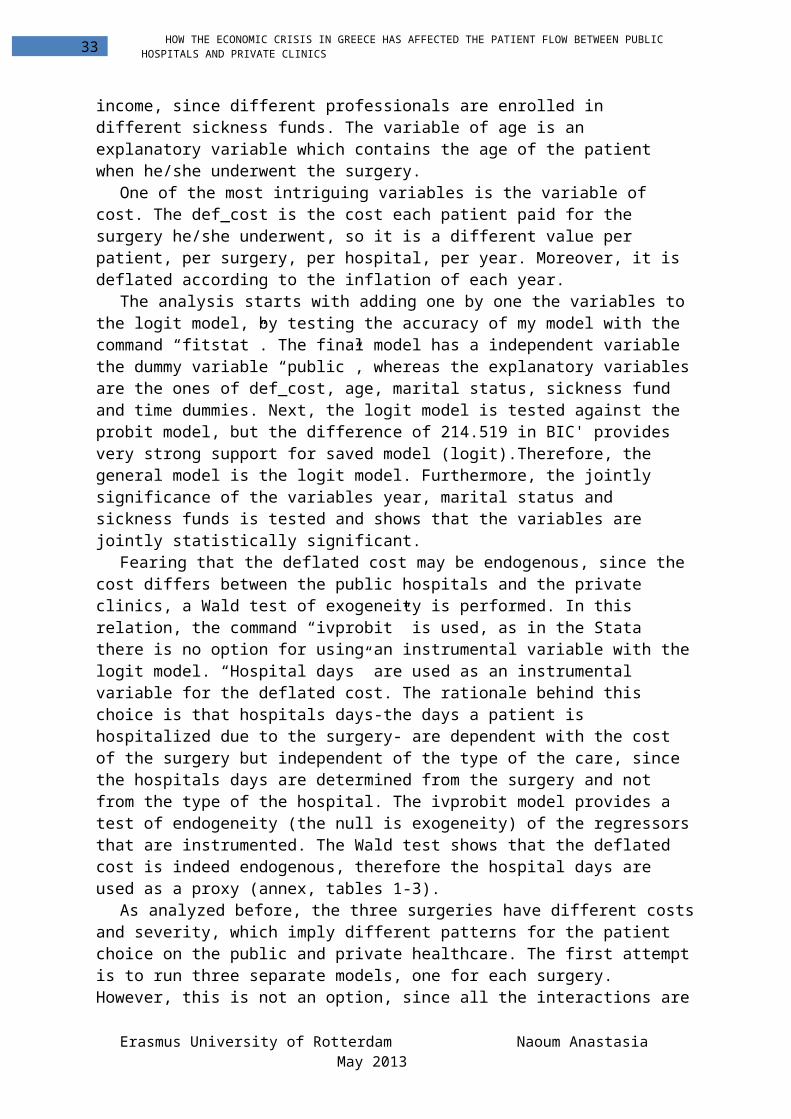
33 HOW THE ECONOMIC CRISIS IN GREECE HAS AFFECTED THE PATIENT FLOW BETWEEN PUBLIC HOSPITALS AND PRIVATE CLINICS
Wald test of exogeneity (/athrho = 0): chi2(1) = 1627.05 Prob > chi2 = 0.0000 14.sicknessfund1 15.sicknessfund1 3.surgery1 hospitaldays 10.sicknessfund1 11.sicknessfund1 13.sicknessfund1 7.sicknessfund1 8.sicknessfund1 9.sicknessfund1 3.sicknessfund1 5.sicknessfund1 6.sicknessfund1Instruments: age 2007.year 2009.year 2010.year 2011.year 1.sicknessfund1Instrumented: def_cost sigma 83293.8 722.5225 81889.65 84722.02 rho -.9875244 .0015586 -.9902356 -.9840664 /lnsigma 11.33013 .0086744 1306.16 0.000 11.31313 11.34713 /athrho -2.535434 .0628568 -40.34 0.000 -2.658631 -2.412237 _cons -.5376499 .0558355 -9.63 0.000 -.6470856 -.4282143 3.surgery1 -1.073243 .0487298 -22.02 0.000 -1.168751 -.9777339 15 .6457348 .1805402 3.58 0.000 .2918825 .9995871 14 -.0002169 .0617712 -0.00 0.997 -.1212861 .1208524 13 -.339146 .1178214 -2.88 0.004 -.5700716 -.1082204 11 -.1967827 .1516834 -1.30 0.195 -.4940768 .1005113 10 .1074994 .0754547 1.42 0.154 -.040389 .2553878 9 -.437176 .0434235 -10.07 0.000 -.5222845 -.3520675 8 .4538088 .0460176 9.86 0.000 .363616 .5440017 7 -.0971584 .0373061 -2.60 0.009 -.170277 -.0240398 6 -.430987 .2411069 -1.79 0.074 -.9035479 .0415739 5 -.1070604 .0831459 -1.29 0.198 -.2700233 .0559025 3 .284249 .0837996 3.39 0.001 .1200048 .4484931 1 -.0954276 .1297851 -0.74 0.462 -.3498016 .1589465sicknessfund1 2011 .0254505 .0376154 0.68 0.499 -.0482744 .0991753 2010 .0972916 .0376276 2.59 0.010 .0235428 .1710404 2009 -1.831857 .0416946 -43.94 0.000 -1.913576 -1.750137 2007 -.1998234 .0427212 -4.68 0.000 -.2835555 -.1160913 year age -.0030339 .0008153 -3.72 0.000 -.0046319 -.001436 def_cost .0000108 1.27e-07 85.03 0.000 .0000105 .000011 Coef. Std. Err. z P>|z| [95% Conf. Interval]
Log likelihood = -86987.774 Prob > chi2 = 0.0000 Wald chi2(19) = 8274.58Probit model with endogenous regressors Number of obs = 6645
Table 8- Classification of the IV Probit Model with only Sigmoidectomy included
Correctly classified 52.67% False - rate for classified - Pr( D| -) 28.30%False + rate for classified + Pr(~D| +) 80.18%False - rate for true D Pr( -| D) 71.15%False + rate for true ~D Pr( +|~D) 39.31% Negative predictive value Pr(~D| -) 71.70%Positive predictive value Pr( D| +) 19.82%Specificity Pr( -|~D) 60.69%Sensitivity Pr( +| D) 28.85% True D defined as public != 0Classified + if predicted Pr(D) >= .5
Total 1674 4971 6645 - 1191 3017 4208 + 483 1954 2437 Classified D ~D Total True
Probit model for public
Table 9-Margins of IV Probit Model with only Sigmoidectomy included
Erasmus University of Rotterdam Naoum Anastasia May 2013

34 HOW THE ECONOMIC CRISIS IN GREECE HAS AFFECTED THE PATIENT FLOW BETWEEN PUBLIC HOSPITALS AND PRIVATE CLINICS
hospitaldays 0 (omitted) 3.surgery1 -1.073243 .0487298 -22.02 0.000 -1.168751 -.9777339 15 .6457348 .1805402 3.58 0.000 .2918825 .9995871 14 -.0002169 .0617712 -0.00 0.997 -.1212861 .1208524 13 -.339146 .1178214 -2.88 0.004 -.5700716 -.1082204 11 -.1967827 .1516834 -1.30 0.195 -.4940768 .1005113 10 .1074994 .0754547 1.42 0.154 -.040389 .2553878 9 -.437176 .0434235 -10.07 0.000 -.5222845 -.3520675 8 .4538088 .0460176 9.86 0.000 .363616 .5440017 7 -.0971584 .0373061 -2.60 0.009 -.170277 -.0240398 6 -.430987 .2411069 -1.79 0.074 -.9035479 .0415739 5 -.1070604 .0831459 -1.29 0.198 -.2700233 .0559025 3 .284249 .0837996 3.39 0.001 .1200048 .4484931 1 -.0954276 .1297851 -0.74 0.462 -.3498016 .1589465sicknessfund1 2011 .0254505 .0376154 0.68 0.499 -.0482744 .0991753 2010 .0972916 .0376276 2.59 0.010 .0235428 .1710404 2009 -1.831857 .0416946 -43.94 0.000 -1.913576 -1.750137 2007 -.1998234 .0427212 -4.68 0.000 -.2835555 -.1160913 year age -.0030339 .0008153 -3.72 0.000 -.0046319 -.001436 def_cost .0000108 1.27e-07 85.03 0.000 .0000105 .000011 dy/dx Std. Err. z P>|z| [95% Conf. Interval] Delta-method
Erasmus University of Rotterdam Naoum Anastasia May 2013


