11/13/2017 SC2017 Tutorial How to Analyze the Performance of Parallel Codes 101 A case study with Open|SpeedShop Martin Schulz: LLNL, TU-München Jennifer Green: LANL Dave Montoya: LANL Don Maghrak: Krell Institute Jim Galarowicz: Krell Institute LLNL-PRES-503451
Transcript
11/13/2017
SC2017 Tutorial
How to Analyze the Performance of Parallel Codes 101 A case study with Open|SpeedShop
Martin Schulz: LLNL, TU-München
Jennifer Green: LANL
Dave Montoya: LANL
Don Maghrak: Krell Institute
Jim Galarowicz: Krell Institute
LLNL-PRES-503451
11/13/2017
Why This Tutorial?
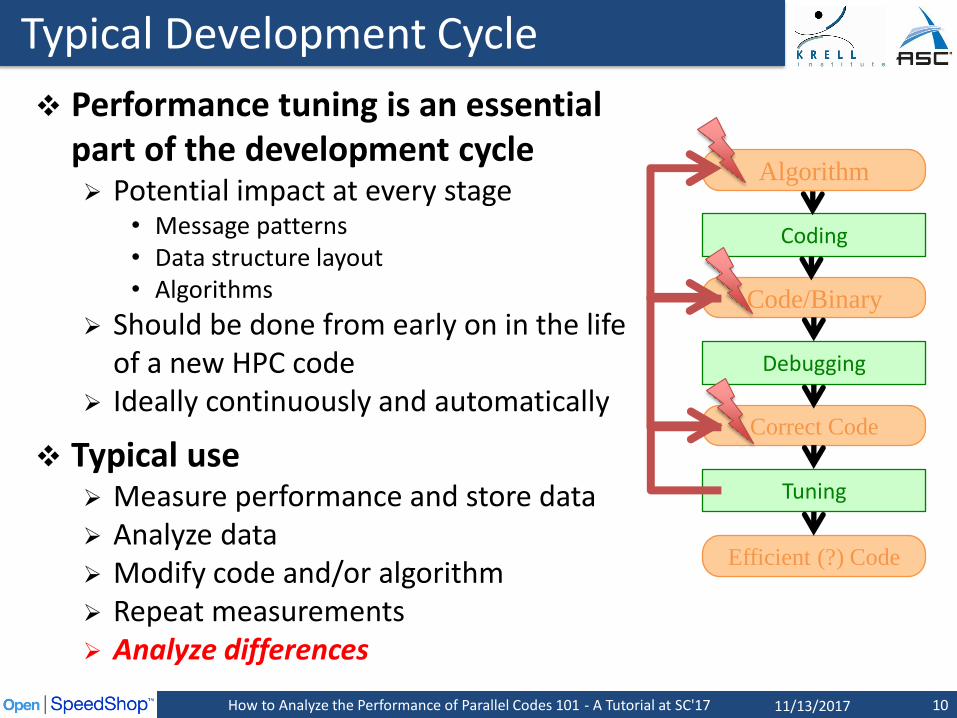
Performance Analysis is becoming more important Complex architectures and complex applications Mapping applications onto architectures is hard Today’s applications only use a fraction of the machine
Performance analysis is more than just measuring time What are the critical sections in a code? Is a part of the code running efficiently or not? Is the code using the resources well (memory, TLB, I/O, …)? Where is the greatest payoff for optimization?
Often hard to know where to start Which experiments to run first? How to plan follow-on experiments? What kind of problems can be explored? How to interpret the data?
2How to Analyze the Performance of Parallel Codes 101 - A Tutorial at SC'17
11/13/2017
Tutorial Goals
Basic introduction into performance analysis Typical pitfalls wrt. performance Wide range of types of performance tools and techniques
Provide basic guidance on … How to understand the performance of a code? How to answer basic performance questions? How to plan performance experiments?
Provide you with the ability to … Run these experiments on your own code Provide starting point for performance optimizations
Practical Experience: Demos and hands-on Experience Introduction into Open|SpeedShop as one possible tool solution Basic usage instructions and pointers to documentation Lessons and strategies apply to any tool
3How to Analyze the Performance of Parallel Codes 101 - A Tutorial at SC'17
11/13/2017
Open|SpeedShop Tool Set
Open Source Performance Analysis Tool Framework Most common performance analysis steps all in one tool Combines tracing and sampling techniques Extensible by plugins for data collection and representation Gathers and displays several types of performance information
Scalable Data Collection Instrumentation of unmodified application binaries New option for hierarchical online data aggregation
Supports a wide range of systems Extensively used and tested on a variety of Linux clusters Cray and Blue Gene support
How to Analyze the Performance of Parallel Codes 101 - A Tutorial at SC'17 4
11/13/2017
“Plan”/“Rules”
Staggered approach/agenda First session: performance analysis basics and getting ready Second session: Digging deeper and going parallel Third session: more specialized topics (HWC and I/O) Fourth session: new architectural challenges (memory and GPU) Hands-on experiments in each session
Let’s keep this interactive Feel free to ask questions as we go along Ask if you would like to see anything specific in the demos
We are interested in feedback! What was clear / what didn’t make sense? What scenarios are missing?
Updated slides available before SC https://www.openspeedshop.org/wp/category/tutorials Then choose SC2017 Monday Nov 13 tutorial
5How to Analyze the Performance of Parallel Codes 101 - A Tutorial at SC'17
William Hachfeld, David Whitney: Krell Institute Gregory Schultz: Argo Navis Technologies, LLC. Mike Mason, David Shrader: LANL Douglas Pase, Mahesh Rajan, Anthony Angelastos, Joel Stevenson: SNL Matt Legendre and Chris Chambreau: LLNL Dyninst group (Bart Miller: UW & Jeff Hollingsworth: UMD) Phil Roth: ORNL Koushik Ghosh: Engility Greg Scantlen, Andree Jacobson, Timothy Thomas: CreativeC
How to Analyze the Performance of Parallel Codes 101 - A Tutorial at SC'17 6
Presenters
11/13/2017
Outline Welcome
Concepts in performance analysis
Introduction into Tools and Open|SpeedShop
How to run basic timing experiments and what they can do?
How to deal with parallelism (MPI and threads)?
<LUNCH>
How to properly use hardware counters?
Slightly more advanced targets for analysis How to understand and optimize I/O activity? How to evaluate memory efficiency? How to analyze codes running on GPUs?
DIY and Conclusions: DIY and Future trends
Hands-on Exercises (after each section) On site cluster available We will provide exercises and test codes
7How to Analyze the Performance of Parallel Codes 101 - A Tutorial at SC’17
11/13/2017
Tutorial Survey
Tutorial surveys are entirely electronic this year No paper forms Tutorial attendees will receive an email reminder with the
evaluation information.
QR code: https://submissions.supercomputing.org/eval.png
Evaluation site URL: http://bit.ly/sc17-eval
Thanks for attending our tutorial!
How to Analyze the Performance of Parallel Codes 101 - A Tutorial at SC'17 8
Integrated tool kits Typically profiling and tracing Combined workflow Typically GUI/some vis. support Binary: Open|SpeedShop (Krell/TriLab) Source: TAU (U. of Oregon)
Specialized tools/techniques Libra (LLNL)
Load balance analysis Boxfish (LLNL/Utah/Davis)
3D visualization of torus networks Rubik (LLNL)
Node mapping on torus architectures
Vendor Tools
How to Analyze the Performance of Parallel Codes 101 - A Tutorial at SC'17 12
11/13/2017
How to Select a Tool? A tool with the right features
Must be easy to use Provides performance analysis of the code at different levels: libraries,
functions, loops, statements
A tool must match the application’s workflow Requirements from instrumentation technique
• Access to and knowledge about source code? Recompilation time?• Machine environments? Supported platforms?
Interactive and batch mode analysis options Support iterative tuning with ability to compare key metrics across runs
Why We Picked/Developed Open|SpeedShop? Sampling and tracing in a single framework Easy to use GUI & command line options for remote execution
• Low learning curve for end users Transparent instrumentation (preloading & binary)
• No need to recompile application
How to Analyze the Performance of Parallel Codes 101 - A Tutorial at SC'17 13
11/13/2017
Next Step: Interpret Data
Tools can collect lots of data At varying granularity At varying cost At varying accuracy
Issue 1: Understand yourtool and its limitations No tool can do everything
(at least not well) Choose the right tool for
the right task
Issue 2: Ask the right question Need to know basic issues to
look for to get started Need to understand expected behavior
How to Analyze the Performance of Parallel Codes 101 - A Tutorial at SC'17 14
11/13/2017
Issue 1: Tool Types
Data acquisition Event based data: triggered by explicit events
• Direct correlation possible, but may come in bursts Sampling based data: triggered by external events like timers
• Even distribution, but requires statistical analysis
Instrumentation Source code instrumentation: exact, but invasive Compiler instrumentation: requires source, but transparent Binary instrumentation: can be transparent, but still costly Link-level: transparent, less costly, but limited to APIs Tradeoff: invasiveness vs. overhead vs. ability to correlate Big question: granularity
Aggregation No aggregation: trace Aggregation over time and space: simplified profile Many shades of gray in between
How to Analyze the Performance of Parallel Codes 101 - A Tutorial at SC'17 15
11/13/2017
Issue 2: Asking the Right Questions
Step 1: Find where the problem actually is Where is the code spending time?
• Which code sections are even worth looking at?
Where should it spend time?• Have a (mental) model of your application
Use overview experiments Identify bottlenecks for your application
• Which resource in the system is holding you back?
Decide where to dig deeper• Important resource AND worth optimizing AND unexpected behavior
Pick the right tool or experiment in a tool Target the specific bottleneck Decide on instrumentation approach Decide on useful aggregation Understand impact on code perturbation
How to Analyze the Performance of Parallel Codes 101 - A Tutorial at SC'17 16
11/13/2017
Step 1: Identify computational intensive parts Where am I spending my time?
• Modules/Libraries• Loops• Statements• Functions
Is the time spent in the computational kernels? Does this match my intuition?
Impact of memory hierarchy Do I have excessive cache misses? How is my data locality? Impact of TLB misses?
External resources Is my I/O efficient? Time spent in system libraries?
17
What to Look For: Sequential Runs
CPU
L1 Cache
L2 Cache
Main Memory
Shared L3 Cache
How to Analyze the Performance of Parallel Codes 101 - A Tutorial at SC'17How to Analyze the Performance of Parallel Codes 101 - A Tutorial at SC'17
11/13/2017
What to Look For: Shared Memory
Shared memory model Single shared storage Accessible from any CPU
Common programming models Explicit threads (e.g., POSIX threads) OpenMP
Typical performance issues False cache sharing Excessive Synchronization Limited work per thread Threading overhead
Complications: NUMA Memory locality critical Thread:Memory assignments
How to Analyze the Performance of Parallel Codes 101 - A Tutorial at SC'17 18
CPU
L1
L2 Cache
Main Memory
CPU
L1
CPUCPU
CPU CPU
Mem.
Mem.
Mem.
Mem.
11/13/2017
Distributed Memory Model Sequential/shared memory nodes coupled by a network Only local memory access Data exchange using message passing (e.g., MPI)
Typical performance issues Load imbalance; Processes waiting for data Large fraction of time on collective operations Network and I/O contention Non-optimal process placement & binding
19
What to Look For: Message Passing
Memory
Node
Memory
Node
Memory
Application
MPI Library
NIC
How to Analyze the Performance of Parallel Codes 101 - A Tutorial at SC'17How to Analyze the Performance of Parallel Codes 101 - A Tutorial at SC'17
11/13/2017
What’s Next
Overview of Open|SpeedShop Help to understand demos and hands-on exercises
Basic questions Where am I spending my time? How to understand the context of this information?
Hardware/Resource utilization How to use hardware counters efficiently? How to turn this information into actionable insight?
Next step beyond the computational core How well is my I/O doing? How well am I utilizing memory? How can I understand the performance on accelerators?
How to Analyze the Performance of Parallel Codes 101 - A Tutorial at SC'17 20
11/13/2017
SC2017 Tutorial
How to Analyze the Performance of Parallel Codes 101 A case study with Open|SpeedShop
Section 2Introduction into Tools and Open|SpeedShop
11/13/2017
Open|SpeedShop Tool Set
Open Source Performance Analysis Tool Framework Most common performance analysis steps all in one tool Combines tracing and sampling techniques Extensible by plugins for data collection and representation Gathers and displays several types of performance information
Scalable Data Collection Instrumentation of unmodified application binaries New option for hierarchical online data aggregation
Supports a wide range of systems Extensively used and tested on a variety of Linux clusters Cray, Blue Gene, ARM, Power 8, Intel Phi, GPU support
How to Analyze the Performance of Parallel Codes 101 - A Tutorial at SC'17 22
11/13/2017
Classifying Open|SpeedShop
Offers both sampling and direct instrumentation Sampling for overview and hardware counter experiments
• Even and low overhead, overview information Direct instrumentation for more detailed experiments
• More in-depth information, but potentially bursty All instrumentation at link-time of runtime
Multiple direct instrumentation options API level instrumentation (e.g., I/O or memory) Loop analysis based on binary instrumentation techniques Programming model specific instrumentation (e.g., MPI or OpenMP)
Aggregation By default: aggregate profile data over time
• Example: intervals, functions, …• Full traces possible for some experiments (e.g.. MPI), but costly
For parallel experiments: by default aggregation over threads, processes, …• However, users can query per process/thread data
How to Analyze the Performance of Parallel Codes 101 - A Tutorial at SC'17 23
How to Analyze the Performance of Parallel Codes 101 - A Tutorial at SC'17 25
11/13/2017
Alternative Interfaces
Scripting language Immediate command interface O|SS interactive command line (CLI)
• openss -cli
Python module
How to Analyze the Performance of Parallel Codes 101 - A Tutorial at SC'17 26
Experiment Commands
expView
expCompare
expStatus
List Commands
list –v exp
list –v hosts
list –v src
Session Commands
setBreak
openGui
import openss
my_filename=openss.FileList("myprog.a.out")
my_exptype=openss.ExpTypeList("pcsamp")
my_id=openss.expCreate(my_filename,my_exptype)
openss.expGo()
My_metric_list = openss.MetricList("exclusive")
my_viewtype = openss.ViewTypeList("pcsamp”)
result = openss.expView(my_id,my_viewtype,my_metric_list)
11/13/2017
Central Concept: Experiments
Users pick experiments: What to measure and from which sources?
How to select, view, and analyze the resulting data?
Two main classes of performance data collection: Statistical Sampling
• Periodically interrupt execution and record location
• Useful to get an overview
• Low and uniform overhead
Event Tracing• Gather and store individual application events
• Provides detailed per event information
• Can lead to huge data volumes
O|SS can be extended with additional experiments
How to Analyze the Performance of Parallel Codes 101 - A Tutorial at SC'17 27
11/13/2017
Sampling Experiments in O|SS
PC Sampling (pcsamp) Record PC repeatedly at user defined time interval Low overhead overview of time distribution Good first step, lightweight overview
Call Path Profiling (usertime) PC Sampling and Call stacks for each sample Provides inclusive and exclusive timing data Use to find hot call paths, caller and callee relationships
Hardware Counters (hwc, hwctime, hwcsamp) Provides profile of hardware counter events like cache & TLB misses hwcsamp:
• Periodically sample to capture profile of the code against the chosen counter• Default events are PAPI_TOT_INS and PAPI_TOT_CYC
hwc, hwctime:• Sample a hardware counter till a certain number of events ( called threshold)
is recorded and get Call Stack• Default event is PAPI_TOT_CYC
How to Analyze the Performance of Parallel Codes 101 - A Tutorial at SC'17 28
11/13/2017
Tracing Experiments in O|SS
Input/Output Tracing (io, iot, iop) Record invocation of all POSIX I/O events Provides aggregate and individual timings Store function arguments and return code for each call (iot) Lightweight I/O profiling because not tracking individual call
details (iop)
MPI Tracing (mpi, mpit, mpip) Record invocation of all MPI routines Provides aggregate and individual timings Store function arguments and return code for each call (mpit) Lightweight MPI profiling because not tracking individual call
details (mpip)
How to Analyze the Performance of Parallel Codes 101 - A Tutorial at SC'17 29
11/13/2017
Tracing Experiments in O|SS
Memory Tracing (mem) Tracks potential memory allocation call that is not later
destroyed (leak). Records any memory allocation event that set a new high-water
of allocated memory current thread or process. Creates an event for each unique call path to a traced memory
call and records:• The total number of times this call path was followed• The max allocation size• The min allocation size• The total allocation• The total time spent in the call path• The start time for the first call
How to Analyze the Performance of Parallel Codes 101 - A Tutorial at SC'17 30
11/13/2017
Additional Experiments in OSS/CBTF
CUDA NVIDIA GPU Event Tracing (cuda) Record CUDA events, provides timeline and event timings Traces all NVIDIA CUDA kernel executions and the data transfers
between main memory and the GPU. Records the call sites, time spent, and data transfer sizes.
POSIX thread tracing (pthreads) Record invocation of all POSIX thread events Provides aggregate and individual rank, thread, or process
timings
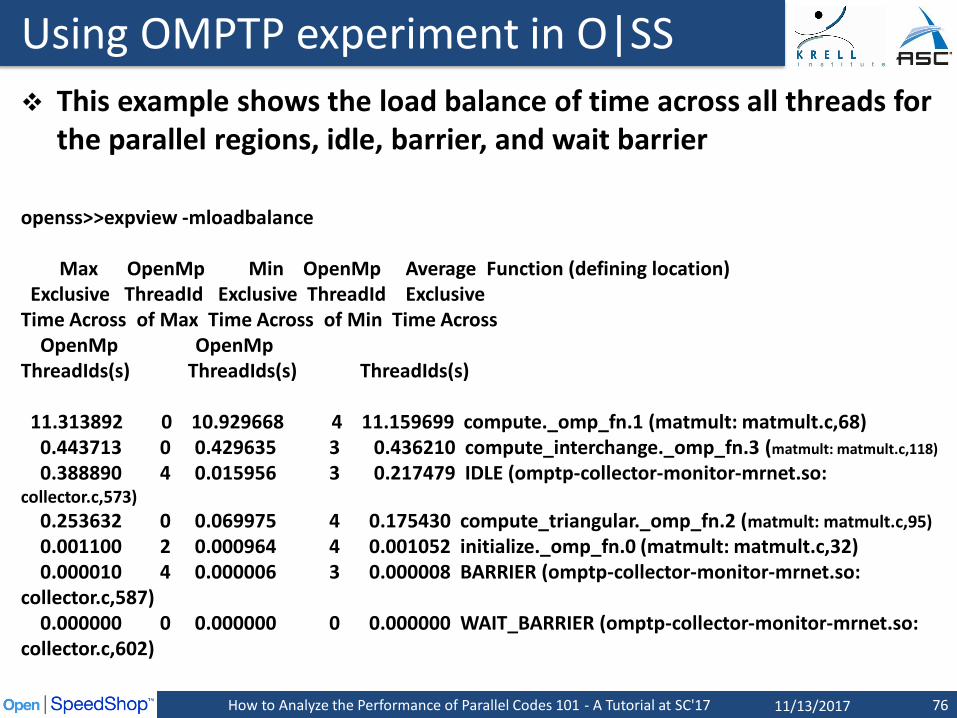
OpenMP specific profiling/tracing (omptp) Report task idle, barrier, and barrier wait times per OpenMP
thread and attribute those times to the OpenMP parallel regions.
31How to Analyze the Performance of Parallel Codes 101 - A Tutorial at SC'17
11/13/2017
Performance Analysis in Parallel
How to deal with concurrency? Any experiment can be applied to parallel application
• Important step: aggregation or selection of data
Special experiments targeting parallelism/synchronization
O|SS supports MPI and threaded codes Automatically applied to all tasks/threads Default views aggregate across all tasks/threads Data from individual tasks/threads available Thread support (incl. OpenMP) based on POSIX threads
Specific parallel experiments (e.g., MPI) Wraps MPI calls and reports
• MPI routine time• MPI routine parameter information
The mpit experiment also stores function arguments and return codes for each call
How to Analyze the Performance of Parallel Codes 101 - A Tutorial at SC'17 32
11/13/2017
How to Run a First Experiment in O|SS?
1. Picking the experiment What do I want to measure? We will start with pcsamp to get a first overview
2. Launching the application How do I control my application under O|SS? Enclose how you normally run your application in quotes osspcsamp “mpirun –np 4 smg2000 –n 50 50 50”
3. Storing the results O|SS will create a database Name: smg2000-pcsamp-0.openss
4. Exploring the gathered data How do I interpret the data? O|SS will print a default report Open the GUI to analyze data in detail (run: “openss”)
How to Analyze the Performance of Parallel Codes 101 - A Tutorial at SC'17 33
<SMG native output>…Final Relative Residual Norm = 1.774415e-07All Threads are finished. default view for ./smg2000-pcsamp-0.openss [openss]: The restored experiment identifier is: -x 1 Performance data spans 2.257689 seconds from 2016/11/09 13:33:33 to 2016/11/09 13:33:35
How to Analyze the Performance of Parallel Codes 101 - A Tutorial at SC'17 38
Double click to open source window
Use window controls to split/arrange windows
Selected performance data point
11/13/2017
Library (LinkedObject) View
39
Libraries in the application
Select LinkedObject View type and Click
on D-icon
Shows time spent in libraries. Can indicate
imbalance.
How to Analyze the Performance of Parallel Codes 101 - A Tutorial at SC'17
11/13/2017
Loop View
40
Statement number of start of loop.
Select LoopsView type and Click
on D-icon
Shows time spent in loops.
How to Analyze the Performance of Parallel Codes 101 - A Tutorial at SC'17
11/13/2017
Open|SpeedShop Basics
How to Analyze the Performance of Parallel Codes 101 - A Tutorial at SC'17 41
Place the way you run your application normally in quotes and pass it as an argument to osspcsamp, or any of the other experiment convenience scripts: ossio, ossmpi, etc. osspcsamp “srun –N 8 –n 64 ./mpi_application app_args”
Open|SpeedShop sends a summary profile to stdout
Open|SpeedShop creates a database file
Display alternative views of the data with the GUI via: openss –f <database file>
Display alternative views of the data with the CLI via: openss –cli –f <database file>
Start with pcsamp for overview of performance
Then, focus on performance issues with other experiments
11/13/2017
Hands-on Section 2: Basic Sampling Experiments
Login Info and Hands-on exercise
How to log into the tutorial computer system Login information will be distributed at this time. The “exercises” directory will be in your $HOME directory. Also can find these exercises at:
• www.openspeedshop.org/downloads
Top-level directory has file: EXERCISES that lists all the tutorial exercises and README file has general information.
A “docs” directory in your $HOME has OpenSpeedShop documentation and the updated tutorial slides.
Exercise is in the exercise directory: $HOME/exercises/loop_check
Consult README file in each of the directories for the instructions/guidance
How to Analyze the Performance of Parallel Codes 101 - A Tutorial at SC'17 42
How to Analyze the Performance of Parallel Codes 101 A case study with Open|SpeedShop
Section 3Basic timing experiments and their Pros/Cons
11/13/2017
Identifying Critical Regions
Flat Profile Overview
Profiles show computationally intensive code regions First views: Time spent per functions or per statements
Questions: Are those functions/statements expected? Do they match the computational kernels? Any runtime functions taking a lot of time?
Identify bottleneck components View the profile aggregated by shared objects Correct/expected modules? Impact of support and runtime libraries
44How to Analyze the Performance of Parallel Codes 101 - A Tutorial at SC'17
11/13/2017
Call path profiling & Comparisons
Call Path Profiling Take a sample: address inside a function
Call stack: series of program counter addresses (PCs)
Unwinding the stack is walking through those address and
recording that information for symbol resolution later.
Leaf function is at the end of the call stack list
Open|SpeedShop: experiment called usertime Time spent inside a routine vs. its children
Key view: butterfly
Comparisons Between experiments to study improvements/changes
Between ranks/threads to understand differences/outliers
45How to Analyze the Performance of Parallel Codes 101 - A Tutorial at SC'17
11/13/2017
Adding Context through Stack Traces
Function
A
46How to Analyze the Performance of Parallel Codes 101 - A Tutorial at SC'17
Function
B
Function
C
Function
D
Function
E
Missing information in flat profiles Distinguish routines called from
multiple callers Understand the call invocation
history Context for performance data
Critical technique: Stack traces Gather stack trace for each
performance sample Aggregate only samples with
equal trace
User perspective: Butterfly views
(caller/callee relationships) Hot call paths
• Paths through application that take most time
11/13/2017
Inclusive vs. Exclusive Timing
Function
A
47How to Analyze the Performance of Parallel Codes 101 - A Tutorial at SC'17
Function
B
Function
C
Function
D
Function
E
Stack traces enable calculation of inclusive/exclusive times Time spent inside a function
only (exclusive) • See: Function B
Time spent inside a function and its children (inclusive) • See Function C and children
Implementation similar to flat profiles Sample PC information Additionally collect call stack
information at every sample
Tradeoffs Pro: Obtain additional context
information Con: Higher overhead/lower
sampling rate
Inclusive Time for C
Exclusive Time for B
11/13/2017
Interpreting Call Context Data
Inclusive versus exclusive times If similar: child executions are insignificant
• May not be useful to profile below this layer If inclusive time significantly greater than exclusive time:
• Focus attention to the execution times of the children
Hotpath analysis Which paths takes the most time? Path time might be ok/expected, but could point to a problem
Butterfly analysis (similar to gprof) Should be done on “suspicious” functions
• Functions with large execution time• Functions with large difference between inclusive and exclusive time• Functions of interest• Functions that “take unexpectedly long”• …
Shows split of time in callees and callers
How to Analyze the Performance of Parallel Codes 101 - A Tutorial at SC'17 48
11/13/2017
Inclusive and Exclusive Time Profiles: Usertime
Basic syntax:
ossusertime “how you run your executable normally”
Examples:
ossusertime “smg2000 –n 50 50 50”
ossusertime “smg2000 –n 50 50 50” low
ParametersSampling frequency (samples per second)Alternative parameter: high (70) | low (18) | default (35)
Recommendation: compile code with –g to get statements!
How to Analyze the Performance of Parallel Codes 101 - A Tutorial at SC'17 49
11/13/2017
Reading Inclusive/Exclusive Timings
Default View Similar to pcsamp view from first example Calculates inclusive versus exclusive times
How to Analyze the Performance of Parallel Codes 101 - A Tutorial at SC'17 50
Exclusive Time
Inclusive Time
11/13/2017
Stack Trace Views: Hot Call Path
How to Analyze the Performance of Parallel Codes 101 - A Tutorial at SC'17 51
Access to call paths:• All call paths (C+)
• All call paths for
selected function (C)
Hot Call Path
11/13/2017
Stack Trace Views: Butterfly View
Similar to well known “gprof” tool
How to Analyze the Performance of Parallel Codes 101 - A Tutorial at SC'17 52
Pivot routine“hypre_SMGSolve”
Callers of “hypre_SMGSolve”
Callees of “hypre_SMGSolve”
11/13/2017
Comparing Performance Data
Key functionality for any performance analysis Absolute numbers often don’t help Need some kind of baseline / number to compare against
Typical examples Before/after optimization Different configurations or inputs Different ranks, processes or threads
Very limited support in most tools Manual operation after multiple runs Requires lining up profile data Even harder for traces
Open|SpeedShop has support to line up profiles Perform multiple experiments and create multiple databases Script to load all experiments and create multiple columns
How to Analyze the Performance of Parallel Codes 101 - A Tutorial at SC'17 53
11/13/2017
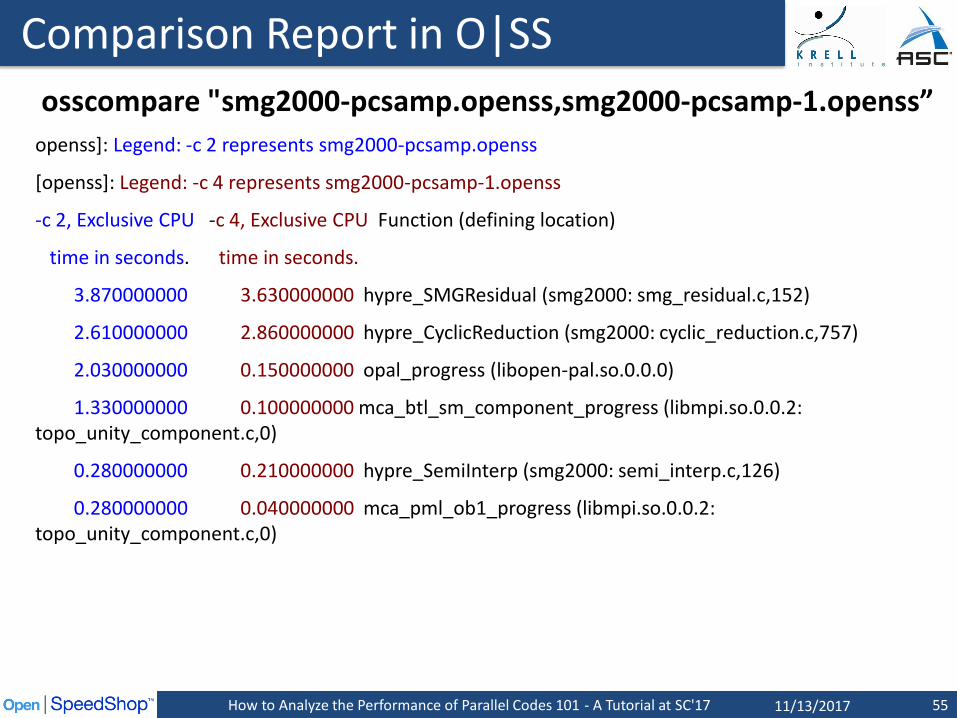
Comparing Performance Data in O|SS Convenience Script: osscompare
Compares Open|SpeedShop up to 8 databases to each other• Syntax: osscompare “db1.openss,db2.openss,…” [options]• osscompare man page has more details
Produces side-by-side comparison listing Data metric option parameter:
• Compare based on: time, percent, a hwc counter, etc.
Limit the number of lines by “rows=nn” option Specify the: viewtype=[functions|statements|linkedobjects]
• Control the view granularity. – Compare based on the function, statement, or library level. – By default the compare will be done comparing the performance of functions
in each of the databases. – If statements option is specified then all the comparisons will be made by
looking at the performance of each statement in all the databases that are specified.
– Similar for libraries, if linkedobject is selected as the viewtype parameter.
How to Analyze the Performance of Parallel Codes 101 - A Tutorial at SC'17 54
How to Analyze the Performance of Parallel Codes 101 - A Tutorial at SC'17 55
11/13/2017
Summary / Timing analysis
Typical starting point: Flat profile Aggregated information on where time is spent in a code Low and uniform overhead when implemented as sampling
Adding context From where was a routine called, which routine did it call Enables the calculation of exclusive and inclusive timing Technique: stack traces combined with sampling
Key analysis options Hot call paths that contains most execution time Butterfly view to show relations to parents/children
Comparative analysis Absolute numbers often carry little meaning Need the correct baseline, then compare against that
How to Analyze the Performance of Parallel Codes 101 - A Tutorial at SC'17 56
11/13/2017
Hands-on Section 3: Basic Sampling Experiments
Basic sampling application exercise Also comparing runs to each other
Exercises are in the exercise directory: $HOME/exercises/seq_lulesh/test
Consult README file in each of the directories for the instructions/guidance
How to Analyze the Performance of Parallel Codes 101 - A Tutorial at SC'17 57
11/13/2017
SC2017 Tutorial
How to Analyze the Performance of Parallel Codes 101 A case study with Open|SpeedShop
Section 4Analysis of parallel codes:
MPI, OpenMP, POSIX threads
11/13/2017
Parallel Application Performance Challenges
Architectures are Complex and Evolving Rapidly Changing multicore processor designs Emergence of accelerators (GPGPU, MIC, etc.) Multi-level memory hierarchy I/O storage sub-systems Increasing scale: number of processors, accelerators
Parallel processing adds more performance factors MPI communication time versus computation time Threading synchronization time versus computation time CPU time versus accelerator transfer and startup time tradeoffs I/O device multi-process contention issues Efficient memory referencing across processes/threads Changes in application performance due to adapting to new
architectures
How to Analyze the Performance of Parallel Codes 101 - A Tutorial at SC'17 59
11/13/2017
Parallel Execution Goals
Ideal scenario Efficient threading when using pthreads or OpenMP
• All threads are assigned work that can execute concurrently• Synchronization times are low.
Load balance for parallel jobs using MPI• All MPI ranks doing same amount of work, so no MPI rank waits
Hybrid application with both MPI and threads• Limited amount of serial work per MPI process
How to Analyze the Performance of Parallel Codes 101 - A Tutorial at SC'17 60
* Diagram from Performance Metrics for Parallel Programs: http://web.info.uvt.ro/~petcu/calcul/
11/13/2017
Parallel Execution Goals
What causes the ideal goal to fail? For MPI:
• Equal work was not given to each rank• There is an out of balance communication pattern occurring• The application can’t scale with the number of ranks being used
For threaded applications: • One or more threads doing more work than others and subsequently
causing other threads to wait.
For hybrid applications:• Too much time spent between parallel/threaded regions
For multicore processors:• Remote memory references from the non-uniform access shared
memory can cause sub-par performance
For accelerators:• Data transfers to the accelerator kernel might take more time than the
speed-up for the accelerator operations on that data - also - is the CPU fully utilized?
How to Analyze the Performance of Parallel Codes 101 - A Tutorial at SC'17 61
11/13/2017
Parallel Application Analysis Techniques
What steps can we take to analyze parallel jobs? Get an overview of where the time is being spent.
• Use sampling to get a low overhead overview of time spent– Program counter, call stack, hardware counter
Examine overview information for all ranks, threads, …• Analyze load balance information:
– Min, max, and average values across the ranks and/or threads– Look at this information per library as well
o Too much time in MPI could indicate load balance issue.
• Use above info to determine if the program is well balanced– Are the minimum, maximum values widely different? If so:
o Probably have load imbalance and need to look for the cause of performance lost because of the imbalance.
o Not all ranks or threads doing the same amount of worko Too much waiting at barriers or synchronous global operations
like MPI_Allreduce
How to Analyze the Performance of Parallel Codes 101 - A Tutorial at SC'17 62
11/13/2017
pcsamp Default View: NPB: LU Default Aggregated pcsamp Experiment View
How to Analyze the Performance of Parallel Codes 101 - A Tutorial at SC'17 63
Aggregated Results
Information Displays Experiment Metadata
11/13/2017
Load Balance View: NPB: LU
Load Balance View based on functions (pcsamp)
How to Analyze the Performance of Parallel Codes 101 - A Tutorial at SC'17 64
MPI library showing up high in the list
Max time in rank 255
With load balance view we are looking for performance number out of norm of what is expected,
such as relativelylarge differences between min, max
and/or average values.
11/13/2017
Default Linked Object View: NPB: LU
Default Aggregated View based on Linked Objects (libraries)
How to Analyze the Performance of Parallel Codes 101 - A Tutorial at SC'17 65
NOTE: Look at the MPI library time to get an idea of
the MPI overhead.
Linked Object View(library view)
Select “Linked Objects”
Click D-icon
11/13/2017
Parallel Execution Analysis Techniques
If imbalance detected, then what? How do you find the cause? Look at library time distribution across all the ranks,
threads• Is the MPI library taking a disproportionate amount of time?
If threaded (e.g. OpenMP), then look at the balance of time across worker threads.• For OpenMP look at idleness, barrier time, in addition to task times
If MPI application, use a tool that provides per MPI function call timings • Can look at MPI function time distributions
– In particular, MPI_Waitall– Then look at the call path to MPI_Waitall
• Also, can look source code relative to– MPI rank or particular pthread that is involved.– Is there any special processing for the particular rank or thread– Examine the call paths and check code along path
Use Cluster Analysis type feature, if tool has this capability• Cluster analysis can categorize threads or ranks that have similar
performance into groups identifying the outlier rank or thread
How to Analyze the Performance of Parallel Codes 101 - A Tutorial at SC'17 66
11/13/2017
Hot Call Paths View (CLI): NPB: LU Hot Call Paths for MPI_Wait for rank 255 onlyopenss –cli –f lu-mpi-256.openss
Exclusive MPI Call % of Total Number of Calls Call Stack Function (defining location) Time(ms)
>>>>main (lu.C.256)
>>>>> @ 140 in MAIN__ (lu.C.256: lu.f,46)
>>>>>> @ 180 in ssor_ (lu.C.256: ssor.f,4)
>>>>>>> @ 213 in rhs_ (lu.C.256: rhs.f,5)
>>>>>>>> @ 224 in exchange_3_ (lu.C.256: exchange_3.f,5)
>>>>>>>>> @ 893 in mpi_wait_ (mpi-mvapich-rt-offline.so: wrappers-fortran.c,893)
>>>>>>>>>> @ 889 in mpi_wait (mpi-mvapich-rt-offline.so: wrappers-fortran.c,885) 6010.978000 3.878405 250 >>>>>>>>>>> @ 51 in MPI_Wait (libmpich.so.1.0: wait.c,51)
>>>>main (lu.C.256) >>>>> @ 140 in MAIN__ (lu.C.256: lu.f,46)
>>>>>> @ 180 in ssor_ (lu.C.256: ssor.f,4)
>>>>>>> @ 64 in rhs_ (lu.C.256: rhs.f,5)
>>>>>>>> @ 88 in exchange_3_ (lu.C.256: exchange_3.f,5)
>>>>>>>>> @ 893 in mpi_wait_ (mpi-mvapich-rt-offline.so: wrappers-fortran.c,893)
>>>>>>>>>> @ 889 in mpi_wait (mpi-mvapich-rt-offline.so: wrappers-fortran.c,885) 2798.770000 1.805823 250 >>>>>>>>>>> @ 51 in MPI_Wait (libmpich.so.1.0: wait.c,51)
How to Analyze the Performance of Parallel Codes 101 - A Tutorial at SC'17 67
Most expensive call path to MPI_Wait
Show all call paths involving MPI_Wait
for rank 255 only
11/13/2017
Identifying Load Imbalance With O|SS
Get overview of application Run a lightweight experiment to verify performance expectations
• pcsamp, usertime, hwc
Use load balance view on pcsamp, usertime, hwc Look for performance values outside of norm
• Somewhat large difference for the min, max, average values• If the MPI libraries are showing up in the load balance for pcsamp, then do
an MPI specific experiment
Use load balance view on MPI experiment Look for performance values outside of norm
• Somewhat large difference for the min, max, average values
Focus on the MPI_Functions to find potential problems
Use load balance view on OpenMP experiment (omptp) Can also use expcompare across OpenMP threads
How to Analyze the Performance of Parallel Codes 101 - A Tutorial at SC'17 68
11/13/2017
Link. Obj. Load Balance: Using NPB: LU
Load Balance View based on Linked Objects (libraries)
How to Analyze the Performance of Parallel Codes 101 - A Tutorial at SC'17 69
Rank 255 has maximum MPI library time value& minimum LU time
11/13/2017
Using Cluster Analysis in O|SS
Can use with pcsamp, usertime, hwc Will group like performing ranks/threads into groups Groups may identify outlier groups of ranks/threads Can examine the performance of a member of the outlier group Can compare that member with member of acceptable
performing group
Can use with mpi, mpit, mpip Same functionality as above But, now focuses on the performance of individual
MPI_Functions. Key functions are MPI_Wait, MPI_WaitAll Can look at call paths to the key functions to analyze why they
are being called to find performance issues
How to Analyze the Performance of Parallel Codes 101 - A Tutorial at SC'17 70
11/13/2017
Link. Obj. Cluster Analysis: NPB: LU
Cluster Analysis View based on Linked Objects (libraries)
How to Analyze the Performance of Parallel Codes 101 - A Tutorial at SC'17 71
In Cluster Analysis resultsRank 255 showing up as an
outlier.
11/13/2017
MPI/OpenMP Specific Experiments
MPI specific experiments Record all MPI call invocations MPI functions are profiled (ossmpip)
• Show call paths for each MPI unique call path, but individual call information is not recorded.
• Less overhead than mpi, mpit.
MPI functions are traced (ossmpi)• Record call times and call paths for each event
MPI functions are traced with details (ossmpit)• Record call times, call paths and argument info for each event
OpenMP specific experiment (ossomptp) Uses OMPT API to record task time, idleness, barrier, and wait
barrier per OpenMP parallel region• Shows load balance for time• expcompare time across all threads
How to Analyze the Performance of Parallel Codes 101 - A Tutorial at SC'17 72
How to Analyze the Performance of Parallel Codes 101 - A Tutorial at SC'17 76
11/13/2017
Summary / Parallel Bottlenecks
Open|SpeedShop supports MPI, OpenMP, and threaded applications (including hybrid) Works with multiple MPI implementations
Parallel experiments Apply the sequential O|SS collectors to all nodes Specialized MPI profiling and tracing experiments Specialized OpenMP profiling experiment
Result Viewing Results are aggregated across ranks/processes/threads Optionally: select individual ranks/threads or groups Specialized views:
• Load balance view• Cluster analysis
Use features to isolate sections of problem code
How to Analyze the Performance of Parallel Codes 101 - A Tutorial at SC'17 77
11/13/2017
Hands-on Section 4: Going Parallel - MPI
Parallel related application exercise (MPI) More information at the tutorial
Exercises are in the exercise directory: $HOME/exercises/mpi_nbody Supplemental:
• $HOME/exercises/smg2000/test
Consult README file in each of the directories for the instructions/guidance
How to Analyze the Performance of Parallel Codes 101 - A Tutorial at SC'17 78
11/13/2017
Hands-on Section 4: Going Parallel - threading
Parallel related parallel application exercise (threading)
Exercises are in the exercise directory: $HOME/exercises/matmul Supplemental:
• $HOME/exercises/lulesh2.0.3
Parallel related application exercise (MPI)
Exercises are in the exercise directory: $HOME/exercises/mpi_nbody Supplemental:
• $HOME/exercises/smg2000/test
Consult README file in each of the directories for the instructions/guidance
How to Analyze the Performance of Parallel Codes 101 - A Tutorial at SC'17 79
11/13/2017
SC2017 Tutorial
How to Analyze the Performance of Parallel Codes 101 A case study with Open|SpeedShop
Identify architectural impact on code inefficiencies
Timing information shows where you spend your time Hot functions / statements / libraries Hot call paths
BUT: It doesn’t show you why Are the computationally intensive parts efficient? Are the processor architectural components working optimally?
Answer can be very platform dependent Bottlenecks may differ Cause of missing performance portability Need to tune to architectural parameters
Next: Investigate hardware/application interaction Efficient use of hardware resources or Micro-architectural
tuning Architectural units (on/off chip) that are stressed
81How to Analyze the Performance of Parallel Codes 101 - A Tutorial at SC'17
11/13/2017
Good Primary Focus: Efficient movement of data
Modern memory systems are complex Deep hierarchies Explicitly managed memory NUMA behavior Streaming/Prefetching
Key to performance: Data locality and Concurrency Accessing the same data repeatedly(Temporal) Accessing neighboring data(Spatial) Effective/parallel use of cores
Information to look for Load/Store Latencies Prefetch efficiency Cache miss rate at all levels TLB miss rates NUMA overheads
How to Analyze the Performance of Parallel Codes 101 - A Tutorial at SC'17 82
Data Location Access Latency, ns ( Sandy Bridge, 2.6GHZ)
L1 1.2
L2 3.5
L3 6.5
DRAM 28
11/13/2017
Another important focus: Efficient Vectorization
Newer processors have wide vector registers Intel Xeon 2670,Sandy Bridge: 256 bits floating point registers, AVX ( 8 Real
Key to performance: Vectorization Compiler Vectorization Use of ‘intrinsics’ Use of Pragmas to help the compiler Assembly code
Analysis Options Compiler vectorization report Look at assembly code Measure performance with PAPI counters
How to Analyze the Performance of Parallel Codes 101 - A Tutorial at SC'17 83
Going from Scalar to Intel® AVX can provide up to 8x faster performance
11/13/2017
Hardware Performance Counters
Architectural Features Typically/Mostly packaged inside the CPU Count hardware events transparently without overhead
Newer platforms also provide system counters Network cards and switches Environmental sensors
Drawbacks Availability differs between platform & processors Slight semantic differences between platforms In some cases : requires privileged access & kernel patches
Recommended: Access through PAPI API for tools + simple runtime tools Abstractions for system specific layers More information: http://icl.cs.utk.edu/papi/
How to Analyze the Performance of Parallel Codes 101 - A Tutorial at SC'17 84
11/13/2017
The O|SS HWC Experiments
Provides access to hardware counters Implemented on top of PAPI Access to PAPI and native counters Examples: cache misses, TLB misses, bus accesses
Basic model 1: Timer Based Sampling: HWCsamp Samples at set sampling rate for the chosen event Supports multiple counters Lower statistical accuracy Can be used to estimate good threshold for hwc/hwctime
Basic model 2: Thresholding: HWC and HWCtime User selects one counter Run until a fixed number of events have been reached Take PC sample at that location
• HWCtime also records stacktrace Reset number of events Ideal number of events (threshold) depends on application
How to Analyze the Performance of Parallel Codes 101 - A Tutorial at SC'17 85
11/13/2017
Examples of Typical Counters (Xeon E5-2670)
Note: Threshold indications are just rough guidance and depend on the application.
How to Analyze the Performance of Parallel Codes 101 - A Tutorial at SC'17 86
PAPI Name Description Threshold
PAPI_L1_DCM L1 data cache misses high
PAPI_L2_DCM L2 data cache misses high/medium
PAPI_L3_TCM L3 cache misses high
PAPI_TOT_INS Instructions completed high
PAPI_STL_ICY Cycles with no instruction issue high/medium
PAPI_BR_MSP Miss-predicted branches medium/low
PAPI_DP_OPS Number of 64-Bit floating point Vector OPS high
PAPI_LD_INS Number of load instructions high
PAPI_VEC_DP Number of vector/SIMD instructions – 64Bit high
PAPI_BR_INS Number of branch instructions low
PAPI_TLB_TL Number of TLB misses low
11/13/2017
Suggestions to Manage Complexity
The number of PAPI counters and their use can be overwhelming; Some guidance here with a few “Metric-Ratios”. Ratios derived from a combination of hardware events can
sometimes provide more useful information than raw metrics
Develop the ability to interpret Metric-Ratios with a focus on understanding: Instructions per cycle or cycles per instruction Floating point / Vectorization efficiency Cache behaviors; Long latency instruction impact Branch mispredictions Memory and resource access patterns Pipeline stalls
This presentation will illustrate with some examples of the use of Metric-Ratios
How to Analyze the Performance of Parallel Codes 101 - A Tutorial at SC'17 87
<PAPI_event_list>: Comma separated PAPI event list (Maximum of 6 events that can be combined)
<sampling_rate>:Integer value sampling rate
Use event count values to guide selection of thresholds for HWC, HWCtime experiments for deeper analysis
How to Analyze the Performance of Parallel Codes 101 - A Tutorial at SC'17 88
11/13/2017
Selecting the Counters & Sampling Rate
For osshwcsamp, Open|SpeedShop supports … Derived and Non derived PAPI presets
• All derived and non derived events reported by “papi_avail”• Also reported by running “osshwcsamp” with no arguments• Ability to sample up to six (6) counters at one time; before use test with
– papi_event_chooser PRESET <list of events>
• If a counter does not appear in the output, there may be a conflict in the hardware counters
All native events• Architecture specific (incl. naming)• Names listed in the PAPI documentation• Native events reported by “papi_native_avail”
Sampling rate depends on application Overhead vs. Accuracy
• Lower sampling rate causes less samples
How to Analyze the Performance of Parallel Codes 101 - A Tutorial at SC'17 89
11/13/2017
Useful Metric-Ratio 1: IPC Instructions Per Cycle(IPC) also referred to as
In the table below compiler optimization -O1 used to bring out differences in IPC based on stride used with different loop order;
If you use –O2 for this simple case compiler does the right transformations, permuting loop order and vectorizing to yield IPC = 3.594 ( jki order); This improves access to memory through cache.
Importance of stride through the data is illustrated with this simple example; Compiler may not always do the needed optimization. Use IPC values from functions and loops to understand efficiency of data access through your data structures.
How to Analyze the Performance of Parallel Codes 101 - A Tutorial at SC'17 90
Example matrix multiply; Triple do loop; (n1=n2=n3=1000)
code for loop order ‘ijk’; All vectors ‘double’
do i = 1, n1do j = 1, n3do k = 1, n2a(i,j) = a(i,j) + b(i,k) * c(k,j)
end doend do
end do
11/13/2017
BLAS Operations Illustrate impact of moving data A, B, C = nxn Matrices; x,y = nx1 Vectors; k = Scaler
Level Operation # Memory Refs or Ops
# Flops Flops/Ops Comments on Flops/Ops
1 y = kx + y 3n 2n 2/3 Achieved in Benchmarks
2 y = Ax + y n2 2n2 2 Achieved in Benchmarks
3 C = AB + C 4n2 2n3 n/2 Exceeds HW MAX
Use these Flops/Ops to understand how sections of your code relate to simple memory access patterns as typified by these BLAS operations
91How to Analyze the Performance of Parallel Codes 101 - A Tutorial at SC'17
11/13/2017
Useful Metric-Ratio 2: FloatOps/Cycle Traditionally PAPI_FP_INS/PAPI_TOT_CYC used to evaluate relative floating point density
For a number of reasons measuring and analyzing floating point performance on Intel Sandy Bridge and Ivy bridge must be done with care. See PAPI web site for full discussion. The reasons are: instruction mix - scalar instructions + vector (AVX, SSE) packed instructions, hyperthreading, turbo-mode and speculative execution.
The floating point counters have been disabled in the newer Intel Haswell cpu architecture On Sandy Bridge and Ivy Bridge PAPI_FP_INS is no longer an appropriate counter if loops are vectorized No single PAPI metric captures all floating point operations
We provide some guidance with useful PAPI Preset counters. Data from single-core Xeon E5-2670, Sandy Bridge. Double precision array operations for Blas1(daxpy), Blas2(dgemv) and Blas3(dgemm) are benchmarked. Matrix size=nxn; vector size=nx1 . Data array sizes are picked to force operations from DRAM memory
Table below shows measured PAPI counter data for a few counters and compares the measured FLOP/Ops against theoretical expectations.
PAPI_DP_OPS and PAPI_VEC_DP give similar values and these counter values correlate well with expected floating point operation counts for double precision.
How to Analyze the Performance of Parallel Codes 101 - A Tutorial at SC'17 92
Blas Operation n
Thererical mem refs or
OpsTheoretical
FLOPTheoretical FLOP/Ops
wall time, secs TOT_CYC TOT_INS FP_INS LD_INS SR_INS DP_OPS
For Intel Haswell FloatOps not available: Use IPC or CPI
We again provide some guidance with data from a single-core of a HaswellProcessor (Intel(R) Xeon(R) CPU E5-2698 v3 @ 2.30GHz)
Blas1, Blas2 and Blas3 kernels as in the previous slide are benchmarked. Matrix size=nxn; vector size=nx1 . Data array sizes are picked to force operations from DRAM memory
Table below shows measured PAPI counter data for a few counters and metric ratio IPC
When operating at peak performance, Haswell can retire 4 micro-ops/cycle
How to Analyze the Performance of Parallel Codes 101 - A Tutorial at SC'17 93
How to Analyze the Performance of Parallel Codes 101 - A Tutorial at SC'17 98
Flat hardware counter profile of a single hardware counter
event.Exclusive counts only
11/13/2017
Viewing hwctime Data
hwctime default view: Counter = L1 Data Cache Misses
How to Analyze the Performance of Parallel Codes 101 - A Tutorial at SC'17 99
Calling context hardware counter profile of a single hardware counter event.
Exclusive/Inclusive counts
11/13/2017
Example 1 on use of PAPI: LLNL Sparse Solver Benchmark AMG
On the other hand L3 Evictions for 1,2,4 PEs similarly decrease ‘near-perfect’ but dramatically increases to 100x at 8PEs and 170x at 16 PEs
L3 evictions are a good measure of memory bandwidth limited performance bottleneck at a node
General Memory BW limitation Remedies Blocking Remove false sharing for threaded codes
0 0.25 0.5 0.75 1 1.25
1
2
4
8
16
L3_CACHE_MISSES:ALL
0 50 100 150 200
1
2
4
8
16
L3_EVICTIONS:ALL
Normalized to 1 PE count; Counts are Avg. of PE values
0
2
4
6
8
10
12
14
16
0 2 4 6 8 10 12 14 16
Spee
du
p
# of Cores
AMG Intra Node Scaling
AMG Weak
AMG Strong
AMG Ideal
100How to Analyze the Performance of Parallel Codes 101 - A Tutorial at SC'17
Major reasons on-node scaling limitations Memory Bandwidth Shared L3 Cache
L3 cache miss for 1,2,4 Pes matches expectation for strong scaling Reduced data per PE L3 misses decreasing up to 4 PEs linearly.
11/13/2017
Example 2 on use of PAPI: False Cache-line sharing in OpenMP
! Cache line UnAlignedreal*4, dimension(100,100)::c,d!$OMP PARALLEL DO do i=1,100
do j=2, 100c(i,j) = c(i, j-1) + d(i,j)
enddoenddo!$OMP END PARALLEL DO
! Cache line Alignedreal*4, dimension(112,100)::c,d!$OMP DO SCHEDULE(STATIC, 16)do i=1,100
do j=2, 100c(i,j) = c(i, j-1) + d(i,j)
enddoenddo!$OMP END DO
Run Time L3_EVICTIONS:ALL L3_EVICTIONS:MODIFIED
Aligned 6.5e-03 9 3
UnAligned 2.4e-02 1583 1422
Perf. Penalty 3.7 175 474
Same computation, but careful attention to alignment and independent OMP parallel cache-line chunks can have big impact; L3_EVICTIONS a good measure;
How to Analyze the Performance of Parallel Codes 101 - A Tutorial at SC'17 101
11/13/2017
Hands-on Section 5: Architectural Details
Hardware counter experiments related exercises
Exercises are in the exercise directory: $HOME/exercises/soa_aos $HOME/exercises/matrix_multiply Supplemental exercises:
• $HOME/exercises/HPCCG-0.5 • $HOME/exercises/HPCCG-0.5_from_snl (no run just view)
Consult README file in each of the directories for the instructions/guidance
How to Analyze the Performance of Parallel Codes 101 - A Tutorial at SC'17 103
11/13/2017
SC2017 Tutorial
How to Analyze the Performance of Parallel Codes 101 A case study with Open|SpeedShop
Section 6Analysis of I/O
11/13/2017
Need for Understanding I/O
I/O could be significant percentage of execution time dependent upon: Checkpoint, analysis output, visualization & I/O frequencies I/O pattern in the application:
N-to-1, N-to-N; simultaneous writes or requests Nature of application:
data intensive, traditional HPC, out-of-core File system and Striping: NFS, Lustre, Panasas, and # of Object
Storage Targets (OSTs) I/O libraries: MPI-IO, hdf5, PLFS,… Other jobs stressing the I/O sub-systems
Obvious candidates to explore first while tuning: Use parallel file system Optimize for I/O pattern Match checkpoint I/O frequency to MTBI of the system Use appropriate libraries
How to Analyze the Performance of Parallel Codes 101 - A Tutorial at SC'17 105
11/13/2017
I/O Performance Example
Application: OOCORE benchmark from DOD HPCMO Out-of-core SCALAPACK benchmark from UTK Can be configured to be disk I/O intensive Characterizes a very important class of HPC application involving
the use of Method of Moments (MOM) formulation for investigating electromagnetics (e.g. Radar Cross Section, Antenna design)
Solves dense matrix equations by LU, QR or Cholesky factorization
“Benchmarking OOCORE, an Out-of-Core Matrix Solver,” Cable, S.B., D’Avezedo, E. SCALAPACK Team, University of Tennessee at Knoxville/U.S. Army Engineering and Development Center
How to Analyze the Performance of Parallel Codes 101 - A Tutorial at SC'17 106
11/13/2017
Why use this example?
Used by HPCMO to evaluate I/O system scalability
Out-of-core dense solver benchmarks demonstrate the importance of the following in performance analysis: I/O overhead minimization Matrix Multiply kernel – possible to achieve close to
peak performance of the machine if tuned well “Blocking” very important to tune for deep memory
hierarchies
How to Analyze the Performance of Parallel Codes 101 - A Tutorial at SC'17 107
11/13/2017
Use O|SS to measure and tune for I/OINPUT: testdriver.in
sum |xsol_i - x_i| = (3.332285336962339E-006,0.000000000000000E+000)
sum |xsol_i - x_i|/M = (1.074930753858819E-010,0.000000000000000E+000)
sum |xsol_i - x_i|/(M*eps) = (968211.548505533,0.000000000000000E+000)
From output of two separate runs using Lustre and NFS:LU Fact time with Lustre= 1842 secs; LU Fact time with NFS = 2655 secs 813 sec penalty ( more than 30% ) if you do not use parallel file
system like Lustre!
How to Analyze the Performance of Parallel Codes 101 - A Tutorial at SC'17 108
11/13/2017
NFS and Lustre O|SS Analysis (screen shot from NFS)
How to Analyze the Performance of Parallel Codes 101 - A Tutorial at SC'17 109
Min t (secs) Max t (secs) Avg t (secs) call Function
/ * Write a single restart file from many MPI processes */int write_restart (MPI_Comm comm /// MPI communicator, int num_cells /// number of cells on this process, double *cellv ) /// cell vector
{ int rank; // rank of this process within commint size; // size of commint tag; // for MPI_Send, MPI_Recvint baton; // for serializing I/OFILE *f; // file handle for restart file/ * Procedure: Get MPI parameters */MPI_Comm_rank (comm, &rank);MPI_Comm_size (comm, &size);tag = 4747;
if (rank == 0) {
/* Rank 0 create a fresh restart file,* and start the serial I/O;* write cell data, then pass the baton to rank 1 */
How to Analyze the Performance of Parallel Codes 101 - A Tutorial at SC'17 118
11/13/2017
Section Summary - I/O Tradeoffs
Avoid writing to one file from all MPI tasks If you need to, be sure to distinguish offsets for each PE at a stripe boundary,
and use Buffered I/O
If each process writes its own file, then the parallel file system attempts to load balance the Object Storage Targets (OSTs), taking advantage of the stripe characteristics
Metadata server overhead can often create severe I/O problems Minimize number of files accessed per PE and minimize each PE doing
operations like seek, open, close, stat that involve inode information
I/O time is usually not measured, even in applications that keep some function profile Open|SpeedShop can shed light on time spent in I/O using io, iot
experiments
How to Analyze the Performance of Parallel Codes 101 - A Tutorial at SC'17 119
11/13/2017
Hands-on Section 6: I/O Performance
I/O experiments related application exercise
Exercises are in the exercise directory: $HOME/exercises/IOR $HOME/exercises/ser_par_io
Consult README file in each of the directories for the instructions/guidance
How to Analyze the Performance of Parallel Codes 101 - A Tutorial at SC'17 120
11/13/2017
SC2017 Tutorial
How to Analyze the Performance of Parallel Codes 101 A case study with Open|SpeedShop
Section 7Analysis of Memory Usage
11/13/2017
Memory Hierarchy
Memory Hierarchy CPU registers and cache System RAM Online memory, such as disks, etc. Offline memory not physically connected to system https://en.wikipedia.org/wiki/Memory_hierarchy
What do we mean by memory? Memory an application requires from the system RAM Memory allocated on the heap by system calls, such as
malloc and friends
How to Analyze the Performance of Parallel Codes 101 - A Tutorial at SC'17 122
Supports sequential, mpi and threaded applications. No instrumentation needed in application. Traces system calls via wrappers
• malloc• calloc• realloc• free• memalign and posix_memalign
Provides metrics for Timeline of events that set an new high-water mark. List of event allocations (with calling context) to leaks. Overview of all unique callpaths to traced memory calls that provides
max and min allocation and count of calls on this path.
Example Usage ossmem "./lulesh2.0” ossmem "srun -N4 -n 64 ./sweep3d.mpi"
How to Analyze the Performance of Parallel Codes 101 - A Tutorial at SC'17 125
11/13/2017
O|SS Memory Experiment CLI commands
expview -vunique Show times, call counts per path, min,max bytes allocation, total
allocation to all unique paths to memory calls that the mem collector saw
expview -vleaked Show function view of allocations that were not released while the
mem collector was active
expview -vtrace,leaked Will show a timeline of any allocation calls that were not released
expview -vfullstack,leaked Display a full callpath to each unique leaked allocation
expview -v trace,highwater Is a timeline of mem calls that set a new high-water The last entry is the allocation call that the set the high-water for the
complete run Investigate the last calls in the timeline and look at allocations that
have the largest allocation size (size1,size2,etc) if your application is consuming lots of system ram
How to Analyze the Performance of Parallel Codes 101 - A Tutorial at SC'17 126
11/13/2017
O|SS Memory Experiment
Shows the last 8 allocation events that set the high water mark
openss>>expview -vtrace,highwater
Start Time(d:h:m:s) Event Size Size Ptr Return Value New Call Stack Function (defining location)Ids Arg1 Arg2 Arg Highwater
How to Analyze the Performance of Parallel Codes 101 - A Tutorial at SC'17 127
11/13/2017
O|SS Memory Experiment
The next slide shows the default view of all unique memory calls seen while the mem collector was active. This is an overview of the memory activity. The default is display is aggregated across all processes and threads. Can view specific processes or threads.
For all memory calls the following are displayed: The exclusive time and percent of exclusive time The number of times this memory function was called. The traced memory function name.
For allocation calls (e.g. malloc) the follow: The max and min allocation size seen. The number of times the that max or min was seen are
displayed. The total allocation size of all allocations.
How to Analyze the Performance of Parallel Codes 101 - A Tutorial at SC'17 128
11/13/2017
O|SS Memory Experiment (Unique Calls)
How to Analyze the Performance of Parallel Codes 101 - A Tutorial at SC'17 129
openss>>expview -vunique
Exclusive % of Number Min Min Max Max Total Function (defining location)(ms) Total of Request Requested Request Requested Bytes
In this example the sequential OpenMP version of lulesh was run under ossmem. The initial run detected 69 potential leaks of memory. Examining the calltrees using the cli command "expview -vfullstack,leaked -mtot_bytes" revealed that allocations from the Domain::Domain constructor where not later released in the Domain::~Domain destructor. After adding appropriate delete's in the destructor and rerunning ossmem, we observed a resolution of the leaks detected in the Domain class. The remaining leaks where minor and from system libraries.
Using the exprestore command to load in the initial database and the database from the second run, we can use the expcompare cli command to see the improvements. Below, database -x1 shows the initial run and -x2 shows the results from the run with the changes to address the leaks detected in the Domain class.
11/13/2017
Summary and Conclusions
Benefits of Memory Heap AnalysisDetect leaks Inefficient use of system memory Find potential OOM, paging, swapping conditionsDetermine memory footprint over lifetime of
application run
Observations of Memory Analysis Tools Less concerned with the time spent in memory calls Emphasis is placed on the relationship of allocation
calls to free calls. Can slow down and impact application while running
How to Analyze the Performance of Parallel Codes 101 - A Tutorial at SC'17 131
11/13/2017
Hands-on Section 7: Memory Analysis
Memory experiment related application exercise More information provided at the tutorial
Exercises are in the exercise directory in $HOME/exercises/matmul $HOME/exercises/lulesh2.0.3 $HOME/exercises/lulesh2.0.3-fixed
Look for the README file for instructions.
How to Analyze the Performance of Parallel Codes 101 - A Tutorial at SC'17 132
11/13/2017
SC2017 Tutorial
How to Analyze the Performance of Parallel Codes 101 A case study with Open|SpeedShop
Section 8Analysis of heterogeneous codes
11/13/2017
Emergence of HPC Heterogeneous Processing
Heterogeneous computing refers to systems that use more than one kind of processor.
What led to increased heterogeneous processing in HPC? Limits on ability to continue to scale processor frequencies Power consumption hitting realistic upper bound Programmability advances lead to more wide-spread, general
usage of graphics processing unit (GPU).
Advances in manycore, multi-core hardware technology (MIC)
Heterogeneous accelerator processing: (GPU, MIC) Data level parallelism (GPU)
• Vector units, SIMD execution
• Single instruction operates on multiple data items
Thread level parallelism (MIC)
• Multithreading, multi-core, manycore
How to Analyze the Performance of Parallel Codes 101 - A Tutorial at SC'17 134
11/13/2017
Overview: Most Notable Hardware Accelerators
GPU (Graphics Processing Unit) General-purpose computing on graphics processing units
(GPGPU) Solve problems of type: Single-instruction, multiple thread
(SIMT) model Vectors of data where each element of the vector can be
treated independently Offload model – where data is transferred into/out-of the GPU Program using CUDA/OpenCL language or use directive based
OpenACC
Intel MIC (Many Integrated Cores) Has a less specialized architecture than a GPU Can execute parallel code written for:
• Traditional programming models including POSIX threads, OpenMP Initially offload based (transfer data to and from co-processor) Now/future: programs to run natively
How to Analyze the Performance of Parallel Codes 101 - A Tutorial at SC'17 135
11/13/2017
GPGPU Accelerator
GPU versus CPU comparison
Different goals produce different designs GPU assumes work load is highly parallel CPU must be good at everything, parallel or not
CPU: minimize latency experienced by 1 thread Big on-chip caches Sophisticated control logic
GPU: maximize throughput of all threads # threads in flight limited by resources => lots of resources
(registers, bandwidth, etc.) Multi-threading can hide latency => skip the big caches Shared control logic across many threads
*based on NVIDIA presentation
How to Analyze the Performance of Parallel Codes 101 - A Tutorial at SC'17 136
11/13/2017
GPGPU Accelerator
Mixing GPU and CPU usage in applications
Data must be transferred to/from the CPU to the GPU in order for the GPU to operate on it and return the new values.*NVIDIA image
How to Analyze the Performance of Parallel Codes 101 - A Tutorial at SC'17 137
Multicore CPU Manycore GPU
11/13/2017
Heterogeneous Programming There are four main ways to use an accelerator
Explicit programming:• The programmer writes explicit instructions for the accelerator device to
execute as well as instructions for transferring data to and from the device (e.g. CUDA-C for GPUs or OpenMP+Cilk Plus for Phis). This method requires to most effort and knowledge from programmers because algorithms must be ported and optimized on the accelerator device.
Accelerator-specific pragmas/directives: • Accelerator code is automatically generated from your serial code by a
compiler (e.g. OpenACC, OpenMP 4.0). For many applications, adding a few lines of code (pragmas/directives) can result in good performance gains on the accelerator.
Accelerator-enabled libraries: • Only requires the use of the library, no explicit accelerator programming
is necessary once the library has been written. The programmer effort is similar to using a non-accelerator enabled scientific library.
Accelerator-aware applications: • These software packages have been programed by other
scientists/engineers/software developers to use accelerators and may require little or no programming for the end-user.
How to Analyze the Performance of Parallel Codes 101 - A Tutorial at SC'17 138
11/13/2017
Programming for GPGPU
Prominent models for programming the GPGPU
Augment current languages to access GPU strengths
NVIDIA CUDA Scalable parallel programming model Extensions to familiar C/C++ environment Heterogeneous serial-parallel computing Supports NVIDIA only
OpenCL (Open Computing Language) Open source, royalty-free Portable, can run on different types of devices Runs on AMD, Intel, and NVIDIA
OpenACC Provides directives (hint commands inserted into source) Directives tell the compiler where to create acceleration (GPU) code
without the user modifying or adapting the code.
How to Analyze the Performance of Parallel Codes 101 - A Tutorial at SC'17 139
11/13/2017
Optimal Heterogeneous Execution
GPGPU considerations for best performance?
How is the parallel scaling for the application overall?
Can you balance the GPU and CPU workload? Keep both the GPU and CPU busy for best performance
Is it profitable to send a piece of work to the GPU? What is the cost of the transfer of data to and from the GPU?
How much work is there to be done inside the GPU? Will the work to be done fully populate and keep the GPU processors busy Are there opportunities to chain together operations so the data can stay in the
GPU for multiple operations?
Is there a vectorization opportunity?
Intel MIC considerations for best performance?
Program should be heavily threaded
Parallel scaling should be high with an OpenMP version
How to Analyze the Performance of Parallel Codes 101 - A Tutorial at SC'17 140
11/13/2017
Accelerator Performance Monitoring
How can performance tools help optimize code?
Is profitable to send a piece of work to the GPU? Can tell you this by measuring the costs:
• Transferring data to and from the GPU• How much time is spent in the GPU versus the CPU
Is there a vectorization opportunity? Could measure the mathematical operations versus the vector
operations occurring in the application Experiment with compiler optimization levels, re-measure operations
and compare
How is the parallel scaling for the application overall? Use performance tool to get idea of real performance versus expected
parallel speed-up
Provide OpenMP programming model to source code insights Use OpenMP performance analysis to map performance issues to
source code
How to Analyze the Performance of Parallel Codes 101 - A Tutorial at SC'17 141
11/13/2017
Open|SpeedShop accelerator support
What performance info does Open|SpeedShop provide?
For GPGPU it reports information to help understand: Time spent in the GPU device Cost and size of data transferred to/from the GPU Balance of CPU versus GPU utilization Transfer of data between the host and device memory versus the execution
of computational kernels Performance of the internal computational kernel code running on the GPU
device
Open|SpeedShop is able to monitor CUDA scientific libraries because it operates on application binaries.
Support for CUDA based applications is provided by tracing actual CUDA events
OpenACC support is conditional on the CUDA RT.
How to Analyze the Performance of Parallel Codes 101 - A Tutorial at SC'17 142
11/13/2017
Open|SpeedShop accelerator support
What performance info does Open|SpeedShop provide?
For Intel MIC (non-offload model): Reports the same range of performance information that it
does for CPU based applications Open|SpeedShop will operate on MIC (co-processor KNC)
similar to targeted platforms where the compute node processer is different than the front-end node processor
Only non-offload support is in our current plans A specific OpenMP profiling experiment (omptp) has been
developed. Initial version is available now.• Will help to better support analysis of MIC based applications• OpenMP performance analysis key to understanding performance
How to Analyze the Performance of Parallel Codes 101 - A Tutorial at SC'17 143
11/13/2017
CUDA GUI View: Default CUDA view
How to Analyze the Performance of Parallel Codes 101 - A Tutorial at SC'17 144
Note: The left pane shows the executable and the nodes it ran on. In future, will effect views.Internal GPU activity is shown in thread t1 (GPU) graphic (shaded area)Red lines indicate data transfers, Green lines indication GPU kernel executionsSource panel displays source for metrics clicked on in the Metric pane.
11/13/2017
CUDA GUI View: All Events Trace
How to Analyze the Performance of Parallel Codes 101 - A Tutorial at SC'17 145
Note: The chronological list of data transfers and kernel executions in bottom pane.Duration of kernel execution and data transfer available.Internal GPU activity is shown thread t1 (GPU) graphic (shaded area)Red lines indicate data transfers, Green lines indication GPU kernel executions
11/13/2017
CUDA GUI View: Kernel Trace
How to Analyze the Performance of Parallel Codes 101 - A Tutorial at SC'17 146
Note: The chronological list of kernel executions with details is in bottom pane.Internal GPU activity is shown in thread t1 (GPU) graphic (shaded area)Red lines indicate data transfers, Green lines indication GPU kernel executions
11/13/2017
CUDA GUI View: Transfers Trace
How to Analyze the Performance of Parallel Codes 101 - A Tutorial at SC'17 147
Note: The chronological list of data transfers with details is in bottom pane.Internal GPU activity is shown in thread t1 (GPU) graphic (shaded area)Red lines indicate data transfers, Green lines indication GPU kernel executions
11/13/2017
CUDA GUI View: Timeline Zoom
How to Analyze the Performance of Parallel Codes 101 - A Tutorial at SC'17 148
Note: Here is a zoomed in view of the data transfer and kernel execution timelineRed lines indicate data transfers, Green lines indication GPU kernel executionsThe metric view is dependent on what is active in the timeline view.
11/13/2017
Open|SpeedShop CUDA CLI Viewsopenss>>expview [ -vExec ]
Exclusive % of Exclusive Function (defining location) Time (ms) Total Count
Tested on some large scale platforms IBM Blue Gene and Cray GPU and Intel Phi support available Available on many DOE/DOD systems in shared locations Ask your system administrator
156How to Analyze the Performance of Parallel Codes 101 - A Tutorial at SC'17
11/13/2017
How to Install Open|SpeedShop?
Most tools are complex pieces of software Low-level, platform specific pieces Complex dependencies Need for multiple versions, e.g., based on MPIs and compilers Open|SpeedShop is no exception
• In many cases even harder because of its transparency
Installation support Traditional installation mechanism
• Three parts of the installation– Krell Root – base packages– CBTF – Component based tool framework– O|SS client itself
• Install script Support for “spack” now available
Performance analysis critical on modern systems Complex architectures vs. complex applications Need to break black box behavior at multiple levels Lots of performance left on the table by default
Performance tools can help Open|SpeedShop as one comprehensive option Scalability of tools is important
• Performance problems often appear only at scale• We will see more and more online aggregation approaches• CBTF as one generic framework to implement such tools
Critical: Asking the right questions Comparing answers with good baselines or intuition Starting at a high level and iteratively digging deeper
How to Analyze the Performance of Parallel Codes 101 - A Tutorial at SC'17 161
11/13/2017
Questions vs. Experiments
Where do I spend my time? Flat profiles (pcsamp) Getting inclusive/exclusive timings with callstacks (usertime) Identifying hot callpaths (usertime + HP analysis)
How do I analyze cache performance? Measure memory performance using hardware counters (hwc) Compare to flat profiles (custom comparison) Compare multiple hardware counters (N x hwc, hwcsamp)
How to identify I/O problems? Study time spent in I/O routines (io) Compare runs under different scenarios (custom comparisons)
How do I find parallel inefficiencies? Study time spent in MPI routines (mpi) Look for load imbalance (LB view) and outliers (CA view)
How to Analyze the Performance of Parallel Codes 101 - A Tutorial at SC'17 162