How-to Guide SAP NetWeaver 2004s How To… Build Planning Application Workbooks in BI Integrated Planning Version 1.00 – September 2006 Applicable Releases: SAP NetWeaver 2004s (Business Information Management -Business Planning and Analytical Services)
Transcript
How-to Guide SAP NetWeaver 2004s
How To… Build Planning Application Workbooks in BI Integrated Planning Version 1.00 – September 2006 Applicable Releases: SAP NetWeaver 2004s (Business Information Management -Business Planning and Analytical Services)
contained in this document serves informational purposes only. National product specifications may vary. These materials are subject to change without notice. These materials are provided by SAP AG and its affiliated companies ("SAP Group") for informational purposes only, without representation or warranty of any kind, and SAP Group shall not be liable for errors or omissions with respect to the materials. The only warranties for SAP Group products and services are those that are set forth in the express warranty statements accompanying such products and services, if any. Nothing herein should be construed as constituting an additional warranty. These materials are provided “as is” without a warranty of any kind, either express or implied, including but not limited to, the implied warranties of merchantability, fitness for a particular purpose, or non-infringement. SAP shall not be liable for damages of any kind including without limitation direct, special, indirect, or consequential damages that may result from the use of these materials. SAP does not warrant the accuracy or completeness of the information, text, graphics, links or other items contained within these materials. SAP has no control over the information that you may access through the use of hot links contained in these materials and does not endorse your use of third party web pages nor provide any warranty whatsoever relating to third party web pages. SAP NetWeaver “How-to” Guides are intended to simplify the product implementation. While specific product features and procedures typically are explained in a practical business context, it is not implied that those features and procedures are the only approach in solving a specific business problem using SAP NetWeaver. Should you wish to receive additional information, clarification or support, please refer to SAP Consulting. Any software coding and/or code lines / strings (“Code”) included in this documentation are only examples and are not intended to be used in a productive system environment. The Code is only intended better explain and visualize the syntax and phrasing rules of certain coding. SAP does not warrant the correctness and completeness of the Code given herein, and SAP shall not be liable for errors or damages caused by the usage of the Code, except if such damages were caused by SAP intentionally or grossly negligent.
- 1 -
1 Scenario In SAP NetWeaver 2004s BI Integrated Planning you can build planning applications based on Microsoft Excel. You use the Business Explorer Analyzer (short BEx Analyzer) to create - and later run - planning applications in Microsoft Excel workbooks. These planning applications are composed using items like analysis grids, drop-down boxes, and buttons for executing various planning related tasks. Tasks can include for example saving data or executing planning functions or sequences. This paper describes how to build these planning applications.
2 Introduction For this how-to paper we assume that planning queries, planning functions and/or planning sequences are already configured in the Planning Modeler. Based on an existing planning model you can then start to build a planning application in Microsoft Excel. The tasks will include inserting an analysis grid, graphic, dropdown boxes and function buttons. These buttons allow users to save data, recalculate totals and formulas, execute planning functions or sequences, and others. Although in general the adding of buttons is straight forward, there are several options explained in detail in this paper.
- 2 -
3 The Step By Step Solution Prerequisites:
• You have a BI system on release SAP NetWeaver 2004s. • You have constructed a BEx planning query. • You have built a planning function or planning sequence in the planning modeler. • You have launched the SAP NetWeaver 2004s version of BEx Analyzer. • You have logged on to the BI system.
Assuming these prerequisite steps are complete you are now ready to begin building your planning application. This how-to paper will review the following steps for building a planning application:
3.1 Embed a planning query in the workbook 3.2 Inserting a graph based upon the planning query 3.3 Inserting a navigation pane for filtering query information 3.4 Inserting specialized filtering tools (dropdown boxes, radio buttons and
checkboxes). 3.5 Using buttons to execute planning functions and sequences
3.5.1 Inserting a button 3.5.2 General button properties 3.5.3 Button for validating planning values 3.5.4 Button for saving values 3.5.6 Button for executing a planning function 3.5.7 Button for executing a planning sequence 3.5.8 Passing variable values via a button 3.5.9 Executing multiple functions with one button
3.1 Embed a Planning Query in the Workbook In this step we will embed a query in our workbook. We will also perform some basic formatting of our workbook.
1. Launch the BEx Analyzer in the BI system which contains your planning query and planning function.
2. Open a new Excel workbook and select a cell in the Excel worksheet.
3. Press the ‘Insert Analysis Grid’ button on the Excel Design Toolbar.
- 3 -
4. A new graphic representing the planning query should now appear in your excel worksheet.
5. Click on the graphic in the Excel worksheet and choose ‘Properties.’ A new window titled ‘Analysis Grid Properties’ should open.
6. Press the ‘Create Data Provider’ button in the window. A new window will open allowing you to choose which planning query you want to work with.
7. Choose the planning query you wish to use and press ‘OK.’ This should close the ‘Create Data Provider Window.’
8. Press ‘OK.’ This should close the ‘Analysis Grid Properties’ window.
9. Note the size and shape of the graphic in your Excel worksheet may have changed. BEx will reformat the graphic’s area based upon your query design. If you do not want the area to resize, reopen the ‘Analysis Grid Properties’ for your query. Then go to the clipping tab and adjust the resizing options.
- 4 -
10. Now press the ‘Exit Design Mode’ button. The previous graphic should now be replaced by your query results.
3.2 Insert a Graph Based Upon the Planning Query 1. From the Excel Menu choose ‘Insert’
‘Chart.’
2. Choose the type chart you would like to use and press ‘Finish.’ Relocate your graph on the Excel worksheet as necessary.
3. Press the ‘Design Mode’ button in
the BEx Design toolbar.
4. Right click on the graphic representing your planning query and choose ‘Properties.’ The ‘Analysis Grid Properties’ window should appear.
5. Select the ‘Associated Charts’ tab
and place a check in the box to the left of the chart you just created.
6. Press ‘OK.’ The ‘Analysis Grid
Properties’ window should close.
- 5 -
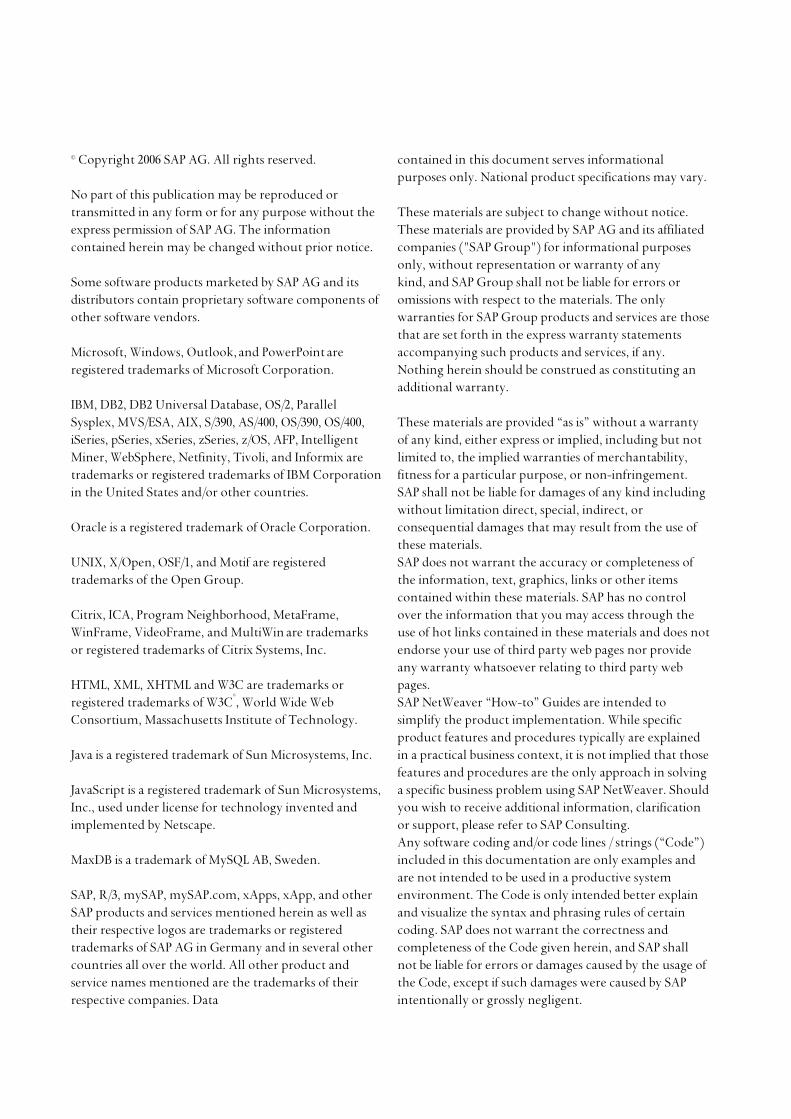
7. Press the ‘Exit Design Mode’ button. Your query results should now be displayed as well as a graphical representation of those results. You can then right click on your graphic and use standard Excel formatting to change the axis’s of the graphic or other formatting as necessary.
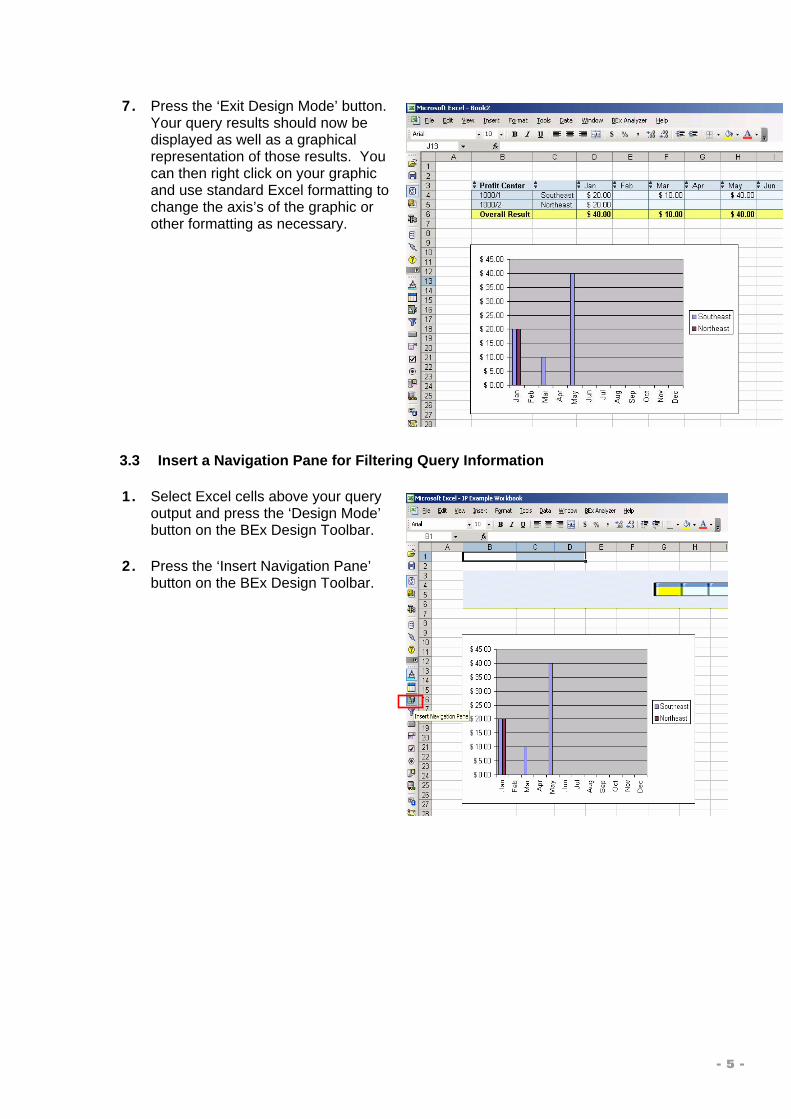
3.3 Insert a Navigation Pane for Filtering Query Information 1. Select Excel cells above your query
output and press the ‘Design Mode’ button on the BEx Design Toolbar.
2. Press the ‘Insert Navigation Pane’
button on the BEx Design Toolbar.
- 6 -
3. Click on the navigation pane icon inserted in the selected cells of your workbook. A new window titled ‘Navigation Pane Properties’ should appear.
4. In the dropdown box of the ‘Navigation Pane Properties’ window titled ‘Data Provider’ choose ‘DATA_PROVIDER_1’ and press ‘OK.’
5. Press the ‘Exit Design Mode’ button on the BEx Design Toolbar.
6. You have now inserted a navigation
area which users can utilize to filter their query results and/or drill down further into their plan data.
- 7 -
3.4 Inserting Specialized Navigation Tools (Dropdown Boxes, Radio Buttons and Checkboxes)
Rather than utilizing the navigation block described in the section above, some users prefer more guided navigation for filtering query results. This section describes how to insert a dropdown box for query navigation. The same procedure is applicable for radio buttons and checkboxes. 1. Select a cell above your query
results and press the ‘Design Mode’ button on the BEx Design Toolbar.
2. Press the ‘Insert Dropdown Box’
button on the BEx Design Toolbar.
3. Right click on the inserted dropdown
box and choose ‘Properties.’ This will launch the ‘Dropdown Box Properties’ window.
4. In this Window select
‘DATA_PROVIDER_1’ in the Data Provider dropdown box. This will link your dropdown box to your planning query.
- 8 -
5. On the ‘Dimensions’ Tab of the window in the Dimension dropdown box, select the characteristic the dropdown box will restrict.
6. In the Read Mode dropdown select
how the system will fill the dropdown box, based upon all values in the master data table, values in the cube dimensions, or posted values in the cube.
7. Choose the display options for the
text display of the characteristic in the left radio box, and the characteristic values in the box on the right.
8. Press ‘OK’ this should close the
‘Dropdown Box Properties’ window.
9. Press the ‘Exit Design Mode’ button on the BEx analyzer toolbar. The dropdown box should now appear above your planning query.
10. You can now select characteristic
values in your dropdown box and use that to filter your planning query results.
These steps can be repeated to create additional dropdown boxes if they are required for other characteristics in the planning query.
- 9 -
3.5 Using Buttons to Call Planning Functions and Planning Sequences
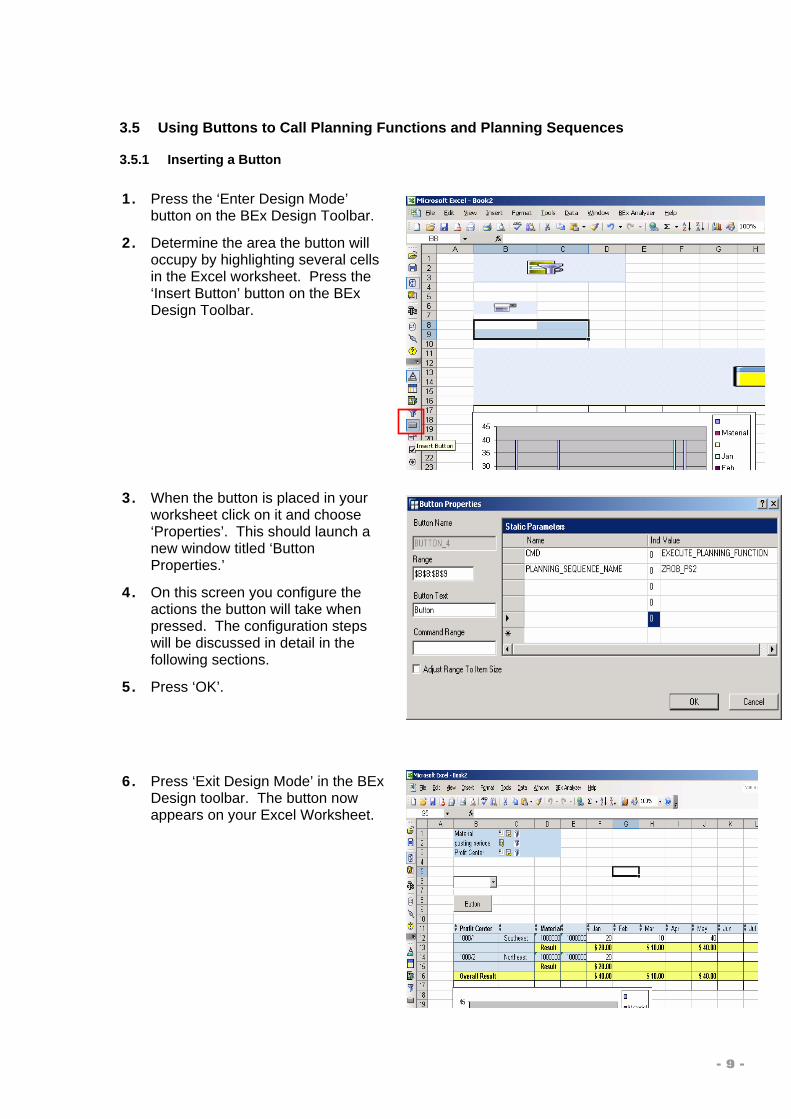
3.5.1 Inserting a Button 1. Press the ‘Enter Design Mode’
button on the BEx Design Toolbar.
2. Determine the area the button will occupy by highlighting several cells in the Excel worksheet. Press the ‘Insert Button’ button on the BEx Design Toolbar.
3. When the button is placed in your worksheet click on it and choose ‘Properties’. This should launch a new window titled ‘Button Properties.’
4. On this screen you configure the actions the button will take when pressed. The configuration steps will be discussed in detail in the following sections.
5. Press ‘OK’.
6. Press ‘Exit Design Mode’ in the BEx Design toolbar. The button now appears on your Excel Worksheet.
- 10 -
3.5.2 General Button Properties
1. Button Name: Technical identifier for a button item. The identifier is assigned by the system and can not be changed.
2. Range: Area within the worksheet the button will occupy. The range can be adjusted by dragging and resizing the button in the worksheet or by manually adjusting the range here.
3. Button Text: The text (caption) you want to display on the button. You can use this to describe the command the button executes.
4. Static Parameters –tell the button what to actually do when it is pressed. It contains the list of commands to be executed as well as any parameters necessary to execute those commands.
5. Command Range – Planning Functions/Sequences can utilize values from cells in the Excel worksheet in planning calculations (for example the user may input a growth percentage in Excel that IP uses in its calculations). The command range tells the function where to find those values in the Excel sheet. The range in the Excel sheet where the values are entered has the same structure as the Static Parameters: Name, Index, and Value. You must ensure the command range covers exactly the required number of rows and columns (always 3 columns!). Examples of different types of commands are found in the following sections.
Parameter Function Name Name of the command to be
executed
Index If a button contains multiple functions an index (starting with value 0) determines the order the functions are executed.
Value The value associated with the given command.
- 11 -
3.5.3 Button Properties for Validating Planning Values
Scenario – you would like to press a button to have the system validate user entered data against the backend. Additionally you would like to write data to the planning buffer and recalculate any calculated key figures in the planning query.
1. Enter ‘CMD’ in the Name column of the ‘Static Parameters’ and ‘CHECK_VALUES’ in the Value Column.
2. Enter ‘DATA_PROVIDER in the Name column and the data provider you would like to check in the Value column.
3.5.4 Button Properties for Saving Values
Scenario – you would like to press a button to have the system save the data into the Real-Time InfoProvider.
1. Enter ‘CMD’ in the Name column of the ‘Static Parameters’ and SAVE_AREA in the Value Column.
- 12 -
3.5.5 Button Properties for Executing Planning Functions
Scenario – you would like to press a button to have the system execute a planning function.
1. Enter CMD in the Name column of the Static Parameters and EXECUTE_PLANNING_FUNCTION in the Value Column.
2. Enter PLANNING_FUNCTION_NAME in the Name column and the technical name of the planning function you would like to execute in the value column.
3. To filter the data set the function executes against to ONLY the values found in your planning query enter DATA_PROVIDER_FILTER in the Name column and the data provider name in the Value column.
3.5.6 Button Properties for Executing Planning Sequences
Scenario – you would like to press a button to have the system execute a planning sequence.
1. Enter CMD in the Name column of the Static Parameters and EXECUTE_PLANNING_FUNCTION in the Value Column.
2. Enter PLANNING_FUNCTION_NAME in the Name column and the technical name of the planning sequence you would like to execute in the value column.
3. The sequence will always execute based on the data in the Planning Modeler Filter – the DATA_PROVIDER_FILTER setting seen in the previous example has no effect.
- 13 -
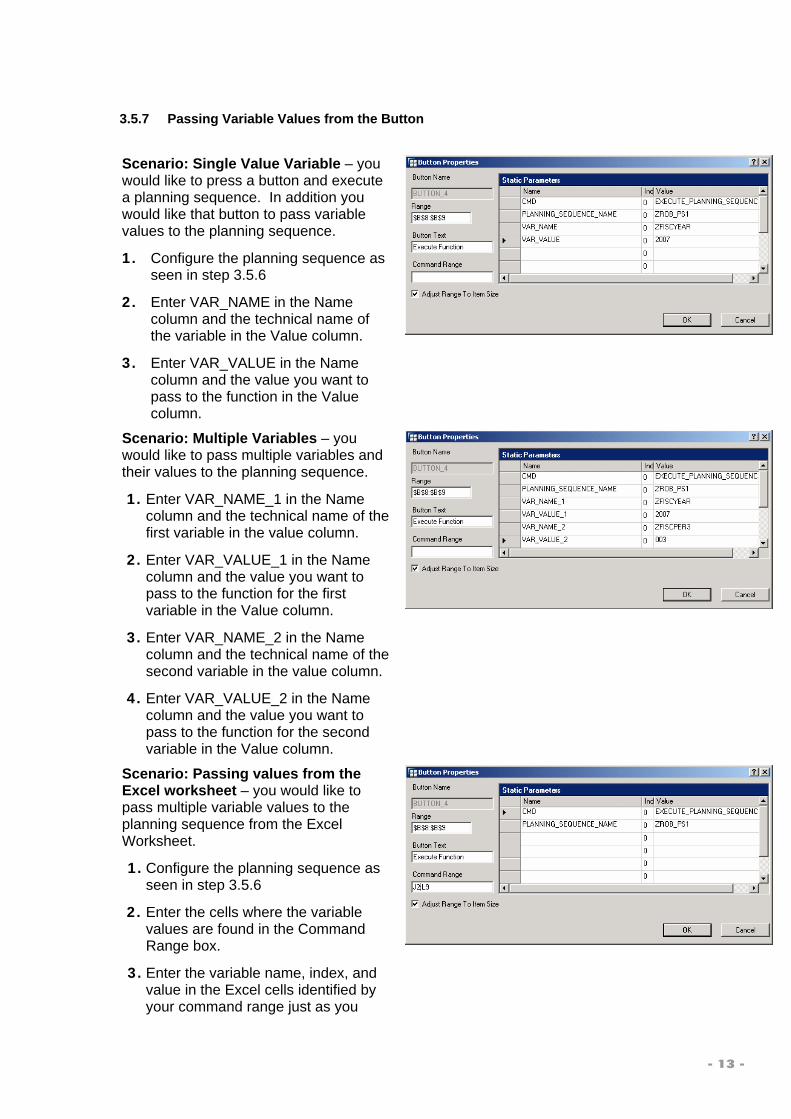
3.5.7 Passing Variable Values from the Button
Scenario: Single Value Variable – you would like to press a button and execute a planning sequence. In addition you would like that button to pass variable values to the planning sequence.
1. Configure the planning sequence as seen in step 3.5.6
2. Enter VAR_NAME in the Name column and the technical name of the variable in the Value column.
3. Enter VAR_VALUE in the Name column and the value you want to pass to the function in the Value column.
Scenario: Multiple Variables – you would like to pass multiple variables and their values to the planning sequence.
1. Enter VAR_NAME_1 in the Name column and the technical name of the first variable in the value column.
2. Enter VAR_VALUE_1 in the Name column and the value you want to pass to the function for the first variable in the Value column.
3. Enter VAR_NAME_2 in the Name column and the technical name of the second variable in the value column.
4. Enter VAR_VALUE_2 in the Name column and the value you want to pass to the function for the second variable in the Value column.
Scenario: Passing values from the Excel worksheet – you would like to pass multiple variable values to the planning sequence from the Excel Worksheet.
1. Configure the planning sequence as seen in step 3.5.6
2. Enter the cells where the variable values are found in the Command Range box.
3. Enter the variable name, index, and value in the Excel cells identified by your command range just as you
- 14 -
would in the static parameters window. In your Excel sheet you can hide these cells and use cell references to other cells for the variable values to provide a more user friendly appearance.
Note: in the example row 1 should not be included in the command range. It is there only for reference purposes.
Scenario: Range variable – you would like to pass a range of values for a single variable to the planning sequence.
1. Configure the planning sequence as seen in step 3.5.6
2. Enter VAR_NAME in the Name column and the technical name of the variable in the Value column.
3. Enter VAR_VALUE_LOW in the Name column and the lower end of the value range in the Value column.
4. Enter VAR_VALUE_HIGH in the Name column and the high end of the value range in the Value column.
Scenario: Multiple single value variable – you would like to pass multiple single values for a single variable to the planning sequence.
1. Configure the planning sequence as seen in step 3.5.6
2. Enter VAR_NAME in the Name column and the technical name of the variable in the value column.
3. Enter VAR_LINES in the Name column and the number of values to be passed in the Value column
4. Enter VAR_VALUE in the Name column and the first variable value in the Value column.
5. Enter VAR_VALUE in the Name column and the second variable value in the Value column, etc.
- 15 -
Scenario: Hierarchy node variable – you would like to pass a variable value for a hierarchy node to the planning sequence.
1. Configure the planning sequence as seen in step 3.5.6
2. Enter VAR_NAME in the Name column and the technical name of the variable in the value column.
3. Enter VAR_VALUE in the Name column and the variable value in the Value column.
4. Enter VAR_NODE_IOBJNM in the Name column and the InfoObject technical name in the Value Column.
Scenario: Multiple hierarchy node variable – you would like to pass multiple values for a hierarchy node variable to the planning sequence.
1. Configure the planning sequence as seen in step 3.5.6
2. Enter VAR_NAME in the Name column and the technical name of the variable in the value column.
3. Enter VAR_NODE_IOBJNM in the Name column and the InfoObject technical name in the Value Column.
4. Enter VAR_LINES in the Name column and the number of values to be passed in the Value column
5. Enter VAR_VALUE in the Name column and the first variable value in the Value column.
6. Enter VAR_VALUE in the Name column and the second variable value in the Value column, etc.
- 16 -
3.6 Executing Multiple Planning Functions and/or Sequences with One Button
Scenario – you would like to have a button call two or more planning functions and/or planning sequences when pressed. The following example is for multiple planning sequences.
1. Enter CMD in the Name column of the Static Parameters, the value 0 in the Index column, and EXECUTE_PLANNING_SEQUENCE in the Value Column.
2. Enter PLANNING_SEQUENCE_NAME in the Name column, the value 0 in the Index column, and the technical name of the planning sequence you would like to execute in the value column.
3. For the next planning sequence enter CMD in the Name column of the Static Parameters, the value 1 in the Index column, and EXECUTE_PLANNING_SEQUENCE in the Value Column.
4. Enter PLANNING_SEQUENCE_NAME in the Name column, the value 1 in the Index column, and the technical name of the second planning sequence you would like to execute in the value column.
Note: If variables are required to execute the planning functions/sequences ensure the variable entries contain the same index number as their corresponding planning function/sequence.