AMERICAN ASSOCIATION OF COLLEGES OF OSTEOPATHIC MEDICINE How to Change the Downward Trend in Family Medicine? What COMs Can Do Stephen C. Shannon, DO, MPH President and CEO, AACOM ACOFP Program Directors’ Workshop March 11, 2008 Denver, CO Photo courtesy of PCOM.
Transcript
AMERICAN ASSOCIATION OF COLLEGES OF OSTEOPATHIC MEDICINE
How to Change the Downward Trend in Family
Medicine?
What COMs Can Do
Stephen C. Shannon, DO, MPHPresident and CEO, AACOM
ACOFP Program Directors’ WorkshopMarch 11, 2008
Denver, CO
Photo courtesy of PCOM.
Overview of Presentation
Background:AACOMColleges of Osteopathic MedicinePhysician Workforce Issues
Recent Trends in Primary CareResidency Selection TrendsIssues Effecting Family MedicineWhat Can Be DonePersonal ThoughtsQuestions/Comments
Overview of Presentation
Background:AACOMColleges of Osteopathic MedicinePhysician Workforce Issues
Recent Trends in Primary CareResidency Selection TrendsIssues Effecting Family MedicineWhat Can Be DonePersonal ThoughtsQuestions/Comments
What is AACOM?
Founded in 1898 to lend support and assistance to osteopathic medical schools
Association of all of the nation’s accredited COMs
Governed by the Board of Deans (all colleges represented on the Board)
AACOM’s Mission
The American Association of Colleges of Osteopathic Medicinepromotes excellence in osteopathic medical education,
in research and in service,and fosters innovation and quality
among osteopathic collegesto improve the health of the American public.
Overview of Presentation
Background:AACOMColleges of Osteopathic MedicinePhysician Workforce Issues
Recent Trends in Primary CareResidency Selection TrendsIssues Effecting Family MedicineWhat Can Be DonePersonal ThoughtsQuestions/Comments
Osteopathic Medical Schools
Kansas City University of Medicine and Biosciences – College of Osteopathic Medicine (KCUMB-COM), MissouriLake Erie College of Osteopathic Medicine (LECOM), Pennsylvania
LECOM–Bradenton CampusLincoln Memorial University Debusk College of Osteopathic Medicine (LMU-DCOM), Harrogate, TennesseeNew York College of Osteopathic Medicine of New York Institute of Technology (NYCOM/NYIT)Nova Southeastern University –College of Osteopathic Medicine (NSU-COM), Florida
Private (19) Colleges of Osteopathic Medicine
A.T. Still University School of Osteopathic Medicine – Arizona (ATSU/SOMA)A.T. Still University of Health Sciences/Kirksville College of Osteopathic Medicine (ATSU/KCOM), MissouriArizona College of Osteopathic Medicine of Midwestern University (AZCOM)Chicago College of Osteopathic Medicine of Midwestern University (CCOM), IllinoisDes Moines University – College of Osteopathic Medicine (DMU-COM), Iowa
Osteopathic Medical Schools
Touro University College of Osteopathic Medicine (TUCOM-CA), California
TUCOM–Nevada CampusUniversity of New England College of Osteopathic Medicine (UNECOM), MaineEdward Via Virginia College of Osteopathic Medicine (VCOM)Western University College of Osteopathic Medicine of the Pacific (Western U/COMP), California
Private (19) Colleges of Osteopathic MedicinePacific Northwest University College of Osteopathic Medicine, Washington (PNWUCOM)Philadelphia College of Osteopathic Medicine (PCOM), Pennsylvania
Georgia Campus–PCOM Pikeville College School of Osteopathic Medicine (PCSOM), KentuckyRocky Vista University College of Osteopathic Medicine, Colorado (RCUCOM)Touro College of Osteopathic Medicine – New York (TOUROCOM)
Osteopathic Medical Schools
Michigan State University College of Osteopathic Medicine (MSUCOM)
Ohio University College of Osteopathic Medicine (OUCOM)
Oklahoma State University Center for Health Sciences – College of Osteopathic Medicine (OSU-COM)
University of Medicine and Dentistry of New Jersey – School of Osteopathic Medicine (UMDNJ-SOM)
University of North Texas Health Science Center at Fort Worth/Texas College of Osteopathic Medicine at Fort Worth (UNTHSC/TCOM)
West Virginia School of Osteopathic Medicine (WVSOM)
Public (6) Colleges of Osteopathic Medicine
Location of AACOM Members
Osteopathic Medicine’s Growth
In the last 25 years the number of osteopathic medical schools has grown from 14 to 25 colleges, with 3 branch campuses. The number of osteopathic college graduates has more than doubled to over 3,000. With existing schools’ planned growth, the number of DO graduates will grow to more than 5,000 by 2015.
First-Year Enrollment in Osteopathic Medical SchoolsExpected to Surpass 5,000 by 2012
Background:AACOMColleges of Osteopathic MedicinePhysician Workforce Issues
Recent Trends in Primary CareResidency Selection TrendsIssues Effecting Family MedicineWhat Can Be DonePersonal ThoughtsQuestions/Comments
Physician Workforce
Source: Sixteenth Report: Physician Workforce Policy Guidelines for the United States, 2000-2020 (January 2005), Council on Graduate Medical Education.
0
50000
100000
150000
200000
250000
under 35 35-44 45-54 55-64 65 and over
age
num
ber o
f phy
sici
ans
19852005
Adapted from a chart prepared by AAMC with data from AMA.Active physicians includes residents and fellows.1985 data excludes 24,000 DOs.
Physician Workforce
100
150
200
250
300
350
400
$0 $10,000 $20,000 $30,000 $40,000 $50,000
GDP per Capita (1996 dollars)
Act
ive
Phy
sici
ans
per 1
00,0
00 .
of P
opul
atio
n
1929
2000
Approx 2020-2025
Underlying TrendsThe demand for physicians results from
economic and population growth
Last shortage
Projected Demand
1980
Source: Richard Cooper, MD
100
150
200
250
300
350
400
$0 $10,000 $20,000 $30,000 $40,000 $50,000
GDP per Capita
Act
ive
Phy
sici
ans
per 1
00,0
00 .
of P
opul
atio
n
1929
2000 Projected Supply
But supply will not keep up with demand.
Approx 2020-2025
Projected Demand
Source: Richard Cooper, MD
And the “Effective Supply” will even be less.
100
150
200
250
300
350
400
$0 $10,000 $20,000 $30,000 $40,000 $50,000
GDP per Capita
Act
ive
Phy
sici
ans
per 1
00,0
00 .
of P
opul
atio
n
1929
2000
Effective SupplyAge
GenderLifestyle
Duty hoursCareer paths
Approx 2020-2025
Projected Supply
Projected Demand
Source: Richard Cooper, MD
We are in the early stages of a period of deepening physician shortages.
100
150
200
250
300
350
400
$0 $10,000 $20,000 $30,000 $40,000 $50,000
GDP per Capita
Act
ive
Phy
sici
ans
per 1
00,0
00 .
of P
opul
atio
n
1929
2000
Approx 2020-2025
Deficit=~200,000physicians
(~20%)
We are Here
Source: Richard Cooper, MD
Genesis of the Problem:Failure to Sustain Growth in GME
0
5,000
10,000
15,000
20,000
25,000
1950 1960 1970 1980 1990 2000
Total PGY-1 (ACGME + AOA)
MD Graduates
IMGs in PGY-1
DO Graduates
BBA of 1996
MD Schools, 1980
Source: Richard Cooper, MD
Had residency programs continued to expand after 1997at 500/year, the U.S. would not now be facing severe shortages.
200
250
300
350
400
1980 1990 2000 2010 2020
Year
Phys
icia
ns p
er 1
00,0
00 o
f pop
ulat
ion
.
Demand
Supply
Supply with + 500/year continuingafter 1997
No change
Source: Richard Cooper, MD
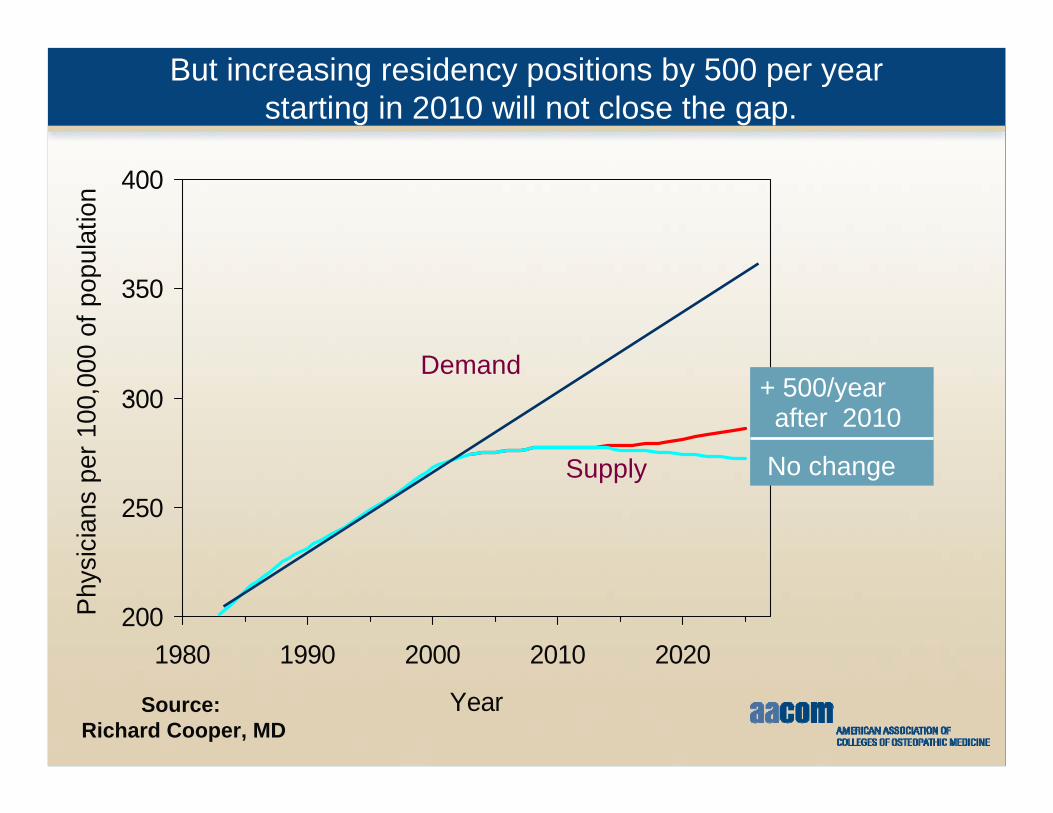
But increasing residency positions by 500 per yearstarting in 2010 will not close the gap.
200
250
300
350
400
1980 1990 2000 2010 2020
Year
Phys
icia
ns p
er 1
00,0
00 o
f pop
ulat
ion
.
Demand
Supply
+ 500/year after 2010
No change
Source: Richard Cooper, MD
Nor even will increasing residency positions by 10,000over ten years starting in 2010
200
250
300
350
400
1980 1990 2000 2010 2020
Year
Phy
sici
ans
per 1
00,0
00 o
f pop
ulat
ion
.
Demand
Supply
+1,000/year 2010-2020
No change
Source: Richard Cooper, MD
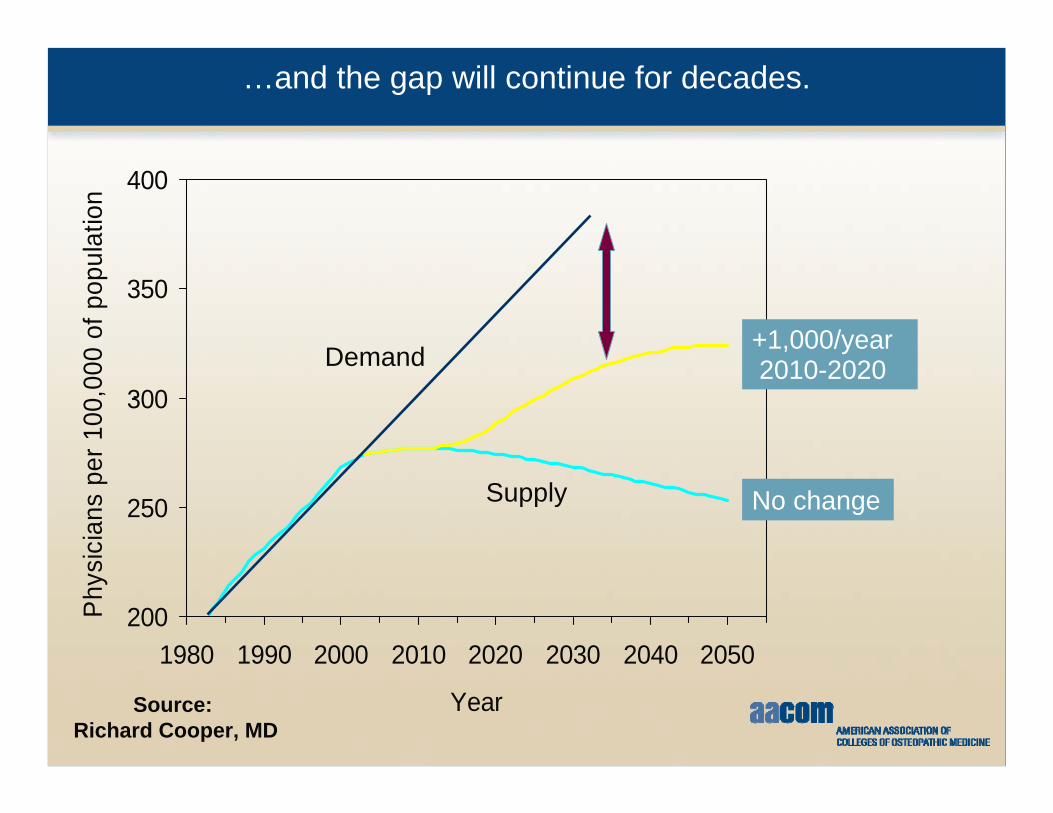
…and the gap will continue for decades.
200
250
300
350
400
1980 1990 2000 2010 2020 2030 2040 2050
Year
Phy
sici
ans
per 1
00,0
00 o
f pop
ulat
ion
.
Demand
Supply
+1,000/year 2010-2020
No change
Source: Richard Cooper, MD
Physician Workforce
Projections continue to show shortageOlder physicians likely to retire earlierYounger physicians (especially females) likely to perform less clinical careMD schools likely to grow near 20% over next 10-15 yearsIMGs continuing to increase (driven by U.S. IMGs)GME expansion not sufficient to handle DO/MD growthNumber of PAs/NPs growing rapidly
Physician Workforce
Physician Workforce
Overview of Presentation
Background:AACOMColleges of Osteopathic MedicinePhysician Workforce Issues
Recent Trends in Primary CareResidency Selection TrendsIssues Effecting Family MedicineWhat Can Be DonePersonal ThoughtsQuestions/Comments
Crisis in Primary Care
Volume 355:861-864 August 31, 2006 Number 9
Primary Care — Will It Survive?Thomas Bodenheimer, M.D.
Third-Year IM Residents Choosing Career as Generalists, Subspecialists and Hospitalists (Bodenheimer, NEJM: 355, 861-864)
Clinically Active PAs Have Nearly Tripledin the last 15 Years (in thousands)
Source: American Academy of Physician Assistantsand AAMC
Over Last 15 Years, Percentage of PAs Going into Generalist Specialties Decreased While Sub-specialists Increased
Source: American Academy of Physician Assistantsand AAMC
The Number of Licensed NPs Increased by 80 Percent Between 1999 and 2006
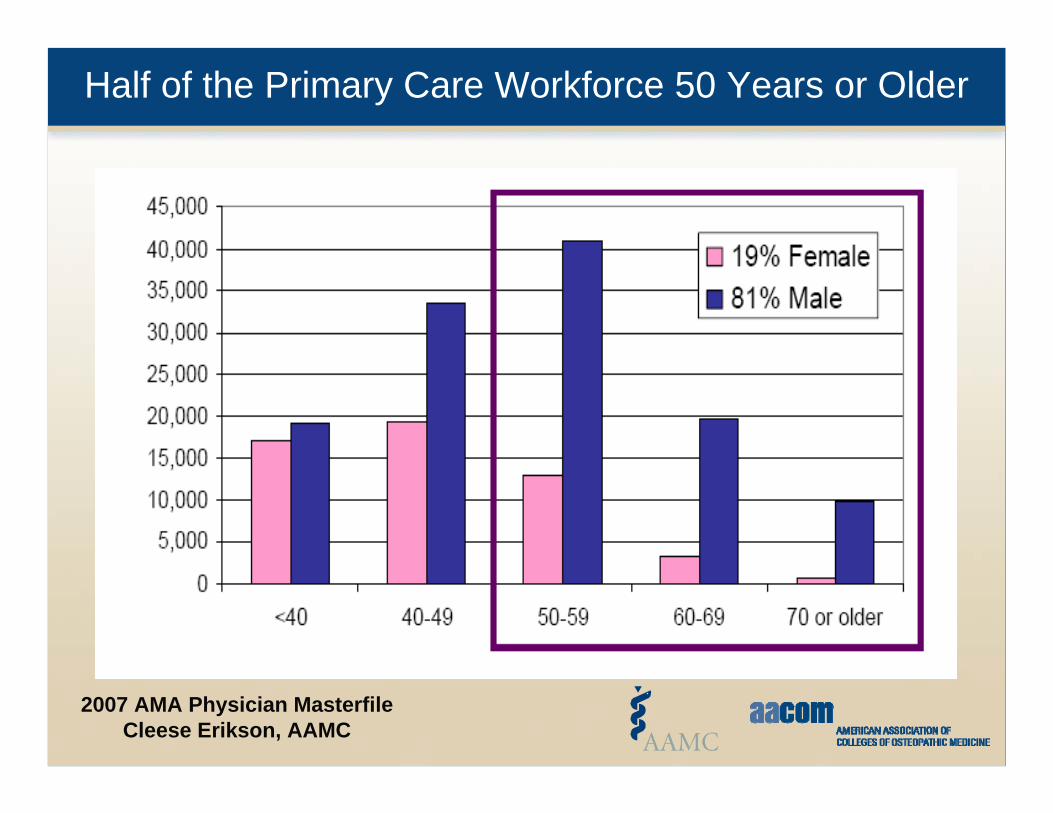
Half of the Primary Care Workforce 50 Years or Older
Background:AACOMColleges of Osteopathic MedicinePhysician Workforce Issues
Recent Trends in Primary CareResidency Selection TrendsIssues Effecting Family MedicineWhat Can Be DonePersonal ThoughtsQuestions/Comments
Number and Source of Physicians Entering GME Training in 2004
Other+144 (0.6%)US IMGs
1,300 (5%)
Non-US IMGs 4,713 (20%)
Allopathic Graduates
15,099 (64%)
24,012 Entered MD and DO Training in 2004
* Total IMGs = 6,013; Distribution among US and Non-US IMGs is estimated.+ Includes Canadian Graduates (72) Source: AAMC GMETrack and AOA Master File
Osteopathic Graduates in MD Programs1,471 (6%)
Osteopathic Graduates in DO Programs 1,285 (5%)
Osteopathic Graduates 2,756 (11%)
IMGs6,013 (25%)
Family Medicine Residency Positions and Number Filledby U.S. Medical School Graduates (Bodenheimer, NEJM: 355, 861-864)
DOs in Training - AOA and ACGME Comparison
0
1000
2000
3000
4000
5000
6000
7000
96-97
97-98
98-99
99-00
00-01
01-02
02-03
03-04
04-05
05-06
DOs in ACGME
COM Grads
DOs in AOA I/R
DOs in AOAInternshipDOs in AOAResidency
DOs and Graduate Medical Education
GME Issues
Less than half of DO graduates entering osteopathic match
Declining percentage of DOs entering osteopathic primary care programs
Declining number of DOs choosing primary care programs, ACGME or AOA
AOA Match Results (2008 prescramble)
Family Medicine
Matched: 244 44%Positions: 554
All AOA Positions
Matched: 1353 59%Positions: 2312
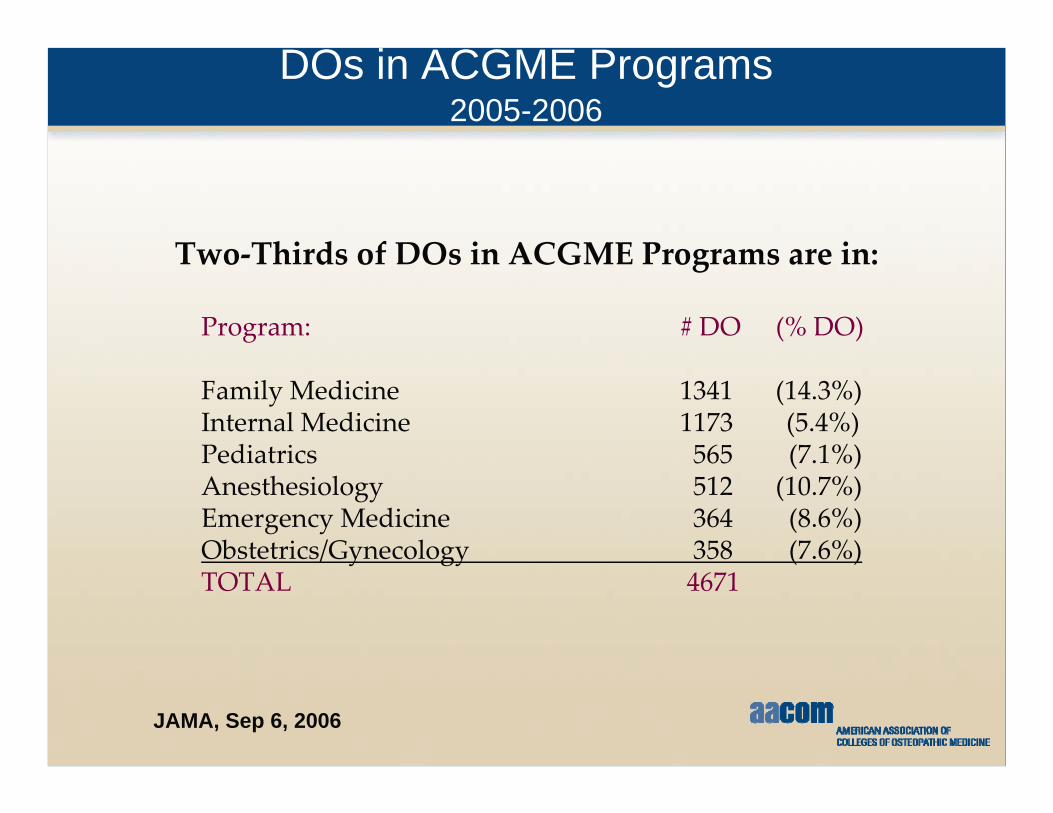
DOs in ACGME Programs2005-2006
Two‐Thirds of DOs in ACGME Programs are in:
Program: # DO (% DO)
Family Medicine 1341 (14.3%)Internal Medicine 1173 (5.4%)Pediatrics 565 (7.1%)Anesthesiology 512 (10.7%)Emergency Medicine 364 (8.6%)Obstetrics/Gynecology 358 (7.6%)TOTAL 4671
Background:AACOMColleges of Osteopathic MedicinePhysician Workforce Issues
Recent Trends in Primary CareResidency Selection TrendsIssues Effecting Family MedicineWhat Can Be DonePersonal ThoughtsQuestions/Comments
DO Practice Specialties (Source AOA)
DO Practice Specialties (Source AOA)
DOs in ACGME Programs2005-2006
Two‐Thirds of DOs in ACGME Programs are in:
Program: # DO (% DO)
Family Medicine 1341 (14.3%)Internal Medicine 1173 (5.4%)Pediatrics 565 (7.1%)Anesthesiology 512 (10.7%)Emergency Medicine 364 (8.6%)Obstetrics/Gynecology 358 (7.6%)TOTAL 4671