66
How to Make SQL Server Go Faster
| Date post: | 22-Jan-2018 |
| Category: |
Technology |
| Upload: | brent-ozar |
| View: | 919 times |
| Download: | 1 times |

How to Make SQL Server Go Faster

© kCura LLC. All rights reserved.
Brent
Ozar

© kCura LLC. All rights reserved.
BrentOzar.com/go/fest2016

© kCura LLC. All rights reserved.
Pop quiz:
how fast is a “fast” car?

How hard is the engine working?How fast are we going?

0-60 time HP
VW Golf 7.8 170

How much weight are we carrying?

How much weight are we carrying?

0-60 time HP Weight,
KG
VW Golf 7.8 170 1,400
BMW X6 6.0 300 2,400

“We need to go faster.”

0-60 time HP Weight,
KG
VW Golf 7.8 170 1,400
VW GTI 5.8 220 1,400
BMW X6 6.0 300 2,400
BMW X6 M 3.9 555 2,400

“We need to go even faster.”

Bigger gains require bigger changes.

Some compromises may be required.

0-60 time HP Weight,
KG
VW Golf 7.8 170 1,400
VW GTI 5.8 220 1,400
BMW X6 6.0 300 2,400
BMW X6 M 3.9 555 2,400
2007 Ariel Atom 3.0 245 650

© kCura LLC. All rights reserved.
To be a tuner,
you have to know your metrics.

© kCura LLC. All rights reserved.
• How much weight are we carrying around?
• How fast are can we get to 60mph?
• What bottleneck can we fix to go faster?
(Insufficient power, not enough grip, bad aerodynamics, etc.)
The 3 performance metrics

© kCura LLC. All rights reserved.
Pop quiz:
how fast is a “fast”
SQL Server?

© kCura LLC. All rights reserved.
Many of us have no idea.

© kCura LLC. All rights reserved.
• How much weight are we carrying?
• How fast are we going?
• How hard are we working to achieve that speed?
It’s time to get some answers.

© kCura LLC. All rights reserved.
• Rough guess: size of MDF/NDF data files on the server
• More accurate: used space in files. For each user database:
SELECT SUM(size)FROM sys.database_filesWHERE type = 0;
• Over time for the past: backup sizes in msdb.dbo.backupfile
• In Relativity environments, chart the number of databases too
Total data size in GB/TB

© kCura LLC. All rights reserved.
• How much weight are we carrying?
Total data size in GB/TB,
and number of DBs.
• How fast are we going?:
• How hard are we working to achieve that speed?
It’s time to get some answers.

© kCura LLC. All rights reserved.
• Perfmon - SQLServer: SQL Statistics – Batch Requests/sec
• Not Transactions/sec
• Trend on an hourly basis and break it out by:
– Weekday vs weekend
– Business hours vs after hours
– Maintenance windows
(backups, DB maintenance)
How fast is your server going?

© kCura LLC. All rights reserved.
• Going up? More users, more API calls, new functionality in the
application
• Going down? Less users or API calls, or code has been
streamlined so more work is done in less queries
When Batch Requests/Sec changes

© kCura LLC. All rights reserved.
• 0 – 1,000 – easy to handle with commodity hardware.
• 1,000-5,000 – be careful, because one bad change to a
query can knock a commodity server over.
• 5,000-25,000 – if you’re growing, you should be making a
scale-out or caching plan.
• Over 25,000 – doable, but attention.
Batch Requests/Sec seen in the field

© kCura LLC. All rights reserved.
• How much weight are we carrying?
Total data size in GB/TB,
and number of DBs.
• How fast are we going?:
Batch Requests per second.
• How hard are we working to achieve that speed?
It’s time to get some answers.

© kCura LLC. All rights reserved.
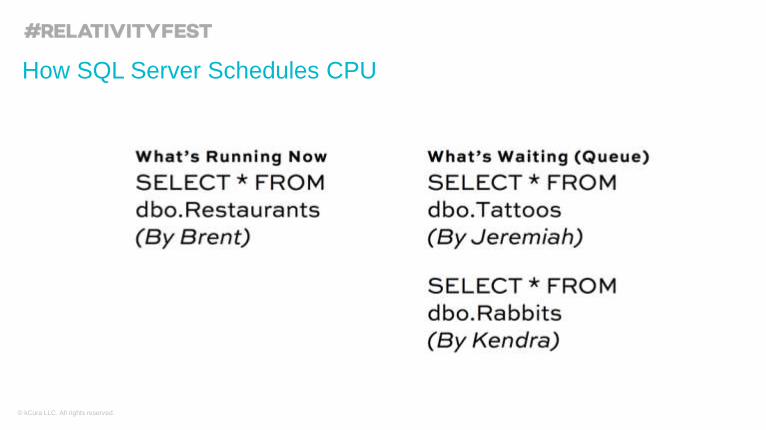
How SQL Server Schedules CPU

© kCura LLC. All rights reserved.
How SQL Server Schedules CPU
© kCura LLC. All rights reserved.
How SQL Server Schedules CPU

© kCura LLC. All rights reserved.
How SQL Server Schedules CPU

© kCura LLC. All rights reserved.
How SQL Server Schedules CPU
© kCura LLC. All rights reserved.
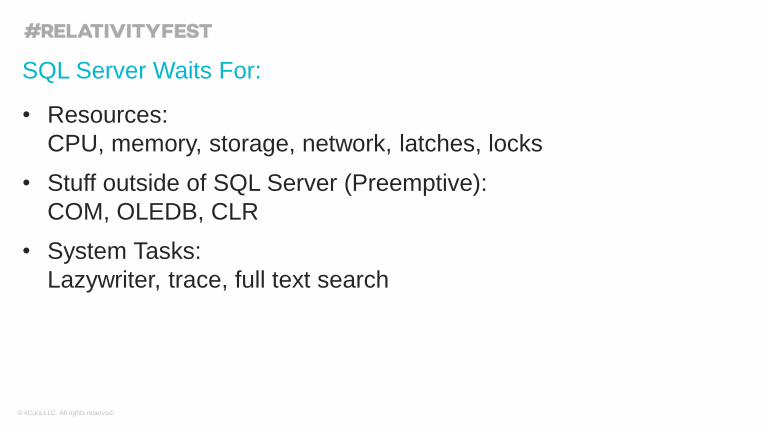
• Resources:
CPU, memory, storage, network, latches, locks
• Stuff outside of SQL Server (Preemptive):
COM, OLEDB, CLR
• System Tasks:
Lazywriter, trace, full text search
SQL Server Waits For:

© kCura LLC. All rights reserved.
Is this SQL Server working hard?

© kCura LLC. All rights reserved.
What about this one?

© kCura LLC. All rights reserved.
Or this one?

© kCura LLC. All rights reserved.
Some queries are simple

© kCura LLC. All rights reserved.
Some queries have a lot going on

© kCura LLC. All rights reserved.
These were simple little queries

© kCura LLC. All rights reserved.
But one real-world query usually looks more like this
© kCura LLC. All rights reserved.
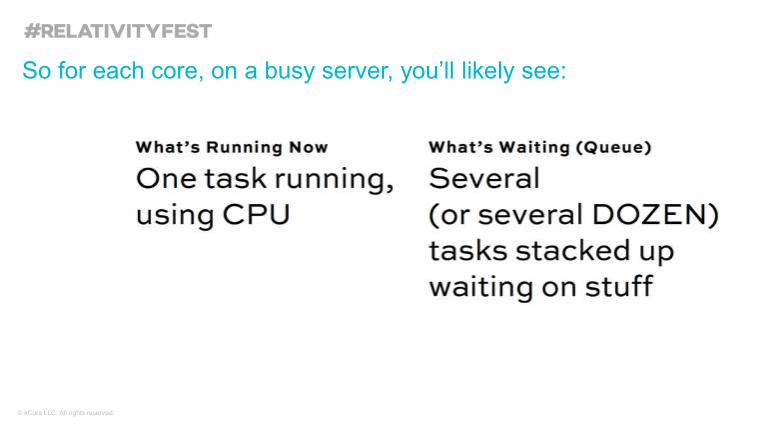
So for each core, on a busy server, you’ll likely see:

© kCura LLC. All rights reserved.
If we look like this for 1 second, how many seconds of waits?

© kCura LLC. All rights reserved.
Hours of wait time per hour
0
5
10
15
20
25
30
6:00 7:00 8:00 9:00 10:00 11:00
CPU
Locks
Storage

© kCura LLC. All rights reserved.
• Dynamic Management View (DMV) sys.dm_os_wait_stats
• Tracked cumulatively over time
• Trend on an hourly basis and break it out by:
– Weekday vs weekend
– Business hours vs after hours
– Maintenance windows
(backups, DB maintenance)
How hard is your server working?
© kCura LLC. All rights reserved.
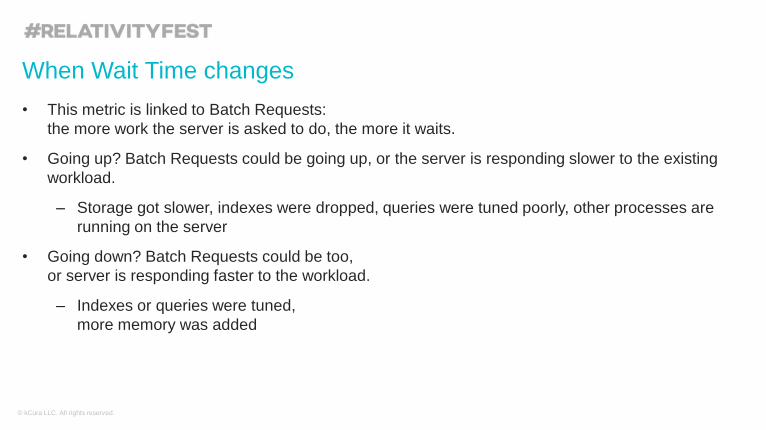
• This metric is linked to Batch Requests:
the more work the server is asked to do, the more it waits.
• Going up? Batch Requests could be going up, or the server is responding slower to the existing
workload.
– Storage got slower, indexes were dropped, queries were tuned poorly, other processes are
running on the server
• Going down? Batch Requests could be too,
or server is responding faster to the workload.
– Indexes or queries were tuned,
more memory was added
When Wait Time changes
© kCura LLC. All rights reserved.
• 0 – Your server isn’t doing anything.
• 1 hour of waits – You’re still not doing much.
• Multiple hours per core – now we’re working!
And we should probably be tuning.
Wait Time per core per hour

© kCura LLC. All rights reserved.
• How much weight are we carrying?
Total data size in GB/TB,
and number of DBs.
• How fast are we going?:
Batch Requests per second.
• How hard are we working to achieve that speed?
Wait time per core per hour.
It’s time to get some answers.

© kCura LLC. All rights reserved.
sp_BlitzFirst
Your SQL Server’s dashboard

© kCura LLC. All rights reserved.
Quick snapshot: sp_BlitzFirst
• Free at BrentOzar.com/askbrent
• Totally free diagnostic tool by an amazingly hot guy.
• Installs in the master database.
• Runs in 5 seconds ideally, but can be more under load.
• By default, shows waits for a 5-second sample now.
• @SinceStartup = 1 shows waits since, uh, startup.


© kCura LLC. All rights reserved.
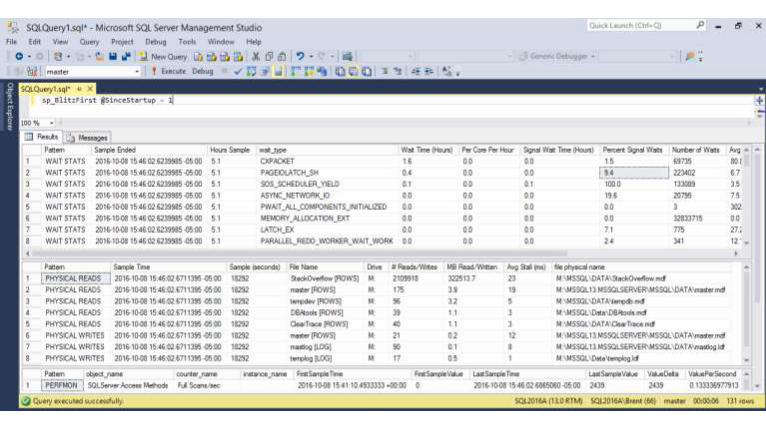
sp_BlitzFirst @SinceStartup = 1
If the top wait is… Then SQL Server is waiting on…
Tuning options
CXPACKET Parallelism Set Cost Threshold and Maxdop, identify expensive queries, tune indexes
PAGEIOLATCH Reading data pages from disk
Add memory, tuneindexes, tune storage
SOS_SCHEDULER_YIELD
CPU cycles Tune indexes, add CPU power
WRITELOG Writing to the transaction log
Tune storage, move logs onto SSD

© kCura LLC. All rights reserved.
• First, set the following server-level configuration settings per kCura’s optimization guide:
– Cost Threshold for Parallelism = 50
– MAXDOP = the number of cores in one CPU, up to 8
• Identify which queries are doing the most reads:
– sp_BlitzCache @SortOrder = 'reads'
– If they’re searches, work with the authors to reduce their impact
– If they’re Relativity queries (or heaven forbid, your own or 3rd party apps), index them
• I don’t mean defragment your indexes: that won’t help here. I mean design new indexes.
CXPACKET: queries are going parallel

© kCura LLC. All rights reserved.
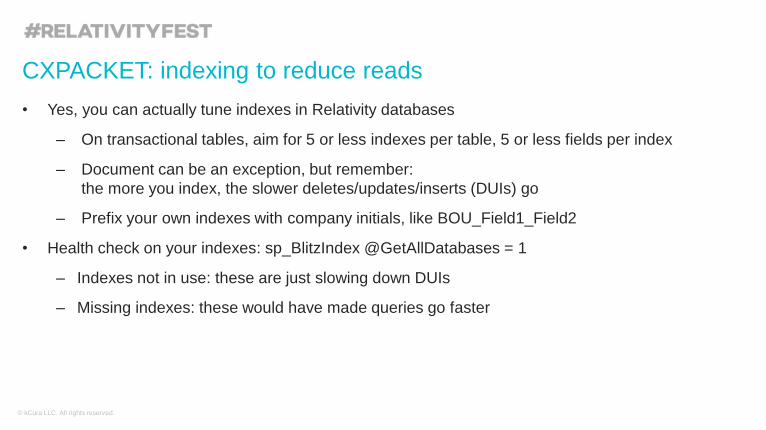
• Yes, you can actually tune indexes in Relativity databases
– On transactional tables, aim for 5 or less indexes per table, 5 or less fields per index
– Document can be an exception, but remember:
the more you index, the slower deletes/updates/inserts (DUIs) go
– Prefix your own indexes with company initials, like BOU_Field1_Field2
• Health check on your indexes: sp_BlitzIndex @GetAllDatabases = 1
– Indexes not in use: these are just slowing down DUIs
– Missing indexes: these would have made queries go faster
CXPACKET: indexing to reduce reads

© kCura LLC. All rights reserved.
• Say you need to search a 50GB Document table, and it’s not in memory
• Say your storage reads 1GB per second
• Your search will take at least 50 seconds
PAGEIOLATCH: reading data pages from a data file

© kCura LLC. All rights reserved.
• Say you need to search a 50GB Document table, and it’s not in memory
• Say your storage reads 1GB per second
• Your search will take at least 50 seconds
• But say you cache that entire Document table in memory:
your query will run as fast as SQL Server can scan memory (which could be 4-5 seconds)
• Tuning storage is hard and time-consuming,
but adding memory is fast and cheap
PAGEIOLATCH: reading data pages from a data file
© kCura LLC. All rights reserved.
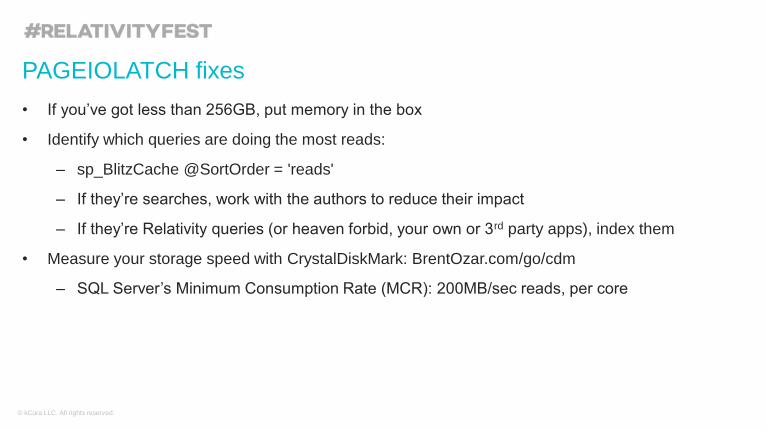
• If you’ve got less than 256GB, put memory in the box
• Identify which queries are doing the most reads:
– sp_BlitzCache @SortOrder = 'reads'
– If they’re searches, work with the authors to reduce their impact
– If they’re Relativity queries (or heaven forbid, your own or 3rd party apps), index them
• Measure your storage speed with CrystalDiskMark: BrentOzar.com/go/cdm
– SQL Server’s Minimum Consumption Rate (MCR): 200MB/sec reads, per core
PAGEIOLATCH fixes

© kCura LLC. All rights reserved.
• First, identify whether you’re maxing out all of your cores, or just 1-2 of them at a time
• If it’s just one, single-threaded queries need more CPU power (but additional cores won’t help)
SOS_SCHEDULER_YIELD: a query needs more CPU time
© kCura LLC. All rights reserved.
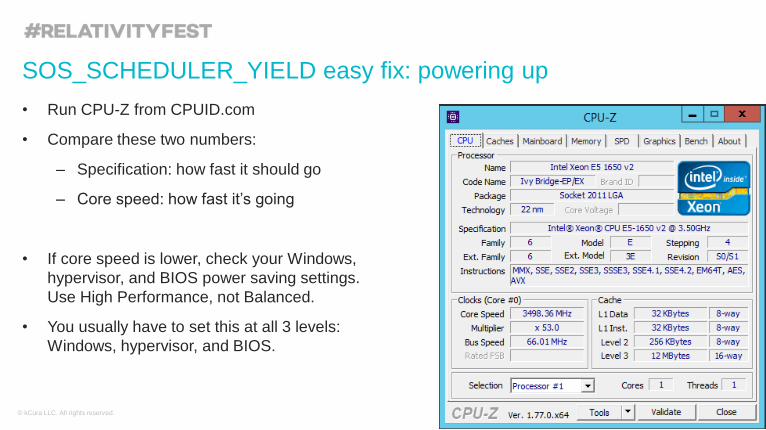
• Run CPU-Z from CPUID.com
• Compare these two numbers:
– Specification: how fast it should go
– Core speed: how fast it’s going
• If core speed is lower, check your Windows,
hypervisor, and BIOS power saving settings.
Use High Performance, not Balanced.
• You usually have to set this at all 3 levels:
Windows, hypervisor, and BIOS.
SOS_SCHEDULER_YIELD easy fix: powering up

© kCura LLC. All rights reserved.
• Identify which queries are burning the most CPU cycles:
– sp_BlitzCache @SortOrder = 'CPU'
– If they’re searches, work with the authors to reduce their impact
– If they’re Relativity queries (or heaven forbid, your own or 3rd party apps), index them
SOS_SCHEDULER_YIELD harder fix: tune queries, indexes

© kCura LLC. All rights reserved.
• Identify your processor name, like Intel Xeon 5160
• Go to Wikipedia (yes, seriously):
https://en.wikipedia.org/wiki/
List_of_Intel_Xeon_microprocessors
• Hit control-F, type in your model number
• Look for faster processors in the same family,
which will usually be drop-in replacements
• Same number of cores = same licensing
• Try to avoid adding cores: your licensing goes up,
so you’re better off splitting workspaces into
more SQL Servers, each with their own RAM
SOS_SCHEDULER_YIELD: throwing hardware at it
© kCura LLC. All rights reserved.
• When you delete/update/insert records, SQL Server:
– Writes to the transaction log before your transaction is committed
– Writes the data file contents later, asynchronously
– This means data file write speeds matter less than you might expect,
but log file speed is super-important to loading documents
• Performance Monitor counter: Physical Disk: Avg Sec/Write (aka write latency)
– Reported in whole seconds – use 3 decimal places for MS.
– Microsoft says >3 milliseconds log writes are slow. Me: 20.
• Related counters: Physical Disk: Reads/sec, Writes/sec show how much SQL is asking for
• The more we ask storage to work, the slower it’ll get.
WRITELOG: writing to the transaction log file during DUIs

© kCura LLC. All rights reserved.
Recap

© kCura LLC. All rights reserved.
Know your top wait type.
• Performance tuners know these 3 metrics:
1. Total database size (and quantity)
2. Batch Requests/Second
3. Wait Time per Core per Hour (or per sec)
• Capture the metrics with sp_BlitzFirst.
• Your top wait stat is where to focus your tuning.

© kCura LLC. All rights reserved.
sp_BlitzFirst @SinceStartup = 1
If the top wait is… Then SQL Server is waiting on…
Tuning options
CXPACKET Parallelism Set Cost Threshold and Maxdop, identify expensive queries, tune indexes
PAGEIOLATCH Reading data pages from disk
Add memory, tuneindexes, tune storage
SOS_SCHEDULER_YIELD
CPU cycles Tune indexes, add CPU power
WRITELOG Writing to the transaction log
Tune storage, move logs onto SSD

Let Us Know What You Think
You’ll receive a short survey via email for
each breakout session and the overall event.
Please take a minute to tell us what you think.


