1/25/2012 1 1 How to Make the Safe Patient Handling Financial Case Ed Hall, MS, CSP, CSPHP Senior Director, Risk Management Loss Control & Education Copyright 2012 by Stanford Hospital and Clinics. All Rights Reserved. Ed Hall is the Senior Director for Risk Management at Stanford University Medical Center. Ed has more than 18 years of diverse loss control and safety management experience, with an emphasis in managing worker safety risks in healthcare and industrial sectors. He has spent more that 10 years in the Safe Patient Handling arena and participated in developing the business case for over 30 hospitals. Ed is recognized for his leadership in implementing innovative loss control risk management programs resulting in dramatic and immediate savings. In 2010 Ed was recognized as Innovator of the Year by Risk and Insurance as well as receiving the Responsible Leader Award. Ed’s expertise focuses on utilizing quantifiable data to identify risk reduction objectives and opportunities which result in significant returns on investment. Ed received a BS in Fire and Safety Engineering, an MS in Loss Prevention and Safety from Eastern Kentucky University and is a Certified Safety Professional as well as a Certified Safe Patient Handling Professional. Copyright 2012 by Stanford Hospital and Clinics. All Rights Reserved. Edward Hall MS, CSP, CSPHP Senior Director, Risk Management Controls and Education
Transcript
1/25/2012
1
1
How to Make the Safe Patient Handling
Financial Case
Ed Hall, MS, CSP, CSPHPSenior Director,
Risk Management Loss Control & Education
Copyright 2012 by Stanford Hospital and Clinics. All Rights Reserved.
Ed Hall is the Senior Director for Risk Management at Stanford University Medical Center. Ed has more than 18 years of diverse loss control and safety management experience, with an emphasis in managing worker safety risks in healthcare and industrial sectors. He has spent more that 10 years in the Safe Patient Handling arena and participated in developing the business case for over 30 hospitals.Ed is recognized for his leadership in implementing innovative loss control risk management programs resulting in dramatic and immediate savings. In 2010 Ed was recognized as Innovator of the Year by Risk and Insurance as well as receiving the Responsible Leader Award.Ed’s expertise focuses on utilizing quantifiable data to identify risk reduction objectives and opportunities which result in significant returns on investment.Ed received a BS in Fire and Safety Engineering, an MS in Loss Prevention and Safety from Eastern Kentucky University and is a Certified Safety Professional as well as a Certified Safe Patient Handling Professional.
Copyright 2012 by Stanford Hospital and Clinics. All Rights Reserved.
Edward Hall MS, CSP, CSPHP
Senior Director, Risk Management Controls and Education
1/25/2012
2
3
How to Make the Safe Patient Handling Financial Case Using Data that Matters
• Alternatives for Safe Patient Handling Programs
• Data Diagnostic Process
• Total Program Costs
• Simple Internal Rate of Return
• Advanced Financial Model
Copyright 2012 by Stanford Hospital and Clinics. All Rights Reserved.
Alternatives Defined
• Risk Financing (Insure the Exposure) – Legal Requirement So Leverage the Investment
• Risk Assumption (Cost of Doing Business)• Risk Avoidance (Contract out the Exposure)• Loss Control (Aggressively Manage Claims)• Partial Loss Prevention (Implement Partial Intervention
Strategies)• Full Loss Prevention
Alternatives When Considering Risk Intervention Options
Copyright 2012 by Stanford Hospital and Clinics. All Rights Reserved. 4
1/25/2012
3
5
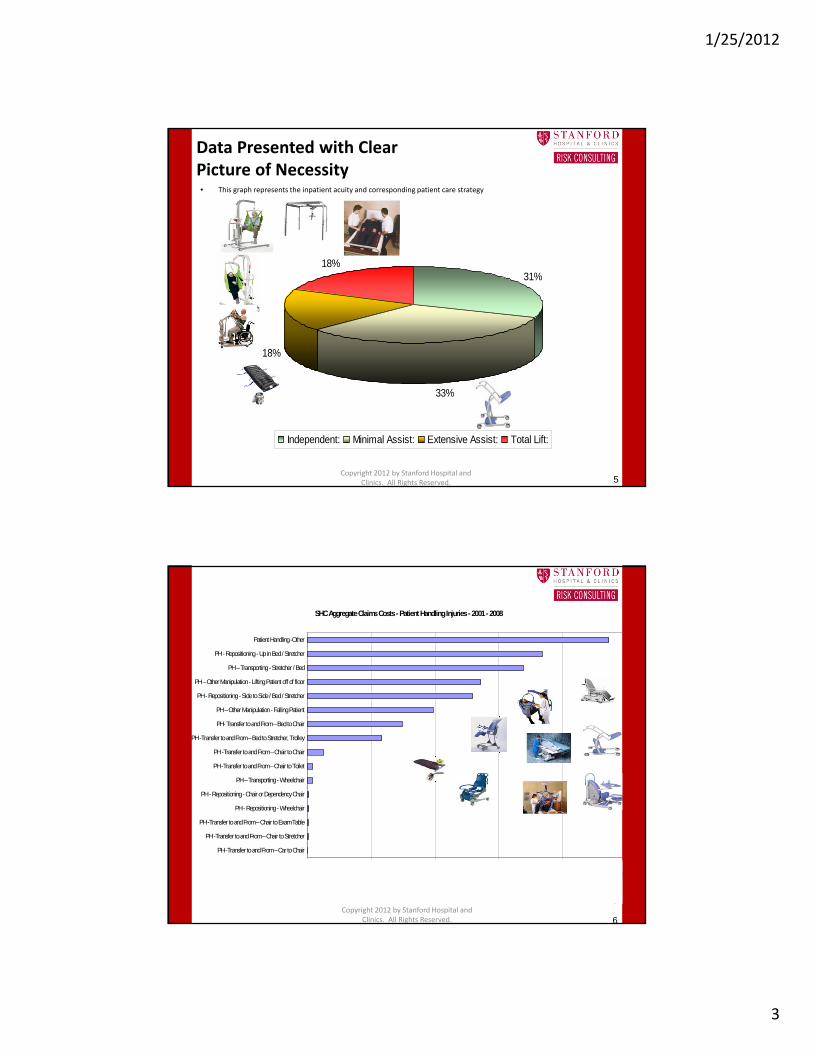
Data Presented with Clear Picture of Necessity• This graph represents the inpatient acuity and corresponding patient care strategy
31%
33%
18%
18%
Independent: Minimal Assist: Extensive Assist: Total Lift:
Copyright 2012 by Stanford Hospital and Clinics. All Rights Reserved.
Copyright 2012 by Stanford Hospital and Clinics. All Rights Reserved.
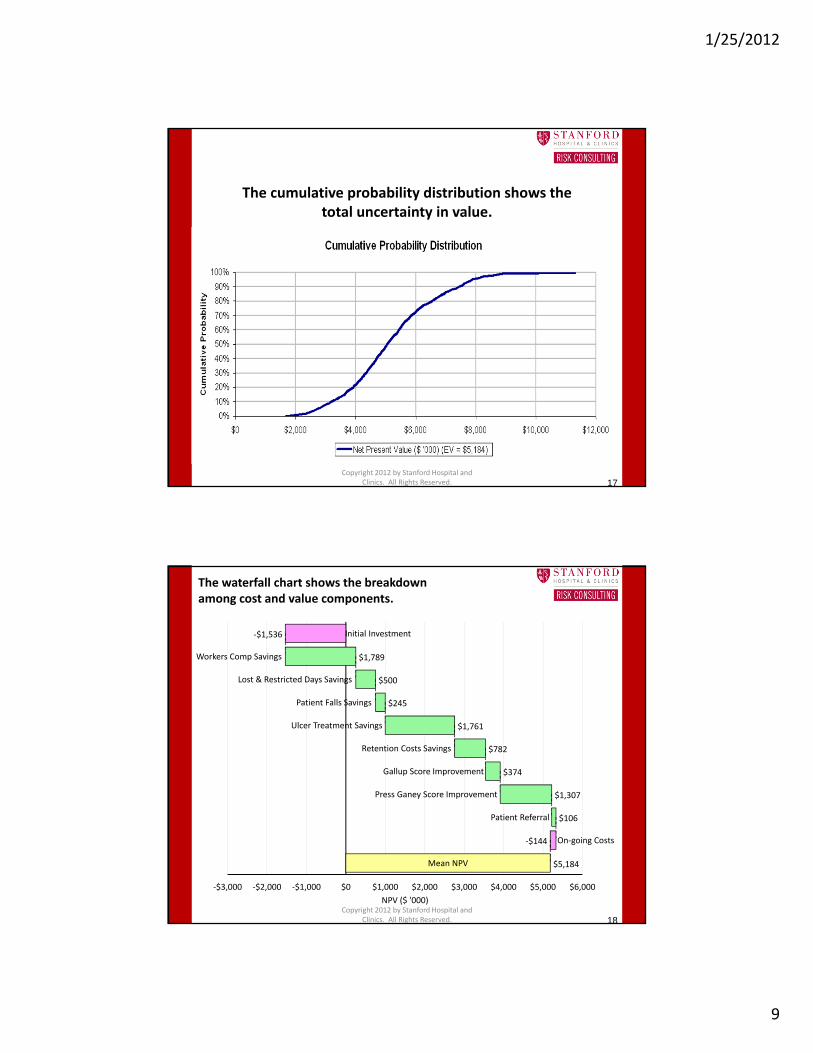
The approach provides a more robust and comprehensive way of understanding and
increasing value.
• It makes use of all available data, but also captures hard‐to‐quantify factors.
• It identifies the most important value drivers and risk factors.
• Done well, it provides a reliable guide to actual realized costs and benefits.
• It provides a defensible, transparent, “investment grade” basis for making difficult decisions under uncertainty and among competing priorities.
• It provides a means of creating new alternatives to increase value and reduce costs.
19
Copyright 2012 by Stanford Hospital and Clinics. All Rights Reserved.
Stanford Hospital Renewal Project
Safe Patient Handling Options for New Construction
20
1/25/2012
11
Copyright 2012 by Stanford Hospital and Clinics. All Rights Reserved. 21
Copyright 2012 by Stanford Hospital and Clinics. All Rights Reserved. 22
1/25/2012
12
23Copyright 2012 by Stanford Hospital and
Clinics. All Rights Reserved.
Copyright 2012 by Stanford Hospital and Clinics. All Rights Reserved.
Alternatives Defined
• Risk Financing (Insure the Exposure) – Legal Requirement ‐ So Leverage the Investment
• Risk Assumption (Cost of Doing Business)• Risk Avoidance (Contract out the Exposure)• Loss Control (Aggressively Manage Claims)• Partial Loss Prevention (Implement Partial Intervention
Strategies)• Full Loss Prevention
Alternatives When Considering Risk Intervention Options
24
1/25/2012
13
25
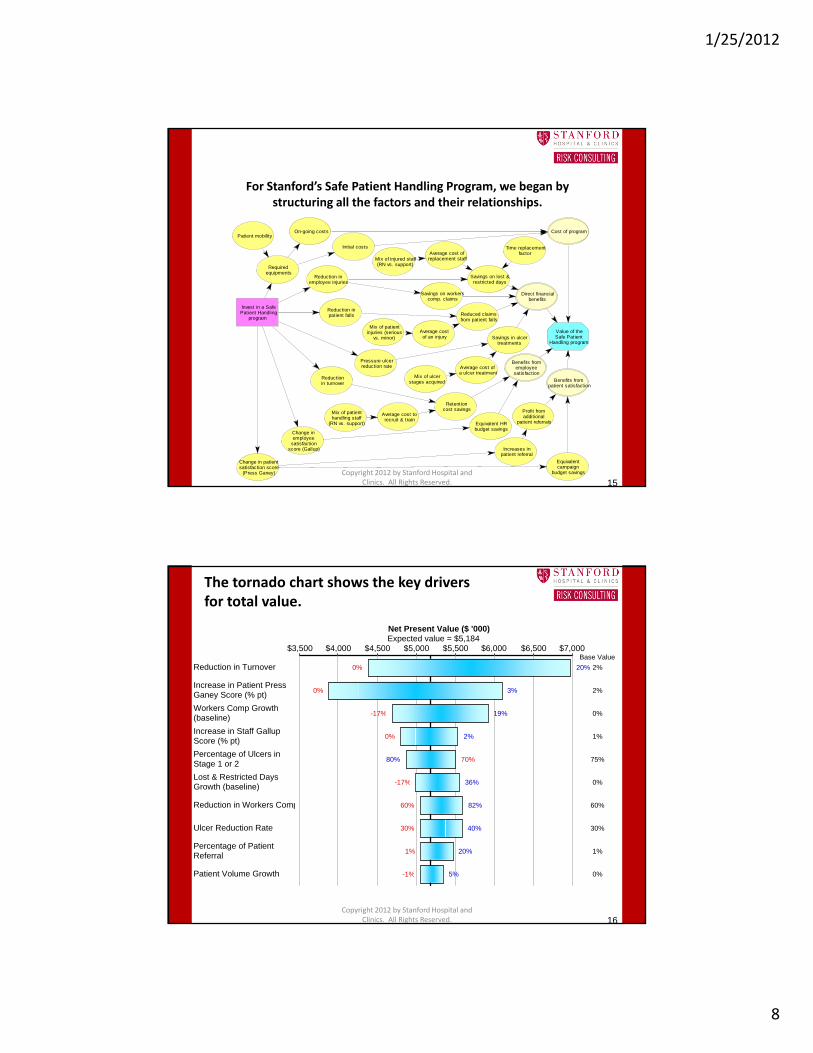
Net Present Value ($ '000)
$3,500 $4,000 $4,500 $5,000 $5,500 $6,000 $6,500 $7,000Base Value
Expected value = $5,184
Reduction in Turnover 0% 20% 2%
Increase in Patient Press Ganey Score (% pt)
0% 3% 2%
‐17% 19% 0%
Increase in Staff Gallup Score (% pt)
0% 2% 1%
Percentage of Ulcers in Stage 1 or 2
80% 70% 75%
Lost & Restricted Days Growth (baseline)
‐17% 36% 0%
Reduction in Workers Comp 60% 82% 60%
Ulcer Reduction Rate 30% 40% 30%
Percentage of Patient Referral
1% 20% 1%
Patient Volume Growth ‐1% 5% 0%
The Tornado Chart Results are Coming In…..
Workers Comp. Baseline
33%
Copyright 2012 by Stanford Hospital and Clinics. All Rights Reserved.
Core Competencies of Staff was a Second Wave Initiative
Required Skills
Financial Acumen‐Demonstrated through budgeting, cost justification and/or vendor negotiation
Team Leadership‐Demonstrated through assembling and leading a cross functional team
Policy and Procedure Deployment‐Demonstrated through the development, modification and implementation of
SPH P&P
Training Deployment‐Demonstrated by development and delivery of training
Clinical Knowledge & Experience‐Demonstrated through clinical job duties
Risk Analysis & Control‐Demonstrated through formal analyses and linking control measures to risk results
Program Promotion‐Demonstrated by promoting the benefits and/or results of the SPH program internally and
externally
Program Audit‐Demonstrated by a formal review and reporting of program performance
Unit Specific Customization‐Demonstrated by adapting procedures to unit specific and patient specific needs.
Copyright 2012 by Stanford Hospital and Clinics. All Rights Reserved. 26
1/25/2012
14
Thank you!Visit
http://src.stanfordhospital.orgfor more information
Copyright 2012 by Stanford Hospital and Clinics. All Rights Reserved. 27